QUARTERLY INVESTMENT REPORT INVESTMENT REPORT DECEMBER 31, 2011 City of Houston, Texas ... the City...
23
QUARTERLY INVESTMENT REPORT DECEMBER 31, 2011 City of Houston, Texas Office of the City Controller Ronald C. Green City Controller Shawnell Holman Deputy City Controller Han Au Investment Manager
-
Upload
hoangthuan -
Category
Documents
-
view
212 -
download
0
Transcript of QUARTERLY INVESTMENT REPORT INVESTMENT REPORT DECEMBER 31, 2011 City of Houston, Texas ... the City...
QUARTERLY INVESTMENT REPORT DECEMBER 31, 2011
City of Houston, Texas
Office of the City Controller
Ronald C. Green
City Controller
Shawnell Holman
Deputy City Controller
Han Au
Investment Manager


Executive Summary Page i
Investment Portfolio Summary Page 1
Investment Portfolio Composition - General Pool Page 3
Annual Portfolio Composition - General Pool Page 4
Investment Portfolio Composition - Tax Exempt Pool Page 5
Investments by Sector and Maturity as of December 31, 2011 Appendix I
Investments by Sector and Maturity as of September 30, 2011 Appendix II
Table of Contents

i
CITY OF HOUSTON
QUARTERLY INVESTMENT REPORT
Executive Summary
For the Quarter Ended December 31, 2011
The accompanying Quarterly Investment Report lists in summary form and in detail the
investment positions of the City of Houston investment pools as of December 31, 2011.
As of that date, the City held total investments with a market value of $2.4 billion. The
majority of these funds, with the exception of about $16 million that must be segregated
per federal mandates, are held in the City’s General Investment Pool. The General
Investment Pool consists of working capital, construction funds, and debt service funds
not subject to yield restriction under IRS arbitrage regulations. All investments are
governed by state law and the City’s Investment Policy, which dictates the following
investment objectives, in order of priority:
1. Safety
2. Liquidity
3. Return on Investments
4. Other Legal Requirements
Approximately 66% of the City’s holdings are currently invested in securities issued by
US government-sponsored enterprises such as the Federal Home Loan Bank, Fannie
Mae, and Freddie Mac. Other investment sectors include a 15% allocation to United
States Treasuries, 7% to municipal notes and bonds, 4% to commercial paper, and 8% to
high grade money market funds
The weighted average maturity of the City’s investments has historically ranged from
about one year up to two years. The weighted average maturity is currently about 1.17
years. From an operating standpoint, 35% of the funds invested are designated to be spent
on capital projects such as roads and bridges, the water and sewer system and the airport
system. Investment maturities are targeted to coincide with planned expenditures. Other
investment maturities are targeted to meet short-term obligations such as payroll and debt
service payments.
Fitch Ratings has assigned its AAA credit rating and V1 volatility rating to the General
Pool. The AAA credit quality rating is the highest rating available from Fitch Ratings and
reflects the extremely strong protection that the Pool's portfolio investments provide
against losses from credit defaults or credit deterioration. The V1 volatility rating
recognizes the Pool's sensitivity to changing market conditions as a result of its low
market risk profile and conservative investment policies.
At December 31, 2011, the general pool was yielding 1.484% based on the amortized
cost of the portfolio.

General Fund 9900Last Quarter Last Year
12/31/2011 9/30/2011 Net Change 12/31/2010 Net Change
Book Value $2,416,166,956 $2,497,127,986 -80,961,030 $2,142,638,979 273,527,976
Market Value $2,446,640,185 $2,532,576,146 -85,935,961 $2,183,805,270 262,834,915
Market/Book Ratio 1.013 1.014 -0.002 1.019 -0.007
Accrued Interest $8,308,566 $15,166,847 -6,858,280 $9,009,527 -700,961
Tax Exempt Fund 9901Last Quarter Last Year
12/31/2011 9/30/2011 Net Change 12/31/2010 Net Change
Book Value $7,800,847 $7,809,872 -9,024 $8,792,037 -991,190
Market Value $7,799,979 $7,810,216 -10,236 $8,800,861 -1,000,881
Market/Book Ratio 1.000 1.000 0.000 1.001 -0.001
Accrued Interest $17,216 $6,572 10,644 $53,377 -36,161
Investment Portfolio Summary
Activity For Quarter Ended
December 31, 2011
For the quarter ending December 31, 2011, the 3-month average yield was 1.47%. The weighted average maturity (WAM) as of December 31 was 425 days.
For the quarter ending December 31, 2011, the 3-month average yield was 0.14%. The WAM was 232 days at December 31.
The General Pool consists of all working capital, construction, and debt service funds which are not subject to yield restriction under IRS arbitrage regulations.
Combining the net cash-flows of all funds allows the City to invest in longer-term, higher-yielding securities without sacrificing the ability to meet short-term cash
needs. The General Pool strategy, as outlined in the City's Investment Policy, combines a variation on the traditional laddered maturity strategy which matches
assets and liabilities, with more active management strategies, such as yield curve analysis and bond swaps.
The Tax Exempt Pool consists of those funds which are subject to yield restriction and arbitrage regulation under the 1986 Tax Reform Act. This pool was
created to do the following: demonstrate compliance with Internal Revenue Code regarding arbitrage, maximize the amount of interest earned and retained by
the City from the investment of funds subject to the regulations, minimize the amount of rebate liability, and minimize the cost of administering the arbitrage
tracking program. The Tax Exempt Pool strategy, as outlined in the City's Investment Policy, is to invest in high quality, short-term municipal bonds and one or
more tax-exempt money market mutual funds in order to meet the liquidity demands of the City.
Fitch Ratings has assigned its AAA credit rating and V1 volatility rating to the General Pool. The AAA credit quality rating is the
highest rating available from Fitch Ratings and reflects the extremely strong protection that the Pool's portfolio investments
provide against losses from credit defaults or credit deterioration. The V1 volatility rating recognizes the Pool's sensitivity to
changing market conditions as a result of its low market risk profile and conservative investment policies.
Page 1

Housing Department Section 108 Fund 9902Last Quarter Last Year
12/31/2011 9/30/2011 Net Change 12/31/2010 Net Change
Book Value $7,998,447 $8,998,361 -999,915 $2,999,500 4,998,947
Market Value $7,998,417 $8,999,223 -1,000,806 $2,999,586 4,998,831
Market/Book Ratio 1.000 1.000 0.000 1.000 0.000
Accrued Interest $0 $0 0 $0 0
The Housing Department Fund was created to comply with the U.S. Department of Housing and Urban Development (HUD), which requires a separate
custodial account for HUD's benefit.
For the quarter ending December 31, 2011, the 3-month average yield was 0.06%. The WAM was 137 days at December 31.
Investment Portfolio Summary
Activity For Quarter Ended
December 31, 2011
Page 2
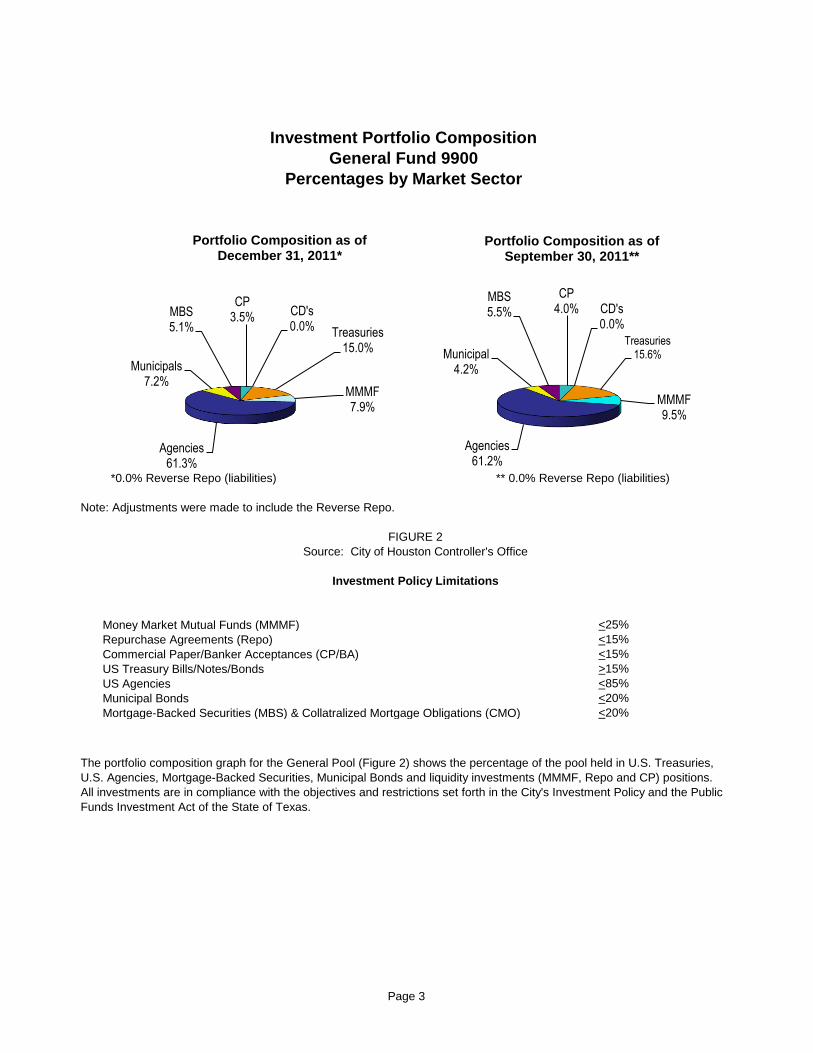
*0.0% Reverse Repo (liabilities) ** 0.0% Reverse Repo (liabilities)
Note: Adjustments were made to include the Reverse Repo.
Money Market Mutual Funds (MMMF) <25%
Repurchase Agreements (Repo) <15%
Commercial Paper/Banker Acceptances (CP/BA) <15%
US Treasury Bills/Notes/Bonds >15%
US Agencies <85%
Municipal Bonds <20%
Mortgage-Backed Securities (MBS) & Collatralized Mortgage Obligations (CMO) <20%
Investment Policy Limitations
FIGURE 2
The portfolio composition graph for the General Pool (Figure 2) shows the percentage of the pool held in U.S. Treasuries,
U.S. Agencies, Mortgage-Backed Securities, Municipal Bonds and liquidity investments (MMMF, Repo and CP) positions.
All investments are in compliance with the objectives and restrictions set forth in the City's Investment Policy and the Public
Funds Investment Act of the State of Texas.
Investment Portfolio Composition
General Fund 9900
Percentages by Market Sector
Source: City of Houston Controller's Office
CP4.0% CD's
0.0%
Treasuries15.6%
MMMF9.5%
Agencies61.2%
Municipal4.2%
MBS5.5%
Portfolio Composition as of September 30, 2011**
CP3.5% CD's
0.0% Treasuries15.0%
MMMF7.9%
Agencies61.3%
Municipals7.2%
MBS5.1%
Portfolio Composition as of December 31, 2011*
Page 3

FIGURE 3
Annual Portfolio Composition
General Fund 9900
January 2011 through December 2011
Source: City of Houston Controller's Office
0%
10%
20%
30%
40%
50%
60%
70%
80%
90%
100%
Mortgage-Backed Securities
Municipals
Money Market Mutual Funds
Commercial Paper
Agencies
Treasuries
Page 4

Investment Portfolio Composition
Tax Exempt Pool
Percentages by Market Sector
Maximum Level
Money Market Mutual Funds (MMMF) 100%
Municipal Notes and Bonds (Including VRDSs) 100%
Investment Policy Limitations
FIGURE 5
The portfolio composition graph for the Tax Exempt Pool (Figure 5) shows the percentage of the pool held in Municipal
Notes/Bonds/VRDS's and Money Market Mutual Funds. All investments are in compliance with the objectives and restrictions
set forth in the City's Investment Policy and the Public Funds Investment Act of the State of Texas.
Source: City of Houston Controller's Office
Munis94%
MMMF6%
Portfolio Composition as of December 31, 2011
Munis58%
MMMF42%
Portfolio Composition as of September 30, 2011
Page 5

Appendix I
Investments by Sector and Maturity as of December 31, 2011

FNCI 6.50 06/01/15 6.500% 518,877.60 6/1/2015 1.920 6/18/2002 2,810.59 518,877.60 5.675 570,178.79
FNCI 6.00 07/01/15 6.000% 74,212.28 7/1/2015 1.040 5/17/2001 371.06 74,212.28 5.959 80,123.34
FGCI 7.00 08/01/15 7.000% 30,014.15 8/1/2015 1.300 8/21/2000 175.08 30,014.15 7.096 32,352.14
FGCI 7.00 10/01/15 7.000% 33,815.64 10/1/2015 1.300 10/19/2000 197.26 33,815.64 7.041 36,007.88
FNCI 7.00 10/01/15 7.000% 57,487.59 10/1/2015 1.360 11/16/2000 335.34 57,487.59 6.885 62,032.57
FGCI 7.00 12/01/15 7.000% 109,026.06 12/1/2015 1.540 2/19/2002 635.99 109,026.06 5.390 117,518.75
FGCI 6.00 01/01/16 6.000% 28,586.93 1/1/2016 1.410 2/15/2001 142.93 28,586.93 6.018 31,055.98
FGCI 6.00 09/01/16 6.000% 158,858.70 9/1/2016 1.640 10/18/2001 794.29 158,858.70 5.461 169,646.06
FGCI 6.00 11/01/16 6.000% 248,231.04 11/1/2016 1.690 12/18/2001 1,241.16 248,231.04 5.733 265,291.79
FN 616072 6.00 11-01 6.000% 232,651.31 11/1/2016 1.690 4/21/2003 1,163.26 232,651.31 4.657 251,618.35
GNJO 6.5 11/15/16 6.500% 223,993.31 11/15/2016 1.620 4/16/2002 1,213.30 223,993.31 5.988 241,442.00
FGCI 6.50 02/01/17 6.500% 232,934.16 2/1/2017 1.810 3/18/2002 1,261.73 232,934.16 5.769 254,563.60
FN15 254684 5.0 02-0 5.000% 2,316,059.60 2/25/2017 1.850 2/19/2003 9,650.25 2,316,059.60 4.551 2,501,557.24
FNCI 6.50 03/01/17 6.500% 171,921.50 3/1/2017 1.860 3/18/2002 931.24 171,921.50 5.720 188,919.30
FNCI 6.50 03/01/17 6.500% 291,750.16 4/1/2017 1.850 3/18/2002 1,580.31 291,750.16 5.711 320,595.36
FGE01280 5.00 12-1-1 5.000% 639,797.55 12/1/2017 1.770 12/17/2002 2,665.82 639,797.55 4.737 683,867.94
FN 702860 5.00 04-01 5.000% 946,417.40 4/1/2018 1.830 4/21/2003 3,943.41 946,417.40 4.441 1,022,217.78
FN 254721 5.00 4-1-1 5.000% 643,704.80 4/21/2018 1.880 4/21/2003 2,682.10 643,704.80 4.366 695,260.35
FNCI 5.00 05-01-18 5.000% 1,392,950.60 5/1/2018 1.890 5/19/2003 5,803.96 1,392,950.60 4.428 1,504,514.67
FNCI 5.00 LLB 05-01- 5.000% 923,512.30 5/1/2018 1.880 5/19/2003 3,847.97 923,512.30 4.094 1,007,001.88
FG E97045 4.5 06-01- 4.500% 581,980.68 6/1/2018 1.880 7/17/2003 2,182.43 581,980.68 3.874 620,617.19
FGE01425 4.5 08-01-1 4.500% 2,929,126.80 8/1/2018 1.950 8/18/2003 10,984.23 2,929,126.80 4.315 3,103,306.71
FN254942 4.00 09-01- 4.000% 2,300,710.50 9/1/2018 2.050 9/18/2003 7,669.04 2,300,710.50 3.920 2,447,317.25
FN255077 5.00 01-01- 5.000% 663,590.90 1/1/2019 2.010 3/17/2005 2,764.96 663,590.90 4.687 716,739.18
FGG18008 4.5 09-01-1 4.500% 1,077,191.90 9/1/2019 2.150 12/21/2004 4,039.47 1,077,010.33 4.478 1,148,031.18
FGG18065 5.00 07-01 5.000% 1,149,189.20 7/1/2020 2.180 7/19/2005 4,788.29 1,149,909.59 4.838 1,238,716.11
FGB19758 5.00 08-01- 5.000% 1,339,467.45 8/1/2020 2.170 8/16/2005 5,581.11 1,341,982.32 4.893 1,443,817.87
FGG18073 5.00 09-01- 5.000% 1,185,871.31 9/1/2020 2.230 10/18/2005 4,941.13 1,184,911.71 4.989 1,278,255.89
FGG18079 5.50 10-01- 5.500% 1,520,354.76 10/1/2020 2.550 11/17/2005 6,968.29 1,524,045.63 5.366 1,650,674.88
FGG11807 5.5 10-01-2 5.500% 1,548,127.14 10/1/2020 2.510 12/15/2005 7,095.58 1,551,032.27 5.388 1,680,827.81
FGG11810 5.5 12-01-2 5.500% 1,462,294.98 12/1/2020 2.440 12/15/2005 6,702.19 1,463,924.07 5.419 1,587,638.43
FGG18096 5.5 1-1-21 5.500% 1,177,164.90 1/1/2021 2.550 2/16/2006 5,395.34 1,180,515.38 5.373 1,278,067.84
FGG18101 5.5 02-01-2 5.500% 1,021,482.60 2/1/2021 2.580 2/16/2006 4,681.80 1,024,749.26 5.369 1,106,487.23
FN865183 5.5 02-01-2 5.500% 1,867,362.87 2/1/2021 2.510 3/16/2006 8,558.75 1,868,962.57 5.403 2,028,594.56
FGG18106 5.5 03-01-2 5.500% 1,501,058.88 3/1/2021 2.570 3/16/2006 6,879.85 1,500,436.51 5.470 1,625,972.36
FNCI 5.5 04-01-21 5.500% 1,660,720.24 4/1/2021 2.560 4/18/2006 7,611.63 1,657,905.27 5.475 1,804,110.00
FGG18115 6.0 05-01-2 6.000% 1,267,174.93 5/1/2021 2.580 5/16/2006 6,335.87 1,275,144.72 5.811 1,380,580.04
FGG18124 6.0 6-1-21 6.000% 986,424.30 6/1/2021 2.640 6/19/2006 4,932.12 990,812.23 5.845 1,074,703.79
FGG18124 6.0 6-1-21 6.000% 1,321,550.58 6/1/2021 2.640 7/18/2006 6,607.75 1,321,550.58 5.963 1,439,822.04
FGCI03360 5.50 09-01 5.500% 1,222,014.72 9/1/2021 2.600 9/18/2006 5,600.90 1,216,348.24 5.556 1,323,707.01
FGG12369 5.5 10-01-2 5.500% 1,616,717.61 10/1/2021 2.640 10/17/2006 7,409.96 1,615,813.55 5.472 1,751,255.91
FNCI 5.5 11-01-21 5.500% 1,081,108.72 11/1/2021 2.670 11/16/2006 4,955.08 1,077,785.27 5.487 1,174,453.71
FGG18157 5.5 12-01-2 5.500% 1,481,583.36 12/1/2021 2.700 1/17/2007 6,790.59 1,480,749.31 5.472 1,604,876.15
FGG18169 5.5 02-01-2 5.500% 1,636,228.48 2/1/2022 2.720 2/15/2007 7,499.38 1,628,290.20 5.559 1,771,367.72
FGG12514 5.5 02-01-2 5.500% 1,718,819.44 2/1/2022 2.690 3/19/2007 7,877.92 1,718,819.44 5.462 1,861,854.25
FN938603 5.5 05-01-2 5.500% 860,149.76 5/1/2022 2.360 5/17/2007 3,942.35 860,149.76 5.434 933,965.15
FGJ05074 5.5 06-01-2 5.500% 937,606.64 6/1/2022 2.260 6/18/2007 4,297.36 937,606.64 5.462 1,015,045.36
FGG12692 5.5 06-1-22 5.500% 2,268,103.27 6/1/2022 2.340 6/18/2007 10,395.47 2,268,513.83 5.457 2,455,430.22
FGJ05038 5.5 07-01-2 5.500% 2,278,750.00 7/1/2022 2.370 6/18/2007 10,444.27 2,267,835.20 5.561 2,466,956.31
FGG12718 5.5 07-01-2 5.500% 1,845,454.40 7/1/2022 2.340 7/17/2007 8,458.33 1,828,337.07 5.632 1,997,874.05
FGJ05317 5.5 08-01-2 5.500% 2,322,534.20 8/1/2022 2.410 9/18/2007 10,644.95 2,309,201.10 5.569 2,514,356.72
FGJ05440 6.0 08-01-2 6.000% 1,239,016.73 8/1/2022 2.600 9/18/2007 6,195.08 1,244,618.41 5.872 1,349,127.46
FGCI 6.0 9-1-22 5.500% 2,498,100.41 9/1/2022 2.720 11/18/2008 11,449.63 2,515,529.05 5.352 2,705,984.61
FGJ05665 5.5 10-01-2 5.500% 1,924,632.08 10/1/2022 2.410 10/16/2007 8,821.23 1,915,810.33 5.534 2,083,591.12
FGGI12956 5.0 01-01- 5.000% 1,932,672.80 1/1/2023 2.240 12/17/2007 8,052.80 1,930,630.33 4.982 2,080,216.73
FGCI 4.5 02-01-23 4.500% 2,399,854.00 2/1/2023 2.180 2/19/2008 8,999.45 2,398,172.82 4.481 2,546,426.09
FGG18239 5.0 03-01-2 5.000% 2,428,883.20 3/1/2023 2.340 3/18/2008 10,120.35 2,431,434.75 4.949 2,605,200.47
FGJ07494 4.5 04-01-2 4.500% 2,723,101.04 4/1/2023 2.310 4/17/2008 10,211.63 2,703,250.91 4.610 2,889,415.58
FGG13072 5.0 04-01-2 5.000% 1,734,471.00 4/1/2023 2.330 3/18/2008 7,226.96 1,722,365.88 5.077 1,863,360.68
FGCI 4.5 04-01-23 4.500% 1,546,610.04 4/1/2023 2.220 12/16/2008 5,799.79 1,572,977.00 4.254 1,641,069.87
FNCI 5.0 5-1-23 5.000% 2,437,062.88 5/1/2023 2.340 5/19/2008 10,154.43 2,425,749.33 5.021 2,623,112.92
FGG18259 5.5 06-01-2 5.500% 2,707,256.08 6/1/2023 2.410 6/17/2008 12,408.26 2,724,687.91 5.347 2,930,853.53
FGG18259 5.5 06-01-2 5.500% 2,722,240.37 6/1/2023 2.410 7/17/2008 12,476.94 2,713,648.21 5.518 2,947,075.43
FGG13247 5.0 07-01-2 5.000% 2,581,988.77 7/1/2023 2.310 9/16/2008 10,758.29 2,603,476.16 4.842 2,769,420.28
FGJ08476 5.5 08-01-2 5.500% 3,202,570.40 8/1/2023 2.520 8/18/2008 14,678.45 3,183,087.07 5.564 3,467,076.81
FGG18300 4.0 1-1-24 4.000% 3,386,492.08 1/1/2024 2.310 1/20/2009 11,288.31 3,448,009.66 3.691 3,559,427.29
FGJ09194 4.0 1-1-24 4.000% 3,396,580.96 1/1/2024 2.150 2/20/2009 11,321.94 3,434,288.67 3.800 3,570,031.37
FGCI 4.0 03-01-24 4.000% 3,938,614.56 3/1/2024 2.280 3/17/2009 13,128.72 3,973,047.93 3.826 4,134,821.29
FGCI 4.0 05-01-24 4.000% 4,682,354.08 5/1/2024 2.350 4/16/2009 15,607.85 4,743,489.87 3.744 4,915,611.07
FGCI 4.0 05-01-24 4.000% 4,131,057.20 5/1/2024 2.300 5/18/2009 13,770.19 4,176,180.82 3.790 4,336,850.69
FGCI 4.0 06-01-24 4.000% 4,638,620.48 6/1/2024 2.320 6/16/2009 15,462.07 4,618,038.75 4.051 4,869,698.83

FGJ10251 4.0 7-1-24 4.000% 5,529,994.73 7/1/2024 2.300 7/16/2009 18,433.32 5,570,991.52 3.842 5,805,477.95
FGJ12604 4.0 07-01-2 4.000% 5,369,476.81 7/1/2025 2.340 12/20/2010 17,898.26 5,483,384.45 3.619 5,636,963.63
Subtotla Mortgage Backed Securities 4.902% 122,772,813.49 6/17/2014 2.463 501,533.50 123,121,868.03 4.763 131,436,927.58
Agency Notes
TVA 6.79 05-23-12 6.790% 9,309,000.00 5/23/2012 0.394 2/19/2008 66,719.67 9,416,951.74 3.517 9,549,190.82
FHLB 4.875 06-08-12 4.875% 5,000,000.00 6/8/2012 0.438 2/19/2008 15,572.92 5,026,454.67 3.529 5,093,345.00
FHLB 1.375 6-8-12 1.375% 25,000,000.00 6/8/2012 0.438 6/15/2011 21,961.81 25,122,228.41 0.254 25,133,125.00
FHLB 1.375 6-8-12 1.375% 25,000,000.00 6/8/2012 0.438 9/15/2011 21,961.81 25,131,445.70 0.173 25,133,125.00
FHLMC 1.75 6-15-12 1.750% 20,000,000.00 6/15/2012 0.457 9/17/2009 15,555.56 20,009,822.75 1.639 20,147,880.00
FHLMC 1.75 6-15-12 1.750% 20,000,000.00 6/15/2012 0.457 10/7/2009 15,555.56 20,030,238.26 1.411 20,147,880.00
FHLMC 1.75 6-15-12 1.750% 15,000,000.00 6/15/2012 0.457 9/12/2011 11,666.67 15,107,009.62 0.188 15,110,910.00
FFCB 2.125 6-18-12 2.125% 25,000,000.00 6/18/2012 0.465 9/14/2009 19,184.03 25,059,427.66 1.600 25,223,000.00
FFCB 2.125 6-18-12 2.125% 25,000,000.00 6/18/2012 0.465 7/12/2011 19,184.03 25,218,092.10 0.241 25,223,000.00
FHLB 1.875 6-20-12 1.875% 20,000,000.00 6/20/2012 0.471 6/12/2009 11,458.33 19,968,687.21 2.221 20,158,880.00
FHLB 0.25 06-21-12 0.250% 10,000,000.00 6/21/2012 0.474 7/12/2011 694.44 10,000,371.08 0.242 10,004,060.00
FNMA 1.25 06-22-12 1.250% 10,000,000.00 6/22/2012 0.476 9/12/2011 3,125.00 10,050,558.03 0.188 10,052,660.00
FHLB 0.22 9-12-12 0.220% 25,000,000.00 9/12/2012 0.697 9/13/2011 16,652.78 24,997,966.03 0.232 24,995,775.00
FHLB 2.0 09-14-12 2.000% 25,000,000.00 9/14/2012 0.698 9/15/2009 148,611.11 25,031,835.84 1.813 25,305,400.00
FHLB 2.0 09-14-12 2.000% 20,000,000.00 9/14/2012 0.698 9/16/2009 118,888.89 20,030,284.08 1.778 20,244,320.00
FHLB 4.625 10-10-12 4.625% 20,000,000.00 10/10/2012 0.764 8/28/2009 208,125.00 20,402,400.86 1.941 20,681,620.00
FFCB 4.5 10-17-12 4.500% 19,502,000.00 10/17/2012 0.784 6/5/2009 180,393.50 19,840,660.12 2.222 20,154,731.94
FFCB 0.4 11-2-12 0.400% 25,000,000.00 11/2/2012 0.835 12/29/2011 16,388.89 25,049,427.99 0.163 25,030,850.00
FHLB 0.21 11-14-12 0.210% 25,000,000.00 11/14/2012 0.869 12/22/2011 6,854.17 25,005,130.26 0.186 24,990,275.00
FHLB 0.2 11-23-12 0.200% 25,000,000.00 11/23/2012 0.894 12/20/2011 5,277.78 25,004,886.14 0.178 24,987,100.00
FHLB 4.875 12-14-12 4.875% 15,000,000.00 12/14/2012 0.941 2/12/2008 34,531.25 15,169,576.57 3.548 15,643,470.00
FHLB 4.875 12-14-12 4.875% 20,000,000.00 12/14/2012 0.941 2/12/2008 46,041.67 20,226,102.07 3.548 20,857,960.00
FHLB 4.875 12-14-12 4.875% 14,000,000.00 12/14/2012 0.941 2/13/2008 32,229.17 14,164,210.26 3.500 14,600,572.00
FHLB 1.75 12-14-12 1.750% 30,000,000.00 12/14/2012 0.948 12/11/2009 24,791.67 30,040,012.75 1.606 30,406,830.00
FHLMC 4.125 12-21-12 4.125% 20,000,000.00 12/21/2012 0.962 8/4/2009 22,916.67 20,389,112.19 2.046 20,746,340.00
FHLMC 4.125 12-21-12 4.125% 30,000,000.00 12/21/2012 0.962 8/24/2009 34,375.00 30,588,762.29 2.029 31,119,510.00
FHLMC 0.75 12-28-12 0.750% 25,000,000.00 12/28/2012 0.990 2/17/2011 1,562.50 24,978,046.52 0.839 25,128,075.00
FHLMC 0.75 12-28-12 0.750% 25,000,000.00 12/28/2012 0.990 6/16/2011 1,562.50 25,089,617.63 0.387 25,128,075.00
FFCB 3.4 02-07-13 3.400% 25,000,000.00 2/7/2013 1.075 2/14/2008 340,000.00 24,952,979.51 3.591 25,849,650.00
FFCB 3.4 02-07-13 3.400% 20,000,000.00 2/7/2013 1.075 2/20/2008 272,000.00 19,920,504.32 3.806 20,679,720.00
FNMA 4.75 02-21-13 4.750% 15,000,000.00 2/21/2013 1.105 6/3/2008 257,291.67 15,107,524.33 4.053 15,754,695.00
FNMA 4.75 02-21-13 4.750% 10,000,000.00 2/21/2013 1.105 6/5/2008 171,527.78 10,066,769.90 4.100 10,503,130.00
FHLB 3.875 03-08-13 3.875% 20,000,000.00 3/8/2013 1.158 3/12/2008 243,263.89 20,053,759.11 3.624 20,840,960.00
FHLB 3.875 03-08-13 3.875% 20,000,000.00 3/8/2013 1.158 3/24/2008 243,263.89 20,084,902.11 3.481 20,840,960.00
FFCB 1.875 04-15-13 1.875% 10,000,000.00 4/15/2013 1.275 7/21/2010 39,583.33 10,110,890.10 1.000 10,199,390.00
FFCB 4.0 05-21-13 4.000% 10,000,000.00 5/21/2013 1.360 6/3/2008 44,444.44 9,987,900.85 4.097 10,505,720.00
FHLB 5.13 05-24-13 5.130% 30,000,000.00 5/24/2013 1.360 6/4/2008 158,175.00 30,427,557.57 3.994 31,992,510.00
FHLMC 4.0 06-12-13 4.000% 25,000,000.00 6/12/2013 1.418 5/12/2009 52,777.78 25,565,346.80 2.351 26,308,675.00
FHLMC 4.0 06-12-13 4.000% 20,000,000.00 6/12/2013 1.418 6/16/2009 42,222.22 20,373,241.84 2.633 21,046,940.00
FHLMC 4.0 06-12-13 4.000% 20,000,000.00 6/12/2013 1.418 6/23/2009 42,222.22 20,349,962.96 2.716 21,046,940.00
FHLB 5.375 06-14-13 5.375% 20,000,000.00 6/14/2013 1.415 9/15/2009 50,763.89 20,892,770.32 2.160 21,448,820.00
FHLB 5.375 06-14-13 5.375% 8,320,000.00 6/14/2013 1.415 10/6/2009 21,117.78 8,714,824.11 1.972 8,922,709.12
FHLB 1.625 6-14-13 1.625% 25,000,000.00 6/14/2013 1.441 6/23/2011 19,184.03 25,405,420.71 0.502 25,458,925.00
FHLB 3.0 06-24-13 3.000% 18,000,000.00 6/24/2013 1.459 10/6/2009 10,500.00 18,265,312.62 1.962 18,699,210.00
FNMA 1.5 06-26-13 1.500% 25,000,000.00 6/26/2013 1.475 2/9/2011 5,208.33 25,137,313.93 1.125 25,439,900.00
FNMA 1.125 10-8-13 1.125% 15,000,000.00 10/8/2013 1.753 10/27/2010 38,906.25 15,000,000.00 1.125 15,194,970.00
FNMA 1.0 10-15-13 1.000% 20,000,000.00 10/15/2013 1.774 10/15/2010 42,222.22 20,000,000.00 0.936 20,145,700.00
FNMA 1.05 10-22-13 1.050% 20,000,000.00 10/22/2013 1.793 10/22/2010 40,250.00 20,000,000.00 0.997 20,210,680.00
FHLB 4.875 12-13-13 4.875% 20,000,000.00 12/13/2013 1.881 6/19/2009 48,750.00 20,582,018.79 3.259 21,702,440.00
FHLB 3.125 12-13-13 3.125% 25,000,000.00 12/13/2013 1.905 12/21/2010 39,062.50 25,919,920.76 1.200 26,197,600.00
FHLB 3.125 12-13-13 3.125% 30,000,000.00 12/13/2013 1.905 2/10/2011 46,875.00 30,931,094.14 1.496 31,437,120.00
FHLB 3.125 12-13-13 3.125% 25,000,000.00 12/13/2013 1.905 2/15/2011 39,062.50 25,758,426.09 1.532 26,197,600.00
FNMA 0.75 12-18-13 0.750% 25,000,000.00 12/18/2013 1.953 9/28/2011 6,770.83 25,142,583.12 0.458 25,095,450.00
FNMA 1.35 02-24-14 1.350% 5,000,000.00 2/24/2014 2.114 12/2/2010 23,812.50 5,000,000.00 1.350 5,093,620.00
FAMCA 1.125 06-02-14 1.125% 11,000,000.00 6/2/2014 2.392 6/10/2011 9,968.75 11,023,505.64 1.035 11,117,799.00
FAMCA 3.15 06-05-14 3.150% 13,355,000.00 6/5/2014 2.354 6/10/2011 30,382.63 14,040,020.06 1.000 14,119,787.43
FNMA 1.125 7-11-14 1 1.125% 25,000,000.00 7/11/2014 7/11/2012 0.524 9/30/2011 132,812.50 25,099,885.96 0.367 0.910 25,074,350.00
FHLMC 1.1 8-8-14 1xc 1.100% 25,000,000.00 8/8/2014 8/8/2012 0.598 9/14/2011 109,236.11 25,104,454.40 0.407 0.882 25,064,200.00
FFCB 1.625 11-19-14 1.625% 25,000,000.00 11/19/2014 2.824 6/8/2011 47,395.83 25,396,713.87 1.063 25,791,300.00
FHLB 2.75 12-12-14 2.750% 12,000,000.00 12/12/2014 2.849 2/10/2011 17,416.67 12,243,904.78 2.030 12,725,016.00
FHLB 2.75 12-12-14 2.750% 18,000,000.00 12/12/2014 2.849 2/10/2011 26,125.00 18,366,964.12 2.028 19,087,524.00
FHLMC 1.6 8-10-15 1x 1.600% 25,000,000.00 8/10/2015 8/10/2012 0.603 11/3/2011 156,666.66 25,173,201.96 0.462 1.361 25,167,975.00
FNMA 1 6-22-16 Step- 1.000% 10,000,000.00 6/22/2016 6/22/2012 0.474 6/22/2011 2,500.00 9,988,114.76 1.252 1.051 10,023,670.00
FHLMC 2 6-29-16 1x c 2.000% 10,000,000.00 6/29/2016 6/29/2012 0.493 11/23/2011 1,111.11 10,079,094.52 0.401 1.782 10,059,640.00
FNMA 2.25 7-26-16 1x 2.250% 15,000,000.00 7/26/2016 7/26/2012 0.561 11/29/2011 145,312.50 15,156,650.00 0.415 1.978 15,108,300.00
FHLMC 1.0 9-14-16 st 1.000% 25,000,000.00 9/14/2016 3/14/2012 0.697 9/14/2011 74,305.56 25,000,000.00 1.000 1.000 25,015,250.00

FNMA 2 09-15-16 1xca 2.000% 25,000,000.00 9/15/2016 3/15/2012 0.205 11/8/2011 147,222.22 25,082,470.70 0.401 1.878 25,073,525.00
FHLMC 1 9-30-16 step 1.000% 20,000,000.00 9/30/2016 3/30/2012 0.744 9/30/2011 50,555.56 20,000,000.00 1.000 1.000 20,010,060.00
FNMA 1.0 11-10-16 st 1.000% 10,000,000.00 11/10/2016 5/10/2012 0.852 11/10/2011 14,166.67 10,000,000.00 1.000 1.000 10,011,790.00
FNMA 1.0 11-14-16 st 1.000% 5,000,000.00 11/14/2016 11/14/2012 0.864 11/14/2011 6,527.78 5,000,000.00 1.000 1.000 5,014,735.00
FNMA 1 12-5-16 step- 1.000% 20,000,000.00 12/5/2016 12/5/2012 0.921 12/5/2011 14,444.44 19,981,420.77 1.101 1.021 20,008,440.00
FNMA 1 12-7-16 stepu 1.000% 10,000,000.00 12/7/2016 12/7/2012 0.926 12/7/2011 6,666.67 10,000,000.00 1.000 1.000 9,997,070.00
FNMA 1 12-7-16 stepu 1.000% 20,000,000.00 12/7/2016 12/7/2012 0.926 12/7/2011 13,333.33 20,000,000.00 1.000 1.000 19,994,140.00
FNMA 1.0 12-20-16 st 1.000% 20,000,000.00 12/20/2016 6/20/2012 0.962 12/20/2011 6,111.11 19,995,300.55 1.050 1.005 20,009,760.00
FNMA 1 12-28-16 step 1.000% 20,000,000.00 12/28/2016 12/28/2012 0.984 12/28/2011 1,666.67 20,000,000.00 1.000 1.000 20,008,860.00
Subtotal Agency Notes 2.351% 1,443,486,000.00 2/5/2013 1.109 4,475,028.20 1,456,632,044.91 1.621 1,476,295,185.31
Municipal Bonds
CHI 5.25 01-01-12 5.250% 4,000,000.00 1/1/2012 0.003 1/25/2008 105,000.00 4,000,156.22 3.647 4,000,000.00
PEOSCD 0 01-01-12 0.000% 1,295,000.00 1/1/2012 0.003 5/4/2010 0.00 1,294,838.63 4.794 1,295,000.00
PEOSCD 0 01-01-12 0.000% 705,000.00 1/1/2012 0.003 5/4/2010 0.00 704,912.15 4.794 705,000.00
MES 5.05 01-15-12 5.050% 1,085,000.00 1/15/2012 0.041 11/10/2008 25,265.43 1,085,529.38 3.775 1,086,421.35
NWK 4.504 04-01-12 4.504% 1,200,000.00 4/1/2012 0.252 4/22/2008 13,512.00 1,200,558.09 4.301 1,210,164.00
POR 5.0 04-01-12 5.000% 2,155,000.00 4/1/2012 0.252 10/12/2011 26,937.50 2,180,628.20 0.250 2,179,157.55
OHS 4.55 05-01-12 4.550% 1,000,000.00 5/1/2012 0.334 8/19/2008 7,583.33 1,000,024.43 4.544 1,013,380.00
KSSDEV 4.372 05-01-1 4.372% 2,600,000.00 5/1/2012 0.334 10/10/2008 18,945.33 2,603,387.34 3.950 2,627,066.00
PAL 5.735 06-01-12 5.735% 3,515,000.00 6/1/2012 0.419 3/6/2008 16,798.77 3,542,729.84 3.630 3,592,083.95
STNPWR 4.05 07-01-12 4.050% 4,875,000.00 7/1/2012 0.493 2/6/2008 98,718.75 4,876,062.57 4.002 4,953,585.00
WAS 5.6 07-01-12 5.600% 5,000,000.00 7/1/2012 0.489 11/17/2008 140,000.00 5,043,551.32 3.725 5,125,100.00
MONHGR 4.24 08-01-12 4.240% 1,000,000.00 8/1/2012 0.573 1/24/2008 17,666.67 1,000,000.00 4.240 1,018,490.00
SCRGEN 5.556 08-01-1 5.556% 1,000,000.00 8/1/2012 0.570 11/3/2008 23,150.00 998,563.72 5.830 1,024,810.00
NYC 4.5 9-1-12 4.500% 4,400,000.00 9/1/2012 0.656 9/16/2008 66,000.00 4,412,902.62 4.020 4,510,616.00
DUPSCD 4.0 10-01-12 4.000% 1,255,000.00 10/1/2012 0.740 3/31/2008 12,550.00 1,255,000.00 4.000 1,285,082.35
NYC 4.75 10-01-12 4.750% 4,000,000.00 10/1/2012 0.738 2/2/2009 47,500.00 4,040,683.79 3.300 4,119,440.00
CAS 4.15 12-01-12 4.150% 9,220,000.00 12/1/2012 0.907 5/16/2011 31,885.83 9,457,784.09 1.300 9,347,697.00
PAS 4.76 02-15-13 4.760% 885,000.00 2/15/2013 2/15/2012 0.633 3/28/2008 15,914.27 893,636.12 3.799 922,771.80
NWK 4.654 04-01-13 4.654% 1,000,000.00 4/1/2013 1.216 4/22/2008 11,635.00 1,002,820.11 4.401 1,039,430.00
KSSDEV 4.522 05-01-1 4.522% 3,840,000.00 5/1/2013 1.300 10/15/2008 28,940.80 3,831,848.38 4.700 3,999,552.00
WAS 5.625 07-01-13 5.625% 5,000,000.00 7/1/2013 1.423 11/20/2008 140,625.00 5,099,706.57 4.150 5,376,500.00
COL 2.26 7-1-13 2.260% 1,000,000.00 7/1/2013 1.470 9/7/2011 11,300.00 1,026,286.65 0.500 1,026,230.00
TXS 6.0 08-01-13 6.000% 1,010,000.00 8/1/2013 1.499 11/13/2008 25,250.00 1,030,829.40 4.537 1,091,385.80
NYS 1.16 9-1-13 1.160% 3,310,000.00 9/1/2013 1.650 8/23/2011 12,798.67 3,340,640.12 0.600 3,342,140.10
WIL .888 11-1-13 0.888% 560,000.00 11/1/2013 1.821 11/22/2011 538.72 560,000.00 0.888 559,574.40
NYS 1 12-15-13 1.000% 1,000,000.00 12/15/2013 1.941 12/15/2011 444.44 1,005,808.00 0.700 999,810.00
SCSUTL 6.808 01-01-1 6.808% 2,500,000.00 1/1/2014 1.849 3/23/2009 85,100.00 2,626,628.22 4.000 2,792,075.00
SCSUTL 6.808 01-01-1 6.808% 6,400,000.00 1/1/2014 1.856 12/27/2011 217,856.00 7,168,148.51 0.750 7,147,712.00
IRVWTR 2.605 3-15-14 2.605% 10,000,000.00 3/15/2014 2.144 11/1/2011 76,702.78 10,405,226.58 0.750 10,389,600.00
RISGEN 2.862 4-1-14 2.862% 2,330,000.00 4/1/2014 2.182 12/28/2011 16,671.16 2,430,493.50 0.920 2,432,240.40
OHS 1.19 05-01-14 1.190% 1,000,000.00 5/1/2014 2.307 6/16/2011 1,983.33 1,000,000.00 1.190 1,010,340.00
CTS 1.43 05-15-14 1.430% 5,000,000.00 5/15/2014 2.338 5/31/2011 9,136.11 5,000,000.00 1.430 5,058,250.00
RAC 0.95 6-1-14 0.950% 1,000,000.00 6/1/2014 2.401 10/25/2011 1,741.67 1,000,000.00 0.950 1,002,850.00
CHEUTL 5.14 O7-1-24 5.140% 2,000,000.00 7/1/2014 2.323 7/1/2009 51,400.00 2,031,259.16 4.436 2,148,700.00
GTWMFH 4.55 7-1-34 4.550% 10,000,000.00 7/1/2014 2.350 11/3/2011 227,500.00 10,818,235.91 1.217 10,831,100.00
STR 1.905 8-1-14 1.905% 3,000,000.00 8/1/2014 2.514 9/15/2011 23,812.50 3,056,828.75 1.158 3,046,530.00
NJS 2.02 8-15-14 2.020% 5,000,000.00 8/15/2014 2.548 3/28/2011 38,155.56 5,018,734.65 1.870 5,170,450.00
NJS 2.02 8-15-14 2.020% 1,000,000.00 8/15/2014 2.549 8/4/2011 7,631.11 1,023,657.69 1.100 1,034,090.00
NJS 2.02 8-15-14 2.020% 1,000,000.00 8/15/2014 2.550 9/12/2011 7,631.11 1,030,754.19 0.832 1,034,090.00
WIL 1.193 11-1-14 1.193% 940,000.00 11/1/2014 2.791 11/22/2011 1,214.87 940,000.00 1.193 939,812.00
CSPUTL 3.174 11-15-1 3.174% 1,000,000.00 11/15/2014 2.761 11/21/2011 4,055.67 1,057,040.64 1.150 1,049,070.00
METUTL 4.74 1-1-15 4.740% 4,000,000.00 1/1/2015 2.784 12/5/2011 94,800.00 4,409,540.69 1.250 4,417,000.00
MIS 2.65 4-15-15 2.650% 1,000,000.00 4/15/2015 3.160 9/13/2011 5,594.44 1,047,564.14 1.170 1,030,470.00
OHIEDU 1.77 6-1-15 1.770% 1,015,000.00 6/1/2015 3.349 11/15/2011 2,295.59 1,015,000.00 1.770 1,018,004.40
STR 2.305 8-1-15 2.305% 4,550,000.00 8/1/2015 3.428 7/7/2011 43,698.96 4,595,907.13 2.011 4,633,856.50
NYC 1.73 8-1-15 1.730% 1,600,000.00 8/1/2015 3.473 9/15/2011 10,918.22 1,634,312.66 1.117 1,614,976.00
WIL 1.661 11-1-15 1.661% 1,000,000.00 11/1/2015 3.723 11/22/2011 1,799.42 1,000,000.00 1.661 1,014,160.00
MIS 2.552 11-1-15 2.552% 2,000,000.00 11/1/2015 3.666 11/28/2011 8,506.67 2,082,039.02 1.448 2,083,920.00
NMSHSG 4.3 12-01-35 4.300% 2,140,000.00 12/1/2015 3.649 12/5/2011 7,668.33 2,341,300.08 1.800 2,350,212.20
GAS 5.15 03-01-16 5.150% 3,410,000.00 3/1/2016 3/1/2012 2.129 11/25/2008 58,538.33 3,491,643.39 4.470 3,594,310.50
OHS 2.27 05-01-16 2.270% 1,825,000.00 5/1/2016 4.147 6/16/2011 6,904.58 1,825,000.00 2.270 1,875,570.75
RAC 1.65 6-1-16 1.650% 1,640,000.00 6/1/2016 4.297 10/25/2011 4,961.00 1,636,520.01 1.700 1,651,939.20
WCH 1.3 07-01-16 Sin 1.300% 10,000,000.00 7/1/2016 4.384 11/30/2011 11,194.44 10,039,273.17 1.210 10,038,300.00
KERSCD 2.988 8-1-16 2.988% 2,880,000.00 8/1/2016 4.226 10/7/2011 43,505.28 2,991,210.06 2.097 2,976,825.60
MIS 6.25 11-1-16 6.250% 4,400,000.00 11/1/2016 4.272 12/22/2011 45,833.33 5,302,129.81 1.800 5,295,972.00
CHI 0.0 01-01-40 4.000% 6,000,000.00 1/1/2040 1/12/2012 0.033 7/29/2011 20,383.56 6,000,000.00 4.000 6,000,000.00
Subtotal Municipal Bonds 3.785% 165,540,000.00 1/4/2014 1.967 2,036,154.53 170,507,335.70 2.296 172,132,913.85

Money Market Mutual Funds
TexStar960 Cash Rese 0.082% 189,546,165.89 1/1/2012 0.003 7/1/2011 0.00 189,546,165.89 0.082 189,546,165.89
CHASE MONEY MARKET F 0.014% 1,041,261.30 1/1/2012 0.003 2/1/2008 1.47 1,041,261.30 0.014 1,041,261.30
Subtotal Money Market Mutual Funds 0.082% 190,587,427.19 1/1/2012 0.003 1.47 190,587,427.19 0.082 190,587,427.19
TOTAL FUND 9900 2.215% 2,391,026,240.68 2/28/2013 1.156 8,308,566.06 2,416,166,955.54 1.484 2,446,640,184.93
Description Coupon Par Value Maturity Call Mod Purchase Accrued Book Value YTC Current Market Value
Date Date DTW Date Interest Yield
Municipal Bonds
PRI 5.5 05-15-13 5.500% 1,165,000.00 5/15/2013 1.334 12/5/2011 8,187.36 1,247,209.39 0.340 1,247,388.80
FLSEDU 5.25 6-1-13 5.250% 2,000,000.00 6/1/2013 1.380 12/7/2011 8,750.00 2,136,267.42 0.420 2,135,220.00
GAIUTL 0 10-01-36 0.082% 4,000,000.00 10/1/2036 1/18/2012 0.049 9/25/2009 278.99 4,000,000.00 0.082 4,000,000.00
Subtotal Municipal Bonds 2.406% 7,165,000.00 8/31/2012 0.616 17,216.35 7,383,476.81 0.224 7,382,608.80
Money Market Mutual Funds
Fidelity Tax-Free Mo 0.010% 417,370.60 1/23/2012 0.064 6/1/2009 0.00 417,370.60 0.010 417,370.60
Subtotal Money Market Mutual Funds 0.010% 417,370.60 1/23/2012 0.064 0.00 417,370.60 0.010 417,370.60
TOTAL FUND 9901 2.274% 7,582,370.60 8/19/2012 0.620 17,216.35 7,800,847.41 0.212 7,799,979.40
Description Coupon Par Value Maturity Call Mod Purchase Accrued Book Value YTC Current Market Value
Date Date DTW Date Interest Yield
Treasury Bills
B 0.054 3-8-12 0.054% 3,000,000.00 3/8/2012 0.186 9/8/2011 0.00 2,999,696.61 0.054 2,999,892.00
B 0.05 6-28-12 0.050% 5,000,000.00 6/28/2012 0.493 12/28/2011 0.00 4,998,750.00 0.050 4,998,525.00
Subtotal Treasury Bills 0.052% 8,000,000.00 5/16/2012 0.378 0.00 7,998,446.61 0.052 7,998,417.00
TOTAL FUND 9902 0.052% 8,000,000.00 5/16/2012 0.378 0.00 7,998,446.61 0.052 7,998,417.00
GRAND TOTALS 2.208% 2,406,608,611.28 2/26/2013 1.152 8,325,782.41 2,431,966,249.56 1.475 2,462,438,581.33
AS OF DECEMBER 31,2011
INVESTMENT BY SECTOR AND MATURITY - TAX EXEMPT FUND 9901
AS OF DECEMBER 31,2011
INVESTMENT BY SECTOR AND MATURITY - HOUSING DEPARTMENT SECTION 108 FUND 9902

Description Coupon Par Value Maturity Call Mod Purchase Accrued Book Value YTC Current Market Value
Date Date DTW Date Interest Yield
Treasury Notes
HUD 3.82 08-01-12 3.820% 25,000,000.00 8/1/2012 0.574 6/12/2008 397,916.67 25,000,000.00 3.820 25,517,775.00
HUD 0.86 08-1-12 0.860% 4,000,000.00 8/1/2012 0.581 7/21/2010 14,333.33 4,000,000.00 0.860 4,014,524.00
T 1.375 11-15-12 1.375% 25,000,000.00 11/15/2012 0.869 6/9/2011 44,385.30 25,235,714.30 0.292 25,266,600.00
T 0.625 12-31-12 0.625% 25,000,000.00 12/31/2012 0.998 5/24/2011 429.26 25,053,582.82 0.409 25,117,200.00
T 0.625 12-31-12 0.625% 25,000,000.00 12/31/2012 0.998 6/6/2011 429.26 25,070,363.56 0.342 25,117,200.00
T 1.375 05-15-13 1.375% 25,000,000.00 5/15/2013 1.362 9/27/2011 44,385.30 25,381,719.59 0.260 25,396,475.00
T 3.625 5-15-13 3.625% 25,000,000.00 5/15/2013 1.346 9/29/2011 117,015.80 26,148,190.90 0.270 26,160,150.00
T 1.375 05-15-13 1.375% 25,000,000.00 5/15/2013 1.362 11/16/2011 44,385.30 25,399,650.16 0.209 25,396,475.00
T 3.5 5-31-13 3.500% 25,000,000.00 5/31/2013 1.392 10/25/2011 76,502.73 26,147,225.15 0.248 26,152,350.00
T 1.125 6-15-13 1.125% 25,000,000.00 6/15/2013 1.447 6/14/2011 13,063.52 25,248,409.76 0.439 25,329,100.00
T 1.0 7-15-13 1.000% 25,000,000.00 7/15/2013 1.524 11/14/2011 115,489.13 25,302,801.72 0.212 25,297,850.00
HUD 1.34 08-01-13 1.340% 5,000,000.00 8/1/2013 1.563 7/21/2010 27,916.67 5,000,000.00 1.340 5,073,530.00
HUD 0.43 8-1-13 0.430% 8,000,000.00 8/1/2013 1.579 11/17/2011 4,204.44 8,000,000.00 0.430 8,003,272.00
T 3.125 8-31-13 3.125% 25,000,000.00 8/31/2013 1.622 12/13/2011 263,993.82 26,205,578.09 0.222 26,191,400.00
T 0.75 9-15-13 0.750% 30,000,000.00 9/15/2013 1.694 8/31/2011 66,758.24 30,282,305.62 0.197 30,256,650.00
HUD 0.67 8-1-14 0.670% 5,000,000.00 8/1/2014 2.563 11/17/2011 4,094.44 5,000,000.00 0.670 5,002,050.00
T 2.125 11-30-14 2.125% 25,000,000.00 11/30/2014 2.841 8/30/2011 46,448.09 26,240,517.97 0.409 26,257,800.00
HUD 0.93 8-1-15 0.930% 5,000,000.00 8/1/2015 3.529 11/17/2011 5,683.33 5,000,000.00 0.930 5,010,105.00
Subtotal Treasury Notes 1.783% 357,000,000.00 6/15/2013 1.439 1,287,434.63 363,716,059.64 0.571 364,560,506.00
Commercial Paper
SAWSA 0.18 01-12-12 0.180% 35,000,000.00 1/12/2012 0.033 12/14/2011 3,106.85 35,000,000.00 0.180 35,000,000.00
CHICAB 0.3 01-18-12 0.300% 20,000,000.00 1/18/2012 0.049 12/15/2011 0.00 19,997,000.00 0.300 19,996,600.00
HARMTA 0.19 3-1-12 0.190% 30,650,000.00 3/1/2012 0.167 12/7/2011 3,988.70 30,650,000.00 0.190 30,650,000.00
Subtotal Commercial Paper 0.212% 85,650,000.00 1/30/2012 0.085 7,095.55 85,647,000.00 0.212 85,646,600.00
Agency Discount Notes
FAMCDN 0.22 8-15-12 0.220% 25,000,000.00 8/15/2012 0.624 8/24/2011 0.00 24,965,220.07 0.220 24,990,625.00
Subtotal Agency Discount Notes 0.220% 25,000,000.00 8/15/2012 0.624 0.00 24,965,220.07 0.220 24,990,625.00
Certificates of Deposit
Banco Popular de PR 0.450% 241,000.00 9/13/2012 0.704 9/15/2011 320.89 241,000.00 0.450 241,000.00
Capital Bank CDARS 0.450% 241,000.00 9/13/2012 0.704 9/15/2011 320.89 241,000.00 0.450 241,000.00
Iberia Bank CDARS 0.450% 26,000.00 9/13/2012 0.704 9/15/2011 34.62 26,000.00 0.450 26,000.00
Huntington National 0.450% 241,000.00 9/13/2012 0.704 9/15/2011 320.89 241,000.00 0.450 241,000.00
The Park National Ba 0.450% 241,000.00 9/13/2012 0.704 9/15/2011 320.89 241,000.00 0.450 241,000.00
Subtotal Certificates of Deposit 0.450% 990,000.00 9/13/2012 0.704 1,318.18 990,000.00 0.450 990,000.00
Mortgage Backed Securities
FNCI 7.00 03/01/12 7.000% 279.06 3/1/2012 0.140 6/30/1999 1.63 279.06 6.681 280.59
FGCI 7.00 4/01/12 7.000% 3,073.32 4/1/2012 0.210 6/30/1999 17.93 3,073.32 6.789 3,109.35
FNCI 7.00 04/01/12 7.000% 889.40 4/1/2012 0.170 6/30/1999 5.19 889.40 6.761 893.42
FNCI 7.00 04/01/12 7.000% 349.74 4/1/2012 0.170 10/19/1999 2.04 349.74 6.792 351.30
FNCI 7.00 05/01/12 7.000% 2,283.24 5/1/2012 0.210 6/30/1999 13.32 2,283.24 6.693 2,293.58
FNCI 6.50 07/01/12 6.500% 3,551.36 7/1/2012 0.270 6/30/1999 19.24 3,551.36 6.284 3,598.67
FGCI 7.00 07/01/12 7.000% 1,794.54 7/1/2012 0.240 6/30/1999 10.47 1,794.54 6.753 1,827.95
FGCI 7.00 07/01/12 7.000% 5,076.10 7/1/2012 0.240 8/21/2000 29.61 5,076.10 6.930 5,170.62
FGCI 7.00 10/01/12 7.000% 9,387.47 10/1/2012 0.400 9/19/2000 54.76 9,387.47 6.924 9,604.16
FGCI 6.50 01/01/13 6.500% 6,374.79 1/1/2013 0.510 6/30/1999 34.53 6,374.79 6.272 6,570.89
FNCI 6.50 01/01/13 6.500% 7,636.77 1/1/2013 0.490 6/30/1999 41.37 7,636.77 6.301 7,832.90
GNJO 6.50 04/15/13 6.500% 23,079.31 4/15/2013 0.540 8/30/2000 125.01 23,079.31 6.649 23,845.88
FNCI 6.00 08/01/13 6.000% 13,061.52 8/1/2013 0.670 6/30/1999 65.31 13,061.52 5.873 13,506.80
FNCI 6.00 09/01/13 6.000% 16,246.20 9/1/2013 0.700 6/30/1999 81.23 16,246.20 5.881 16,799.60
FNCI 6.00 09/01/13 6.000% 23,015.30 9/1/2013 0.700 6/30/1999 115.08 23,015.30 5.892 23,799.43
GNJO 6.50 09/15/03 6.500% 28,133.79 9/15/2013 0.680 6/30/1999 152.40 28,133.79 6.460 30,272.62
FNCI 6.50 02/01/14 6.500% 8,687.25 2/1/2014 0.600 6/30/1999 47.06 8,687.25 6.422 8,957.12
FNCI 6.50 03/01/14 6.500% 11,474.39 3/1/2014 0.680 6/30/1999 62.16 11,474.39 6.324 11,870.85
GNJO 6.00 03-15-14 6.000% 84,020.00 3/15/2014 0.900 6/30/1999 420.10 84,020.00 5.944 88,313.15
FGCI 6.00 04/01/14 6.000% 36,071.36 4/1/2014 0.970 1/23/2001 180.36 36,071.36 5.974 38,265.49
FNCI 6.00 08/01/14 6.000% 54,942.58 8/1/2014 1.080 5/17/2001 274.71 54,942.58 5.946 59,318.80
GNJO 7.00 01/15/15 7.000% 76,721.04 1/15/2015 1.070 8/30/2000 447.54 76,721.04 7.030 81,625.34
FNCI 7.00 03/01/15 7.000% 58,662.23 3/1/2015 1.160 11/16/2000 342.20 58,662.23 6.885 62,483.77
FGCI 7.00 04/01/15 7.000% 41,633.83 4/1/2015 1.180 9/19/2000 242.86 41,633.83 7.002 44,332.91
INVESTMENT BY SECTOR AND MATURITY - GENERAL FUND 9900
AS OF DECEMBER 31,2011

Appendix II
Investments by Sector and Maturity as of September 30, 2011

Description Coupon Par Value Maturity Call Mod Purchase Accrued Book Value YTC Current Market Value
Date Date DTW Date Interest Yield
Treasury Notes
T 1.0 10-31-11 1.000% 25,000,000.00 10/31/11 0.085 2/16/2011 104,619.57 25,016,491.36 0.219 25,018,550.00
T 1.75 11-15-11 1.750% 25,000,000.00 11/15/11 0.126 8/26/2009 165,251.36 25,017,755.55 1.176 25,049,800.00
T 1.75 11-15-11 1.750% 25,000,000.00 11/15/11 0.126 2/8/2011 165,251.36 25,046,975.44 0.253 25,049,800.00
T 4.5 11-30-11 4.500% 20,000,000.00 11/30/11 0.167 12/13/2010 302,459.02 20,138,907.14 0.333 20,141,400.00
T 4.5 11-30-11 4.500% 25,000,000.00 11/30/11 0.167 1/25/2011 378,073.77 25,176,397.53 0.268 25,176,750.00
T 1.125 12-15-11 1.125% 25,000,000.00 12/15/11 0.208 11/23/2009 82,991.80 25,015,375.78 0.826 25,053,700.00
HUD 3.82 08-01-12 3.820% 25,000,000.00 08/01/12 0.827 6/12/2008 159,166.67 25,000,000.00 3.820 25,731,150.00
HUD 0.86 08-1-12 0.860% 4,000,000.00 08/01/12 0.834 7/21/2010 5,733.33 4,000,000.00 0.860 4,019,168.00
T 1.375 11-15-12 1.375% 25,000,000.00 11/15/12 1.115 6/9/2011 129,840.35 25,303,482.15 0.292 25,330,075.00
T 0.625 12-31-12 0.625% 25,000,000.00 12/31/12 1.245 5/24/2011 39,487.09 25,067,051.73 0.409 25,131,825.00
T 0.625 12-31-12 0.625% 25,000,000.00 12/31/12 1.245 6/6/2011 39,487.09 25,088,050.56 0.342 25,131,825.00
T 1.375 05-15-13 1.375% 25,000,000.00 05/15/13 1.605 9/27/2011 129,840.35 25,451,815.81 0.260 25,444,250.00
T 3.625 5-15-13 3.625% 25,000,000.00 05/15/13 1.574 9/29/2011 342,306.38 26,359,036.33 0.270 26,349,600.00
T 1.125 6-15-13 1.125% 25,000,000.00 06/15/13 1.692 6/14/2011 82,991.80 25,291,367.84 0.439 25,360,250.00
HUD 1.34 08-01-13 1.340% 5,000,000.00 08/01/13 1.816 7/21/2010 11,166.67 5,000,000.00 1.340 5,074,930.00
T 0.75 9-15-13 0.750% 30,000,000.00 09/15/13 1.947 8/31/2011 9,890.11 30,323,927.61 0.197 30,268,350.00
T 2.125 11-30-14 2.125% 25,000,000.00 11/30/14 3.062 8/30/2011 178,534.84 26,347,680.08 0.409 26,289,050.00
Subtotal Treasury Notes 1.935% 384,000,000.00 10/24/12 1.054 2,327,091.56 388,644,314.91 0.640 389,620,473.00
Commercial Paper
GECC .13 10-11-11 0.130% 50,000,000.00 10/11/2011 0.030 8/26/2011 0.00 49,998,149.31 0.130 49,999,000.00
CHICAB 0.25 10-13-11 0.250% 20,019,000.00 10/13/2011 0.036 8/3/2011 0.00 20,017,292.03 0.250 20,019,000.00
HARMTA 0.2 12-7-11 0.200% 30,650,000.00 12/7/2011 0.186 9/21/2011 1,679.45 30,650,000.00 0.200 30,650,000.00
Subtotal Commercial Paper 0.175% 100,669,000.00 10/28/2011 0.079 1,679.45 100,665,441.34 0.175 100,668,000.00
Agency Discount Notes
FAMCDN 0.22 8-15-12 0.220% 25,000,000.00 8/15/2012 0.876 8/24/2011 0.00 24,951,124.24 0.220 24,978,000.00
Subtotal Agency Discount Notes0.220% 25,000,000.00 8/15/2012 0.876 0.00 24,951,124.24 0.220 24,978,000.00
Certificates of Deposit
Banco Popular de PR 0.450% 241,000.00 9/13/2012 0.956 9/15/2011 47.54 241,000.00 0.450 241,000.00
Capital Bank CDARS 0.450% 241,000.00 9/13/2012 0.956 9/15/2011 47.54 241,000.00 0.450 241,000.00
Iberia Bank CDARS 0.450% 26,000.00 9/13/2012 0.956 9/15/2011 5.13 26,000.00 0.450 26,000.00
Huntington National 0.450% 241,000.00 9/13/2012 0.956 9/15/2011 47.54 241,000.00 0.450 241,000.00
The Park National Ba 0.450% 241,000.00 9/13/2012 0.956 9/15/2011 47.54 241,000.00 0.450 241,000.00
Subtotal Certificates of Deposit0.450% 990,000.00 9/13/2012 0.956 195.29 990,000.00 0.450 990,000.00
Mortgage-Backed Securities
FNCI 7.00 03/01/12 7.000% 1,718.49 3/1/2012 0.230 6/30/1999 10.03 1,718.49 6.681 1,737.55
FGCI 7.00 4/01/12 7.000% 6,087.46 4/1/2012 0.290 6/30/1999 35.51 6,087.46 6.789 6,205.15
FNCI 7.00 04/01/12 7.000% 3,550.36 4/1/2012 0.270 6/30/1999 20.71 3,550.36 6.761 3,589.21
FNCI 7.00 04/01/12 7.000% 1,396.05 4/1/2012 0.270 10/19/1999 8.14 1,396.05 6.792 1,411.30
FNCI 7.00 05/01/12 7.000% 5,931.50 5/1/2012 0.310 6/30/1999 34.60 5,931.50 6.693 5,996.40
FNCI 6.50 07/01/12 6.500% 7,080.48 7/1/2012 0.360 6/30/1999 38.35 7,080.48 6.284 7,195.75
FGCI 7.00 07/01/12 7.000% 3,616.35 7/1/2012 0.320 6/30/1999 21.10 3,616.35 6.753 3,725.93
FGCI 7.00 07/01/12 7.000% 10,140.80 7/1/2012 0.320 8/21/2000 59.15 10,140.80 6.930 10,448.09
FGCI 7.00 10/01/12 7.000% 12,922.64 10/1/2012 0.520 9/19/2000 75.38 12,922.64 6.924 13,367.98
FGCI 6.50 01/01/13 6.500% 8,365.62 1/1/2013 0.630 6/30/1999 45.31 8,365.62 6.272 8,637.39
FNCI 6.50 01/01/13 6.500% 9,946.33 1/1/2013 0.620 6/30/1999 53.88 9,946.33 6.301 10,247.80
GNJO 6.50 04/15/13 6.500% 31,421.25 4/15/2013 0.620 8/30/2000 170.20 31,421.25 6.649 32,507.72
FNCI 6.00 08/01/13 6.000% 16,628.65 8/1/2013 0.770 6/30/1999 83.15 16,628.65 5.873 17,260.33
FNCI 6.00 09/01/13 6.000% 20,351.61 9/1/2013 0.770 6/30/1999 101.76 20,351.61 5.881 21,124.28
FNCI 6.00 09/01/13 6.000% 28,831.31 9/1/2013 0.770 6/30/1999 144.16 28,831.31 5.892 29,926.07
INVESTMENT BY SECTOR AND MATURITY - GENERAL FUND 9900 (960)
AS OF SEPTEMBER 30, 2011
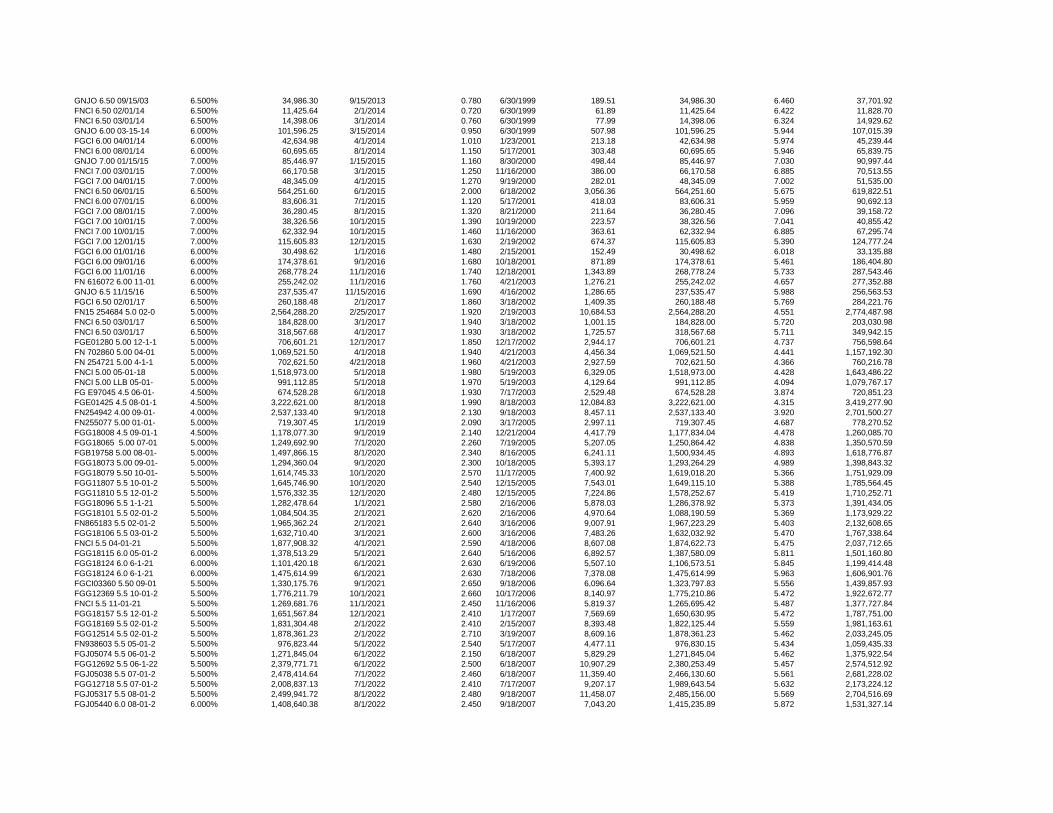
GNJO 6.50 09/15/03 6.500% 34,986.30 9/15/2013 0.780 6/30/1999 189.51 34,986.30 6.460 37,701.92
FNCI 6.50 02/01/14 6.500% 11,425.64 2/1/2014 0.720 6/30/1999 61.89 11,425.64 6.422 11,828.70
FNCI 6.50 03/01/14 6.500% 14,398.06 3/1/2014 0.760 6/30/1999 77.99 14,398.06 6.324 14,929.62
GNJO 6.00 03-15-14 6.000% 101,596.25 3/15/2014 0.950 6/30/1999 507.98 101,596.25 5.944 107,015.39
FGCI 6.00 04/01/14 6.000% 42,634.98 4/1/2014 1.010 1/23/2001 213.18 42,634.98 5.974 45,239.44
FNCI 6.00 08/01/14 6.000% 60,695.65 8/1/2014 1.150 5/17/2001 303.48 60,695.65 5.946 65,839.75
GNJO 7.00 01/15/15 7.000% 85,446.97 1/15/2015 1.160 8/30/2000 498.44 85,446.97 7.030 90,997.44
FNCI 7.00 03/01/15 7.000% 66,170.58 3/1/2015 1.250 11/16/2000 386.00 66,170.58 6.885 70,513.55
FGCI 7.00 04/01/15 7.000% 48,345.09 4/1/2015 1.270 9/19/2000 282.01 48,345.09 7.002 51,535.00
FNCI 6.50 06/01/15 6.500% 564,251.60 6/1/2015 2.000 6/18/2002 3,056.36 564,251.60 5.675 619,822.51
FNCI 6.00 07/01/15 6.000% 83,606.31 7/1/2015 1.120 5/17/2001 418.03 83,606.31 5.959 90,692.13
FGCI 7.00 08/01/15 7.000% 36,280.45 8/1/2015 1.320 8/21/2000 211.64 36,280.45 7.096 39,158.72
FGCI 7.00 10/01/15 7.000% 38,326.56 10/1/2015 1.390 10/19/2000 223.57 38,326.56 7.041 40,855.42
FNCI 7.00 10/01/15 7.000% 62,332.94 10/1/2015 1.460 11/16/2000 363.61 62,332.94 6.885 67,295.74
FGCI 7.00 12/01/15 7.000% 115,605.83 12/1/2015 1.630 2/19/2002 674.37 115,605.83 5.390 124,777.24
FGCI 6.00 01/01/16 6.000% 30,498.62 1/1/2016 1.480 2/15/2001 152.49 30,498.62 6.018 33,135.88
FGCI 6.00 09/01/16 6.000% 174,378.61 9/1/2016 1.680 10/18/2001 871.89 174,378.61 5.461 186,404.80
FGCI 6.00 11/01/16 6.000% 268,778.24 11/1/2016 1.740 12/18/2001 1,343.89 268,778.24 5.733 287,543.46
FN 616072 6.00 11-01 6.000% 255,242.02 11/1/2016 1.760 4/21/2003 1,276.21 255,242.02 4.657 277,352.88
GNJO 6.5 11/15/16 6.500% 237,535.47 11/15/2016 1.690 4/16/2002 1,286.65 237,535.47 5.988 256,563.53
FGCI 6.50 02/01/17 6.500% 260,188.48 2/1/2017 1.860 3/18/2002 1,409.35 260,188.48 5.769 284,221.76
FN15 254684 5.0 02-0 5.000% 2,564,288.20 2/25/2017 1.920 2/19/2003 10,684.53 2,564,288.20 4.551 2,774,487.98
FNCI 6.50 03/01/17 6.500% 184,828.00 3/1/2017 1.940 3/18/2002 1,001.15 184,828.00 5.720 203,030.98
FNCI 6.50 03/01/17 6.500% 318,567.68 4/1/2017 1.930 3/18/2002 1,725.57 318,567.68 5.711 349,942.15
FGE01280 5.00 12-1-1 5.000% 706,601.21 12/1/2017 1.850 12/17/2002 2,944.17 706,601.21 4.737 756,598.64
FN 702860 5.00 04-01 5.000% 1,069,521.50 4/1/2018 1.940 4/21/2003 4,456.34 1,069,521.50 4.441 1,157,192.30
FN 254721 5.00 4-1-1 5.000% 702,621.50 4/21/2018 1.960 4/21/2003 2,927.59 702,621.50 4.366 760,216.78
FNCI 5.00 05-01-18 5.000% 1,518,973.00 5/1/2018 1.980 5/19/2003 6,329.05 1,518,973.00 4.428 1,643,486.22
FNCI 5.00 LLB 05-01- 5.000% 991,112.85 5/1/2018 1.970 5/19/2003 4,129.64 991,112.85 4.094 1,079,767.17
FG E97045 4.5 06-01- 4.500% 674,528.28 6/1/2018 1.930 7/17/2003 2,529.48 674,528.28 3.874 720,851.23
FGE01425 4.5 08-01-1 4.500% 3,222,621.00 8/1/2018 1.990 8/18/2003 12,084.83 3,222,621.00 4.315 3,419,277.90
FN254942 4.00 09-01- 4.000% 2,537,133.40 9/1/2018 2.130 9/18/2003 8,457.11 2,537,133.40 3.920 2,701,500.27
FN255077 5.00 01-01- 5.000% 719,307.45 1/1/2019 2.090 3/17/2005 2,997.11 719,307.45 4.687 778,270.52
FGG18008 4.5 09-01-1 4.500% 1,178,077.30 9/1/2019 2.140 12/21/2004 4,417.79 1,177,834.04 4.478 1,260,085.70
FGG18065 5.00 07-01 5.000% 1,249,692.90 7/1/2020 2.260 7/19/2005 5,207.05 1,250,864.42 4.838 1,350,570.59
FGB19758 5.00 08-01- 5.000% 1,497,866.15 8/1/2020 2.340 8/16/2005 6,241.11 1,500,934.45 4.893 1,618,776.87
FGG18073 5.00 09-01- 5.000% 1,294,360.04 9/1/2020 2.300 10/18/2005 5,393.17 1,293,264.29 4.989 1,398,843.32
FGG18079 5.50 10-01- 5.500% 1,614,745.33 10/1/2020 2.570 11/17/2005 7,400.92 1,619,018.20 5.366 1,751,929.09
FGG11807 5.5 10-01-2 5.500% 1,645,746.90 10/1/2020 2.540 12/15/2005 7,543.01 1,649,115.10 5.388 1,785,564.45
FGG11810 5.5 12-01-2 5.500% 1,576,332.35 12/1/2020 2.480 12/15/2005 7,224.86 1,578,252.67 5.419 1,710,252.71
FGG18096 5.5 1-1-21 5.500% 1,282,478.64 1/1/2021 2.580 2/16/2006 5,878.03 1,286,378.92 5.373 1,391,434.05
FGG18101 5.5 02-01-2 5.500% 1,084,504.35 2/1/2021 2.620 2/16/2006 4,970.64 1,088,190.59 5.369 1,173,929.22
FN865183 5.5 02-01-2 5.500% 1,965,362.24 2/1/2021 2.640 3/16/2006 9,007.91 1,967,223.29 5.403 2,132,608.65
FGG18106 5.5 03-01-2 5.500% 1,632,710.40 3/1/2021 2.600 3/16/2006 7,483.26 1,632,032.92 5.470 1,767,338.64
FNCI 5.5 04-01-21 5.500% 1,877,908.32 4/1/2021 2.590 4/18/2006 8,607.08 1,874,622.73 5.475 2,037,712.65
FGG18115 6.0 05-01-2 6.000% 1,378,513.29 5/1/2021 2.640 5/16/2006 6,892.57 1,387,580.09 5.811 1,501,160.80
FGG18124 6.0 6-1-21 6.000% 1,101,420.18 6/1/2021 2.630 6/19/2006 5,507.10 1,106,573.51 5.845 1,199,414.48
FGG18124 6.0 6-1-21 6.000% 1,475,614.99 6/1/2021 2.630 7/18/2006 7,378.08 1,475,614.99 5.963 1,606,901.76
FGCI03360 5.50 09-01 5.500% 1,330,175.76 9/1/2021 2.650 9/18/2006 6,096.64 1,323,797.83 5.556 1,439,857.93
FGG12369 5.5 10-01-2 5.500% 1,776,211.79 10/1/2021 2.660 10/17/2006 8,140.97 1,775,210.86 5.472 1,922,672.77
FNCI 5.5 11-01-21 5.500% 1,269,681.76 11/1/2021 2.450 11/16/2006 5,819.37 1,265,695.42 5.487 1,377,727.84
FGG18157 5.5 12-01-2 5.500% 1,651,567.84 12/1/2021 2.410 1/17/2007 7,569.69 1,650,630.95 5.472 1,787,751.00
FGG18169 5.5 02-01-2 5.500% 1,831,304.48 2/1/2022 2.410 2/15/2007 8,393.48 1,822,125.44 5.559 1,981,163.61
FGG12514 5.5 02-01-2 5.500% 1,878,361.23 2/1/2022 2.710 3/19/2007 8,609.16 1,878,361.23 5.462 2,033,245.05
FN938603 5.5 05-01-2 5.500% 976,823.44 5/1/2022 2.540 5/17/2007 4,477.11 976,830.15 5.434 1,059,435.33
FGJ05074 5.5 06-01-2 5.500% 1,271,845.04 6/1/2022 2.150 6/18/2007 5,829.29 1,271,845.04 5.462 1,375,922.54
FGG12692 5.5 06-1-22 5.500% 2,379,771.71 6/1/2022 2.500 6/18/2007 10,907.29 2,380,253.49 5.457 2,574,512.92
FGJ05038 5.5 07-01-2 5.500% 2,478,414.64 7/1/2022 2.460 6/18/2007 11,359.40 2,466,130.60 5.561 2,681,228.02
FGG12718 5.5 07-01-2 5.500% 2,008,837.13 7/1/2022 2.410 7/17/2007 9,207.17 1,989,643.54 5.632 2,173,224.12
FGJ05317 5.5 08-01-2 5.500% 2,499,941.72 8/1/2022 2.480 9/18/2007 11,458.07 2,485,156.00 5.569 2,704,516.69
FGJ05440 6.0 08-01-2 6.000% 1,408,640.38 8/1/2022 2.450 9/18/2007 7,043.20 1,415,235.89 5.872 1,531,327.14

FGCI 6.0 9-1-22 5.500% 2,732,904.01 9/1/2022 2.400 11/18/2008 12,525.81 2,752,482.54 5.352 2,958,250.79
FGJ05665 5.5 10-01-2 5.500% 2,230,909.68 10/1/2022 2.530 10/16/2007 10,225.00 2,220,450.78 5.534 2,413,469.26
FGGI12956 5.0 01-01- 5.000% 2,132,465.36 1/1/2023 2.290 12/17/2007 8,885.27 2,130,177.14 4.982 2,301,936.60
FGCI 4.5 02-01-23 4.500% 2,725,908.00 2/1/2023 2.360 2/19/2008 10,222.16 2,723,972.16 4.481 2,898,627.17
FGG18239 5.0 03-01-2 5.000% 2,746,873.50 3/1/2023 2.340 3/18/2008 11,445.31 2,749,869.11 4.949 2,951,438.61
FGJ07494 4.5 04-01-2 4.500% 3,114,397.36 4/1/2023 2.240 4/17/2008 11,678.99 3,090,898.41 4.610 3,311,732.02
FGG13072 5.0 04-01-2 5.000% 1,898,612.04 4/1/2023 2.350 3/18/2008 7,910.88 1,885,025.24 5.077 2,044,751.97
FGCI 4.5 04-01-23 4.500% 1,776,110.97 4/1/2023 2.430 12/16/2008 6,660.42 1,807,037.93 4.254 1,888,649.02
FNCI 5.0 5-1-23 5.000% 2,776,865.52 5/1/2023 2.390 5/19/2008 11,570.27 2,763,643.66 5.021 2,987,135.28
FGG18259 5.5 06-01-2 5.500% 2,899,298.32 6/1/2023 2.560 6/17/2008 13,288.45 2,918,587.94 5.347 3,136,553.41
FGG18259 5.5 06-01-2 5.500% 2,915,345.54 6/1/2023 2.560 7/17/2008 13,362.00 2,905,902.05 5.518 3,153,913.84
FGG13247 5.0 07-01-2 5.000% 2,856,052.72 7/1/2023 2.390 9/16/2008 11,900.22 2,880,446.40 4.842 3,068,748.62
FGJ08476 5.5 08-01-2 5.500% 3,491,808.72 8/1/2023 2.520 8/18/2008 16,004.12 3,470,021.95 5.564 3,777,550.06
FGG18300 4.0 1-1-24 4.000% 3,986,361.36 1/1/2024 2.380 1/20/2009 13,287.87 4,060,955.80 3.691 4,202,819.07
FGJ09194 4.0 1-1-24 4.000% 3,813,199.12 1/1/2024 2.500 2/20/2009 12,710.66 3,856,811.64 3.800 4,020,254.19
FGCI 4.0 03-01-24 4.000% 4,682,280.96 3/1/2024 2.440 3/17/2009 15,607.60 4,724,586.83 3.826 4,932,137.16
FGCI 4.0 05-01-24 4.000% 5,487,213.76 5/1/2024 2.520 4/16/2009 18,290.71 5,561,382.35 3.744 5,780,022.84
FGCI 4.0 05-01-24 4.000% 4,847,022.64 5/1/2024 2.140 5/18/2009 16,156.74 4,901,728.55 3.790 5,105,669.80
FGCI 4.0 06-01-24 4.000% 5,314,713.60 6/1/2024 2.160 6/16/2009 17,715.71 5,290,390.75 4.051 5,598,317.72
FGJ10251 4.0 7-1-24 4.000% 6,339,751.31 7/1/2024 2.200 7/16/2009 21,132.50 6,388,434.39 3.842 6,678,053.57
FGJ12604 4.0 07-01-2 4.000% 6,035,367.11 7/1/2025 2.410 12/20/2010 20,117.89 6,167,630.76 3.619 6,357,426.79
Subtotal Mortgage-Backed Securities4.889% 137,391,189.52 4/5/2014 2.356 559,738.54 137,809,670.65 4.749 147,217,993.70
CMOs
FHR2892GA 4.0 12-15- 4.000% 375,522.50 12/15/2012 0.110 12/20/2004 1,251.74 375,522.50 3.917 376,502.61
Subtotal CMOs 4.000% 375,522.50 11/9/2011 0.110 1,251.74 375,522.50 3.917 376,502.61
Agency Notes
FHLB 0.23 10-21-11 0.230% 25,000,000.00 10/21/2011 0.057 2/22/2011 6,229.17 25,000,148.14 0.220 25,001,500.00
FNMA 5.375 11-15-11 5.375% 25,000,000.00 11/15/2011 0.126 12/22/2010 507,638.89 25,157,669.21 0.350 25,153,475.00
FNMA 5.375 11-15-11 5.375% 25,000,000.00 11/15/2011 0.126 1/10/2011 507,638.89 25,159,354.84 0.310 25,153,475.00
FNMA 5.375 11-15-11 5.375% 25,000,000.00 11/15/2011 0.126 1/13/2011 507,638.89 25,159,534.31 0.304 25,153,475.00
FHLB 4.875 11-18-11 4.875% 15,000,000.00 11/18/2011 0.134 1/6/2011 270,156.25 15,091,609.84 0.320 15,088,725.00
FHLB 0.785 11-25-11 0.785% 25,000,000.00 11/25/2011 0.153 12/14/2010 68,687.50 25,016,023.12 0.366 25,024,350.00
FHLB 0.32 12-01-11 0.320% 25,000,000.00 12/1/2011 0.170 1/6/2011 66,666.67 24,999,995.77 0.320 25,008,450.00
FHLB 0.32 12-01-11 0.320% 25,000,000.00 12/1/2011 0.170 12/15/2010 66,666.67 24,998,732.63 0.350 25,008,450.00
FHLB 4.75 12-9-11 4.750% 20,000,000.00 12/9/2011 0.192 6/15/2007 295,555.56 19,976,098.22 5.483 20,165,920.00
TVA 6.79 05-23-12 6.790% 9,309,000.00 5/23/2012 0.631 2/19/2008 224,739.95 9,485,920.91 3.517 9,696,505.74
FHLB 4.875 06-08-12 4.875% 5,000,000.00 6/8/2012 0.677 2/19/2008 76,510.42 5,041,666.10 3.529 5,142,825.00
FHLB 1.375 6-8-12 1.375% 25,000,000.00 6/8/2012 0.685 6/15/2011 107,899.31 25,192,509.75 0.254 25,187,675.00
FHLB 1.375 6-8-12 1.375% 25,000,000.00 6/8/2012 0.685 9/15/2011 107,899.31 25,207,026.97 0.173 25,187,675.00
FHLMC 1.75 6-15-12 1.750% 20,000,000.00 6/15/2012 0.704 9/17/2009 103,055.56 20,015,234.08 1.639 20,208,240.00
FHLMC 1.75 6-15-12 1.750% 20,000,000.00 6/15/2012 0.704 10/7/2009 103,055.56 20,046,896.46 1.411 20,208,240.00
FHLMC 1.75 6-15-12 1.750% 15,000,000.00 6/15/2012 0.704 9/12/2011 77,291.67 15,165,961.03 0.188 15,156,180.00
FFCB 2.125 6-18-12 2.125% 25,000,000.00 6/18/2012 0.711 9/14/2009 151,996.53 25,091,588.52 1.600 25,324,325.00
FFCB 2.125 6-18-12 2.125% 25,000,000.00 6/18/2012 0.711 7/12/2011 151,996.53 25,336,118.42 0.241 25,324,325.00
FHLB 1.875 6-20-12 1.875% 20,000,000.00 6/20/2012 0.718 6/12/2009 105,208.33 19,951,938.50 2.221 20,228,760.00
FHLB 0.25 06-21-12 0.250% 10,000,000.00 6/21/2012 0.724 7/12/2011 6,944.44 10,000,568.41 0.242 9,998,570.00
FNMA 1.25 06-22-12 1.250% 10,000,000.00 6/22/2012 0.725 9/12/2011 34,375.00 10,077,289.86 0.188 10,070,380.00
FHLB 0.22 9-12-12 0.220% 25,000,000.00 9/12/2012 0.949 9/13/2011 2,902.78 24,997,235.07 0.232 24,984,875.00
FHLB 2.0 09-14-12 2.000% 25,000,000.00 9/14/2012 0.951 9/15/2009 23,611.11 25,043,188.16 1.813 25,405,273.50
FHLB 2.0 09-14-12 2.000% 20,000,000.00 9/14/2012 0.951 9/16/2009 18,888.89 20,041,083.06 1.778 20,324,218.80
FHLB 4.625 10-10-12 4.625% 20,000,000.00 10/10/2012 0.995 8/28/2009 439,375.00 20,532,756.07 1.941 20,893,660.00
FFCB 4.5 10-17-12 4.500% 19,502,000.00 10/17/2012 1.015 6/5/2009 399,791.00 19,947,727.93 2.222 20,350,610.03
FHLB 4.875 12-14-12 4.875% 15,000,000.00 12/14/2012 1.171 2/12/2008 217,343.75 15,214,278.70 3.548 15,802,875.00
FHLB 4.875 12-14-12 4.875% 20,000,000.00 12/14/2012 1.171 2/12/2008 289,791.67 20,285,704.91 3.548 21,070,500.00
FHLB 4.875 12-14-12 4.875% 14,000,000.00 12/14/2012 1.171 2/13/2008 202,854.17 14,207,497.78 3.500 14,749,350.00
FHLB 1.75 12-14-12 1.750% 30,000,000.00 12/14/2012 1.193 12/11/2009 156,041.67 30,050,560.52 1.606 30,494,400.00
FHLMC 4.125 12-21-12 4.125% 20,000,000.00 12/21/2012 1.195 8/4/2009 229,166.67 20,489,669.28 2.046 20,915,320.00
FHLMC 4.125 12-21-12 4.125% 30,000,000.00 12/21/2012 1.195 8/24/2009 343,750.00 30,740,914.35 2.029 31,372,980.00
FHLMC 0.75 12-28-12 0.750% 25,000,000.00 12/28/2012 1.239 2/17/2011 48,437.50 24,972,482.56 0.839 25,131,125.00

FHLMC 0.75 12-28-12 0.750% 25,000,000.00 12/28/2012 1.239 6/16/2011 48,437.50 25,112,330.65 0.387 25,131,125.00
FFCB 3.4 02-07-13 3.400% 25,000,000.00 2/7/2013 1.328 2/14/2008 127,500.00 24,942,271.87 3.591 26,012,825.00
FFCB 3.4 02-07-13 3.400% 20,000,000.00 2/7/2013 1.328 2/20/2008 102,000.00 19,902,401.34 3.806 20,810,260.00
FNMA 4.75 02-21-13 4.750% 15,000,000.00 2/21/2013 1.357 6/3/2008 79,166.67 15,131,189.97 4.053 15,898,890.00
FNMA 4.75 02-21-13 4.750% 10,000,000.00 2/21/2013 1.357 6/5/2008 52,777.78 10,081,465.67 4.100 10,599,260.00
FHLB 3.875 03-08-13 3.875% 20,000,000.00 3/8/2013 1.411 3/12/2008 49,513.89 20,065,181.37 3.624 21,004,740.00
FHLB 3.875 03-08-13 3.875% 20,000,000.00 3/8/2013 1.411 3/24/2008 49,513.89 20,102,941.35 3.481 21,004,740.00
FFCB 1.875 04-15-13 1.875% 10,000,000.00 4/15/2013 1.514 7/21/2010 86,458.33 10,132,550.16 1.000 10,223,310.00
FNMA 2.0 04-19-13 1x 2.000% 2,000,000.00 4/19/2013 10/19/2011 0.053 11/9/2010 18,000.00 2,001,725.46 0.395 1.373 2,001,580.00
FFCB 4.0 05-21-13 4.000% 10,000,000.00 5/21/2013 1.584 6/3/2008 144,444.44 9,985,705.34 4.097 10,582,350.00
FHLB 5.13 05-24-13 5.130% 30,000,000.00 5/24/2013 1.577 6/4/2008 542,925.00 30,504,685.60 3.994 32,329,350.00
FHLMC 4.0 06-12-13 4.000% 25,000,000.00 6/12/2013 1.643 5/12/2009 302,777.78 25,663,667.97 2.351 26,520,975.00
FHLMC 4.0 06-12-13 4.000% 20,000,000.00 6/12/2013 1.643 6/16/2009 242,222.22 20,438,153.46 2.633 21,216,780.00
FHLMC 4.0 06-12-13 4.000% 20,000,000.00 6/12/2013 1.643 6/23/2009 242,222.22 20,410,826.09 2.716 21,216,780.00
FHLB 5.375 06-14-13 5.375% 20,000,000.00 6/14/2013 1.631 9/15/2009 319,513.89 21,047,449.92 2.160 21,685,220.00
FHLB 5.375 06-14-13 5.375% 8,320,000.00 6/14/2013 1.631 10/6/2009 132,917.78 8,783,230.55 1.972 9,021,051.52
FHLB 1.625 6-14-13 1.625% 25,000,000.00 6/14/2013 1.682 6/23/2011 120,746.53 25,475,663.09 0.502 25,522,250.00
FHLB 3.0 06-24-13 3.000% 18,000,000.00 6/24/2013 1.690 10/6/2009 145,500.00 18,310,430.48 1.962 18,806,004.00
FNMA 1.5 06-26-13 1.500% 25,000,000.00 6/26/2013 1.717 2/9/2011 98,958.33 25,160,578.91 1.125 25,472,450.00
FHLMC 1.15 10-07-13 1.150% 15,000,000.00 10/7/2013 10/7/2011 0.019 10/27/2010 83,375.00 15,001,320.87 0.688 1.000 15,001,425.00
FNMA 1.125 10-8-13 1.125% 15,000,000.00 10/8/2013 1.994 10/27/2010 81,093.75 15,000,000.00 1.125 15,195,150.00
FNMA 1.0 10-15-13 1.000% 20,000,000.00 10/15/2013 2.017 10/15/2010 92,222.22 20,000,000.00 0.936 20,129,280.00
FNMA 1.05 10-22-13 1.050% 20,000,000.00 10/22/2013 2.035 10/22/2010 92,750.00 20,000,000.00 0.997 20,210,580.00
FHLB 4.875 12-13-13 4.875% 20,000,000.00 12/13/2013 2.089 6/19/2009 292,500.00 20,657,117.99 3.259 21,901,120.00
FHLB 3.125 12-13-13 3.125% 25,000,000.00 12/13/2013 2.129 12/21/2010 234,375.00 26,038,620.20 1.200 26,439,925.00
FHLB 3.125 12-13-13 3.125% 30,000,000.00 12/13/2013 2.129 2/10/2011 281,250.00 31,051,235.31 1.496 31,727,910.00
FHLB 3.125 12-13-13 3.125% 25,000,000.00 12/13/2013 2.129 2/15/2011 234,375.00 25,856,287.53 1.532 26,439,925.00
FNMA 0.75 12-18-13 0.750% 25,000,000.00 12/18/2013 2.198 9/28/2011 53,645.83 25,160,852.83 0.458 25,110,725.00
FNMA 3.0 12-30-13 1x 3.000% 5,000,000.00 12/30/2013 12/30/2011 0.249 12/21/2010 37,916.67 5,030,669.92 0.825 2.135 5,027,050.00
FNMA 1.35 02-24-14 1.350% 5,000,000.00 2/24/2014 2.367 12/2/2010 6,937.50 5,000,000.00 1.350 5,093,840.00
FAMCA 1.125 06-02-14 1.125% 11,000,000.00 6/2/2014 2.631 6/10/2011 40,906.25 11,025,951.92 1.035 11,117,931.00
FAMCA 3.15 06-05-14 3.150% 13,355,000.00 6/5/2014 2.571 6/10/2011 135,553.25 14,111,070.62 1.000 14,183,143.55
FNMA 1.125 7-11-14 1 1.125% 25,000,000.00 7/11/2014 7/11/2012 0.775 9/30/2011 62,500.00 25,147,500.00 0.651 0.910 25,091,925.00
FHLMC 1.1 8-8-14 1xc 1.100% 25,000,000.00 8/8/2014 8/8/2012 0.850 9/14/2011 40,486.11 25,147,937.69 0.704 0.882 25,084,200.00
FFCB 1.625 11-19-14 1.625% 25,000,000.00 11/19/2014 3.054 6/8/2011 148,958.33 25,431,341.65 1.063 25,703,125.00
FHLB 2.75 12-12-14 2.750% 12,000,000.00 12/12/2014 3.063 2/10/2011 99,916.67 12,264,739.72 2.030 12,749,880.00
FHLB 2.75 12-12-14 2.750% 18,000,000.00 12/12/2014 3.063 2/10/2011 149,875.00 18,398,311.10 2.028 19,124,820.00
FHLB 1.125 4-27-16 s 1.125% 20,000,000.00 4/27/2016 10/27/2011 0.075 7/15/2011 96,250.00 20,009,761.54 0.668 1.084 20,006,880.00
FNMA 1 6-22-16 Step- 1.000% 10,000,000.00 6/22/2016 6/22/2012 0.723 6/22/2011 27,500.00 9,981,830.61 0.590 1.051 10,029,650.00
FHLB 1.0 07-18-16 st 1.000% 15,000,000.00 7/18/2016 10/18/2011 0.050 7/18/2011 30,416.67 15,000,000.00 0.698 1.000 15,002,280.00
FHLB 1.0 7-19-16 stp 1.000% 15,000,000.00 7/19/2016 10/19/2011 0.053 7/19/2011 30,000.00 15,000,000.00 0.885 1.000 15,000,945.00
FHLMC 1.05 7-27-16 S 1.050% 15,000,000.00 7/27/2016 10/27/2011 0.075 7/27/2011 28,000.00 15,000,000.00 0.635 1.050 15,004,635.00
FHLMC 1.0 9-14-16 st 1.000% 25,000,000.00 9/14/2016 12/14/2011 0.152 9/14/2011 11,805.56 25,000,000.00 1.418 1.000 24,974,450.00
FHLMC 1 9-30-16 step 1.000% 20,000,000.00 9/30/2016 12/30/2011 0.249 9/30/2011 555.56 20,000,000.00 2.021 1.000 19,949,180.00
Subtotal Agency Notes 2.587% 1,485,486,000.00 11/30/2012 1.141 11,218,565.93 1,501,261,982.23 1.588 1,524,346,623.14
Municipal Bonds
ALT 3.98 10-01-11 3.980% 1,800,000.00 10/1/2011 0.003 8/21/2007 35,820.00 1,800,000.00 5.180 1,800,000.00
ROBUTL 8.45 11-15-11 8.450% 140,000.00 11/15/2011 0.125 10/2/2007 4,469.11 140,258.54 6.702 141,195.60
CHI 5.25 01-01-12 5.250% 4,000,000.00 1/1/2012 0.255 1/25/2008 52,500.00 4,014,449.14 3.647 4,030,560.00
PEOSCD 0 01-01-12 0.000% 1,295,000.00 1/1/2012 0.255 5/4/2010 0.00 1,279,992.45 4.794 1,292,034.45
PEOSCD 0 01-01-12 0.000% 705,000.00 1/1/2012 0.255 5/4/2010 0.00 696,829.87 4.794 704,259.75
MES 5.05 01-15-12 5.050% 1,085,000.00 1/15/2012 0.293 11/10/2008 11,567.31 1,088,739.33 3.775 1,099,105.00
NWK 4.504 04-01-12 4.504% 1,200,000.00 4/1/2012 0.492 4/22/2008 27,024.00 1,201,111.89 4.301 1,220,688.00
OHS 4.55 05-01-12 4.550% 1,000,000.00 5/1/2012 0.575 8/19/2008 18,958.33 1,000,042.66 4.544 1,023,640.00
KSSDEV 4.372 05-01-1 4.372% 2,600,000.00 5/1/2012 0.575 10/10/2008 47,363.33 2,605,913.38 3.950 2,647,762.00
PAL 5.735 06-01-12 5.735% 3,515,000.00 6/1/2012 0.656 3/6/2008 67,195.08 3,559,292.52 3.630 3,639,044.35
STNPWR 4.05 07-01-12 4.050% 4,875,000.00 7/1/2012 0.743 2/6/2008 49,359.38 4,876,591.87 4.002 4,992,926.25
WAS 5.6 07-01-12 5.600% 5,000,000.00 7/1/2012 0.739 11/17/2008 70,000.00 5,065,245.32 3.725 5,188,150.00
MONHGR 4.24 08-01-12 4.240% 1,000,000.00 8/1/2012 0.826 1/24/2008 7,066.67 1,000,000.00 4.240 1,026,370.00
SCRGEN 5.556 08-01-1 5.556% 1,000,000.00 8/1/2012 0.823 11/3/2008 9,260.00 997,950.15 5.830 1,035,430.00

NYC 4.5 9-1-12 4.500% 4,400,000.00 9/1/2012 0.908 9/16/2008 16,500.00 4,417,727.58 4.020 4,555,936.00
DUPSCD 4.0 10-01-12 4.000% 1,255,000.00 10/1/2012 0.974 3/31/2008 25,100.00 1,255,000.00 4.000 1,294,607.80
NYC 4.75 10-01-12 4.750% 4,000,000.00 10/1/2012 0.969 2/2/2009 95,000.00 4,054,211.38 3.300 4,164,640.00
CAS 4.15 12-01-12 4.150% 9,220,000.00 12/1/2012 1.140 5/16/2011 127,543.33 9,522,502.83 1.300 9,436,577.80
PAS 4.76 02-15-13 4.760% 885,000.00 2/15/2013 2/15/2012 0.884 3/28/2008 5,382.77 895,556.83 3.799 929,736.75
NWK 4.654 04-01-13 4.654% 1,000,000.00 4/1/2013 1.436 4/22/2008 23,270.00 1,003,383.29 4.401 1,045,510.00
KSSDEV 4.522 05-01-1 4.522% 3,840,000.00 5/1/2013 1.521 10/15/2008 72,352.00 3,830,322.08 4.700 4,022,054.40
WAS 5.625 07-01-13 5.625% 5,000,000.00 7/1/2013 1.673 11/20/2008 70,312.50 5,116,303.79 4.150 5,428,450.00
COL 2.26 7-1-13 2.260% 1,000,000.00 7/1/2013 1.720 9/7/2011 5,650.00 1,030,662.35 0.500 1,028,490.00
TXS 6.0 08-01-13 6.000% 1,010,000.00 8/1/2013 1.752 11/13/2008 10,100.00 1,034,114.40 4.537 1,101,910.00
NYS 1.16 9-1-13 1.160% 3,310,000.00 9/1/2013 1.902 8/23/2011 3,199.67 3,345,231.04 0.600 3,339,392.80
SCSUTL 6.808 01-01-1 6.808% 2,500,000.00 1/1/2014 2.099 3/23/2009 42,550.00 2,642,442.09 4.000 2,797,500.00
OHS 1.19 05-01-14 1.190% 1,000,000.00 5/1/2014 2.546 6/16/2011 3,470.83 1,000,000.00 1.190 1,007,100.00
CTS 1.43 05-15-14 1.430% 5,000,000.00 5/15/2014 2.574 5/31/2011 24,031.94 5,000,000.00 1.430 5,064,350.00
CHEUTL 5.14 O7-1-24 5.140% 2,000,000.00 7/1/2014 2.573 7/1/2009 25,700.00 2,034,382.77 4.436 2,153,740.00
STR 1.905 8-1-14 1.905% 3,000,000.00 8/1/2014 2.767 9/15/2011 9,525.00 3,062,324.36 1.158 3,036,750.00
NJS 2.02 8-15-14 2.020% 5,000,000.00 8/15/2014 2.801 3/28/2011 12,905.56 5,020,519.53 1.870 5,162,100.00
NJS 2.02 8-15-14 2.020% 1,000,000.00 8/15/2014 2.802 8/4/2011 2,581.11 1,025,911.60 1.100 1,032,420.00
NJS 2.02 8-15-14 2.020% 1,000,000.00 8/15/2014 2.803 9/12/2011 2,581.11 1,033,684.19 0.832 1,032,420.00
MIS 2.65 4-15-15 2.650% 1,000,000.00 4/15/2015 3.375 9/13/2011 11,851.39 1,051,177.63 1.170 1,043,230.00
STR 2.305 8-1-15 2.305% 4,550,000.00 8/1/2015 3.681 7/7/2011 17,479.58 4,599,108.30 2.011 4,605,783.00
NYC 1.73 8-1-15 1.730% 1,600,000.00 8/1/2015 3.726 9/15/2011 3,998.22 1,636,705.32 1.117 1,610,640.00
GAS 5.15 03-01-16 5.150% 3,410,000.00 3/1/2016 3/1/2012 2.378 11/25/2008 14,634.58 3,496,539.82 4.470 3,613,508.80
OHS 2.27 05-01-16 2.270% 1,825,000.00 5/1/2016 4.353 6/16/2011 12,083.02 1,825,000.00 2.270 1,859,839.25
CHI 0.0 01-01-40 4.042% 6,000,000.00 1/1/2040 10/7/2011 0.019 7/29/2011 19,934.07 6,000,000.00 4.042 6,000,000.00
Subtotal Municipal Bonds 3.958% 103,020,000.00 4/3/2013 1.534 1,058,319.89 104,259,228.30 3.087 106,207,852.00
Money Market Mutual Funds
TexStar960 Cash Rese 0.091% 237,994,079.55 10/1/2011 0.003 7/1/2011 0.00 237,994,079.55 0.091 237,994,079.55
CHASE MONEY MARKET F 0.010% 176,622.30 10/1/2011 0.003 2/1/2008 4.14 176,622.30 0.010 176,622.30
Subtotal Money Market Mutual Funds0.091% 238,170,701.85 10/1/2011 0.003 4.14 238,170,701.85 0.091 238,170,701.85
TOTAL FUND 9900 (960) 2.306% 2,475,102,413.87 10/31/2012 1.063 15,166,846.54 2,497,127,986.02 1.464 2,532,576,146.30
Description Coupon Par Value Maturity Call Mod Purchase Accrued Book Value YTC Current Market Value
Date Date DTW Date Interest Yield
Municipal Bonds
COO 3.25 11-15-11 3.250% 500,000.00 11/15/2011 0.126 11/5/2009 6,138.89 501,166.25 1.320 501,510.00
GAIUTL 0 10-01-36 0.132% 4,000,000.00 10/1/2036 10/31/2011 0.085 9/25/2009 434.59 4,000,000.00 0.132 4,000,000.00
Subtotal Municipal Bonds 0.479% 4,500,000.00 11/1/2011 0.052 6,573.48 4,501,166.25 0.264 4,501,510.00
Money Market Mutual Funds
Fidelity Tax-Free Mo 0.010% 3,308,705.54 10/22/2011 0.061 6/1/2009 (1.40) 3,308,705.54 0.010 3,308,705.54
Subtotal Money Market Mutual Funds0.010% 3,308,705.54 10/22/2011 0.061 (1.40) 3,308,705.54 0.010 3,308,705.54
TOTAL FUND 9901 (971) 0.280% 7,808,705.54 10/27/2011 0.077 6,572.08 7,809,871.79 0.157 7,810,215.54
INVESTMENT BY SECTOR AND MATURITY - TAX EXEMPT FUND 9901 (971)
AS OF SEPTEMBER 30, 2011

Description Coupon Par Value Maturity Call Mod Purchase Accrued Book Value YTC Current Market Value
Date Date DTW Date Interest Yield
Treasury Bills
B 0.076 12-8-11 0.076% 3,000,000.00 12/08/11 0.189 06/21/11 0.00 2,999,566.64 0.076 2,999,934.00
B 0.065 12-29-11 0.065% 3,000,000.00 12/29/11 0.246 07/26/11 0.00 2,999,514.70 0.065 2,999,877.00
B 0.054 3-8-12 0.054% 3,000,000.00 03/08/12 0.438 09/08/11 0.00 2,999,280.00 0.054 2,999,412.00
Subtotal Treasury Bills 0.065% 9,000,000.00 01/14/12 0.291 0.00 8,998,361.34 0.065 8,999,223.00
TOTAL FUND 9902 (974) 0.065% 9,000,000.00 01/14/12 0.291 0.00 8,998,361.34 0.065 8,999,223.00
GRAND TOTALS 2.292% 2,491,911,119.41 10/29/12 1.057 15,173,418.62 2,513,936,219.15 1.455 2,549,385,584.84
INVESTMENT BY SECTOR AND MATURITY - HOUSING DEPARTMENT SECTION 108 FUND 9902 (974)
AS OF SEPTEMBER 30, 2011