Quarterly International Trade Outlook (QITO) for 2014 Q4
28
4TH QUARTER 2014 QUARTERLY INTERNATIONAL TRADE OUTLOOK BRITISH CHAMBERS OF COMMERCE IN PARTNERSHIP WITH DHL
-
Upload
dhl-express-uk -
Category
Documents
-
view
220 -
download
0
Transcript of Quarterly International Trade Outlook (QITO) for 2014 Q4

7/21/2019 Quarterly International Trade Outlook (QITO) for 2014 Q4
http://slidepdf.com/reader/full/quarterly-international-trade-outlook-qito-for-2014-q4 1/28
4TH QUARTER 2014
QUARTERLY
INTERNATIONALTRADE
OUTLOOK
BRITISH CHAMBERS OF COMMERCEIN PARTNERSHIP WITH DHL
7/21/2019 Quarterly International Trade Outlook (QITO) for 2014 Q4
http://slidepdf.com/reader/full/quarterly-international-trade-outlook-qito-for-2014-q4 2/28
The British Chambers of Commerce (BCC) is a
dynamic and independent business network
with accredited Chambers in every nation and
region of the UK, and in key markets aroundthe world.
Accredited Chambers are at the heart of local
business communities, helping thousands of
companies - of every size and sector - to grow
and thrive. Together with our fast-growing
global network, Chambers provide practical
advice and support to British companies
trading around the world.
Chambers help businesses connect, belong,
and succeed. For over 150 years, our business
has been helping UK business grow.Written and researched by:
Sukhdeep Dhillon, Global Economic Adviser
Tom Nolan, Policy Manager
Acknowledgements:
Mike Spicer, Director of Research
The British Chambers of Commerce
65 Petty France
St. James’s Park
London
SW1H 9EU
T: 020 7654 5800E: [email protected]
www.britishchambers.org.uk
THE BRITISH CHAMBERS OF
COMMERCE
Contents
Foreword 3
DHL/BCC Trade Condence Index 4
Export index 5
Export & condence balances 6
Recent performance & outlook 7
Factsheets overview 8-9
Japan 10-11
Philippines 12-13
Algeria 14-15
Angola 16-17
New Zealand 18-19
United States 20-21
Overview of trade agreements 22-23
Case study: ‘Our export journey’ 24
How UK exports will change 25
Methodology 26
DHL – THE LOGISTICS
COMPANY FOR THE WORLD
About this outlook
DHL is the global market leader in the logistics
industry and “The Logistics company for the
world”. DHL commits its expertise in international
express, air and ocean freight, road and rail
transportation, contract logistics and international
mail services to its customers. A global network
composed of more than 220 countries and
territories and about 275,000 employees
worldwide offers customers superior service
quality and local knowledge to satisfy their supply
chain requirements. DHL accepts its social
responsibility by supporting climate protection,
disaster management and education.
DHL is part of Deutsche Post DHL.
www.dhl.co.uk
The BCC/DHL Quarterly International Trade
Outlook sets out the opportunities and risks
facing British companies as they trade with the
world – with a particular focus on timely
information on dynamic new markets. It
features the DHL/BCC Trade Condence Index
(TCI) which is a measure of the UK’s exporting
health. It builds on the role of accredited
Chambers of Commerce – the UK’s premier
private-sector providers of international trade
support to business – and the modelling
expertise of Oxford Economics, who have
provided all the economic and trade forecasts
presented in this publication.
2

7/21/2019 Quarterly International Trade Outlook (QITO) for 2014 Q4
http://slidepdf.com/reader/full/quarterly-international-trade-outlook-qito-for-2014-q4 3/283
Forewordby John Longworth
Director General, British Chambers of Commerce
British exporters are rising to the challenge, despite a particularly challenging global market.This quarter’s Trade Condence Index (TCI) shows that more than half of the exporters expect
their protability to increase this year, and more than 80% tried to recruit new staff at the end
of last year.
While we are yet to see this condence translate into the
ofcial gures, exporters are creating jobs and prosperity
for the nation. We know that when businesses do export,
they grow, on average, 20% more than businesses that
don’t. So crucially we must encourage more British
businesses to broaden their domestic mindset and explore
markets around the world.
Our success in today’s global economy rests largely on our
capability to trade with markets around the world. We face
a national challenge to boost UK exports and reach the
Prime Minister’s ambitious export target by 2020.
In the long-term, the UK needs to shift its focus from a
relatively stagnant Europe to the world’s future growth
markets. Trading with countries outside the EU can be
challenging, however the opportunities are vast for those
businesses willing to try.
To support businesses trying to access markets around the
world, we are building an international network of
accredited Chambers of Commerce and overseas business
groups. By accessing this global network, businesses are
provided with practical support and advice from a range of
experts. Each and every day, the British Chamber of
Commerce’s global network is helping UK exporters
navigate their export journey.
The British Chambers of Commerce has been supporting
trade for over 150 years. Like all Chambers of Commerce,
we are a business network backed by industry. We can offer
the best business to business advice drawn from the wealth
of experience of the British export community.
Foreword
by Phil CouchmanCEO, DHL Express UK & Ireland
The ndings are particularly encouraging as they come
during a period of relative uncertainty, especially regarding
the EU economy. However, British exporters are defying the
odds, overcoming these challenges and capitalising on the
huge demand for British products across and beyond
Europe.
Building on this growth and condence is imperative. Steps
are being taken by Government to support exporters,
particularly SMEs, who are less able to ride the trends of the
economic cycle than their larger counterparts. If the UK is
going to successfully rebalance its economy it is crucial that
businesses are equipped with the information and resourcesthey need. Understanding the existing resources available
for UK SMEs, such as the British Chamber of Commerce and
DHL’s Export Advisor Service is an important rst step for
SMEs.
At DHL we have condence in the UK export market and
remain focused on delivering a world-class service to our
customers. We know from our customers that UK SMEs who
are already growing their businesses overseas are extremely
condent in the possibilities the export market presents. We
must continue to strongly support these companies to
ensure all UK businesses can realise their growth ambitions
on a global stage.
This quarter’s Trade Condence Index demonstrated an increase in condence amongst UK
exporters, with manufacturing rms noticeably more condent that their turnover will increase
over the next year. With the total volume of export trade documentation recovering close to
last year’s record high, Britain’s steady economic growth and improved trading conditions
have presented a great opportunity for British businesses to expand internationally.

7/21/2019 Quarterly International Trade Outlook (QITO) for 2014 Q4
http://slidepdf.com/reader/full/quarterly-international-trade-outlook-qito-for-2014-q4 4/284
DHL/BCC Trade Condence Index (TCI)
----Recession----
% b
a l a n c e
Figure one: Balance of firms who are confident that turnover will improve over the next 12 months
Balance figures are determined by subtracting the percentage of companies reporting decreases in a factor from the
percentage of companies reporting increases.
-40
-30
-20
-10
0
10
20
30
40
50
60
70
80
Q3 14Q1 14Q3 13Q1 13Q3 12Q1 12Q3 11Q1 11Q3 10Q1 10Q3 09Q1 09Q3 08Q1 08Q3 07
Confidence levels
• Condence levels increased amongst exporters in Q4 2014. In particular, manufacturing rms are
noticeably more condent than they were in Q3 that their turnover will increase over the next year.
Service exporters are marginally less condent, but they still return a very high gure by historical
levels.
EXPORT INDEX OVER THE PAST YEAR (2007 = 100)
Q4 13 Q1 14 Q2 14 Q3 14 Q4 14
112.69 117.03 119.27 116.93 117.43
The DHL/BCC Trade Condence Index (TCI) is a measure of the UK’s exporting health. By analysing trends in
trading activity and key factors of exporting rms’ performance, the TCI gives a truly comprehensive picture of the
UK’s internationally-trading business community. The TCI is generated from two data sources: the BCC’s
Quarterly Economic Survey (Condence Indicator) and Chamber documentation services (Volume of ExportDocumentation).
CONFIDENCE INDICATOR
Q4 2014
Many types of exports require supporting commercial documentation. Chambers of Commerce issue
documentation required for exports outside the EU and as a result have amassed a signicant dataset
around UK goods exports. The TCI uses data collected from this process to show both an index of
documentation and regional comparisons of exporting activity. (Further details can be found in the
methodology on page 26).

7/21/2019 Quarterly International Trade Outlook (QITO) for 2014 Q4
http://slidepdf.com/reader/full/quarterly-international-trade-outlook-qito-for-2014-q4 5/285
Export index
• The volume of trade documents issued increased on the quarter and the year in Q4 2014.
• The index number reecting the volume of trade documents issued by Chambers of Commerce
across the UK stood at 117.43 in Q4 2014.
Percentage Change (%)
Index number
2007=100Recent quarter compared
to last year
Recent quartercompared to previous
quarter
Volume index
of
export
documentation
117.43 4.2% 0.4%
-6
-3
0
3
6
9
12
15
Quarter on a year earlier
Qtr on Qtr
N IrelandWalesN EastS WestE MidsW MidsEastY&HScotlandN WestS EastLondon
% c
h a n g e
Regional comparison - export index
% change in documents issued by Chamber
National
There was an increase in the volume of trade documents issued on the quarter. The index stood at 117.43 in Q4 2014. This
represents a rise of 0.43% on Q3 2014, and a rise of 4.21% on the same quarter in 2013. The Q4 2014 gure is the third highest
on record. The highest was 119.27 in Q2 2014.
Regions and Nations
The results were mixed across the regions and nations of the UK in Q4 2014. The highest yearly increase was recorded in
Wales (+12.5%). This was followed by London (+9.1%) and Yorkshire & the Humber (+8.2%). The South West (-4.1%) and the
North West (-3.1%) saw a negative change in volumes.
Q4 2014

7/21/2019 Quarterly International Trade Outlook (QITO) for 2014 Q4
http://slidepdf.com/reader/full/quarterly-international-trade-outlook-qito-for-2014-q4 6/286
Export and condence balances
Export orders balance stagnates
• The export orders balance was unchanged in
the fourth quarter of 2014. It remains at +13%, the
lowest since Q4 2011. The lowest gure on record
was -36% in Q1 2009.
• Further breakdown of the export orders
balance shows that 34% of exporters reported
that their export orders increased in Q4 2014.
While 21% of respondents stated that they
decreased, and 44% stated that orders remained
constant.
-40
-30
-20
-10
0
10
20
30
40
Q3 14Q1 14Q3 13Q1 13Q3 12Q1 12Q3 11Q1 11Q3 10Q1 10Q3 09Q1 09Q3 08Q1 08Q3 07
----Recession----
Balance of firms reporting an increase in export orders
% b
a l a n c e
Export Orders
50
Export orders
-40
-30
-20
-10
0
10
20
30
40
Q3 14Q1 14Q3 13Q1 13Q3 12Q1 12Q3 11Q1 11Q3 10Q1 10Q3 09Q1 09Q3 08Q1 08Q3 07
----Recession----
Balance of firms reporting an increase in export sales
a
a n c e
Export Sales
50
Export sales
Export sales indicator remains unchanged
• The export sales balance stayed at +19% in the
fourth quarter of 2014. This is the lowest since
Q4 2011. The lowest gure on record was -27% in
Q1 2009.
• Further breakdown of the export sales balance
shows that 36% of exporters reported that theirexport orders increased in Q4 2013, 18% of
respondents stated that they decreased, and
46% stated that orders remained constant.
10
20
30
40
50
60
70
80
Q3 14Q1 14Q3 13Q1 13Q3 12Q1 12Q3 11Q1 11Q3 10Q1 10Q3 09Q1 09Q3 08Q1 08Q3 07
----Recession----
Percentage of firms who expect profitability to improve over the next 12 months
% o
f fi r m s
Profitability
Protability condence
The balance of rms who expect protability to
improve falls
• Exporters’ condence that their protability
will improve over the next twelve months
remained high by historical standards. However,
for the fourth quarter of 2014 the balance of
rms that expect their protability to improve
decreased, from +50% to +44%.
• Further breakdown reveals that 58% expect
protability will increase, 28% of exporters
reported they expect no change in protability
and 14% expect protability to worsen.
Balance gures are determined by subtracting the percentage of companies reporting decreases in a factor from the percentage of
companies reporting increases.
7/21/2019 Quarterly International Trade Outlook (QITO) for 2014 Q4
http://slidepdf.com/reader/full/quarterly-international-trade-outlook-qito-for-2014-q4 7/287
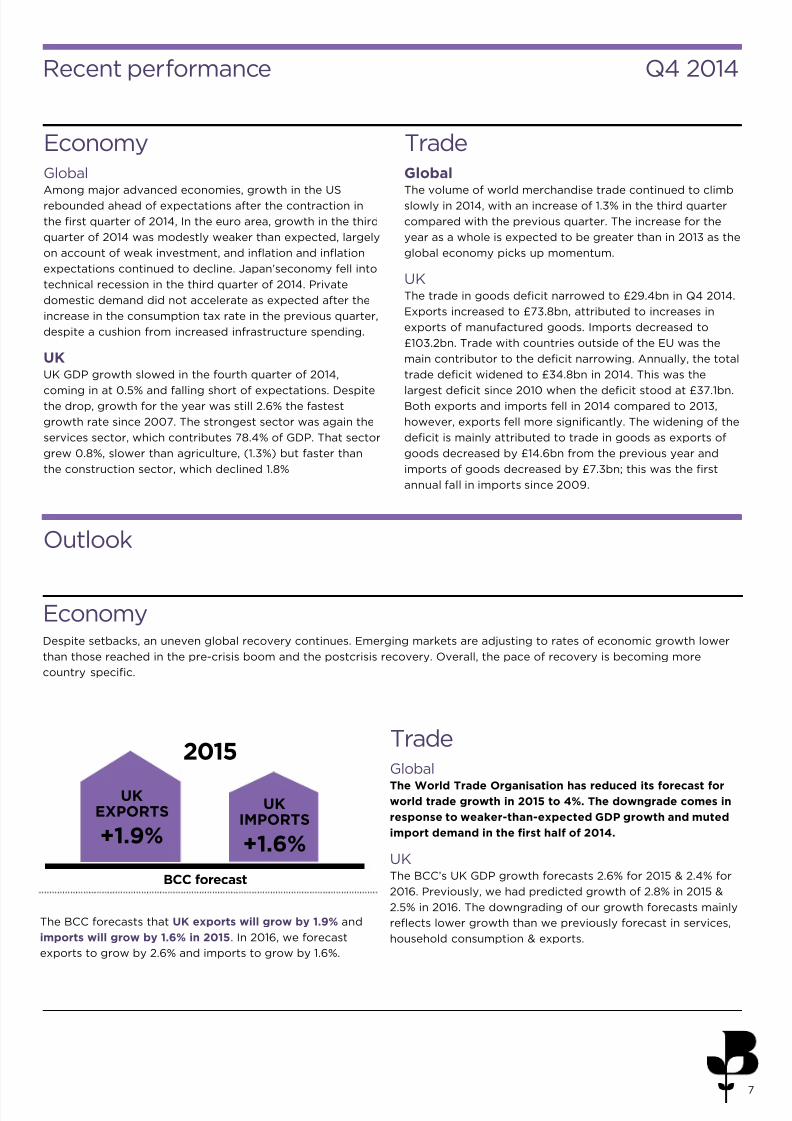
EconomyGlobal
Among major advanced economies, growth in the USrebounded ahead of expectations after the contraction in
the rst quarter of 2014, In the euro area, growth in the third
quarter of 2014 was modestly weaker than expected, largely
on account of weak investment, and ination and ination
expectations continued to decline. Japan’seconomy fell into
technical recession in the third quarter of 2014. Private
domestic demand did not accelerate as expected after the
increase in the consumption tax rate in the previous quarter,
despite a cushion from increased infrastructure spending.
UK
UK GDP growth slowed in the fourth quarter of 2014,
coming in at 0.5% and falling short of expectations. Despitethe drop, growth for the year was still 2.6% the fastest
growth rate since 2007. The strongest sector was again the
services sector, which contributes 78.4% of GDP. That sector
grew 0.8%, slower than agriculture, (1.3%) but faster than
the construction sector, which declined 1.8%
TradeGlobal
The volume of world merchandise trade continued to climbslowly in 2014, with an increase of 1.3% in the third quarter
compared with the previous quarter. The increase for the
year as a whole is expected to be greater than in 2013 as the
global economy picks up momentum.
UKThe trade in goods decit narrowed to £29.4bn in Q4 2014.
Exports increased to £73.8bn, attributed to increases in
exports of manufactured goods. Imports decreased to
£103.2bn. Trade with countries outside of the EU was the
main contributor to the decit narrowing. Annually, the total
trade decit widened to £34.8bn in 2014. This was the
largest decit since 2010 when the decit stood at £37.1bn.Both exports and imports fell in 2014 compared to 2013,
however, exports fell more signicantly. The widening of the
decit is mainly attributed to trade in goods as exports of
goods decreased by £14.6bn from the previous year and
imports of goods decreased by £7.3bn; this was the rst
annual fall in imports since 2009.
Recent performance
The BCC forecasts that UK exports will grow by 1.9% and
imports will grow by 1.6% in 2015. In 2016, we forecast
exports to grow by 2.6% and imports to grow by 1.6%.
UK
EXPORTS
+1.9%
BCC forecast
Outlook
EconomyDespite setbacks, an uneven global recovery continues. Emerging markets are adjusting to rates of economic growth lower
than those reached in the pre-crisis boom and the postcrisis recovery. Overall, the pace of recovery is becoming more
country specic.
TradeGlobalThe World Trade Organisation has reduced its forecast for
world trade growth in 2015 to 4%. The downgrade comes in
response to weaker-than-expected GDP growth and muted
import demand in the rst half of 2014.
UKThe BCC’s UK GDP growth forecasts 2.6% for 2015 & 2.4% for
2016. Previously, we had predicted growth of 2.8% in 2015 &
2.5% in 2016. The downgrading of our growth forecasts mainly
reects lower growth than we previously forecast in services,
household consumption & exports.
Q4 2014
UK
IMPORTS
+1.6%
2015

7/21/2019 Quarterly International Trade Outlook (QITO) for 2014 Q4
http://slidepdf.com/reader/full/quarterly-international-trade-outlook-qito-for-2014-q4 8/288
Country factsheetsthat will feature over thecourse of 2014 reports:
Factsheets
The dynamics of the global economy have changed with a new set of fast-growing markets
challenging the position of the established advanced economies. The map below outlines
24 priority markets which are becoming more important in terms of their growth potential and
global inuence. These countries have been identied to have strong growth prospects andstrategic importance for business.
8

7/21/2019 Quarterly International Trade Outlook (QITO) for 2014 Q4
http://slidepdf.com/reader/full/quarterly-international-trade-outlook-qito-for-2014-q4 9/289
Q1 Q2 Q3 Q4
Kenya Taiwan Hungary Japan
Ghana Cambodia Slovakia Philippines
Kuwait Mozambique Kazakhstan Algeria
Morocco Chile Myanmar Angola
Australia Egypt Tanzania New Zealand
China India Brazil United States
This publication series presents facts and gures in an ‘at-a-glance’ factsheet for each
country. These factsheets are a concise resource for businesses seeking to trade, with easy-to-digest
information on the economic outlook, sector growth, trade outlook and business opportunities within
those markets.
Please visit our dedicated international trade website to access additional information on
trade related information and online versions of the factsheets:
www.exportbritain.org.uk
9
7/21/2019 Quarterly International Trade Outlook (QITO) for 2014 Q4
http://slidepdf.com/reader/full/quarterly-international-trade-outlook-qito-for-2014-q4 10/2810
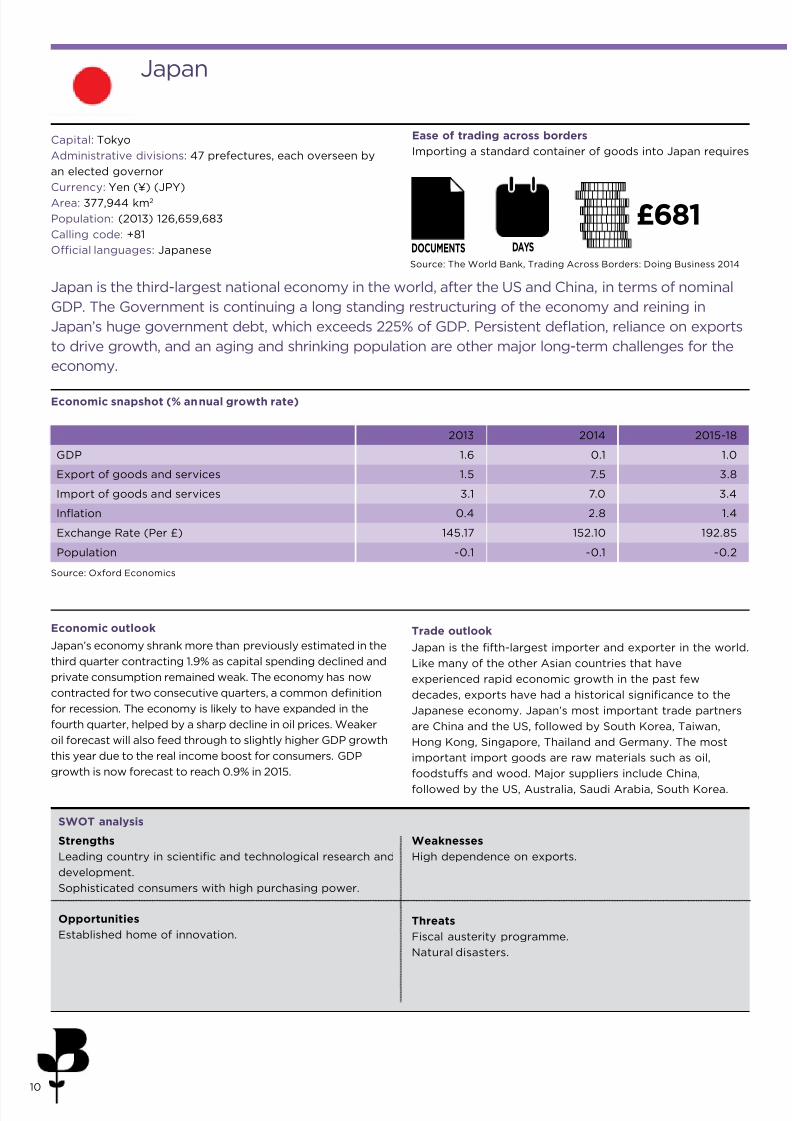
Japan is the third-largest national economy in the world, after the US and China, in terms of nominal
GDP. The Government is continuing a long standing restructuring of the economy and reining in
Japan’s huge government debt, which exceeds 225% of GDP. Persistent deation, reliance on exports
to drive growth, and an aging and shrinking population are other major long-term challenges for the
economy.
Source: Oxford Economics
Economic snapshot (% annual growth rate)
Japan’s economy shrank more than previously estimated in the
third quarter contracting 1.9% as capital spending declined and
private consumption remained weak. The economy has now
contracted for two consecutive quarters, a common denition
for recession. The economy is likely to have expanded in the
fourth quarter, helped by a sharp decline in oil prices. Weaker
oil forecast will also feed through to slightly higher GDP growth
this year due to the real income boost for consumers. GDP
growth is now forecast to reach 0.9% in 2015.
Economic outlook
Japan is the fth-largest importer and exporter in the world.
Like many of the other Asian countries that have
experienced rapid economic growth in the past few
decades, exports have had a historical signicance to the
Japanese economy. Japan’s most important trade partners
are China and the US, followed by South Korea, Taiwan,
Hong Kong, Singapore, Thailand and Germany. The most
important import goods are raw materials such as oil,
foodstuffs and wood. Major suppliers include China,
followed by the US, Australia, Saudi Arabia, South Korea.
Trade outlook
Japan
Strengths
Leading country in scientic and technological research and
development.
Sophisticated consumers with high purchasing power.
Weaknesses
High dependence on exports.
Opportunities
Established home of innovation.
Threats
Fiscal austerity programme.
Natural disasters.
SWOT analysis
Capital: Tokyo
Administrative divisions: 47 prefectures, each overseen by
an elected governor
Currency: Yen (¥) (JPY)
Area: 377,944 km2
Population: (2013) 126,659,683
Calling code: +81
Ofcial languages: Japanese
Ease of trading across borders
Importing a standard container of goods into Japan requires
Source: The World Bank, Trading Across Borders: Doing Business 2014
5DOCUMENTS
£681DAYS
11
2013 2014 2015-18
GDP 1.6 0.1 1.0
Export of goods and services 1.5 7.5 3.8
Import of goods and services 3.1 7.0 3.4
Ination 0.4 2.8 1.4
Exchange Rate (Per £) 145.17 152.10 192.85
Population -0.1 -0.1 -0.2
7/21/2019 Quarterly International Trade Outlook (QITO) for 2014 Q4
http://slidepdf.com/reader/full/quarterly-international-trade-outlook-qito-for-2014-q4 11/2811
2011 2012 2013 2014 2015 2016 2017 2018 2019 2020
UK Asia North AmericaEurope
0
5
10
15
20
% o
f t o t a l e x p o r t s i n t o J a p a
n
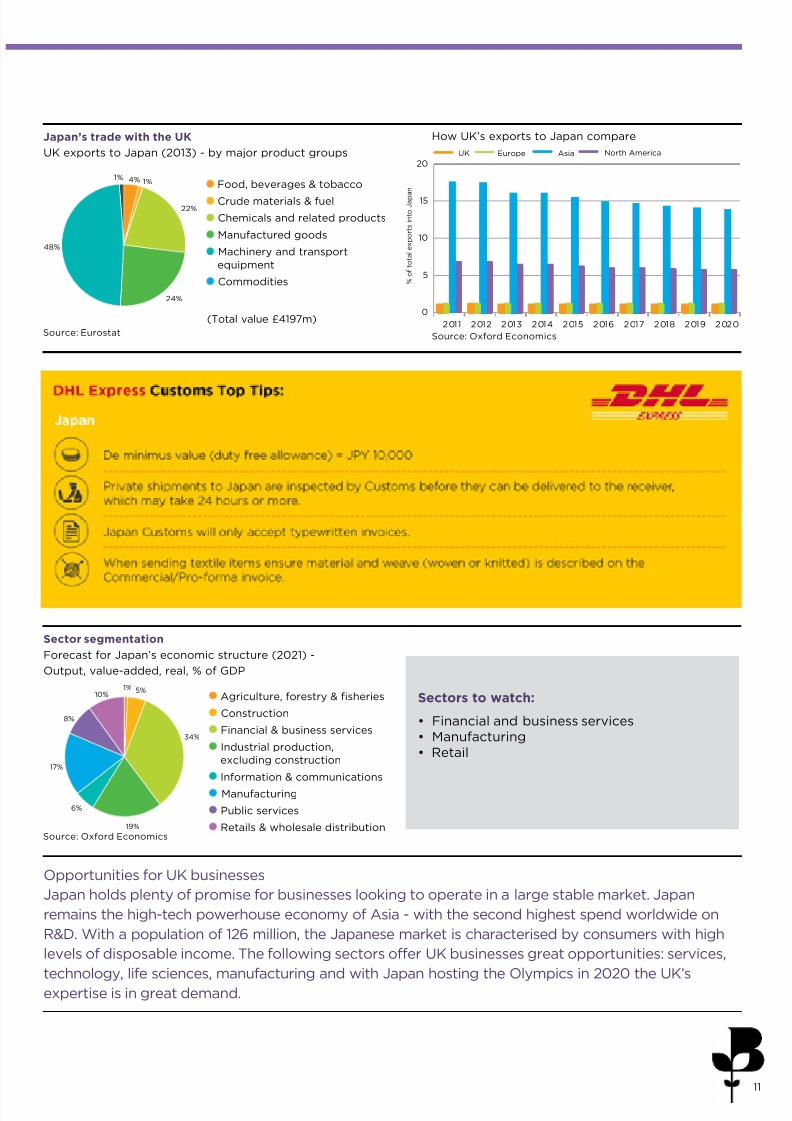
How UK’s exports to Japan compareJapan’s trade with the UK
UK exports to Japan (2013) - by major product groups
Food, beverages & tobacco
Crude materials & fuel
Chemicals and related products
Manufactured goods
Machinery and transport
equipment
Commodities
(Total value £4197m)
Sectors to watch:
• Financial and business services• Manufacturing• Retail
Sector segmentation
Agriculture, forestry & sheries
Construction
Financial & business services
Industrial production,
excluding construction
Information & communications Manufacturing
Public services
Retails & wholesale distribution
Forecast for Japan’s economic structure (2021) -
Output, value-added, real, % of GDP
4% 1%
48%
22%
24%
1%
1%
34%
19%
6%
8%
5%
17%
10%
Source: Oxford EconomicsSource: Eurostat
Source: Oxford Economics
Opportunities for UK businesses
Japan holds plenty of promise for businesses looking to operate in a large stable market. Japan
remains the high-tech powerhouse economy of Asia - with the second highest spend worldwide on
R&D. With a population of 126 million, the Japanese market is characterised by consumers with high
levels of disposable income. The following sectors offer UK businesses great opportunities: services,
technology, life sciences, manufacturing and with Japan hosting the Olympics in 2020 the UK’sexpertise is in great demand.
7/21/2019 Quarterly International Trade Outlook (QITO) for 2014 Q4
http://slidepdf.com/reader/full/quarterly-international-trade-outlook-qito-for-2014-q4 12/2812
Philippines
Capital: Manila
Largest city: Quezon City
Administrative divisions: 17 regions, 81 provinces
Currency: Peso (PHP)
Area: 300,000 km2
Population: (2014) 100,617,630
Calling code: +63
Ofcial languages: Filipino, English
The national economy of the Philippines is one of the emerging markets in the world. A newly
industrialised country, the Philippine economy has been transitioning from one based on agriculture to
one based more on services and manufacturing. The Philippine economy is expected to become the
fth-largest economy in Asia and the largest economy in the Southeast Asian region by 2050. The
economy has weathered global economic and nancial downturns better than its regional peers due
to minimal exposure to troubled international securities, lower dependence on exports, relatively
resilient domestic consumption, and a rapidly expanding business process outsourcing industry.
Source: Oxford Economics
Economic outlook
The outlook for the Philippine economy remains optimistic
notwithstanding the slightly disappointing data for Q3 2014.
This positive view reects the recent plunge in world oil
prices which should prove highly benecial to the country.
The Philippines is one of the countries that stands most to
gain from the fall in oil prices. The Philippine economy is
expected to grow faster than previously forecast as cheaper
oil raises external demand and reinforces the positive trendin private investment (by raising company protability) and
consumption (by boosting purchasing power), growth is
expected to reach 6.5% this year.
Trade outlook
Since the 1980s, the Philippines has opened its economy to
foreign markets, and established a network of free trade
agreements with several countries. The US is one of the
Philippines’ top trading partners. The Philippines largely
imports electronic products, mineral fuels, machinery and
transport equipment, iron and steel, textile fabrics, grains,
chemicals, plastic. The largest importers into the Philippines
include Japan, China, Singapore, South Korea, Taiwan andThailand.
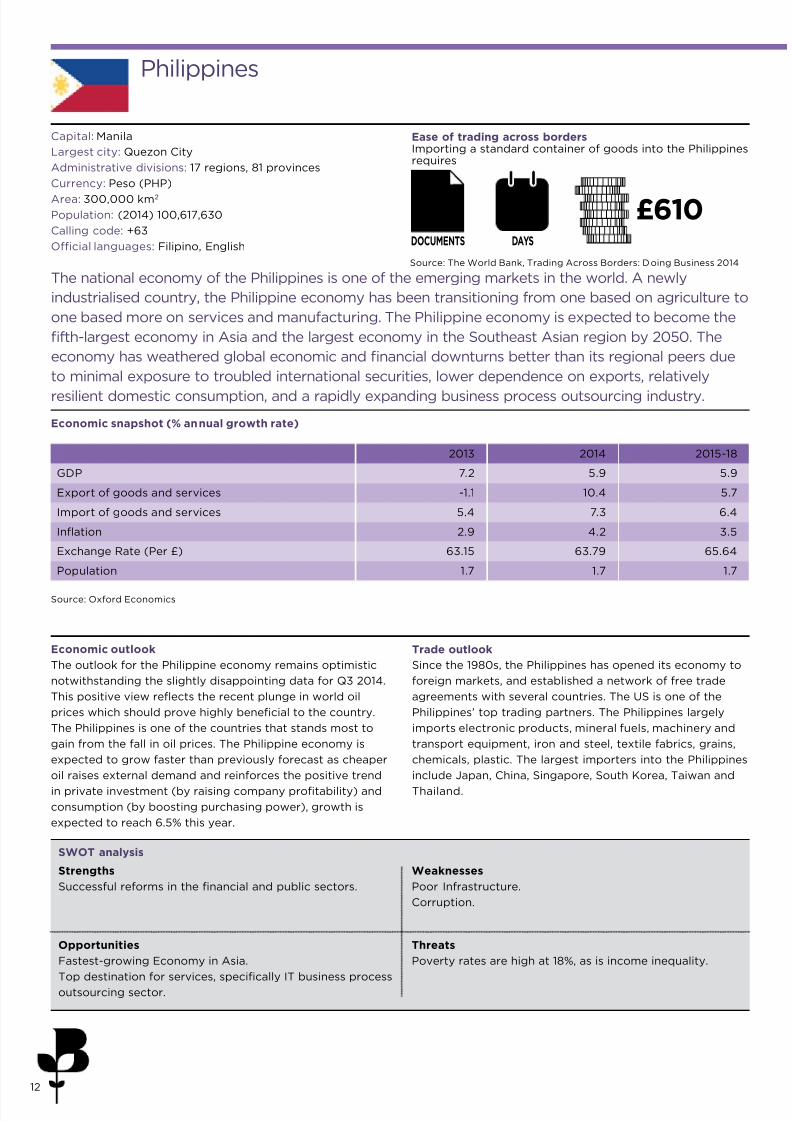
Ease of trading across bordersImporting a standard container of goods into the Philippinesrequires
Source: The World Bank, Trading Across Borders: Doing Business 2014
7DOCUMENTS
£610DAYS
15
Strengths
Successful reforms in the nancial and public sectors.
Weaknesses
Poor Infrastructure.
Corruption.
Opportunities
Fastest-growing Economy in Asia.
Top destination for services, specically IT business processoutsourcing sector.
Threats
Poverty rates are high at 18%, as is income inequality.
Economic snapshot (% annual growth rate)
SWOT analysis
2013 2014 2015-18
GDP 7.2 5.9 5.9
Export of goods and services -1.1 10.4 5.7
Import of goods and services 5.4 7.3 6.4
Ination 2.9 4.2 3.5
Exchange Rate (Per £) 63.15 63.79 65.64
Population 1.7 1.7 1.7

7/21/2019 Quarterly International Trade Outlook (QITO) for 2014 Q4
http://slidepdf.com/reader/full/quarterly-international-trade-outlook-qito-for-2014-q4 13/2813
2011 2012 2013 2014 2015 2016 2017 2018 2019 2020
UK Asia North AmericaEurope
0
1
2
3
4
5
% o
f t o t a l e x p o r t s i n t o P h i l i p p i n e s
Opportunities for UK businesses
The Philippines is known as the ‘Rising Tiger of Asia’ with growth outpacing its other ASEAN
neighbours. The Philippines is one of the countries in Asia enjoying economic success opening up a
wide range of opportunities. The Philippines offers numerous opportunities for UK businesses with a
market of 103 million people. These are highlighted in the Investment Priorities Plan (IPP) which
identies priority investment areas which the Government is actively promoting. The current IPP lists
opportunities in infrastructure projects, knowledge-based services such IT services, energy, greenprojects, iron and steel, and hospital/medical services.
Food, beverages & tobacco Crude materials & fuel
Chemicals and related
products
Manufactured goods
Machinery and transport
equipment
Commodities
(Total value £323m)
5%
20
21%
53%
1%
UK exports to Philippines (2013) - by major product groupsHow UK exports to Philippines comparePhilippines’ trade with the UK
Sectors to watch:
• Industrial production excl. Construction• Retail• Manufacturing
Sector segmentation
Forecast for the Philippines’ economic structure (2021) -
Output, value-added, real, % of GDP
Source: Oxford EconomicsSource: Eurostat
Source: Oxford Economics
Agriculture, forestry & sheries
Construction
Financial & business services
Industrial production,
excluding construction
Information & communications
Manufacturing
Public services
Retails & wholesale distribution
9%
14%
24%3%
6%
9%
20%
15%

7/21/2019 Quarterly International Trade Outlook (QITO) for 2014 Q4
http://slidepdf.com/reader/full/quarterly-international-trade-outlook-qito-for-2014-q4 14/2814
Algeria
Capital: Algiers
Largest city: Algiers
Administrative divisions: 48 provinces
Currency: Algerian dinar (DZD)
Area: 2,381,741 km2
Population: (2014) 37,900,000
Calling code: +213
Ofcial language: Arabic
Algeria is Africa’s largest country by area, and the tenth-largest in the world. Algeria is classied as an
upper middle income country. Successive governments have failed to break the Algerian economy’s
excessive dependence on the global oil and gas market. Therefore, the energy sector still accounts for
more than one-third of the gross domestic product (GDP) in Algeria, two-thirds of government
revenue and about 98% of exports.
Source: Oxford Economics
Economic snapshot (% annual growth rate)
Economic outlook
GDP growth in 2014 is now expected at 4%, up from 2.8% in
the previous year. Following setbacks to output in 2013, the
hydrocarbon sector expanded for the rst time in eight
years, albeit only modestly. But the oil and gas sector still
faces declining capacity, which will require heavy
investment to reverse. As a result, GDP is expected to slow
to around 3% this year, before a modest pick-up towards 4%
in 2016-18 as energy prices start to rise again slowly.
Trade outlook
Oil and natural gas export revenues amounted to almost
$63.8 billion in 2013, down from $69.8 billion in the previous
year, mainly because of lower export volumes. Algeria’s oil
and gas export revenue has allowed the country to maintain a
comfortable level of foreign exchange reserves. Algeria
exports largely include crude petroleum (45%) and petroleum
gas (37%). Algerian imports are largely made up of cars
(8.3%), rened petroleum (7.5%) and wheat (3.7%). The top
export destinations of Algeria are Italy (15%), the US (15%),
Spain (12%), France (7.5%), and Canada (7.4%). Algeria largely
imports from France (14%), China (11%), Italy (9.8%), Spain
(8.5%), and Germany (4.8%).
Ease of trading across borders
Importing a standard container of goods into Algeria requires
Source: The World Bank, Trading Across Borders: Doing Business 2014
9DOCUMENTS
£887DAYS
26
Strengths
Substantial oil and gas reserves and production.
Weaknesses
Economy is likely to remain dependent on the hydrocarbons
sector.
Opportunities
Algerians have relatively high disposable incomes by Africanstandards.
Threats
Fiscal revenues are dependent on the oil and gas industry; aprolonged drop in global energy prices would therefore hurt
public nances.
SWOT analysis
2013 2014 2015-18
GDP 2.8 3.5 3.7
Export of goods and services -3.0 2.0 4.0
Import of goods and services 6.0 6.8 5.9
Ination 3.3 2.7 3.5
Exchange Rate (Per £) 118.10 115.38 128.51
Population 1.9 1.8 1.6

7/21/2019 Quarterly International Trade Outlook (QITO) for 2014 Q4
http://slidepdf.com/reader/full/quarterly-international-trade-outlook-qito-for-2014-q4 15/2815
2011 2012 2013 2014 2015 2016 2017 2018 2019 2020
UK Asia North AmericaEurope
0.0
0.2
0.4
0.6
0.8
1.0
% o
f t o t a l e x p o r t s i n t o A l g e r i a
3%
48%
22%
9%
17%
2%
21%
5%
15%
25%
15%
13% 4%
Opportunities for UK businesses
The Algerian state is putting large sums of money towards diversifying the economy while leaving the
doors open to foreign investment in a number of sectors (industry, agriculture, shing and
aquaculture, telecommunications, public works, improvement of the public sector and transport).
There are therefore enormous opportunities on offer. Algeria‘s signicant consumer base of 37 million
people offers opportunities for UK businesses in consumer goods, high technology, infrastructure and
construction services.
How UK exports to Algeria compareAlgeria’s trade with the UK
UK exports to Algeria (2013) - by major product groups
Sectors to watch:
• Financial & business services• Retail• Public services
Sector segmentation
Forecast for Africa’s economic structure (2021) -
Output, value-added, real, % of GDP
Source: Oxford EconomicsSource: Eurostat
Source: Oxford Economics
Agriculture, forestry & sheries
Construction
Financial & business services
Industrial production,
excluding construction
Information & communications
Manufacturing Public services
Retails & wholesale distribution
Food, beverages & tobacco
Crude materials & fuel
Chemicals and related
products
Manufactured goods
Machinery and transport
equipment
Commodities
(Total value £400m)
7/21/2019 Quarterly International Trade Outlook (QITO) for 2014 Q4
http://slidepdf.com/reader/full/quarterly-international-trade-outlook-qito-for-2014-q4 16/2816
Angola
Capital: Luanda
Largest city: Luanda
Administrative divisions: 18 provinces
Currency: Kwanza (AOA)
Area: 1,246,700 km2
Population: (2014) 18,498,000
Calling code: +244
Ofcial language: Portuguese
The economy of Angola grew by around 4.7% between 2010 and 2012. Against a backdrop of
strengthened governance, macroeconomic stability and surging commodity prices, Angola is set to
take its place on the global nancial scene. The oil industry still dominates the economy, accounting
for approximately 50% of Angola’s GDP and 95% of its exports. Shattered infrastructure resulting from
27 years of conict is being rapidly restored and will facilitate growth. Despite the challenges, Angola
offers huge potential to international investors seeking to enter today’s frontier markets.
Source: Oxford Economics
Economic snapshot (% annual growth rate)
Economic outlook
The Angolan economy rebounded strongly after several
years of low growth attributable to the lingering effects of
the global nancial crisis. Real GDP grew at an estimated
rate of 4.4% in 2013 as a result of the strong performance of
the energy, transportation and construction sectors. The
outlook for 2015 remains positive. This will be driven by a
combination of continued expansion in the oil and gas
sector and a public expenditure programme designed toencourage economic diversication.
Trade outlook
Petroleum products dominate Angola export trade gures.
Diamond production is yet another signicant contributor.
These two products constitute more than 80% of the total
export value. Angola exports products mainly to China,
France, the US and the EU. Portugal has been the leading
trade import partner of Angola. The country imports food,
textile products and consumer goods. Its key import partners
are South Africa, US, Brazil, UK, France, China and SouthKorea. As the Angolan economy is evolving, there is a gradual
increase in imports.
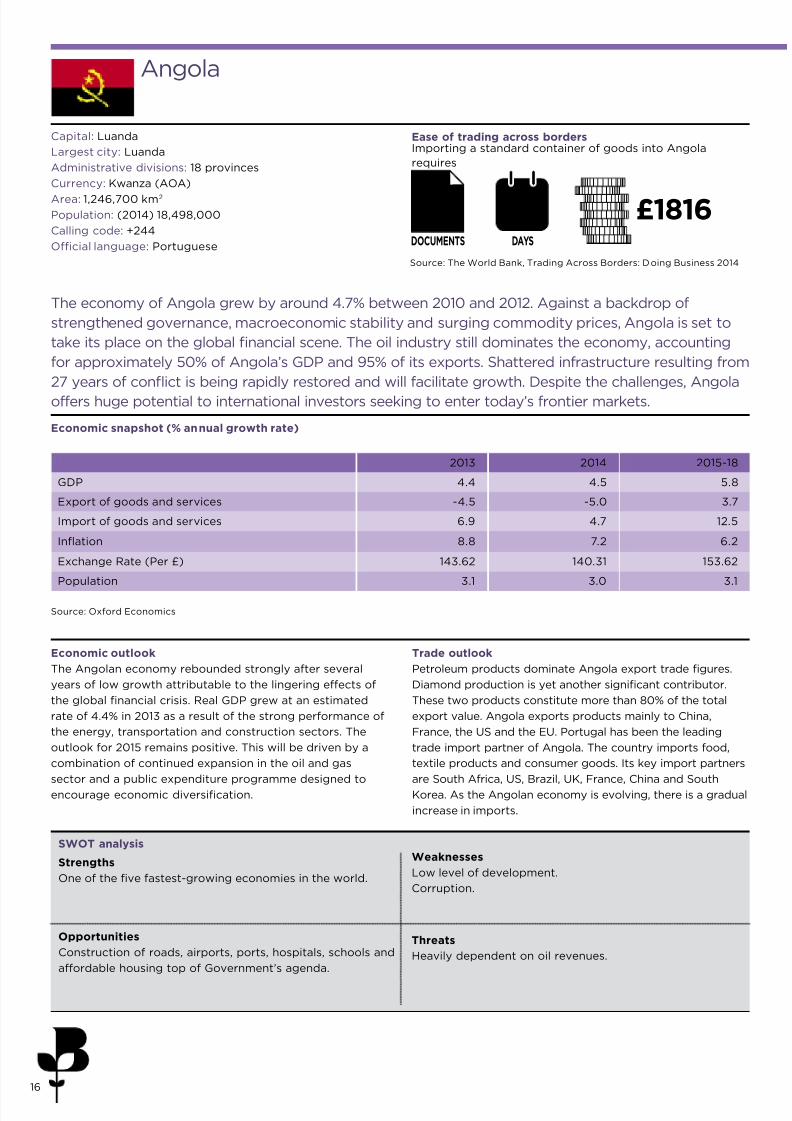
Importing a standard container of goods into Angola
requires
Ease of trading across borders
Source: The World Bank, Trading Across Borders: Doing Business 2014
9DOCUMENTS
£1816DAYS
43
Strengths
One of the ve fastest-growing economies in the world.
Weaknesses
Low level of development.
Corruption.
Opportunities
Construction of roads, airports, ports, hospitals, schools and
affordable housing top of Government’s agenda.
Threats
Heavily dependent on oil revenues.
SWOT analysis
2013 2014 2015-18
GDP 4.4 4.5 5.8
Export of goods and services -4.5 -5.0 3.7
Import of goods and services 6.9 4.7 12.5
Ination 8.8 7.2 6.2
Exchange Rate (Per £) 143.62 140.31 153.62
Population 3.1 3.0 3.1
7/21/2019 Quarterly International Trade Outlook (QITO) for 2014 Q4
http://slidepdf.com/reader/full/quarterly-international-trade-outlook-qito-for-2014-q4 17/2817
2011 2012 2013 2014 2015 2016 2017 2018 2019 2020
UK Asia North AmericaEurope
0.0
0.1
0.2
0.3
0.4
0.5
0.6
% o
f t o t a l e x p o r t s i n t o A n g o l a
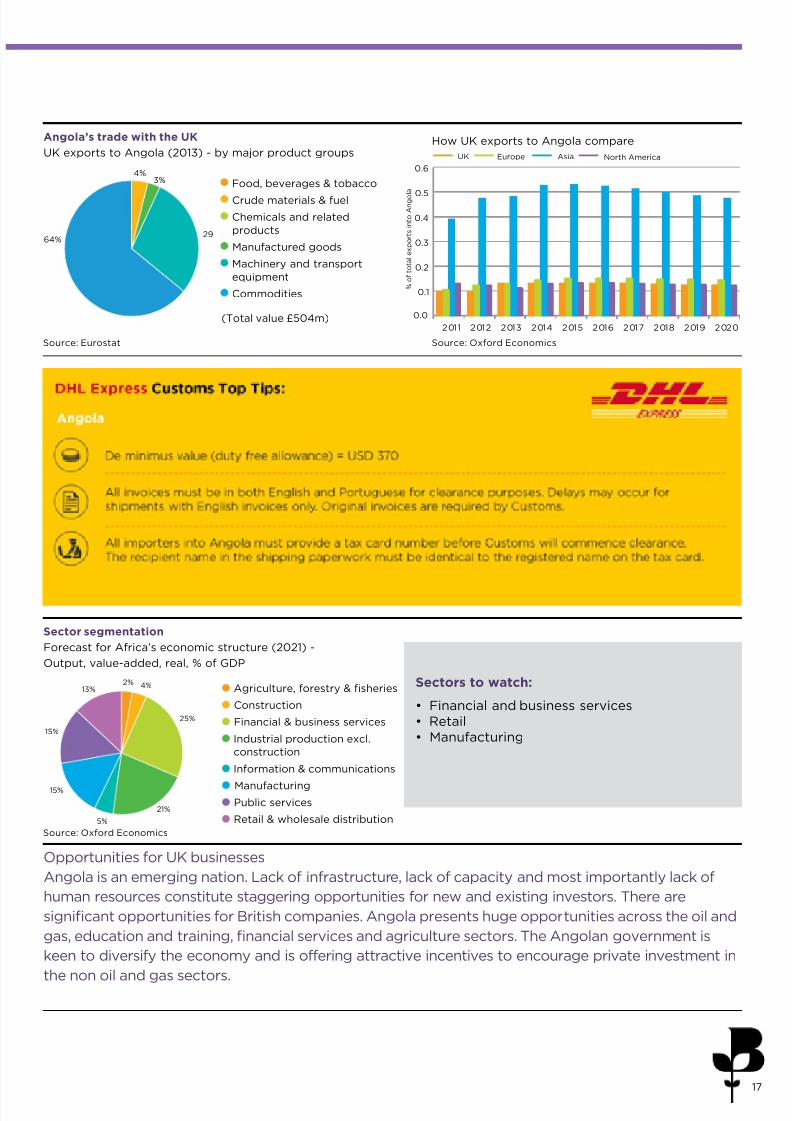
Food, beverages & tobacco
Crude materials & fuel
Chemicals and related
products
Manufactured goods
Machinery and transport
equipment
Commodities
(Total value £504m)
Agriculture, forestry & sheries
Construction
Financial & business services
Industrial production excl.
construction
Information & communications
Manufacturing
Public services
Retail & wholesale distribution
29
3%
64%
4%
Opportunities for UK businesses
Angola is an emerging nation. Lack of infrastructure, lack of capacity and most importantly lack of
human resources constitute staggering opportunities for new and existing investors. There are
signicant opportunities for British companies. Angola presents huge opportunities across the oil and
gas, education and training, nancial services and agriculture sectors. The Angolan government is
keen to diversify the economy and is offering attractive incentives to encourage private investment in
the non oil and gas sectors.
How UK exports to Angola compareAngola’s trade with the UK
UK exports to Angola (2013) - by major product groups
Sectors to watch:
• Financial and business services• Retail• Manufacturing
Sector segmentation
Forecast for Africa’s economic structure (2021) -
Output, value-added, real, % of GDP
Source: Oxford EconomicsSource: Eurostat
Source: Oxford Economics
2%
21%
5%
15%
25%
15%
13% 4%
7/21/2019 Quarterly International Trade Outlook (QITO) for 2014 Q4
http://slidepdf.com/reader/full/quarterly-international-trade-outlook-qito-for-2014-q4 18/2818
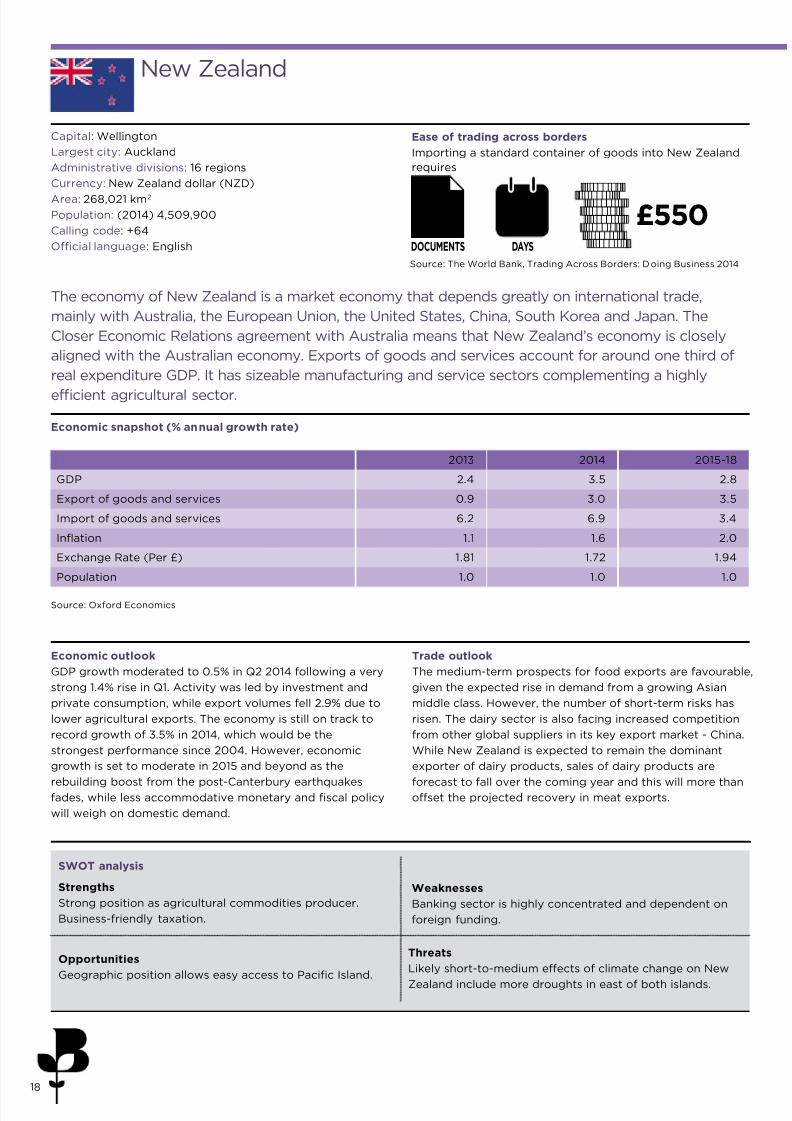
New Zealand
Capital: Wellington
Largest city: Auckland
Administrative divisions: 16 regions
Currency: New Zealand dollar (NZD)
Area: 268,021 km2
Population: (2014) 4,509,900
Calling code: +64
Ofcial language: English
The economy of New Zealand is a market economy that depends greatly on international trade,
mainly with Australia, the European Union, the United States, China, South Korea and Japan. The
Closer Economic Relations agreement with Australia means that New Zealand’s economy is closely
aligned with the Australian economy. Exports of goods and services account for around one third of
real expenditure GDP. It has sizeable manufacturing and service sectors complementing a highly
efcient agricultural sector.
Economic outlook
GDP growth moderated to 0.5% in Q2 2014 following a very
strong 1.4% rise in Q1. Activity was led by investment and
private consumption, while export volumes fell 2.9% due to
lower agricultural exports. The economy is still on track to
record growth of 3.5% in 2014, which would be the
strongest performance since 2004. However, economic
growth is set to moderate in 2015 and beyond as the
rebuilding boost from the post-Canterbury earthquakesfades, while less accommodative monetary and scal policy
will weigh on domestic demand.
Trade outlook
The medium-term prospects for food exports are favourable,
given the expected rise in demand from a growing Asian
middle class. However, the number of short-term risks has
risen. The dairy sector is also facing increased competition
from other global suppliers in its key export market - China.
While New Zealand is expected to remain the dominant
exporter of dairy products, sales of dairy products are
forecast to fall over the coming year and this will more thanoffset the projected recovery in meat exports.
Ease of trading across borders
Importing a standard container of goods into New Zealand
requires
6DOCUMENTS
£550DAYS
9
Strengths
Strong position as agricultural commodities producer.
Business-friendly taxation.
Weaknesses
Banking sector is highly concentrated and dependent on
foreign funding.
Opportunities
Geographic position allows easy access to Pacic Island.
Threats
Likely short-to-medium effects of climate change on New
Zealand include more droughts in east of both islands.
Source: The World Bank, Trading Across Borders: Doing Business 2014
Economic snapshot (% annual growth rate)
Source: Oxford Economics
SWOT analysis
2013 2014 2015-18
GDP 2.4 3.5 2.8
Export of goods and services 0.9 3.0 3.5
Import of goods and services 6.2 6.9 3.4
Ination 1.1 1.6 2.0
Exchange Rate (Per £) 1.81 1.72 1.94
Population 1.0 1.0 1.0
7/21/2019 Quarterly International Trade Outlook (QITO) for 2014 Q4
http://slidepdf.com/reader/full/quarterly-international-trade-outlook-qito-for-2014-q4 19/2819
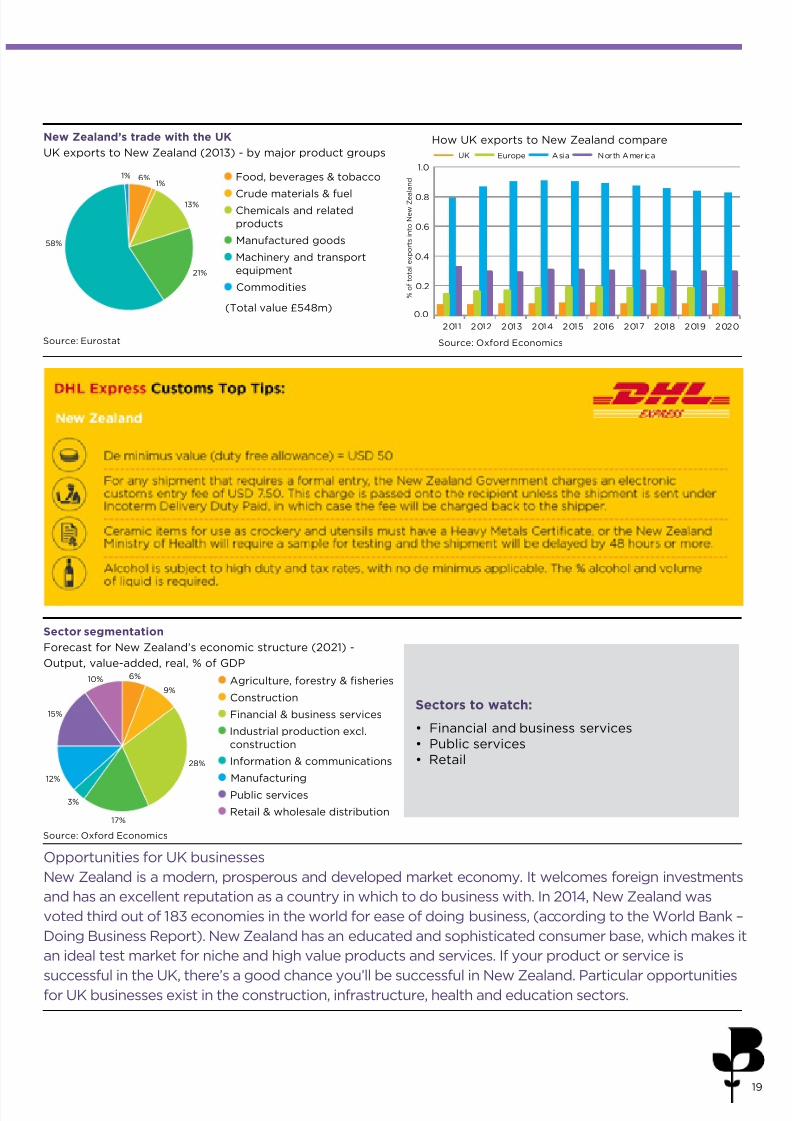
2011 2012 2013 2014 2015 2016 2017 2018 2019 2020
UK Asia North AmericaEurope
0.0
0.2
0.4
0.6
0.8
1.0
% o
f t o t a l e x p o r t s i n t o N e w Z
e a
l a n dFood, beverages & tobacco
Crude materials & fuel Chemicals and related
products
Manufactured goods
Machinery and transport
equipment
Commodities
(Total value £548m)
Sectors to watch:
• Financial and business services• Public services• Retail
1%
21%
6%
13%
1%
58%
17%
3%
9%
28%
12%
15%
10% 6%
Opportunities for UK businesses
New Zealand is a modern, prosperous and developed market economy. It welcomes foreign investments
and has an excellent reputation as a country in which to do business with. In 2014, New Zealand was
voted third out of 183 economies in the world for ease of doing business, (according to the World Bank –
Doing Business Report). New Zealand has an educated and sophisticated consumer base, which makes it
an ideal test market for niche and high value products and services. If your product or service is
successful in the UK, there’s a good chance you’ll be successful in New Zealand. Particular opportunitiesfor UK businesses exist in the construction, infrastructure, health and education sectors.
How UK exports to New Zealand compareNew Zealand’s trade with the UK
UK exports to New Zealand (2013) - by major product groups
Sector segmentation
Forecast for New Zealand’s economic structure (2021) -
Output, value-added, real, % of GDP
Source: Eurostat Source: Oxford Economics
Source: Oxford Economics
Agriculture, forestry & sheries
Construction
Financial & business services
Industrial production excl.
construction
Information & communications
Manufacturing Public services
Retail & wholesale distribution
7/21/2019 Quarterly International Trade Outlook (QITO) for 2014 Q4
http://slidepdf.com/reader/full/quarterly-international-trade-outlook-qito-for-2014-q4 20/2820
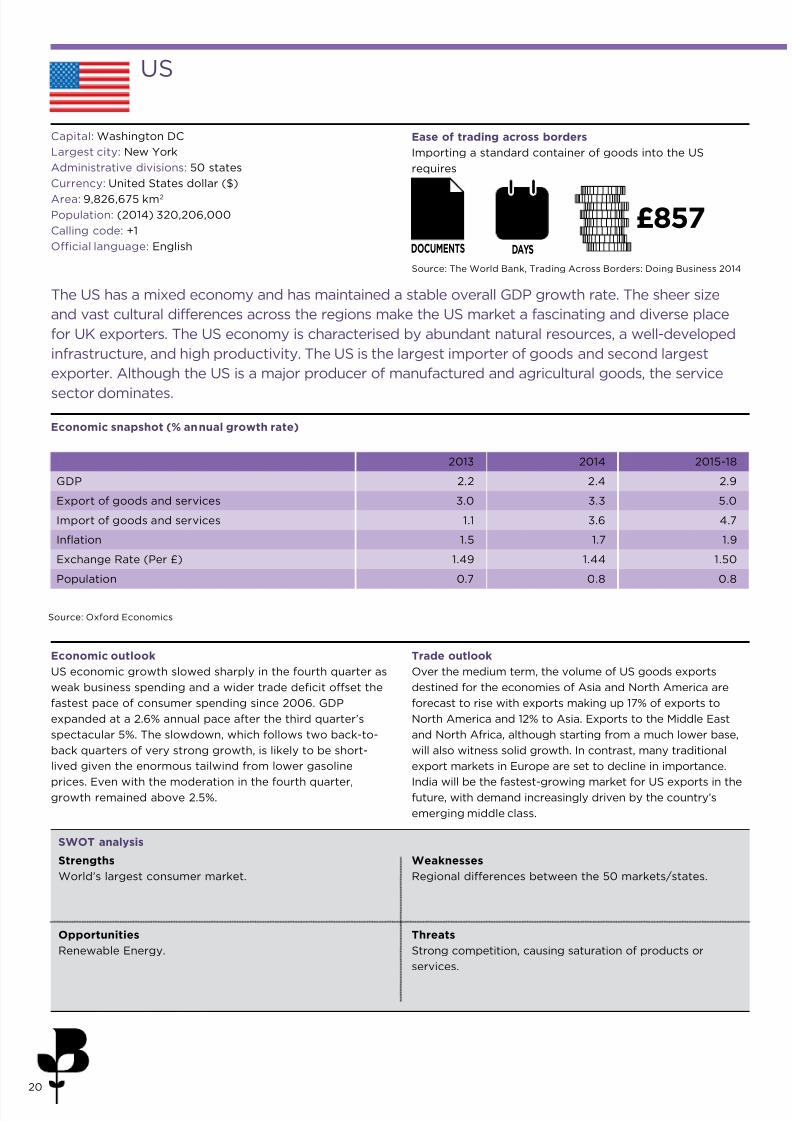
US
Capital: Washington DC
Largest city: New York
Administrative divisions: 50 states
Currency: United States dollar ($)
Area: 9,826,675 km2
Population: (2014) 320,206,000
Calling code: +1
Ofcial language: English
The US has a mixed economy and has maintained a stable overall GDP growth rate. The sheer size
and vast cultural differences across the regions make the US market a fascinating and diverse place
for UK exporters. The US economy is characterised by abundant natural resources, a well-developed
infrastructure, and high productivity. The US is the largest importer of goods and second largest
exporter. Although the US is a major producer of manufactured and agricultural goods, the service
sector dominates.
Source: Oxford Economics
Economic snapshot (% annual growth rate)
Economic outlook
US economic growth slowed sharply in the fourth quarter as
weak business spending and a wider trade decit offset the
fastest pace of consumer spending since 2006. GDP
expanded at a 2.6% annual pace after the third quarter’s
spectacular 5%. The slowdown, which follows two back-to-
back quarters of very strong growth, is likely to be short-
lived given the enormous tailwind from lower gasoline
prices. Even with the moderation in the fourth quarter,growth remained above 2.5%.
Trade outlook
Over the medium term, the volume of US goods exports
destined for the economies of Asia and North America are
forecast to rise with exports making up 17% of exports to
North America and 12% to Asia. Exports to the Middle East
and North Africa, although starting from a much lower base,
will also witness solid growth. In contrast, many traditional
export markets in Europe are set to decline in importance.
India will be the fastest-growing market for US exports in thefuture, with demand increasingly driven by the country’s
emerging middle class.
Ease of trading across borders
Importing a standard container of goods into the US
requires
Source: The World Bank, Trading Across Borders: Doing Business 2014
5DOCUMENTS
£857DAYS
5
Strengths
World’s largest consumer market.
Weaknesses
Regional differences between the 50 markets/states.
Opportunities
Renewable Energy.
Threats
Strong competition, causing saturation of products or
services.
SWOT analysis
2013 2014 2015-18
GDP 2.2 2.4 2.9
Export of goods and services 3.0 3.3 5.0
Import of goods and services 1.1 3.6 4.7
Ination 1.5 1.7 1.9
Exchange Rate (Per £) 1.49 1.44 1.50
Population 0.7 0.8 0.8
7/21/2019 Quarterly International Trade Outlook (QITO) for 2014 Q4
http://slidepdf.com/reader/full/quarterly-international-trade-outlook-qito-for-2014-q4 21/2821
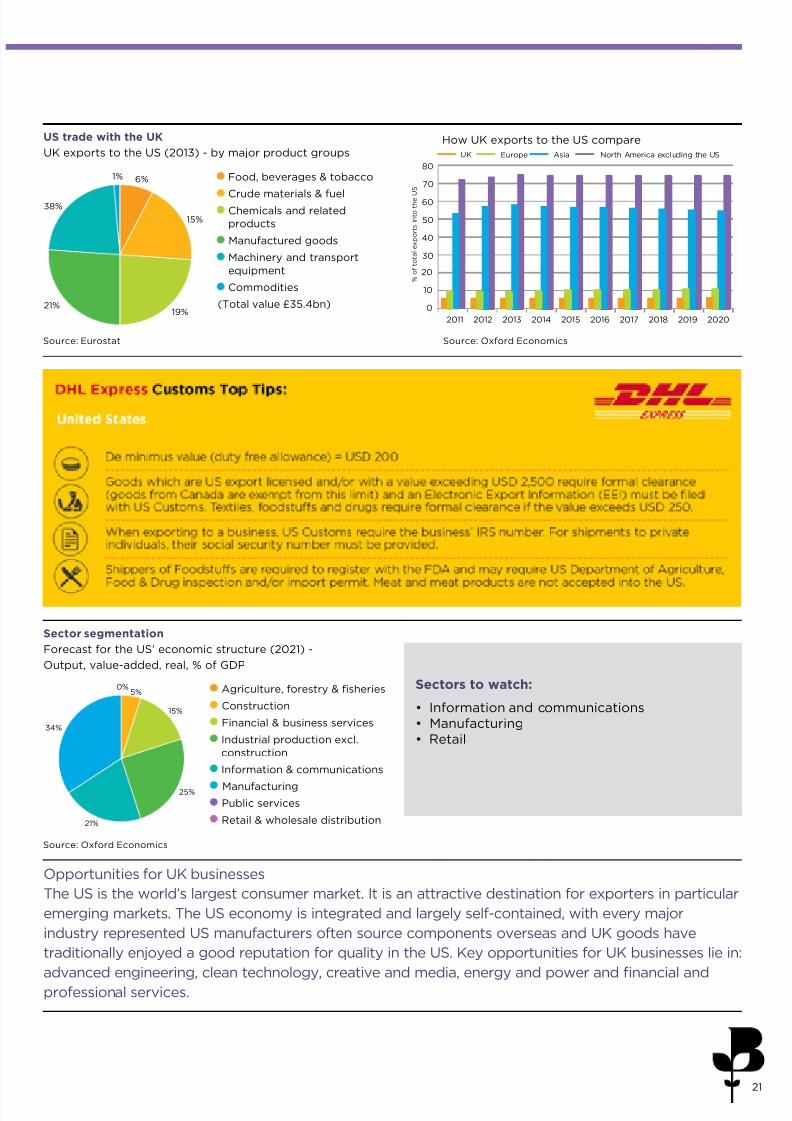
2011 2012 2013 2014 2015 2016 2017 2018 2019 2020
UK Asia North America excluding the USEurope
0
10
20
30
40
50
60
70
80
% o
f t o t a l e x p o r t s i n t o t h e U
S
Food, beverages & tobacco
Crude materials & fuel Chemicals and related
products
Manufactured goods
Machinery and transport
equipment
Commodities
(Total value £35.4bn)
15%
19%
6%
38%
21%
1%
Opportunities for UK businesses
The US is the world’s largest consumer market. It is an attractive destination for exporters in particular
emerging markets. The US economy is integrated and largely self-contained, with every major
industry represented US manufacturers often source components overseas and UK goods have
traditionally enjoyed a good reputation for quality in the US. Key opportunities for UK businesses lie in:
advanced engineering, clean technology, creative and media, energy and power and nancial andprofessional services.
How UK exports to the US compareUS trade with the UK
UK exports to the US (2013) - by major product groups
Sectors to watch:
• Information and communications• Manufacturing• Retail
Sector segmentation
Forecast for the US’ economic structure (2021) -
Output, value-added, real, % of GDP
Source: Oxford EconomicsSource: Eurostat
Source: Oxford Economics
Agriculture, forestry & sheries
Construction
Financial & business services
Industrial production excl.
construction
Information & communications
Manufacturing
Public services
Retail & wholesale distribution21%
15%
25%
34%
0%5%
7/21/2019 Quarterly International Trade Outlook (QITO) for 2014 Q4
http://slidepdf.com/reader/full/quarterly-international-trade-outlook-qito-for-2014-q4 22/2822
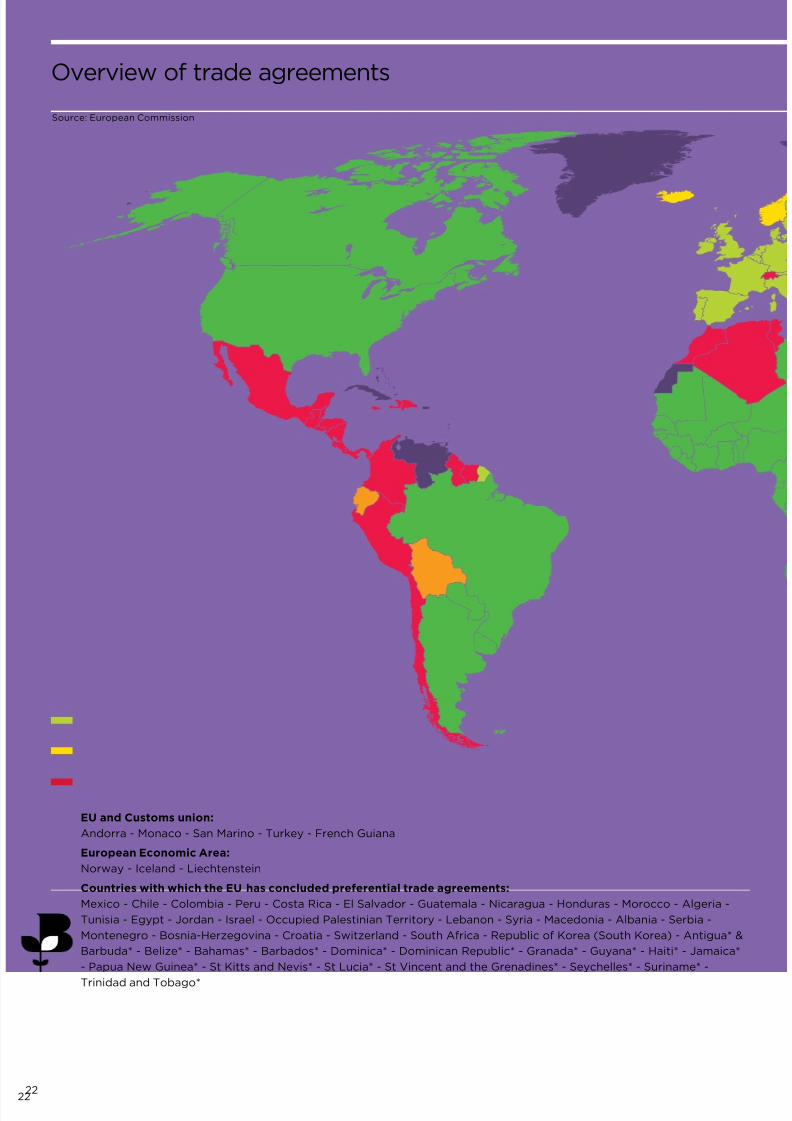
Overview of trade agreements
EU and Customs union:
Andorra - Monaco - San Marino - Turkey - French Guiana
European Economic Area:
Norway - Iceland - Liechtenstein
Countries with which the EU has concluded preferential trade agreements:
Mexico - Chile - Colombia - Peru - Costa Rica - El Salvador - Guatemala - Nicaragua - Honduras - Morocco - Algeria -
Tunisia - Egypt - Jordan - Israel - Occupied Palestinian Territory - Lebanon - Syria - Macedonia - Albania - Serbia -
Montenegro - Bosnia-Herzegovina - Croatia - Switzerland - South Africa - Republic of Korea (South Korea) - Antigua* &
Barbuda* - Belize* - Bahamas* - Barbados* - Dominica* - Dominican Republic* - Granada* - Guyana* - Haiti* - Jamaica*
- Papua New Guinea* - St Kitts and Nevis* - St Lucia* - St Vincent and the Grenadines* - Seychelles* - Suriname* -
Trinidad and Tobago*
Source: European Commission
7/21/2019 Quarterly International Trade Outlook (QITO) for 2014 Q4
http://slidepdf.com/reader/full/quarterly-international-trade-outlook-qito-for-2014-q4 23/2823
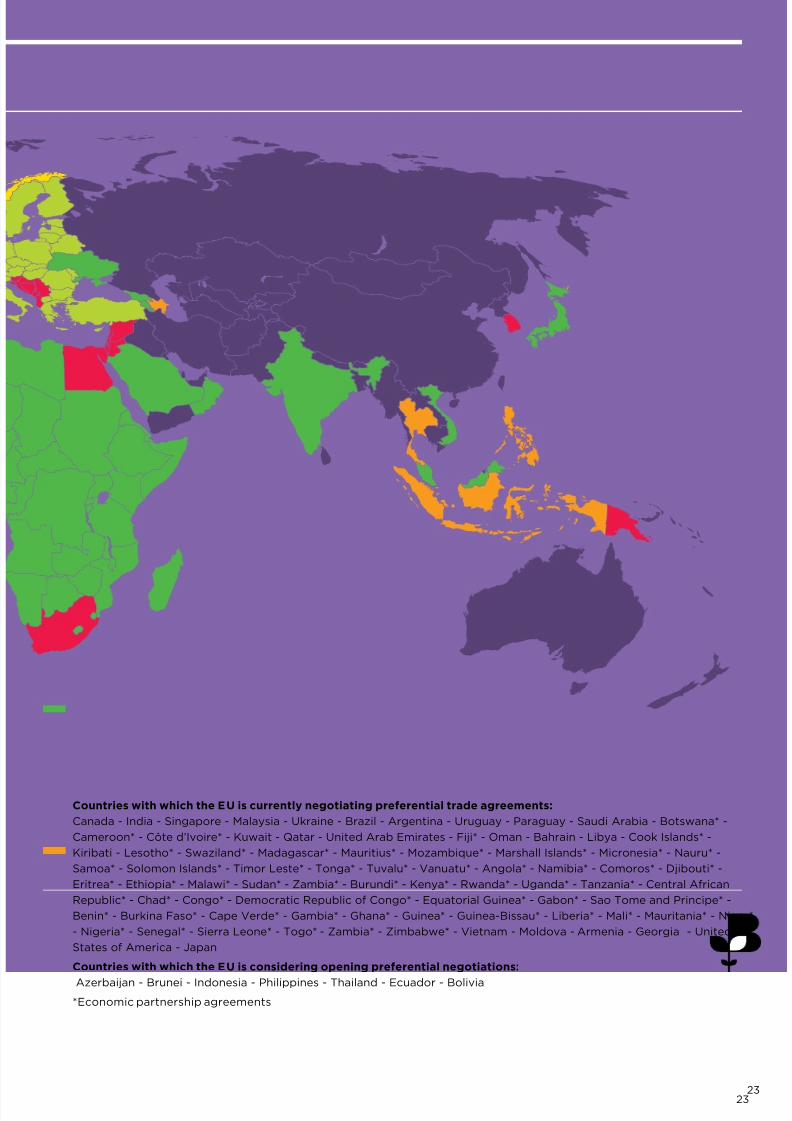
Countries with which the EU is currently negotiating preferential trade agreements:
Canada - India - Singapore - Malaysia - Ukraine - Brazil - Argentina - Uruguay - Paraguay - Saudi Arabia - Botswana* -
Cameroon* - Côte d’Ivoire* - Kuwait - Qatar - United Arab Emirates - Fiji* - Oman - Bahrain - Libya - Cook Islands* -
Kiribati - Lesotho* - Swaziland* - Madagascar* - Mauritius* - Mozambique* - Marshall Islands* - Micronesia* - Nauru* -
Samoa* - Solomon Islands* - Timor Leste* - Tonga* - Tuvalu* - Vanuatu* - Angola* - Namibia* - Comoros* - Djibouti* -
Eritrea* - Ethiopia* - Malawi* - Sudan* - Zambia* - Burundi* - Kenya* - Rwanda* - Uganda* - Tanzania* - Central African
Republic* - Chad* - Congo* - Democratic Republic of Congo* - Equatorial Guinea* - Gabon* - Sao Tome and Principe* -
Benin* - Burkina Faso* - Cape Verde* - Gambia* - Ghana* - Guinea* - Guinea-Bissau* - Liberia* - Mali* - Mauritania* - Niger*
- Nigeria* - Senegal* - Sierra Leone* - Togo* - Zambia* - Zimbabwe* - Vietnam - Moldova - Armenia - Georgia - United
States of America - Japan
Countries with which the EU is considering opening preferential negotiations:
Azerbaijan - Brunei - Indonesia - Philippines - Thailand - Ecuador - Bolivia
*Economic partnership agreements
23
7/21/2019 Quarterly International Trade Outlook (QITO) for 2014 Q4
http://slidepdf.com/reader/full/quarterly-international-trade-outlook-qito-for-2014-q4 24/28
Case study: ‘Our export journey’
Accredited Chambers of Commerce are Britain’s export hubs and are the premier
source of private sector, business-to-business support for international trade and
export. In addition to in-house support, Chambers also partner with government
agencies such as UKTI, to ensure companies get the best possible advice and help.
And it’s working. Amongst Chamber members, 22% were exporting in 2011 -
compared to over 35% today.
24
This section brings together the experiences of businesses who have embarked on their export journey. It gives a snapshot of
some of the challenges they faced when trying to expand their business’s share of exports or enter new markets.
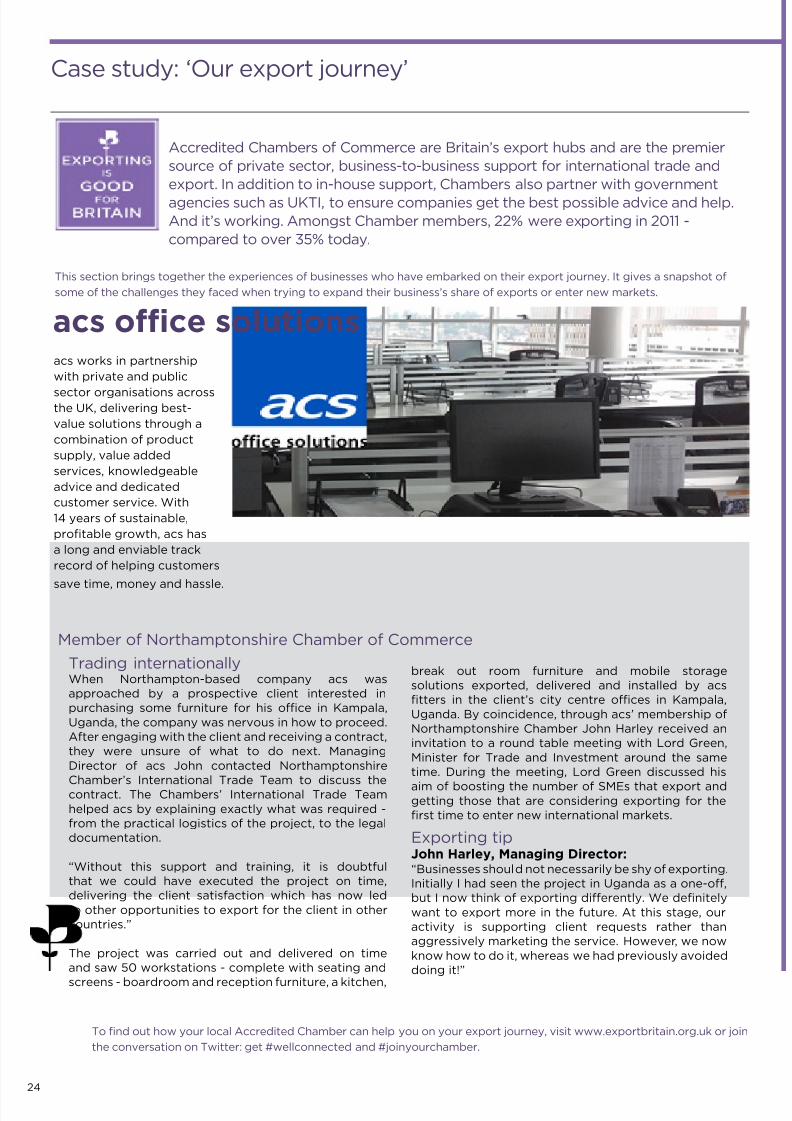
acs works in partnership
with private and public
sector organisations acrossthe UK, delivering best-
value solutions through a
combination of product
supply, value added
services, knowledgeable
advice and dedicated
customer service. With
14 years of sustainable,
protable growth, acs has
a long and enviable track
record of helping customers
save time, money and hassle.
Trading internationallyWhen Northampton-based company acs was
approached by a prospective client interested in
purchasing some furniture for his ofce in Kampala,
Uganda, the company was nervous in how to proceed.
After engaging with the client and receiving a contract,
they were unsure of what to do next. Managing
Director of acs John contacted Northamptonshire
Chamber’s International Trade Team to discuss thecontract. The Chambers’ International Trade Team
helped acs by explaining exactly what was required -
from the practical logistics of the project, to the legal
documentation.
“Without this support and training, it is doubtful
that we could have executed the project on time,
delivering the client satisfaction which has now led
to other opportunities to export for the client in other
countries.”
The project was carried out and delivered on time
and saw 50 workstations - complete with seating and
screens - boardroom and reception furniture, a kitchen,
Member of Northamptonshire Chamber of Commerce
break out room furniture and mobile storage
solutions exported, delivered and installed by acs
tters in the client’s city centre ofces in Kampala,
Uganda. By coincidence, through acs’ membership of
Northamptonshire Chamber John Harley received an
invitation to a round table meeting with Lord Green,
Minister for Trade and Investment around the same
time. During the meeting, Lord Green discussed his
aim of boosting the number of SMEs that export and
getting those that are considering exporting for the
rst time to enter new international markets.
Exporting tipJohn Harley, Managing Director:“Businesses should not necessarily be shy of exporting.
Initially I had seen the project in Uganda as a one-off,
but I now think of exporting differently. We denitely
want to export more in the future. At this stage, our
activity is supporting client requests rather than
aggressively marketing the service. However, we now
know how to do it, whereas we had previously avoided
doing it!”
To nd out how your local Accredited Chamber can help you on your export journey, visit www.exportbritain.org.uk or join
the conversation on Twitter: get #wellconnected and #joinyourchamber.
acs oce solutions
7/21/2019 Quarterly International Trade Outlook (QITO) for 2014 Q4
http://slidepdf.com/reader/full/quarterly-international-trade-outlook-qito-for-2014-q4 25/28
25
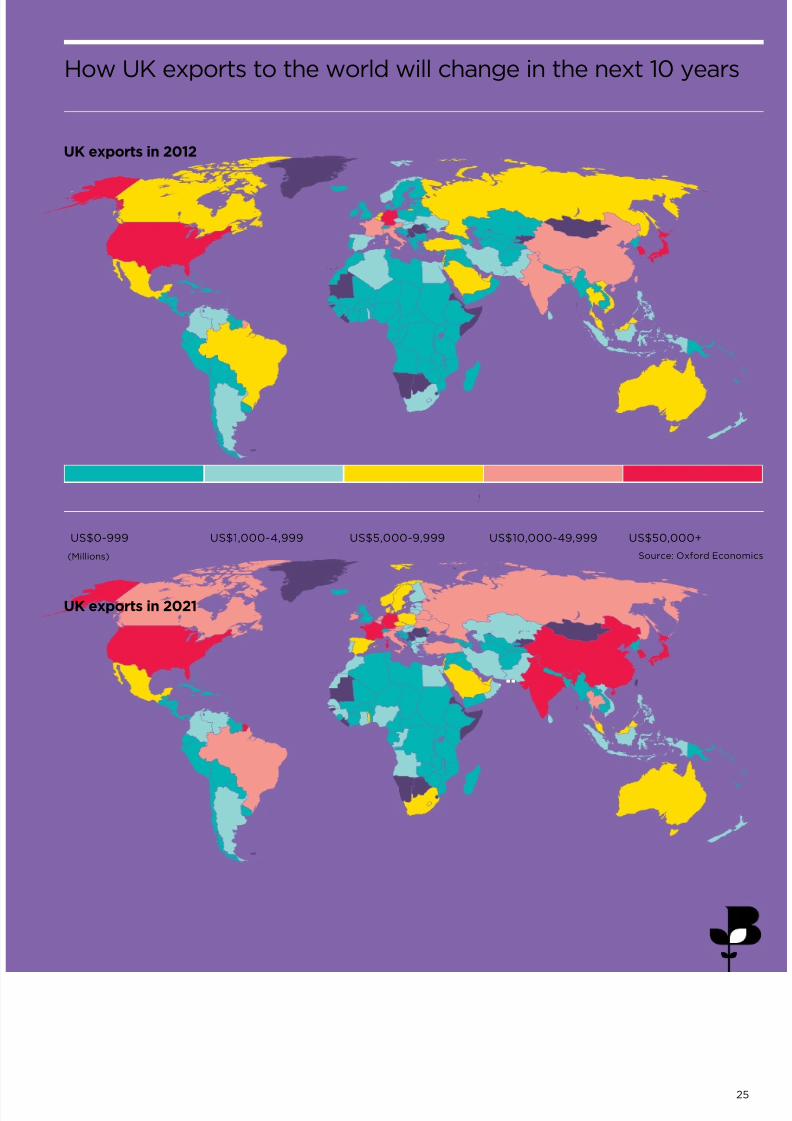
US$0-999 US$1,000-4,999 US$5,000-9,999 US$10,000-49,999 US$50,000+
How UK exports to the world will change in the next 10 years
UK exports in 2021
UK exports in 2012
Source: Oxford Economics(Millions)
7/21/2019 Quarterly International Trade Outlook (QITO) for 2014 Q4
http://slidepdf.com/reader/full/quarterly-international-trade-outlook-qito-for-2014-q4 26/2826
TCI Methodology
The TCI generates its results from two data sources:
• Questionnaire responses submitted by over 2,000 exporters, derived from the BCC’s Quarterly Economic Survey(QES). The QES is the largest and most representative private sector business survey of its kind.
• Data generated from exporting activity that requires supporting documentation.
Quarterly Economic Survey (QES)
Fieldwork for the survey was conducted between 10 November to 3 December 2014.
Results are split into the following rm size categories:
0-9 employees (micro rms)
10-49 employees (small rms)
50-249 employees (medium rms)
50+ employees (large rms)
Unless otherwise stated, results refer to all exporters responding to the survey. Where results are split between the
service and manufacturing sectors, this is stated clearly in the text. Results that are not split by rm size are weighted
by the contribution of rm size to total exporting turnover.
Results are represented by either a balance gure or a pure percentage gure. Balance gures are determined by
subtracting the percentage of companies reporting decreases in a factor from the percentage of companies reporting
increases. Where a balance gure is positive it represents growth; where it is negative, it represents contraction.
Export documentation data
Many types of exports require supporting and commercial documentation to ensure the timely delivery of goods and
timely payment. Accredited British Chambers of Commerce administer documentation required for exports outside the
EU and have amassed a signicant dataset around UK goods exports as a result. The TCI uses data collected from this
process to show both an index of documentation and regional comparisons of exporting activity.
Oxford Economics
The Quarterly International Trade Outlook also draws upon the modelling expertise of Oxford Economics, who have
provided all the economic and trade forecasts presented in this publication.
Oxford Economics was founded in 1981 to provide independent forecasting and analysis tailored to the needs of
economists and planners in government and business. It is now one of the world’s leading providers of economic
analysis, advice and models, with over 300 clients including international organisations, government departments and
central banks around the world, and a large number of multinational blue-chip companies across the whole industrial
spectrum.

7/21/2019 Quarterly International Trade Outlook (QITO) for 2014 Q4
http://slidepdf.com/reader/full/quarterly-international-trade-outlook-qito-for-2014-q4 27/28

7/21/2019 Quarterly International Trade Outlook (QITO) for 2014 Q4
http://slidepdf.com/reader/full/quarterly-international-trade-outlook-qito-for-2014-q4 28/28
BRITISH CHAMBERS OF COMMERCE65 PETTY FRANCE
LONDON SW1H 9EU
T+44 (0)20 7654 5800