Quarterly Financial Report For the quarter ended …€¦ · Plan 2015 (Budget 2015). This ......
14
AGRICULTURE AND AGRI-FOOD CANADA Quarterly Financial Report For the quarter ended December 31, 2015
Transcript of Quarterly Financial Report For the quarter ended …€¦ · Plan 2015 (Budget 2015). This ......
AGRICULTURE AND AGRI-FOOD CANADA
Quarterly Financial Report For the quarter ended December 31, 2015

AGRICULTURE AND AGRI-FOOD CANADA Quarterly Financial Report For the quarter ended December 31, 2015
1
AGRICULTURE AND AGRI-FOOD CANADA
Statement outlining results, risks and significant changes in operations, personnel and programs
Introduction
Agriculture and Agri-Food Canada’s Quarterly Financial Report should be read in conjunction with the Main Estimates, Supplementary Estimates (A) as well as Canada’s Economic Action Plan 2015 (Budget 2015). This report has been prepared as required by section 65.1 of the Financial Administration Act and in the form and manner prescribed by the Treasury Board. As such, it has not been subject to an external audit or review. Detailed information on Agriculture and Agri-Food Canada’s program activities can be found in the Report on Plans and Priorities.
Basis of Presentation
This quarterly report has been prepared using an expenditure basis of accounting. The accompanying Statement of Authorities includes the Department's spending authorities granted by Parliament and those used by the Department consistent with the Main Estimates and Supplementary Estimates (A) for the 2015-2016 fiscal year. This quarterly report has been prepared using a special purpose financial reporting framework designed to meet financial information needs with respect to the use of spending authorities. The authority of Parliament is required before monies can be spent by the Government. Approvals are given in the form of annually approved limits through appropriation acts or through legislation in the form of statutory spending authority for specific purposes. The Department uses the full accrual method of accounting to prepare and present its annual departmental financial statements that are part of the departmental performance reporting process. However, the spending authorities voted by Parliament remain on an expenditure basis.

AGRICULTURE AND AGRI-FOOD CANADA Quarterly Financial Report For the quarter ended December 31, 2015
2
Highlights of fiscal quarter and fiscal year to date results
Authorities Agriculture and Agri-Food Canada’s Quarterly Financial Report reflects the results of the 2015-2016 fiscal period ending December 31, 2015, for which full supply of Main Estimates and Supplementary Estimates (A) was released on June 18, 2015. At the end of the third quarter of 2015-2016, Agriculture and Agri-Food Canada had total funding available for use of $2,348.1 million as detailed in Table 1. This amount includes the 2015-2016 Main Estimates of $2,257.1 million, the 2015-2016 Supplementary Estimates (A) of $41.0 million, Operating and Capital Budget Carry Forwards from 2014-2015 totalling $36.8 million, and $13.1 million related to proceeds collected from the sale of Crown assets. The net decrease of $6.8 million compared to Agriculture and Agri-Food Canada’s total authorities at the same time in fiscal year 2014-2015 is due to decreases in Vote 1 Net Operating Expenditures and Vote 10 Grants and Contributions offset by an increase in Vote 5 Capital Expenditures. Vote 1 Net Operating authorities as of December 31, 2015 totalled $570.9 million, a decrease of $14.9 million from the December 31, 2014 amount of $585.7 million. This reduction is primarily due to timing of transfers under Growing Forward 2 to other departments for activities undertaken to support the framework. Vote 5 Capital authorities at the end of the third quarter of 2015-2016 totalled $50.0 million, an increase of $16.7 million from the December 31, 2014 amount of $33.4 million. This increase is predominantly due to $15.5 million approved under the Federal Infrastructure Initiative for 2015-2016. Vote 10 Grants and Contributions authority available for use as of December 31, 2015, of $400.2 million reflects a net decrease of $7.8 million from $408.0 million at the same time in 2014-2015. The decrease is in large part due to the inclusion of the reprofile of $41.7 million for Cost-Shared Strategic Initiatives under Growing Forward 2 in quarter 3 of 2014-2015, while the corresponding amount for 2015-2016 has not yet been included in the authorities as it is part of the 2015-16 Supplementary Estimates (C). This decrease is offset by $33.0 million additional funding for the Canadian Wheat Board Transition Costs Program reprofiled into 2015-2016 from future years. Budgetary Statutory authorities available as at December 31, 2015 were $1,326.9 million, a decrease of $0.8 million from the December 31, 2014 amount of $1,327.8 million. This slight decrease reflects $1.3 million related to the Employee Benefit Plan technical adjustment, offset by a $2.9 million decrease related to the sunsetting of the Canadian Cattlemen’s Association Legacy Fund.

AGRICULTURE AND AGRI-FOOD CANADA Quarterly Financial Report For the quarter ended December 31, 2015
3
Graph 1: Comparison of Authorities Available for Use
Table 1: Authorities Available for Use (In thousands of dollars) (1)
Authorities 2015-2016 2014-2015 Variances Percent
Vote 1 - Net Operating expenditures 570,850
585,739 (14,889)
(3%)
Vote 5 - Capital expenditures 50,037 33,376 16,661
50%
Vote 10 - Grants and contributions 400,235
408,014 (7,779)
(2%)
Budgetary statutory authorities 1,326,947 1,327,769 (823)
0%
Total Authorities 2,348,068 2,354,898 (6,830)
0%
Note: (1) Totals may not add due to rounding.
0
250
500
750
1,000
1,250
1,500
Vote 1 Vote 5 Vote 10 Statutory
$ M
illio
ns
2015-2016 2014-2015

AGRICULTURE AND AGRI-FOOD CANADA Quarterly Financial Report For the quarter ended December 31, 2015
4
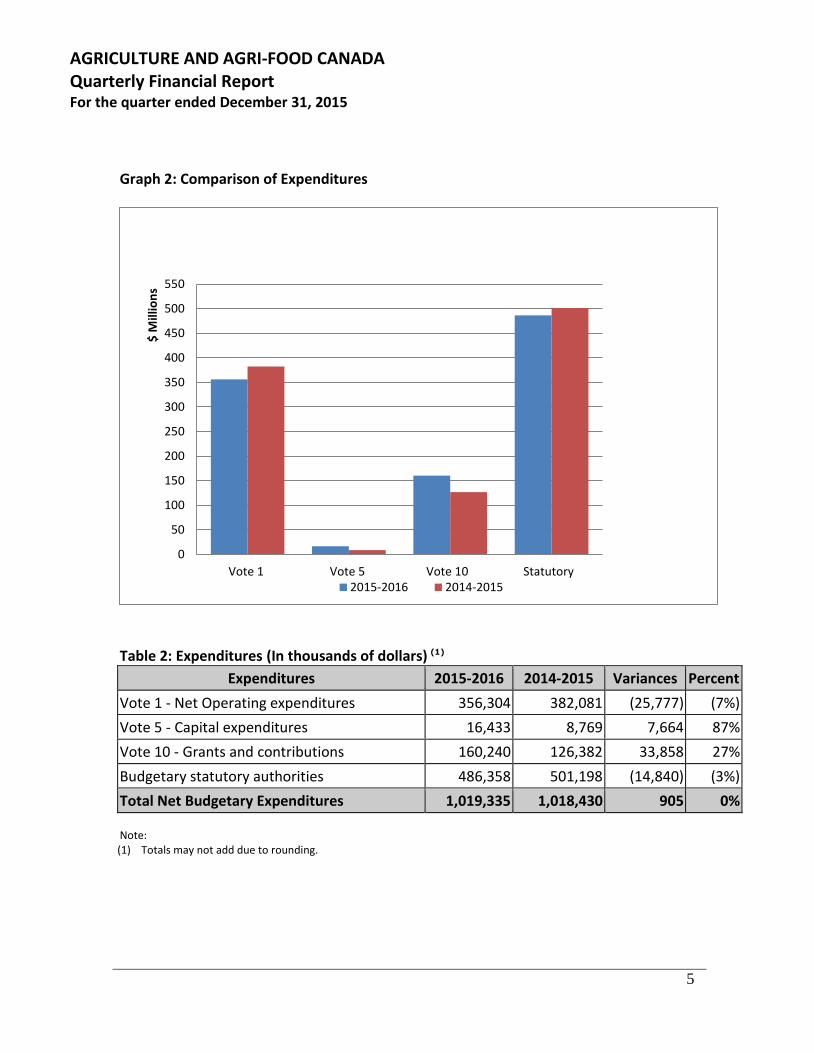
Expenditures As detailed in Table 2, at the end of the third quarter of 2015-2016, the Department had spent $1,019.3 million, compared to $1,018.4 million for the same period in fiscal year 2014-2015. The increase of $0.9 million is the net result of increases in Vote 10 Grants and Contributions and Vote 5 Capital expenditures, which were partially offset by decreases in Vote 1 Operating and Budgetary statutory expenditures. Vote 1 Net Operating expenditures at the end of the third quarter were $356.3 million, 62% of the total available for use of $570.9 million, which is lower than expenditures of $382.1 million or 65% of the total available for the same period last fiscal year. The decrease of $25.8 million in expenditures from 2014-2015 is primarily due to reduced personnel costs. Vote 5 Capital expenditures at the end of the third quarter were $16.4 million or 33% of the total available for use of $50.0 million. For the same period in 2014-2015, expenditures were $8.8 million or 26% of the budget of $33.4 million. The increase in expenditures is attributable to spending associated with the Federal Infrastructure Initiative of $7.7 million. Vote 10 Grants and Contributions expenditures at the end of the third quarter of 2015-2016 were $160.2 million or 40% of the total available for use of $400.2 million. Previous year spending for the same period was $126.4 million or 31% of the total available for use of $408.0 million. The increase in expenditures of $33.8 million is primarily due to the one time grant payment under the Canadian Wheat Board Transition Costs Program related to the commercialization of the Canadian Wheat Board. Budgetary Statutory Authorities expenditures at the end of the third quarter of 2015-2016 were $486.4 million compared to $501.2 million for the same period of the previous year. The decrease in spending of $14.8 million is mainly the net result of recoveries of $45.5 million related to the Assistance to the Pork Industry Initiative and $13.1 million related to the AgriInvest program, offset by an increase of $43.7 million in contribution payments for the AgriInsurance Program. The increase in expenditures for the AgriInsurance program is a result of the timing and frequency of claims received and not a reflection of an anticipated increase to program expenditures for the year.
AGRICULTURE AND AGRI-FOOD CANADA Quarterly Financial Report For the quarter ended December 31, 2015
5
Graph 2: Comparison of Expenditures
Table 2: Expenditures (In thousands of dollars) (1)
Expenditures 2015-2016 2014-2015 Variances Percent
Vote 1 - Net Operating expenditures 356,304 382,081 (25,777) (7%)
Vote 5 - Capital expenditures 16,433 8,769 7,664 87%
Vote 10 - Grants and contributions 160,240 126,382 33,858 27%
Budgetary statutory authorities 486,358 501,198 (14,840) (3%)
Total Net Budgetary Expenditures 1,019,335 1,018,430 905 0% Note: (1) Totals may not add due to rounding.
0
50
100
150
200
250
300
350
400
450
500
550
Vote 1 Vote 5 Vote 10 Statutory
$ M
illio
ns
2015-2016 2014-2015

AGRICULTURE AND AGRI-FOOD CANADA Quarterly Financial Report For the quarter ended December 31, 2015
6
Expenditures in Comparison to Authorities At the end of the third quarter of 2015-2016, the Department had spent $1,019.3 million (43% of the total funding available for use), compared to $1,018.4 million for the same period in fiscal year 2014-2015 (43% of the authorities). Graph 3: Comparison of Total Authorities and Total Net Budgetary Expenditures as of December 31, for fiscal years 2015-2016 and 2014-2015
Table 3 presents budgetary expenditures by standard object. The main increase in expenditures between 2015-2016 and 2014-2015 by standard object is in Transfer Payments, offset by reductions in Other Subsidies and Payments and Personnel expenditures. A net increase of $16.3 million, or 3% in Transfer Payments, is due to an increase of $33.8 million for the Canadian Wheat Board Transition Cost Program, an increase of $43.7 million of contribution payments for AgriInsurance Program offset by a decrease of $45.5 million related to recoveries for the Assistance to the Pork Industry Initiative and $13.1 million related to contribution payments for the AgriInvest program. The decrease of $15.6 million in the Personnel standard object is attributable to the overall reduction in salary expense as a result of fewer full-time equivalents, as well as reduced costs associated with payments for liquidation of severance pay. In 2014-2015, the one-time transition payment of $14.1 million for implementing salary payment in arrears by Government of Canada was recorded under Other Subsidies and Payments which accounts for the majority of the decrease in that standard object. Increases in Professional and Special Services, Repairs and Maintenance, and Acquisition of Machinery and Equipment, are mainly attributable to increased capital spending at research centres and on
43% 43%
0
500
1,000
1,500
2,000
2,500
2015-2016 2014-2015
$ M
illio
ns
Total Authorities Total Net Budgetary Expenditures

AGRICULTURE AND AGRI-FOOD CANADA Quarterly Financial Report For the quarter ended December 31, 2015
7
federal water structures, as well as purchasing of scientific equipment in support of Departmental research capacity. Agriculture and Agri-Food Canada has total Revenue Spending authority of up to $67.4 million for 2015-2016. The revenue is generated from collaborative research agreements between Agriculture and Agri-Food Canada and third parties, the grazing and breeding activities of the Community Pastures Program, the administration of the AgriStability Program, as well as recoveries for costs related to Internal Support Services provided to other departments. The Department has generated $48.3 million in revenues up to the end of the third quarter of 2015-2016 compared to $50.4 million for the same period last year. The $2.1 million decrease is, in part, due to a decline in revenue for the Community Pastures Program as devolution of the program continues, with the remainder of the decrease being a factor of the timing of the receipt of revenue generated from collaborative research agreements. Table 3: Budgetary Expenditures by Standard Object (In thousands of dollars) (1)
Expenditures 2015-2016 2014-2015 Variances Percent
Personnel 340,874 356,511 (15,637) (4%)
Transportation and communications 7,936 6,758 1,178 17%
Information 2,464 2,001 463 23%
Professional and special services 65,361 61,107 4,254 7%
Rentals 2,030 2,021 9 0%
Repairs and maintenance 14,388 9,167 5,221 57%
Utilities, materials and supplies 22,892 22,124 768 3%
Acquisition of land, buildings and works 928 1,715 (787) (46%)
Acquisition of machinery and equipment 13,891 9,510 4,381 46%
Transfer payments 591,421 575,094 16,327 3%
Other subsidies and payments 5,459 22,824 (17,365) (76%)
Total Gross Budgetary Expenditures 1,067,644 1,068,832 (1,188) 0%
Less: Revenues netted against expenditures 48,309 50,402 (2,093) (4%)
Total Net Budgetary Expenditures 1,019,335 1,018,430 905 0% Note: (1) Totals may not add due to rounding.
Risks and Uncertainties
Agriculture and Agri-Food Canada continues to exercise prudent fiscal management in delivering its policies and programs. Departmental resources will be impacted by the 2014 Operating Budget Freeze, whereby wage and salary increases for fiscal years 2014-2015 and 2015-2016 resulting from collective agreements will need to be absorbed within existing budgets. The exact amount of these salary increases and the timing of the settlement are not

AGRICULTURE AND AGRI-FOOD CANADA Quarterly Financial Report For the quarter ended December 31, 2015
8
yet known. However, the Department continues to plan for the uncertainty associated with these costs and the impact on resources. Agriculture and Agri-Food Canada systematically identifies, assesses, monitors, and responds to a variety of strategic, operational, and program- and project-level risks and opportunities. These activities are captured within the Department’s Program Performance Measurement and Risk Management Strategies process. The Program Performance Measurement and Risk Management Strategies require that Departments implement ongoing performance measurement, including risk and opportunity monitoring and performance information availability, to effectively support program expenditures. The Department's decision-making capacity is enhanced by effectively embedding risk and opportunity management within its culture, processes, and planning practices. Annually, Agriculture and Agri-Food Canada updates its Corporate Risk Profile to communicate the key risks and opportunities that have the potential to influence departmental priorities, resource allocation, and the achievement of Strategic Outcomes.
Significant changes in relation to operations, personnel and programs
Personnel Mr. Lawrence MacAulay was appointed as Minister of Agriculture and Agri-Food Canada on November 4, 2015. Programs The Canadian Wheat Board Transition Costs Program made a $55.3 million lump sum payment this year for Other Post-Employment Benefits, a change from the originally planned multi-year payments.
As part of the Government of Canada's 2015 Economic Action Plan that helps build and renew infrastructure projects across the country, Agriculture and Agri-Food Canada will receive $47.5 million over 2 years for the Federal Infrastructure Initiative to modernize and rehabilitate aging dams, laboratories and green houses.
Approval by Senior Officials Approved by: Original signed by
Original signed by
Chris Forbes, Acting Deputy Head
Ottawa, Canada
February 24, 2016
Pierre Corriveau, Chief Financial Officer

AGRICULTURE AND AGRI-FOOD CANADA Statement of Authorities (unaudited) For the quarter ended December 31, 2015 (In thousands of dollars)
9
Fiscal year 2015-2016 (1)
Fiscal year 2014-2015(1)
Total available for use for the year ending
March 31, 2016 (2)
Used during the quarter ended December 31, 2015
Year to date used at quarter-end
Total available for use for the year ended
March 31, 2015 (2)
Used during the quarter ended December 31, 2014
Year to date used at quarter-end
Vote 1 - Net Operating expenditures $ 570,850 $ 112,937 $ 356,304 $ 585,739 $ 119,065 $ 382,081
Vote 5 - Capital expenditures 50,037 8,007 16,433 33,376 4,757 8,769
Vote 10 - Grants and contributions 400,235 54,343 160,240 408,014 78,441 126,382
Budgetary statutory authorities (3)
1,326,947 232,280 486,358 1,327,769 270,021 501,198
Total Budgetary authorities 2,348,068 407,567 1,019,335 2,354,898 472,284 1,018,430
Total authorities $ 2,348,068 $ 407,567 $ 1,019,335 $ 2,354,898 $ 472,284 $ 1,018,430
Notes: (1) Totals may not add due to rounding. (2) Includes only Authorities available for use and granted by Parliament at quarter-end. (3) Details on Budgetary statutory authorities are included in Appendix A.

AGRICULTURE AND AGRI-FOOD CANADA Departmental budgetary expenditures by Standard Object (unaudited) For the quarter ended December 31, 2015 (In thousands of dollars)
10
Fiscal year 2015-2016 (1)
Fiscal year 2014-2015(1)
Planned expenditures for the year ending March 31, 2016
Expended during the quarter ended December 31, 2015
Year to date used at quarter-end
Planned expenditures for the year ending March 31, 2015
Expended during the quarter ended December 31, 2014
Year to date used at quarter-end
Expenditures:
Personnel $ 499,259 $ 110,604 $ 340,874 $ 499,406 $ 112,199 $ 356,511
Transportation and communications 11,338 2,900 7,936 14,581 2,688 6,758
Information 5,559 1,278 2,464 7,799 521 2,001
Professional and special services 114,845 25,007 65,361 122,742 25,917 61,107
Rentals 4,163 853 2,030 4,935 793 2,021
Repair and maintenance 21,105 6,257 14,388 19,315 2,601 9,167
Utilities, materials and supplies 48,914 9,165 22,892 53,472 8,549 22,124
Acquisition of land, buildings and works 3,271 345 928 4,820 864 1,715
Acquisition of machinery and equipment 31,316 6,798 13,891 28,955 4,398 9,510
Transfer payments 1,642,659 266,992 591,421 1,653,298 329,989 575,094
Other subsidies and payments 33,020 1,310 5,459 11,055 5,811 22,824
Total gross budgetary expenditures 2,415,448 431,509 1,067,644 2,420,378 494,330 1,068,832
Less Revenues netted against expenditures:
Vote-netted revenues 67,380 23,942 48,309 65,480 22,046 50,402
Total Revenues netted against expenditures
67,380 23,942 48,309 65,480 22,046 50,402
Total net budgetary expenditures $ 2,348,068 $ 407,567 $ 1,019,335 $ 2,354,898 $ 472,284 $ 1,018,430
Note: (1) Totals may not add due to rounding.

AGRICULTURE AND AGRI-FOOD CANADA Budgetary Statutory Authorities Breakdown (unaudited) For the quarter ended December 31, 2015 (In thousands of dollars)
11
APPENDIX A
Fiscal year 2015-2016 (1)
Fiscal year 2014-2015(1)
Planned expenditures for the year ending March 31, 2016
Expended during the quarter ended December 31, 2015
Year to date used at quarter-end
Planned expenditures for the year ending March 31, 2015
Expended during the quarter ended December 31, 2014
Year to date used at quarter-end
Contributions to employee benefit plans $ 71,293 $ 17,823 $ 53,469 $ 69,965 $ 17,397 $ 52,209
Contributions to employee benefit plans (Administrative Tribunals Support Service of Canada)
- - - - 9 9
Minister of Agriculture and Agri-Food - Salary and motor car allowance
82 14 55 80 20 60
Contribution payments for the AgriStability program 219,300 258 (13,536) 219,300 1,260 (14,079)
Contribution payments for the AgriInsurance program
640,800 171,314 367,853 640,800 205,414 324,133
Grant payments for the AgriInvest program 126,200 36,241 117,098 126,200 38,434 122,113
Payments in connection with the Agricultural Marketing Programs Act
65,900 5,561 12,719 65,900 4,900 12,831
Grant payments for the AgriStability program 41,000 (1,679) (2,855) 41,000 (2,659) (4,029)
Contribution payments for the AgriInvest program 17,500 1,032 4,190 17,500 12,255 17,294
Loan guarantees under the Canadian Agricultural Loans Act
13,111 (14) (22) 13,111 (9) (56)
Canadian Cattlemen's Association Legacy Fund
- - - 2,860 - -
Contributions in support of the Assistance to the Pork Industry Initiative
- - (53,755) - (7,532) (8,209)
Grants to agencies established under the Farm Products Agencies Act
100 - - 100 - -

AGRICULTURE AND AGRI-FOOD CANADA Budgetary Statutory Authorities Breakdown (unaudited) For the quarter ended December 31, 2015 (In thousands of dollars)
12
APPENDIX A
Fiscal year 2015-2016 (1)
Fiscal year 2014-2015(1)
Planned expenditures for the year ending March 31, 2016
Expended during the quarter ended December 31, 2015
Year to date used at quarter-end
Planned expenditures for the year ending March 31, 2015
Expended during the quarter ended December 31, 2014
Year to date used at quarter-end
Contribution payments for the Agricultural Disaster Relief Program (ADRP)/AgriRecovery
118,513 405 249 118,513 - -
Canadian Pari-Mutuel Agency Revolving Fund
- 107 (1,399) 34 (511) (2,457)
Spending of Amounts Equivalent to Proceeds from Disposal of Surplus Moveable Crown Assets
13,147 1,686 3,027 12,406 1,560 2,665
Grant payments for the AgriInvest Kickstart program - - (2) - (17) (41)
Contribution payments for the AgriInvest Kickstart program
- - - - - (6)
Refunds of amounts credited to revenues in previous years
- - 25 - - 1
Contributions for agricultural risk management - Enhanced Spring Credit Advance program Business Risk Management
- (95) (340) - (102) (422)
Class grant payments for the Transitional Industry Support program
- (1) (2) - (7) (10)
Class grant payments for the Farm Income program - - 10 - (1) (1)
Grant payments for the Canadian Agricultural Income Stabilization program Inventory Transition Initiative
- (9) (36) - (86) (121)
Contribution payments for the Canadian Agricultural Income Stabilization program Inventory Transition Initiative
- (355) (374) - (296) (670)

AGRICULTURE AND AGRI-FOOD CANADA Budgetary Statutory Authorities Breakdown (unaudited) For the quarter ended December 31, 2015 (In thousands of dollars)
13
APPENDIX A
Fiscal year 2015-2016 (1)
Fiscal year 2014-2015(1)
Planned expenditures for the year ending March 31, 2016
Expended during the quarter ended December 31, 2015
Year to date used at quarter-end
Planned expenditures for the year ending March 31, 2015
Expended during the quarter ended December 31, 2014
Year to date used at quarter-end
Grants in support of the Grain and Oilseed Payment program
- (8) (14) - (6) (13)
Grants in support of the Cost of Production Benefit - - (2) - (2) (3)
Budgetary statutory authorities $ 1,326,947 $ 232,280 $ 486,358 $ 1,327,769 $ 270,021 $ 501,198
Note: (1) Totals may not add due to rounding.