Quantitative phase analysis by XRPD
27
Quantitative phase analysis by XRPD 1 Organizers and Instructors: Arnt Kern, Burker AXS GmbH, Germany Detlef Beckers, PANalytical B.V., The Netherlands Fabia Gozzo, Excelsus Structural Solutions SPRL, Belgium Robert Dinnebier, MPI für Festkörperforschung, Germany Arnaud Grandeury, Novartis Pharma AG Copyright : © 2015 PANalytical B.V., all rights reserved
Transcript of Quantitative phase analysis by XRPD

Quantitative phase
analysis by XRPD
1
Organizers and Instructors: Arnt Kern, Burker AXS GmbH, Germany
Detlef Beckers, PANalytical B.V., The Netherlands
Fabia Gozzo, Excelsus Structural Solutions SPRL, Belgium
Robert Dinnebier, MPI für Festkörperforschung, Germany
Arnaud Grandeury, Novartis Pharma AG
Copyright : © 2015 PANalytical B.V., all rights reserved

This document was presented at PPXRD -Pharmaceutical Powder X-ray Diffraction Symposium
Sponsored by The International Centre for Diffraction Data
This presentation is provided by the International Centre for Diffraction Data in cooperation with the authors and presenters of the PPXRD symposia for the express purpose of educating the scientific community.
All copyrights for the presentation are retained by the original authors.
The ICDD has received permission from the authors to post this material on our website and make the material available for viewing. Usage is restricted for the purposes of education and scientific research.
ICDD Website - www.icdd.comPPXRD Website – www.icdd.com/ppxrd

Workshop program
Introduction and Overview of QPA methods 8.30 Detlef Beckers, 30 min QPA with diffraction methods 9.00 Fabia Gozzo, 45min Quantification of amorphous phases - theory 9.45 Robert Dinnebier, 45min Coffee break 10.30 QPA Instrumentation, validation and sample preparation 11.00 Detlef Beckers, 45min Quantification of traces: LoD & LoQ 11.45 Fabia Gozzo (SR-XRPD), Detlef Beckers (lab-instrumentation), 30min+30min Lunch 12.45 QPA as one piece of a bigger puzzle in pharmaceutical development 14.30 Arnaud Grandeury, 45 min Quantification of amorphous phases – practice part 1 15.15 Robert Dinnebier, 30 min Coffee break 15.45 Quantification of amorphous phases – practice part 2 16.15 Robert Dinnebier, 1h
Copyright : © 2015 PANalytical B.V., all rights reserved

Overview of Quantitative
Phase Analysis (QPA)
methods
3
Detlef Beckers, PANalytical B.V.
Copyright : © 2015 PANalytical B.V., all rights reserved

4
Position [°2Theta]
10 15 20 25 30
Counts
0
50000
100000
Alpha1.RD
Lattice structure Peak position
Molecule arrangement Relative intensities
Crystallite size / strain FWHM
Introduction and background
A diffraction pattern is a fingerprint of a (crystalline phase)
Angular peak position
FWHM
Integrated peak
Intensity
Mixture quantity Intensity of pattern (net peak areas)
Copyright : © 2015 PANalytical B.V., all rights reserved
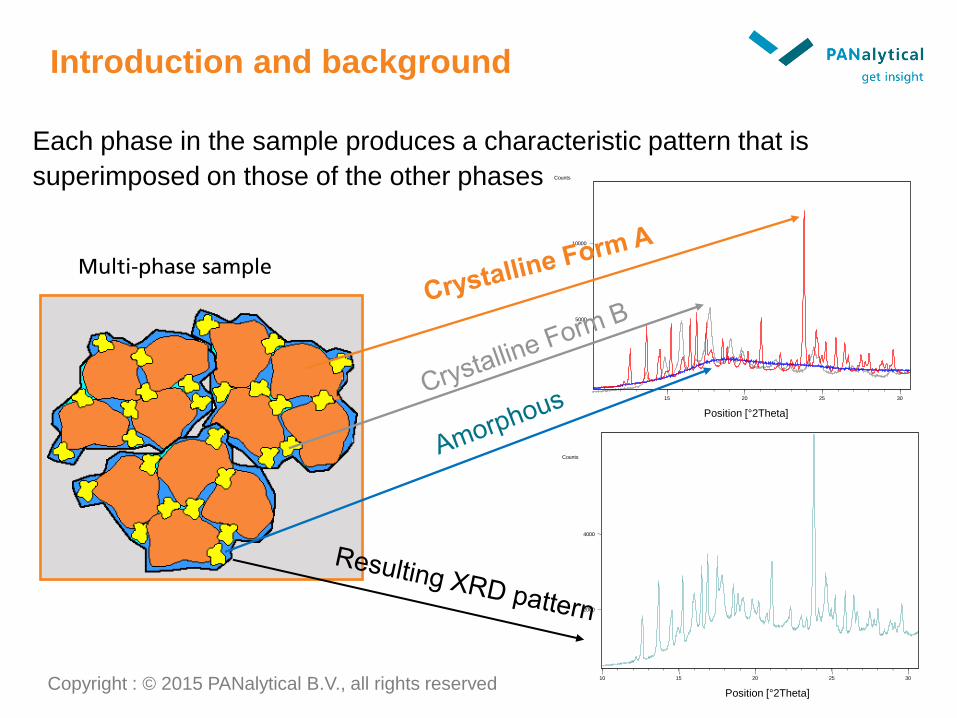
Introduction and background
Each phase in the sample produces a characteristic pattern that is
superimposed on those of the other phases
5000
10000
Counts
Position [°2Theta]
15 20 25 30
Position [°2Theta]
10 15 20 25 30
Counts
2000
4000
Multi-phase sample
Copyright : © 2015 PANalytical B.V., all rights reserved

6
Applications in the pharmaceutical industry
Polymorphic purity: detect and quantify unwanted polymorphic forms in
both drug substance and drug product
Limit of Detection (LoD) and Quantification (LoQ)
Assess the polymorphic composition in drug substance and product
API / excipient concentration in formulation
Degree of crystallinity in amorphous/crystalline mixtures (API /
formulation)
…
Copyright : © 2015 PANalytical B.V., all rights reserved

Form-II Form-I
Placebo
Quantification of crystalline phases
5% formulation of Olenzapine form-I (spiked with form-II)
LoD < 3% of API impurity (< 0.15% of formulation) – measured in Bragg-
Brentano geometry
Copyright : © 2015 PANalytical B.V., all rights reserved

8
Quantification of amorphous phases
90% amorph.
50% amorph.
30% amorph.
10% amorph.
Copyright : © 2015 PANalytical B.V., all rights reserved

Quantification of amorphous phases
Copyright : © 2015 PANalytical B.V., all rights reserved
10 15 20 25 30 35 40
2Theta (°)
0
10000
40000
90000
160000
Inte
nsity (
cou
nts
)
10 12 14 16 18 20 22 24
2Theta (°)
400
900
1600
2500
3600
4900
Inte
nsity (
counts
)

Overview of Quantitative Phase Analysis
(QPA) methods
Single (few) peak method (small 2 Theta range): Iunknown Iknown
General model
Straight line model ( constant)
Linear Multi-Variate Regression model
(extension of straight line model with various independent reflections)
Matrix flushing (sum of phases known and constant)
Internal Standard model
RIR method (uses ICDD data on relative intensities compared to corundum standard)
Addition model (adding a known concentration of the compound of interest)
Single line addition method (sample with just one crystalline and one amorphous phase)
Dual line addition method (sample with a reference phase in high concentration preferably with non-overlapping peak)
Thin layer with base plate correction (X-ray transparent sample, calculation of transmission factor for concentration determination)
Copyright : © 2015 PANalytical B.V., all rights reserved

Overview of Quantitative Phase Analysis
(QPA) methods
Whole pattern methods (large 2 Theta range)
Traditional Rietveld method
FULLPAT / PONKCS method
Degree of Crystallinity (1 reference) / Linear Calibration Model
(multiple references)
Internal Standard method (spiking to determine amorphous content)
External Standard method (amorphous content determination)
Partial Least Squares regression (PLSR) – not based on
diffraction properties
11 Copyright : © 2015 PANalytical B.V., all rights reserved

Which aspects to consider?
Required LoD/LoQ
Regions free of peak overlaps
Possibility to create reliable standards (amount of standards)
Sensitivity to process variations (changes in particle size etc.)
Tendency to changing preferred orientation (particle shape)
Are the crystal structures known (and how well?)
Sensitivity to instrument variations (incl. tube aging)
Reproducibility of amorphous content
Possibility for internal standards (limitations: formulations,…)
Aspects of method validation
12
The analytical problem often dictates the choice of
quantitative method
Copyright : © 2015 PANalytical B.V., all rights reserved
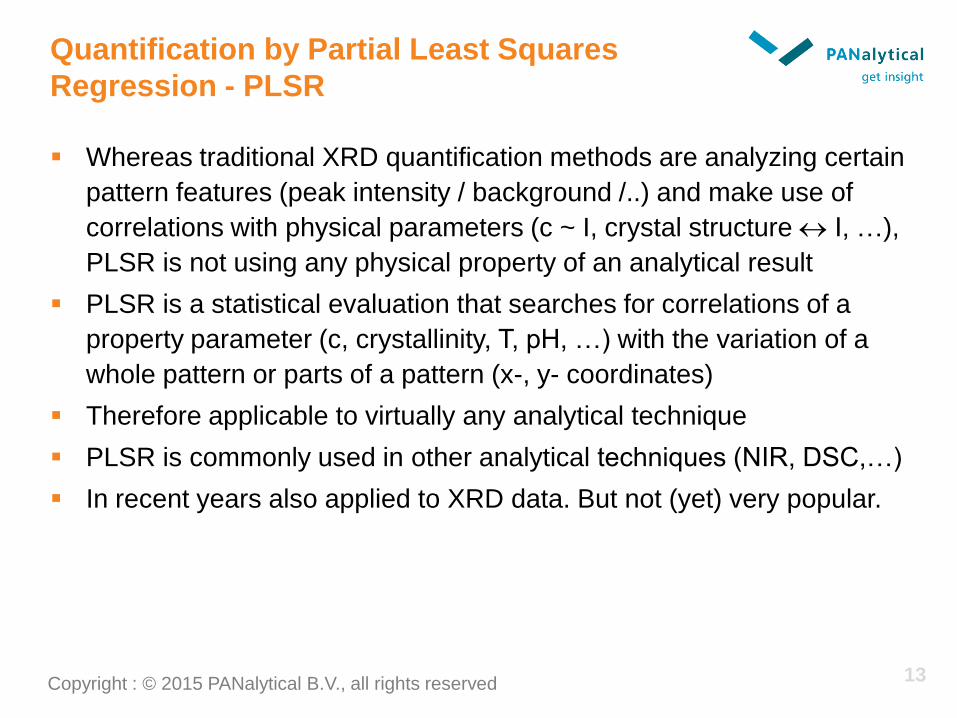
Quantification by Partial Least Squares
Regression - PLSR
Whereas traditional XRD quantification methods are analyzing certain
pattern features (peak intensity / background /..) and make use of
correlations with physical parameters (c ~ I, crystal structure I, …),
PLSR is not using any physical property of an analytical result
PLSR is a statistical evaluation that searches for correlations of a
property parameter (c, crystallinity, T, pH, …) with the variation of a
whole pattern or parts of a pattern (x-, y- coordinates)
Therefore applicable to virtually any analytical technique
PLSR is commonly used in other analytical techniques (NIR, DSC,…)
In recent years also applied to XRD data. But not (yet) very popular.
13 Copyright : © 2015 PANalytical B.V., all rights reserved

Partial Least-Squares Regression (PLSR)
Projection based methods like PCA or PLS have the goal to extract a small number
of scores/factors to optimally explain the (systematic) data variation in matrix X. The
extracted scores/factors can then be used for regression analysis.
XRPD data (matrix X) typically contains:
• Non-systematic variations (sample preparation, noise, …)
• Non-intended variations (impurities, differences in grain sizes, …)
• Systematic variations (different concentrations, …) => response vector Y
In XRPD the rows of the matrix X are formed
by the individual scans, the columns are
formed by all measured intensities at a certain
diffraction angle 2ϴ.
PLSR as developed by Herman Wold in 1960, is able to predict any defined
property Y directly from the variability in a data matrix X.
Copyright : © 2015 PANalytical B.V., all rights reserved

Comparison of analytical approaches
Lactose used as model substance
1. Amorphous lactose in crystalline matrix
2. Crystalline lactose in amorphous matrix
Copyright : © 2015 PANalytical B.V., all rights reserved

Example 1: Crystallinity - low amorphous
content
Model substance: Alpha lactose monohydrate
Preparation:
• Storage at RH of 56% and 30°C to
ensure complete recrystallisation
Amorphous lactose Crystalline lactose
Preparation:
• Lyophilisation of saturated lactose
solution
Preparation of binary mixtures: 0-10% amorphous content
Copyright : © 2015 PANalytical B.V., all rights reserved

Example 1: Crystallinity - low amorphous
content
Copyright : © 2015 PANalytical B.V., all rights reserved
10 15 20 25 30 35 40
2Theta (°)
0
10000
40000
90000
160000
Inte
nsity (
cou
nts
)
10 12 14 16 18 20 22 24
2Theta (°)
400
900
1600
2500
3600
4900
Inte
nsity (
counts
)

Example 1: Crystallinity - low amorphous
content
R² = 0.9901
0
1
2
3
4
5
6
7
8
9
0 2 4 6 8 10 12
Amorphous content as prepared / %
Am
. conte
nt
dete
rmin
ed /
%
Traditional evaluation: integral peak / background intensity (range: 2 = 11o - 34o)
Indicates systematic
error (small 2 Theta
range)
Copyright : © 2015 PANalytical B.V., all rights reserved

Example 1 – Comparison of methods
Peak / background ratio PLS – as modeled
(3 factors, standardize)
R2 0.9901 0.9999
RMSE(SD) 0.262 0.035
Error of intercept
<A>
0.179 0.024
Peak / background ratio
Copyright : © 2015 PANalytical B.V., all rights reserved

Example 1 – PLS
PLS
(as modeled – 3
factors,
standardize)
PLS
(cross validated
30% data
removed)
PLS
(on data set 1 –
other step size)
PLS
(on data set 2
shorter meas.
time - scaled)
R2 0.9999 0.9882 0.9970 0.9971
RMSE(SD) 0.035 0.282 0.160 0.152
Error of intercept
<A>
0.024 0.192 0.109 0.104
0 2 4 6 8 10
0
2
4
6
8
10
Am
orp
hous c
onte
nt -
regre
ssio
n / %
Amorphous content as prepared / %
PLS
Linear fit
95% Confidence Band of PLS
95% Prediction Band of PLS
0 2 4 6 8 10
0
2
4
6
8
10
Am
orp
ho
us c
onte
nt
- re
gre
ssio
n / %
Amorphous content as prepared / %
PLS
Linear fit
95% Confidence Band of PLS
95% Prediction Band of PLS
0 2 4 6 8 10
0
2
4
6
8
10
Amorphous content as prepared / %
Am
orp
ho
us c
onte
nt
- re
gre
ssio
n / %
PLS
Linear fit
95% Confidence Band of PLS
95% Prediction Band of PLS
Cross validated Data set 1 Data set 2
Copyright : © 2015 PANalytical B.V., all rights reserved

Example 2: Crystallinity – low crystalline
content
Model substance: Alpha lactose monohydrate
Preparation:
• Storage at RH of 56% and 30°C to
ensure complete recrystallisation
Amorphous lactose Crystalline lactose
Preparation:
• Lyophilisation of saturated lactose
solution
Preparation of binary mixtures: 0-10% crystallinity
Copyright : © 2015 PANalytical B.V., all rights reserved

Example 2 – Crystallinity - low crystalline
content
12.1 12.2 12.3 12.4 12.5 12.6 12.7 12.8 12.9
2Theta (°)
6000
8000
10000
12000
14000
16000
18000
Inte
nsity (
counts
)
Copyright : © 2015 PANalytical B.V., all rights reserved

Example 2: Crystallinity - low crystalline
content
Evaluation of
net peak area
(background fit,
Pseudo-Voigt
profile (FJC
asymmetry))
Crystallinity as prepared / %
Peak a
rea
/ c
ts*°
2T
h.
R² = 0.9887
0
200
400
600
800
1000
1200
1400
0,0 2,0 4,0 6,0 8,0 10,0 12,0
Copyright : © 2015 PANalytical B.V., all rights reserved

Example 2 – Comparison of methods
Net Peak Area PLS - as modeled
(3 factors, center)
R2 0.9887 0.9992
RMSE(SD) 0.389 (46.07) 0.101
Error of intercept
<A>
0.126 (14.89) 0.033
Peak area
Copyright : © 2015 PANalytical B.V., all rights reserved

Example 2 – PLS
PLS
(as modeled – 3
factors, center)
PLS
(cross validated
30% data
removed)
PLS
(on data set 1
– half meas.
time, scaled)
PLS
(on data set 2
same cond.-
other samples)
R2 0.9992 0.9942 0.9989 0.9954
RMSE(SD) 0.101 0.271 0.121 0.251
Error of intercept
<A>
0.033 0.088 0.039 0.081
0 2 4 6 8 10
0
2
4
6
8
10
Crystallinity as prepared / %C
rysta
llin
ity -
reg
ressio
n / %
PLS
Linear fit
95% Confidence Band of PLS
95% Prediction Band of PLS
0 2 4 6 8 10
0
2
4
6
8
10
Cry
sta
llinity -
regre
ssio
n / %
Crystallinity as prepared / %
PLS
Linear fit
95% Confidence Band of PLS
95% Prediction Band of PLS
0 2 4 6 8 10
0
2
4
6
8
10
Cry
sta
llin
ity -
regre
ssio
n / %
Crystallinity as prepared / %
PLS
Linear fit
95% Confidence Band of PLS
95% Prediction Band of PLS
Cross validated Data set 1 Data set 2
Copyright : © 2015 PANalytical B.V., all rights reserved

Summary – PLS regression
– Requires (large) set of samples for calibration
– Calibration samples should cover all relevant sample variations
(particle/crystallite sizes, operator dependencies)
– Possibility of over-fitting (limit number of factors, counting statistics)
– Factors not necessarily related to physical properties – validation (ICH)
to check model applicability with all process parameter variations
+ Pure phases or crystal structures not required
+ Takes full pattern variation into account
+ Less sensitive to non-ideal sample preparation / measurement set-up
+ Can be more robust than traditional XRD methods
+ User independent analysis
Copyright : © 2015 PANalytical B.V., all rights reserved