Quantitative Methods 1 Miriam Niblack DEPM 650
12
Quantitative Methods 1 Miriam Niblack DEPM 650 Section: 9040 April 22, 2015 Quantitative Method DEPM 650 Assignment # 3 – Quantitative Methods Report on Data Analysis
Transcript of Quantitative Methods 1 Miriam Niblack DEPM 650
Quantitative Methods 1
Miriam Niblack
DEPM 650
Section: 9040
April 22, 2015
Quantitative Method
DEPM 650 Assignment # 3 – Quantitative Methods
Report on Data Analysis

Quantitative Methods 2
Quantitative Research (QR) is about measuring numerical results (Woodley, 2004). In natural
and social sciences, QR is the investigation of observable phenomena via statistical, computable,
or mathematical techniques (Zawacki-Richter, Bäcker, & Vogt, 2009).
Task # 1 – Frequencies, bar chart
Answer Solutions Statistics: Research areas N Valid 695 Missing 0
Questions:
(a) Frequency Table for variable research areas
1. Frequency - how many times each score occurs (Field, 2013). Central tendency
(averages) is used to calculate “where the centre of frequency distribution lies” (Filed, 2013, p.
21). There are three kinds of averages and these measures are commonly used: mean, median,
and mode (Field, 2013).
Research areas
Frequency Percent Valid Percent Cumulative Percent
Valid Access, equity and ethics 31 4.5 4.5 4.5
Globalisation of education and cross-
cultural aspects 13 1.9 1.9 6.3
Distance teaching systems and
institutions 62 8.9 8.9 15.3
Theories and models 24 3.5 3.5 18.7
Research methods in distance
education and knowledge transfer 13 1.9 1.9 20.6
Management and organisation 18 2.6 2.6 23.2
Costs and benefits 12 1.7 1.7 24.9
Educational technology 48 6.9 6.9 31.8
Innovation and change 13 1.9 1.9 33.7
Professional development and faculty
support 41 5.9 5.9 39.6
Learner support services 23 3.3 3.3 42.9
Quality assurance 41 5.9 5.9 48.8
Instructional design 121 17.4 17.4 66.2
Interaction and communication in
learning communities 122 17.6 17.6 83.7
Learner characteristics 113 16.3 16.3 100.0
Total 695 100.0 100.0

Quantitative Methods 3
(b) Bar Chart for variable research areas
(c) Report research area with highest and lowest number of articles.
Highest: Interaction and communication in learning communities 122 articles
Lowest: Globalization of education and cross-cultural aspects 13 based on cumulative percent

Quantitative Methods 4
Task # 2 – Boxplots
Answer Solutions
Questions:
(a) Boxplot for research area and the ratings of importance 1-10 scale
Case Processing Summary
Cases
Valid Missing Total
N Percent N Percent N Percent
1. Access, equity and ethics 21 100.0% 0 0.0% 21 100.0%
2. Distance teaching
institutions 21 100.0% 0 0.0% 21 100.0%
3. Globalisation of education
and cross-cultural aspects 21 100.0% 0 0.0% 21 100.0%
4. Theories and models 21 100.0% 0 0.0% 21 100.0%
5. Research methods in
distance education and
knowledge transfer
21 100.0% 0 0.0% 21 100.0%
6. Management &
organisation 21 100.0% 0 0.0% 21 100.0%
7. Costs and benefits 21 100.0% 0 0.0% 21 100.0%
8. Educational technology 21 100.0% 0 0.0% 21 100.0%
9. Innovation and change 21 100.0% 0 0.0% 21 100.0%
10. Professional
development and faculty
support
21 100.0% 0 0.0% 21 100.0%
11. Learner support services 21 100.0% 0 0.0% 21 100.0%
12. Quality assurance 21 100.0% 0 0.0% 21 100.0%
13. Instructional design 21 100.0% 0 0.0% 21 100.0%
14. Interaction and
communication in learning
communities
21 100.0% 0 0.0% 21 100.0%
15. Learner characteristics 21 100.0% 0 0.0% 21 100.0%

Quantitative Methods 5
(b) Report median, interquartile range, and standard deviation for research area Globalization of
education and cross-cultural aspects
1. Median is the middle value or score and is used to quantify the centre of distribution by
looking at the middle score when scores are ranked (Field, 2013).
2. Quartiles are three values where the data are split into four equal parts (Field, 2013).
Interquartile range (IQR) center is median where the top 25% and bottom 25% are cut off and
only the middle 50% of scores are used (Field, 2013). Range is the “largest score subtracted by
the smallest” (Field, 2013, p. 24). Compute the range by “excluding 50% of scores and using
only the middle 50%” (Field, 2013, p. 22).
3. Standard Deviation is a measure of how spread out numbers are of how the mean
represents the data; where a large deviation reflects that data points are distant from the mean
(Zawacki-Richter, Bäcker, & Vogt, 2009). This measure is used to quantify the amount of

Quantitative Methods 6
variation or dispersion of a set of data values and is the square root of the variance; “variance is
the average error between the mean and the observations made” (Field, 2013, p.27).
Measures of Globalization of education and cross-cultural aspects:
Median = 7.00 is the middle score at least 50% of all responses; other half of all responses are on
either side meaning < or > than 7.
Standard deviation is 1.713 is the square root of the variance and shows how distant the mean is
from the data.
IQR= 7 where the middle 50% of scores are. Therefore, at least half of all responses were 7 on a
scale of 1 – 10.
Statistics
3. Globalisation of education and cross-
cultural aspects
N Valid 21
Missing 0
Median 7.00
Std. Deviation 1.713
Percentiles 25 6.00
50 7.00
75 9.00
3. Globalisation of education and cross-cultural aspects
Frequency Percent Valid Percent
Cumulative
Percent
Valid 4 1 4.8 4.8 4.8
5 1 4.8 4.8 9.5
6 7 33.3 33.3 42.9
7 2 9.5 9.5 52.4
8 3 14.3 14.3 66.7
9 5 23.8 23.8 90.5
very HIGH importance = 10 2 9.5 9.5 100.0
Total 21 100.0 100.0
(c) Describe how to interpret box plot of Globalization

Quantitative Methods 7
The boxplot provides an overview of the ratings on 10 point scale with 1 being least important
and 10 being highest importance Globalization.
They show:
the lowest and highest score
the middle score (interquartile range) in the tinted box
the top and bottom 25% of scores
the median
Task # 3 – Chi-square test
Answer Solutions
Questions:
(a) Create cross tab with variable Research area and Gender
1. Cross tabulation allows you to compare the relationship between two variables and see
how all jointly characterized (Zawacki-Richter, Bäcker, & Vogt, 2009).

Quantitative Methods 8
Totals: 384 Males 311 Females N = 695
(b) Run chi-square test and bar chart for above variables chi-square test formula:
Chi-square test is non-parametric and compares numbers actually in each cell that are observed
with what is expected to be there (Woodley, 2004). The bigger the chi-square result the more
likely results have not occurred by chance (Woodley, 2004).
Quantitative Methods 9
(c) Discuss results. Statistical significance between above variables? Which research area do
women publish more frequently than their male colleagues?
The association between gender and research areas is statistically not significant, x^2 = 51.76, df
= 14, p<.05. Women publish more than their male colleagues in the research topic of interaction
and communication learning communities.
Task #4 – Comparing two means: t-test
T-test is a form of the more powerful parametric test in which power refers to the “probability of
rejecting the null hypothesis when it is in fact false” (Woodley, 2004, p. 150). This tests relies on
assumptions; therefore, testing whether a distribution is normal is best (Woodley, 2004).
According to Field (2013), “degrees of freedom relate to the number of observations that are free
to vary” (p. 49) such as one less than the number of choices available.
Answer Solutions
Questions:
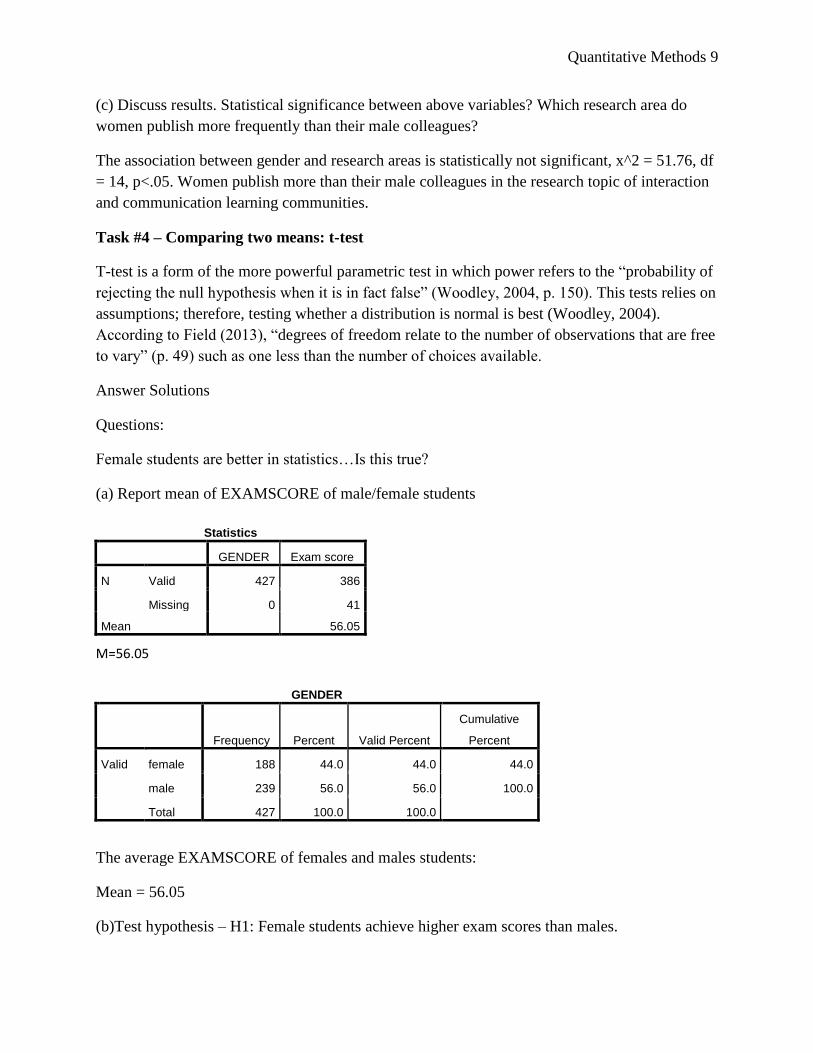
Female students are better in statistics…Is this true?
(a) Report mean of EXAMSCORE of male/female students
Statistics
GENDER Exam score
N Valid 427 386
Missing 0 41
Mean 56.05
M=56.05
GENDER
Frequency Percent Valid Percent
Cumulative
Percent
Valid female 188 44.0 44.0 44.0
male 239 56.0 56.0 100.0
Total 427 100.0 100.0
The average EXAMSCORE of females and males students:
Mean = 56.05
(b)Test hypothesis – H1: Female students achieve higher exam scores than males.

Quantitative Methods 10
Hypothesis is an explanation for events that needs to be tested. QR is used by “evaluating and
explanation, measuring concepts, and variables” (Cohen et al., 2007, p. 179). QR aims to
“observe what is invisible” (Cohen et al., 2007, p.180) and it begins with an abstract idea,
followed by measurement procedures, and ends with empirical data (Cohen et al., 2007).
Quantitative method is designed for testing hypotheses by collecting numerical data (Neumann,
2007). QR is used collaboratively to increase efficiency through division of labor as analyzing
data is more complex (Hunter & Leahey, 2008). Quantitative researchers “adopt a deductive
approach” (Neumann, 2007, p. 179) to test measures that can be expressed in numbers.
According to Cohen, Manion, & Morrison (2011), “People attempt to comprehend the world
around them by using three types of reasoning: deductive reasoning, inductive reasoning and the
combined inductive-deductive approach. Deductive reasoning is based on the syllogism,” (p. 6).
Group Statistics
GENDER N Mean Std. Deviation Std. Error Mean
Exam score female 166 58.57 13.278 1.031
male 220 54.15 14.281 .963
(b) Report Results.
The independent samples t-test is used to test two experimental groups that are assigned
to each condition (Field, 2013). Levene’s test the assumption is fulfilled.
The mean difference for EXAMSCORE for males and females is 4.422.
The t-statistic is calculated by diving the mean difference by the standard error (t =
3.104)
For the independent t-test, degrees of freedom are calculated by adding the two sample
sizes and then subtracting the number of samples: df = 166 + 220-2 = 384.

Quantitative Methods 11
The two-tailed significance value of t is .002 which is lower than .05 (the 95%
confidence interval value), so we can reject the null hypothesis and conclude that female
students did achieve higher scores than the male students.
Thus, we can report this result as:
On average, females achieved higher EXAMSCORES (M=58.57, SD=13.278), than males
(M=54.15, D=.963). This difference is significant, t (384) = 3.104, p<.01.
Task #5 – Bivariate correlation
Bivariate correlation “which is the correlation between two variables” (Field, 2013, p. 267).
Correlation expressed the strength between variables in a value between -1 and +1; where -1 is
negative correlation as if one increases the other variable decreases, +1 positive correlation as
one variable increases so does the other, and 0 means no relationship (Field, 2013).
Answer Solutions
Questions:
(a) Correlation test between number of authors and number of references.
Correlations
No. of authors No. of references
No. of authors Pearson Correlation 1 -.029
Sig. (2-tailed) .446
N 695 695
No. of references Pearson Correlation -.029 1
Sig. (2-tailed) .446
N 695 695
(b) Report Results. Correlation coefficient refers to how changes in one variable relate to changes in
another (Woodley, 2004). Correlation coefficient is interpreted through use of Pearson’s correlation
coefficients (Pearson’s r) since the levels of measurement of the number of authors and references are
both scale, which is used measure the relationship between the two variables (Field, 2013).
There is no significant association between no. of authors and references, r = -.029, p<.05.

Quantitative Methods 12
References
Cohen, L., Manion, K., Morrison, K. (2011). Research Methods in Education (7th ed.). Chapter
1 (The Nature of Inquiry – Setting the Field).
Field, A. (2013). Discovering statistics using SPSS (4th ed.). Thousand Oaks: Sage.
Hunter, L., & Leahey, E. (2008). Collaborative research in sociology: trends and contributing
factors. The American Sociologist, 39(4), 290-306.
Neumann, W. L. (2007). Social research methods: Qualitative and quantitative approaches.
Boston: Pearson. Chapter 7: Qualitative and Quantitative Measurement.
Woodley, A. (2004). Getting and analysing quantitative data. Vancouver: PREST,
Commonwealth of Learning (COL).
Zawacki-Richter, O., Bäcker, E. M., & Vogt, S. (2009). Review of distance education research
(2000 to 2008) – analysis of research areas, methods, and authorship patterns.
International Review of Research in Open and Distance Learning, 10(6), 21-50.