Curriculum Skills and Progression Map Modern Foreign Languages
GENERAL EDUCATION AND TRAINING CERTIFICATE FOR ADULTS
NQF LEVEL 1
SUBJECT STATEMENT
QUANTITATIVE LITERACY CURRICULUM STATEMENT
JULY 2017
GETCA QUANTITATIVE LITERACY Curriculum
CURRICULUM STATEMENT FOR THE GENERAL EDUCATION AND TRAINING CERTIFICATE FOR ADULTS (GETCA)
Department of Higher Education and Training
123 Francis Baard Street
Private Bag X174
Pretoria 0001
South Africa
Tel: +27 12 312-5911
Fax: +27 12 321-6770
www.dhet.gov.za
© 2017 Department of Higher Education and Training
GETCA QUANTITATIVE LITERACY Curriculum Page 1
GETCA CURRICULUM
QUANTITATIVE LITERACY
Table of Contents Introduction ..................................................................................................................................................... 3
Aims ..................................................................................................................................................................... 5
Exit-Level Outcomes ..................................................................................................................................... 6
ELO 1: Use numbers and their relationships to estimate, calculate and investigate the financial aspects of personal, business and social life in order to solve problems in real contexts. ........................................................................................................................................................ 6
ELO 2: Recognise, analyse, interpret, describe and represent various functional relationships in order to solve problems in real contexts. ........................................................ 6
ELO 3: Use measurement to estimate and calculate physical quantities in order to describe and represent properties of and relationships between 2D and 3D objects. .. 6
ELO 4: Collect, summarise, represent and analyse data and apply knowledge of statistics and probability in order to communicate, justify, predict and critically analyse results and draw conclusions. .............................................................................................. 7
Taxonomy and Weighting of Exit-Level Outcomes ........................................................................... 8
Description of the Mathematical Literacy Taxonomy ................................................................. 8
Level 1: Knowing .................................................................................................................................. 8
Level 2: Applying routing procedures in familiar contexts .................................................. 8
Level 3: Applying multistep procedures in a variety of contexts ...................................... 8
Level 4: Reasoning and reflecting .................................................................................................. 8
Weighting for Exit Level Outcomes .................................................................................................... 9
Scheme of Assessment ................................................................................................................................. 9
Structure and Requirements of Assessments ................................................................................. 9
Weightings for Taxonomy Levels ........................................................................................................ 9
Structure of the Examination Papers ............................................................................................... 10
Exit Learning Outcome 1 ................................................................................................................. 10
Exit Learning Outcome 2 ................................................................................................................. 10
Exit Learning Outcome 3 ................................................................................................................. 11
Exit Learning Outcome 4 ................................................................................................................. 12
Structure of Examination ................................................................................................................ 12
Guidelines for Lecturers and Materials Developers ....................................................................... 13
Guidelines for Practicals / Activities .................................................................................................... 13
Control Tests ............................................................................................................................................. 13
Assignments ............................................................................................................................................... 13
GETCA QUANTITATIVE LITERACY Curriculum Page 2
Assignment Topics based on the Exit Learning Outcomes................................................. 14
Assumptions about Prior Knowledge and Skills .............................................................................. 15
THEME / COMPONENT 1: Basic Skills Topics .................................................................................. 16
Introduction ............................................................................................................................................... 16
Rationale for Content Selection .......................................................................................................... 16
Basic Skills Topics Content Structure .............................................................................................. 16
THEME / COMPONENT 2: Application Topics .................................................................................. 22
Introduction ............................................................................................................................................... 22
Rationale for Content Selection .......................................................................................................... 22
Application Topics Content Structure ............................................................................................. 22
GETCA QUANTITATIVE LITERACY Curriculum Page 3
Introduction
A defined set of mathematical core skills is required for the functionality of everyday
life. This could involve meaningful interactions and participation in the following areas
of daily life; the workplace, social settings, and economic/political awareness. On this
level of engagement, a candidate should be able to competently use basic mathematical
skills in critically analysing various scenarios they encounter and further creatively
solve these realistic problems.
Hence, the purpose of Quantitative Literacy is to meaningfully equip candidates with the
necessary skills required in everyday life situations, which will bring about a level of
competence. This enables the candidate to think numerically and spatially in order to
interpret, and assimilate and critically analyse problems to achieve a worthy solution.
The Quantitative Literacy content should be taught within a context as the objective of
this course is making sense of real-life situations and scenarios. Therefore, this dictates
that the content involves the teaching of elementary concepts and skills to make
deductions of numerically and statistically based situations that an individual may
encounter in his/her daily life.
In the engagement with the content, it is imperative that the content is authentic and
relevant, and that it relates to daily life in terms of the workplace, social, political and
global scenarios. Candidates must engage with genuine and realistic situations even if it
means working with awkward figures. This is recommended rather than working with
contrived data or situations.
The purpose of the subject is to equip candidates with the necessary knowledge,
concepts and skills so that they are empowered to solve any problem in any context that
they may encounter. The problem may not necessarily be relevant to the individual at
the point of learning, but familiarity with real-life context will enable the individual to
identify and perform techniques, calculations, and other necessary skills. This
encourages deductive thinking and critical analysis to make sense of the context.
Hence, using a particular real-life scenario to develop certain skills can be a useful
approach. Being equipped with the appropriate skill sets supersedes content and
context (tools), thereby encouraging candidates to develop and devise techniques to
explore and understand the process/progression toward a solution.
Progression in skills development should follow a fluid structure. The content should
progress from developing the basic concepts to problem solving strategies.
In real-life contexts, there is progression from the familiar to less familiar scenarios,
where the candidate will go from topics that are personal (household matters e.g.
GETCA QUANTITATIVE LITERACY Curriculum Page 4
personal finance and budget) to broader topics like business environments (e.g.
interpreting and understanding one’s salary slip). Further progression is made, relating
to contexts involving social and political scenarios where a candidate engages with
national and global matters such as exchange rates. This also includes issues such as
hire-purchase, mortgage bonds, investments, cell phone contracts, reading maps, bus
and train schedules, using conversions in cooking, using ratio and proportion and
efficient use of a calculator, to name a few.
Competence is an indication of progression from the development of basic concepts,
skills, techniques and strategies to identifying appropriate applications to solve
problems that are both familiar and unfamiliar. A candidate will meet with specific real-
life situations that he/she will have to manage efficiently. The exposure to progression
would therefore, result in the growth in confidence of the candidate.
The progression through Quantitative Literacy should encourage and develop decision
making skills of the candidates. Within a given context, they should be able to apply
their knowledge to choose the most appropriate solution and have the ability to convey
this in an understandable manner.
While the content described in this document is compartmentalised, the candidate
should be able to combine the content sections such that the skills may be applied to
any given context.
GETCA QUANTITATIVE LITERACY Curriculum Page 5
Aims
The knowledge that can be developed is situation based and can be used to increase the
confidence and skills required for a candidate to acquire a job. This document aims to
provide a guideline that can build on the existing skills of the candidate, as well as
complimenting the skills that may have been neglected throughout secondary
education. Furthermore, this course is aimed at candidates that have not completed
Grade 9 level studies. Barriers to learning must also be evaluated by educators, in order
to dynamically deliver content.
1. Within a South African context, the development of certain skills must be
addressed. The following considerations should be made in order to ensure that
adult education can compensate for lacking prior knowledge:
1.1. Skills must be developed to bridge the gaps that may have arisen due to
social, economic and personal differences.
1.2. Providing the means for candidates to pursue tertiary education and/or
attain sustainable employment.
1.3. Analysing the developments of the South African society in order to give
candidates the experience in problem solving and decision making in real-
life situations.
1.4. Giving candidates the opportunity to become integral members of society,
thereby improving their personal lives.
1.5. The level of education should also be of an international standard to
promote self-improvement, hence the development of the country.
2. Each candidate should also develop the following personal skills and attributes:
2.1. The ability to participate in active learning that includes interaction and
participation. This aids in building the confidence of the candidate.
2.2. Encouraging interest and enthusiasm to engage with situational content,
which would stimulate further learning.
2.3. Improving understanding and communication such that a candidate may be
able to give both mathematical and written solutions. This includes
understanding of various modes of data.
2.4. Incorporating the use of technology to provide the necessary skills required
in any work environment.
2.5. Candidates should learn to work independently and within teams.
2.6. Personal responsibility and organisation should be encouraged, such that
independent learning may also be facilitated.
2.7. Analysing, collecting and observing data from ones surrounding should be
promoted.
GETCA QUANTITATIVE LITERACY Curriculum Page 6
Exit-Level Outcomes
The Exit Level Outcomes are used within the assessments to determine the competence
of the candidate. Summative assessments include tests that can be done at the end of
sections, terms and year. The summative assessments can be used to evaluate the
abilities of the student at any given point in time. The following Exit Level Outcomes
should be achieved in Mathematical Literacy:
ELO 1: Use numbers and their relationships to estimate, calculate and
investigate the financial aspects of personal, business and social life in
order to solve problems in real contexts. This Learning Outcome uses real life situational based problems to test practical use of
numbers. Candidates should be able to use simple calculations (using a non-scientific
calculator) and mental arithmetic to estimate conclusions. This is most relevant for
financial based problems that involve social, economic and personal life. This is done
contextually by considering income, expenditure, profit/loss, and budgets. These skills
may extend to basic use of a non-scientific calculator to find solutions. This also includes
patterns and relationships with numbers.
ELO 2: Recognise, analyse, interpret, describe and represent various
functional relationships in order to solve problems in real contexts. The candidate is encouraged to investigate and analyse relationships that occur in real
life scenarios. Furthermore, the candidates should be able to evaluate the relationships
between variables and use this to draw conclusions and find the value associated with
variables. This may include functions, that can be extended to a graphical
representation, which can be found in various financial and economic contexts.
ELO 3: Use measurement to estimate and calculate physical quantities
in order to describe and represent properties of and relationships
between 2D and 3D objects. The skills of observation and spatial awareness should be developed through
geometrical and measurement concepts. This is relevant when solving problems
involving time, conversions and ratio. The candidate’s basic sense of geography should
be taught through maps, plans, models and other representations of physical constructs.
This can be used by the candidate for design and creativity.
GETCA QUANTITATIVE LITERACY Curriculum Page 7
ELO 4: Collect, summarise, represent and analyse data and apply
knowledge of statistics and probability in order to communicate,
justify, predict and critically analyse results and draw conclusions. Data can be represented in various graphical, diagrammatical and even raw
presentations. The candidate should be able to create these representations from raw
data. The candidates would also acquire statistical knowledge, by considering
probability. This can be done by considering the likelihood of an event occurring in any
real life situation.
GETCA QUANTITATIVE LITERACY Curriculum Page 8
Taxonomy and Weighting of Exit-Level Outcomes
The assessments include content that requires varying cognitive levels. The following
taxonomy should be used:
Level 1: Knowing
Level 2: Applying routing procedures in familiar contexts
Level 3: Applying multistep procedures in a variety of contexts
Level 4: Reasoning and reflecting
Description of the Mathematical Literacy Taxonomy
Level 1: Knowing
This includes basic arithmetic, appropriate vocabulary and communication to describe
data, basic formulae (area of rectangle, triangle, circle), and reading information from a
table.
Level 2: Applying routing procedures in familiar contexts
This requires the candidate to know what procedure is required based on the nature of
the problem. This is used in solving equations, drawing graphs, using data or equations,
and measuring dimensions.
Level 3: Applying multistep procedures in a variety of contexts
The candidate will be required to choose the most appropriate procedure that will be
applied to a problem, where prerequisite calculations may be required. The candidate
must also understand data types and be able the represent it with the most appropriate
graph, and extract the relevant information to solve a given problem.
Level 4: Reasoning and reflecting
The candidate must be able to answer questions using selected content, and be able to
interpret and explain their solution based on the given context. They must also be able
to analyse and comment on other types of solutions. The candidates must also be able to
find a pattern that may produce a desired outcome by making predictions based on the
given evidence and context of the problem.
GETCA QUANTITATIVE LITERACY Curriculum Page 9
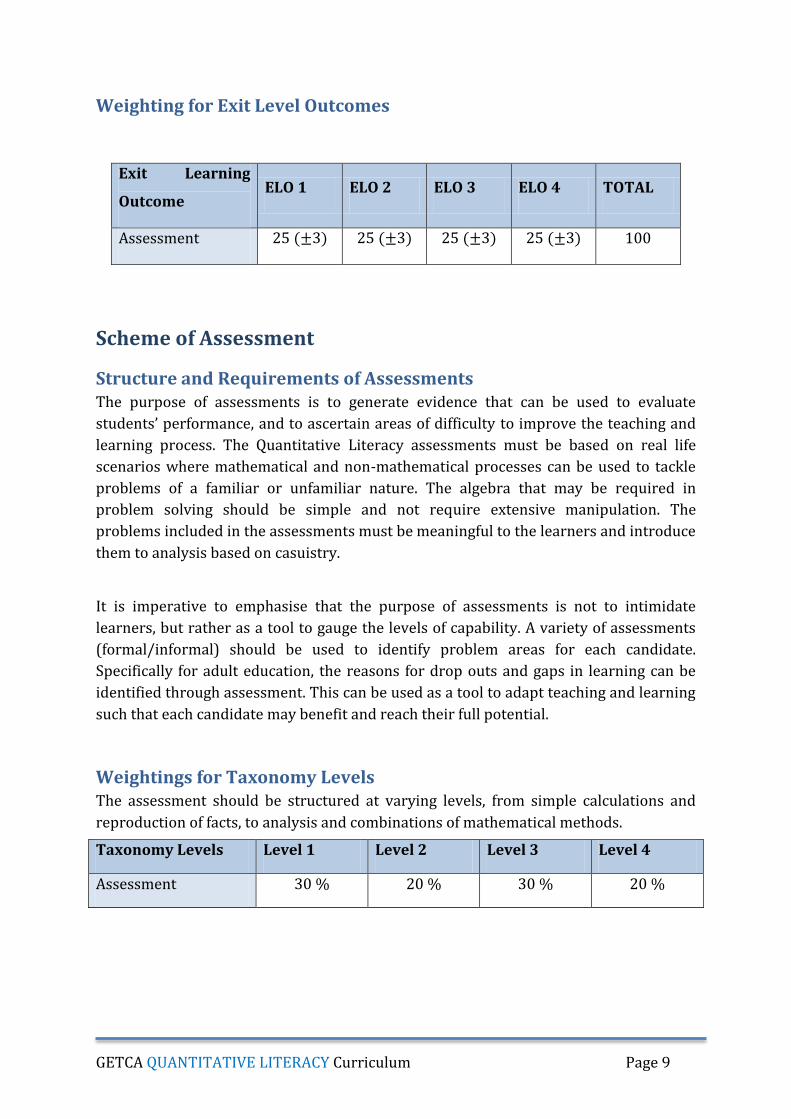
Weighting for Exit Level Outcomes
Exit Learning
Outcome ELO 1 ELO 2 ELO 3 ELO 4 TOTAL
Assessment 25 (±3) 25 (±3) 25 (±3) 25 (±3) 100
Scheme of Assessment
Structure and Requirements of Assessments The purpose of assessments is to generate evidence that can be used to evaluate
students’ performance, and to ascertain areas of difficulty to improve the teaching and
learning process. The Quantitative Literacy assessments must be based on real life
scenarios where mathematical and non-mathematical processes can be used to tackle
problems of a familiar or unfamiliar nature. The algebra that may be required in
problem solving should be simple and not require extensive manipulation. The
problems included in the assessments must be meaningful to the learners and introduce
them to analysis based on casuistry.
It is imperative to emphasise that the purpose of assessments is not to intimidate
learners, but rather as a tool to gauge the levels of capability. A variety of assessments
(formal/informal) should be used to identify problem areas for each candidate.
Specifically for adult education, the reasons for drop outs and gaps in learning can be
identified through assessment. This can be used as a tool to adapt teaching and learning
such that each candidate may benefit and reach their full potential.
Weightings for Taxonomy Levels The assessment should be structured at varying levels, from simple calculations and
reproduction of facts, to analysis and combinations of mathematical methods.
Taxonomy Levels Level 1 Level 2 Level 3 Level 4
Assessment 30 % 20 % 30 % 20 %
GETCA QUANTITATIVE LITERACY Curriculum Page 10
Structure of the Examination Papers
The following guideline is structured as per the Exit Learning Outcomes and should be
used in conjunction with the weighting of the taxonomy levels to structure
examinations.
Exit Learning Outcome 1
Numbers and Calculations with Numbers
1. Number Formats: Representation of numerical values including scientific
notation.
2. Estimation and Rounding: Reasons and methods of estimations and rules for
rounding off.
3. Mental and Calculator Arithmetic: Understanding which type of arithmetic is
most appropriate when solving problems.
4. Working with Formulae: Equations and substitution.
5. Percentages: Comparing quantities using percentage, and using percentage
increase/decrease.
6. Ratio, Rate and Proportion: Understanding how to use these based on the given
context.
Finance
1. Working with Invoices: Analysing personal receipts and statements and
understanding the importance of the information shown.
2. Understanding a budget: Types of expenses (fixed and variable), and considering
the importance of a personal budget.
3. Income and Expenses: Knowing the difference between a salary, wages,
commission, casual work, and piece work. Here the understanding of the balance
of income and expenses is fundamental in developing personal responsibility
and emphasises the importance of employment to sustain personal expenses.
4. Interest: Simple interest and hire purchase. This teaches the candidate about
how money should be managed for payments and investments.
Exit Learning Outcome 2
Numbers and Calculations with Numbers
The basic concepts outlined in Exit Learning Outcome 1 will also be incorporated in
understanding the content and answering questions for Exit Learning Outcome 2.
GETCA QUANTITATIVE LITERACY Curriculum Page 11
Patterns, Relationships and Representations
1. The Cartesian plane: Plotting and joining points on the Cartesian plane.
2. Working with Tables: Using relationships and equations to complete tables,
dependent and independent variables and how these are represented in a
tabular form.
3. Working with Axes: The importance of the scale of the graph and how to decide
on an appropriate scale using the given data.
4. Drawing Graphs: Representing functions and tabular data on a graph, and using
the graph to read off information. This may be linked with the finance section as
many of the graphical representations involve sales.
5. Other Graph Types: Indirect/Inverse proportion. The information on the graphs
may be used to make decisions on feasibility based on the situation.
6. Interpreting Graphs: Understanding the relationships shown on the graph and
using them to find solutions.
Exit Learning Outcome 3
Measurement
1. Reading Measuring Instruments: Understanding the use of the scales used on
various instruments.
2. Measuring: Considering accuracy and how estimation should be used to
determine reasonable measurements.
3. Conversions: This requires understanding of units of measurement and how they
can be compared. The candidate should understand the magnitude of basic
dimensions (a meter is smaller than a kilometre). Learners should know how to
use the cross multiplication method to make conversions. This includes
conversions between the imperial and metric systems of measurement.
4. Calculating Perimeter, Area and Volume: Finding the area and perimeter of
circles, triangles, and rectangles. The basic use of the Theorem of Pythagoras
should be understood. Using formulae to find the surface area and volume of
cubes, rectangular prisms and cylinders.
Maps, Plans and Other Representations
This topic can be used most extensively with social and environmental situations to
teach the candidate to understand and interact with the world.
1. Working with Map Scales: Use of ratio to represent map scales to understand the
relationship between the distance on a map and the actual distance. The use of
bar scales and maps can be used to determine unknown variables.
2. Different Points of View: Considering the different perspectives of viewing a
three dimensional object and how they may appear in real life. The different
GETCA QUANTITATIVE LITERACY Curriculum Page 12
views should be used to enhance the spatial awareness and understanding of the
candidate.
3. Scale Drawings and Plans: Floor plans and scale diagrams show learners how
spaces can be represented, and lends itself to understanding design.
4. Instruction Diagrams: Following a set of instructions to complete tasks of shape
construction.
5. Models: Understanding how shapes can be used in building, designing and
packaging.
Exit Learning Outcome 4
Data Handling
1. Types of Data: Considering the difference between discrete and continuous data
and how it should be classified.
2. Collecting the Data: Conducting surveys and questionnaires to obtain data.
Candidate must understand the meanings of population, census and
representative/ random samples.
3. Organising the Data: Selecting frequency tables or stem-and-leaf plots to
appropriately organise the data.
4. Displaying the Data: Bar graphs, Histograms, Pie charts and Line Graphs.
5. Analysing the Data: Measures of central tendency and spread, and interpreting
data.
Probability
1. Expressions of Probability: Percentages, common fractions and decimal
fractions.
2. Calculating the Probability of an Event: Considering the number of likely events
as a fraction of the total events.
3. Tree Diagrams: Understanding the change in probability with successive events.
Structure of Examination
The paper should consist of six questions as follows:
Question 1: Basic Skills (questions that are independent of the context) – 20 Marks
Question 2-5: Integrating each of the ELO’s within a limited requirement of contextual
understanding and minimal problem solving skills - (25 × 4) Marks
Question 6: Include content that is fully integrated with problem solving using the given
context – 30 Marks
The sub-questions should be used to test the various levels as shown in the weighting
for the taxonomy levels. The total mark for the paper must 150.
GETCA QUANTITATIVE LITERACY Curriculum Page 13
Guidelines for Lecturers and Materials Developers
The educators should be aware of the background of the students in order to assist
them in bridging gaps in content and becoming aware of their problem areas. This
document is centred on adult education and further training for secondary school drop-
outs. As such, candidates may have personal difficulties with learning.
The structure of this curriculum is based on adult education and includes topics that can
be used to allow candidates to pursue further education and employment. The content
recommended is applicable to the understanding of daily life, and takes real-life
situations to teach problem solving. It is suggested that the content be varied in terms of
the types of assessment to identify particular areas where learning and teaching can be
improved. The teachers are encouraged to use current affairs and situations that the
candidates can relate to in order to stress the relevance of the content.
The circumstances of the candidates should be understood by the educator, and they
should be sensitive to personal difficulties and certain barriers that may have led to
candidate drop-out. These issues can be overcome with mentorship and adaptation of
teaching styles to encourage learning and engagement.
Guidelines for Practicals / Activities
The use of practicals, class activities and controlled tests give the candidate the
opportunity to engage with the content on different levels of independence and increase
variety in the learning process.
Control Tests These tests should simulate examination conditions on order to prepare students for
the structure and content of the examination. The candidates should be given the
detailed test content with ample time to prepare for the test.
Assignments The assignments should be structured well and clearly state the objectives and expected
outcomes. They can be used to consolidate the content covered in a topic, apply skills
and techniques, and revise for examinations. The assignments should be based on real-
life contexts and should allow the candidate to work independently and engage with
peers. This should be done in class where the relevant material is given to the
candidates.
GETCA QUANTITATIVE LITERACY Curriculum Page 14
Assignment Topics based on the Exit Learning Outcomes
1. ELO 1: A household statement or financial bill can be used to analyse and identify
key financial components.
2. ELO 2: The relationship between electricity consumption and cost can be
represented graphically by the candidates. This information can be supplied by
the educator.
3. ELO 3: The candidate can use a given road map to determine the distance
between locations using the scale given. The educator may also obtain templates
for constructing shapes out of paper/cardboard, where the candidates are given
the opportunity to create the shapes and understand spatial dimensions.
4. ELO 4: The educator may supply the students with a pack of playing cards or
dice, and the candidates can use this to determine the likelihood of obtaining a
certain outcome.
GETCA QUANTITATIVE LITERACY Curriculum Page 15
Assumptions about Prior Knowledge and Skills Given that the curriculum is aimed at adult education, the prior knowledge is assumed
to be minimal, hence the material presented covers all the fundamental knowledge that
it required for the subject. It is also recommended that any candidate that does not have
the foundational skills at a Grade 9 level should enrol for this course.
GETCA QUANTITATIVE LITERACY Curriculum Page 16
THEME / COMPONENT 1: Basic Skills Topics
Introduction
The Basic Skills Topics form the fundamentals of Quantitative Literacy. These concepts
are taught to create an understanding of the representation of numerical values. These
skills are vital to proceeding sections (finance, data handling, probability, etc.) as the
candidates will learn to understand how to apply numbers to the given context.
Rationale for Content Selection
These basic skills are extremely useful in the demonstration of mathematical skills in
the real world and how this can be used to understand one’s surroundings. The
importance of numerical values is stressed as candidates become aware of the types of
numbers and values that are expected in solutions to daily life problems. This content is
aimed at developing basic Quantitative Literacy to increase the competency of students
in understanding problems they will face on a daily basis.
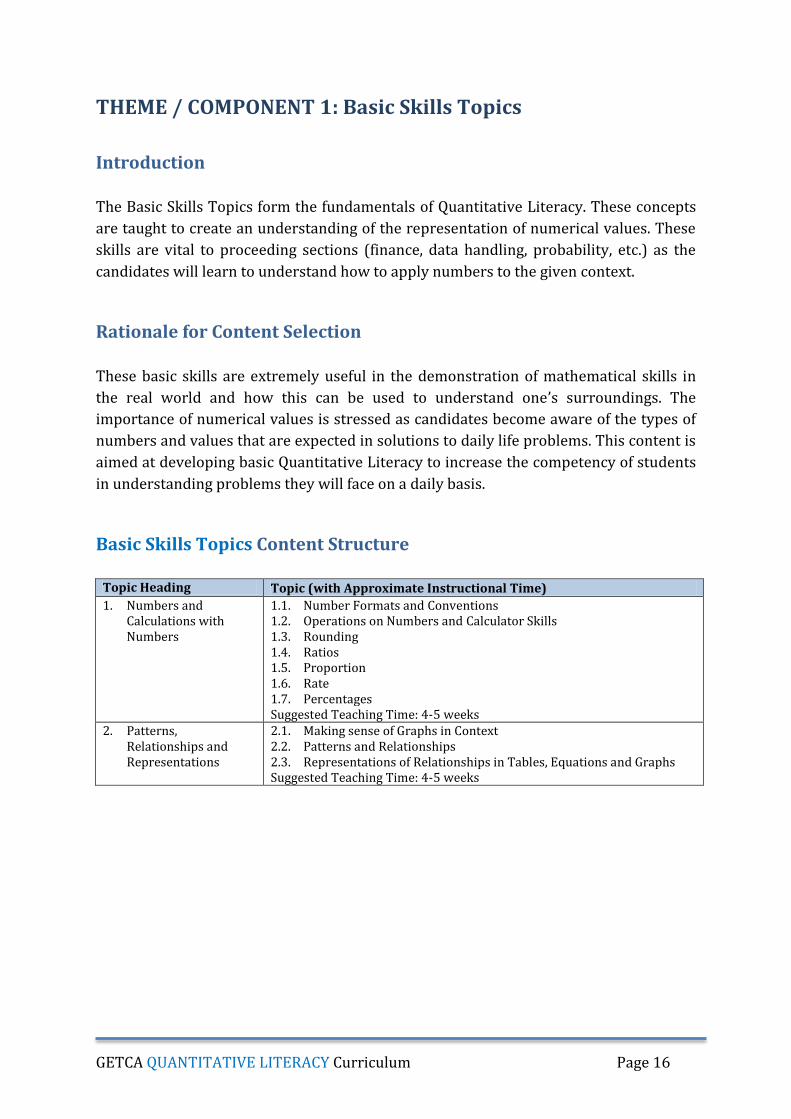
Basic Skills Topics Content Structure
Topic Heading Topic (with Approximate Instructional Time)
1. Numbers and Calculations with Numbers
1.1. Number Formats and Conventions 1.2. Operations on Numbers and Calculator Skills 1.3. Rounding 1.4. Ratios 1.5. Proportion 1.6. Rate 1.7. Percentages Suggested Teaching Time: 4-5 weeks
2. Patterns, Relationships and Representations
2.1. Making sense of Graphs in Context 2.2. Patterns and Relationships 2.3. Representations of Relationships in Tables, Equations and Graphs Suggested Teaching Time: 4-5 weeks
GETCA QUANTITATIVE LITERACY Curriculum Page 17
Section 1. Numbers and Calculations with Numbers
Overview
1.1. Number Formats and Conventions Content:
For the purpose of understanding calculations and number types,
learners must be able to use the following number formats: whole
numbers, decimals, fractions and percentages.
Learning Outcomes:
Students should be able to:
1.1.1. Knowing how to use numbers with a decimal comma and a decimal point.
1.1.2. Recognising the use of a comma or space as a thousand separators. 1.1.3. Understanding that positive and negative numbers represent a certain
direction in the given context. 1.1.4. Evaluating numbers in a word format.
1.2. Operations on Numbers and Calculator Skills Content:
Using numerical values to understand further mathematical topics such
as measurement, finance and relationships.
Knowing how to use an estimated answer as a benchmark for a
calculated answer.
Performing basic calculations mentally and with a non-scientific
calculator.
Learning Outcomes:
Students should be able to:
1.2.1. Estimate and calculate solutions based on the given situation.
1.2.2. Perform mathematical operations (addition, subtraction, multiplication
and division) with and without the use of a calculator. Students must
also be able to perform mathematical operations in the correct order.
1.2.3. Understand the use of brackets within calculations.
The importance of numerical values is stressed as candidates become aware of the types of numbers and values that are expected in solutions to daily life problems. These numbers are then used to explain the relationships between numbers and how these can result in a pattern and can be shown graphically. A non-scientific calculator must be sufficient for all numerical calculations.
GETCA QUANTITATIVE LITERACY Curriculum Page 18
1.3. Rounding Content:
At this level, students must be able to apply the correct rounding type
and procedure to numerical values.
The candidates must be given the number of decimal places and the type
of rounding to be used.
Learning Outcomes:
Students should be able to:
1.3.1. Round off numerical values
1.3.2. Rounding up/down using the appropriate rules.
1.4. Ratios Content:
The concept of ratio must be used to demonstrate how different
quantities can be mixed and in what proportions.
Rates and percentage calculations must be taught.
Conversion types and methods must be shown to create an
understanding of the dimensions that accompany a numerical value.
The scale of a number must be shown in the contexts that they will be
used.
Learning Outcomes:
Students should be able to:
1.4.1. Convert numbers from one form of a ratio to another.
1.4.2. Dividing a quantity according to a given ratio.
1.4.3. Recognise the different formats and representations of a ratio.
1.4.4. Understand that there are no units assigned to a ratio.
1.4.5. Compare equivalent ratios.
1.5. Proportion
Content:
This content must be used as the basis for graphs where the candidate
will grasp the relationships between numbers
Learning Outcomes:
Students should be able to:
1.5.1. Identify direct and indirect proportion in a given relationship.
GETCA QUANTITATIVE LITERACY Curriculum Page 19
1.6. Rates Content:
Costs, tariffs and consumption are explained to allow comparison
between different options.
Speed, distance and time calculations must be shown using maps and
travel routes.
Conversions between units are required to compare costs, tariffs and
consumption.
Learning Outcomes:
Students should be able to:
1.6.1. Use cost and consumption rates in calculations.
1.6.2. Perform calculations involving speed, distance and time.
1.6.3. Simplify and compare rates.
1.7. Percentages
Content:
The use of percentages in discounts, tax, budgets and marks.
Estimating quantities used in measurement.
Representing values as percentages to use them in comparisons.
Expressing probability as a percentage.
Learning Outcomes:
Students should be able to:
1.7.1. Increase/decrease a value by a certain percentage.
1.7.2. Express any part of a whole as a percentage.
GETCA QUANTITATIVE LITERACY Curriculum Page 20
Section 2. Patterns, Relationships and Representations
Overview
2.1. Making Sense of Graphs in Context Content:
Using graphs to explain a real life relationship.
Describing the relationships between variables that are represented in a
graph or table.
Learning Outcomes:
Students should be able to:
2.1.1. Work with various resources such as newspapers, financial statements
and other contextual data to analyse relationships.
2.1.2. Recognise and explain the meaning of certain points on the graph and
use this to answer questions and describe the relationship.
2.2. Patterns and Relationships Content:
Considering equations with a constant relationship between the terms.
Linear relationships between variables.
Relationships with an inverse proportion.
Understanding how the mathematical equations can represent the
relationships in everyday life contexts.
Learning Outcomes:
Students should be able to:
2.2.1. Understand that patterns and relationships are used in measurement
and dimensions.
2.2.2. Combine the skills of data handing to obtain and understand the
relationships that exist between variables.
2.2.3. Describe the relationship between terms in a sequence, and determine
increasing/decreasing relationships.
2.2.4. Identify dependent and independent variables.
Learners must be exposed to different types of patterns, relationships and representations. They must be able to understand these within their given context and be able to apply them to other application topics.
GETCA QUANTITATIVE LITERACY Curriculum Page 21
2.3. Representations of Relationships in tables, Equations and Graphs Content:
Using graphs, tables and equations in further application topics.
Substituting into equations to solve for a variable, with no manipulation
of the equations required.
Using tables to draw graphs.
Learning Outcomes:
Students should be able to:
2.3.1. Substitute and solve for a variable using the given equation.
2.3.2. Understand how tables and graphs can be used to show the same
relationship.
2.3.3. Plot graphs using a table of values to show a relationship.
GETCA QUANTITATIVE LITERACY Curriculum Page 22
THEME / COMPONENT 2: Application Topics
Introduction
The content outlined in the following sections depends on the basic skills shat should be
developed in the previous topics. The sections on finance, measurement, maps and
plans, data handling and probability use operations of numbers and the relationships to
apply mathematical concepts to the real world.
Rationale for Content Selection
These topics will be used to introduce the candidates to real life problems and how
these can be solved using specific methods. They will become more aware of their
surroundings and be able to understand certain personal responsibilities such as
finance. The content is crucial in establishing the fundamentals in understanding social,
economic, and political problems in simple quantitative manner.
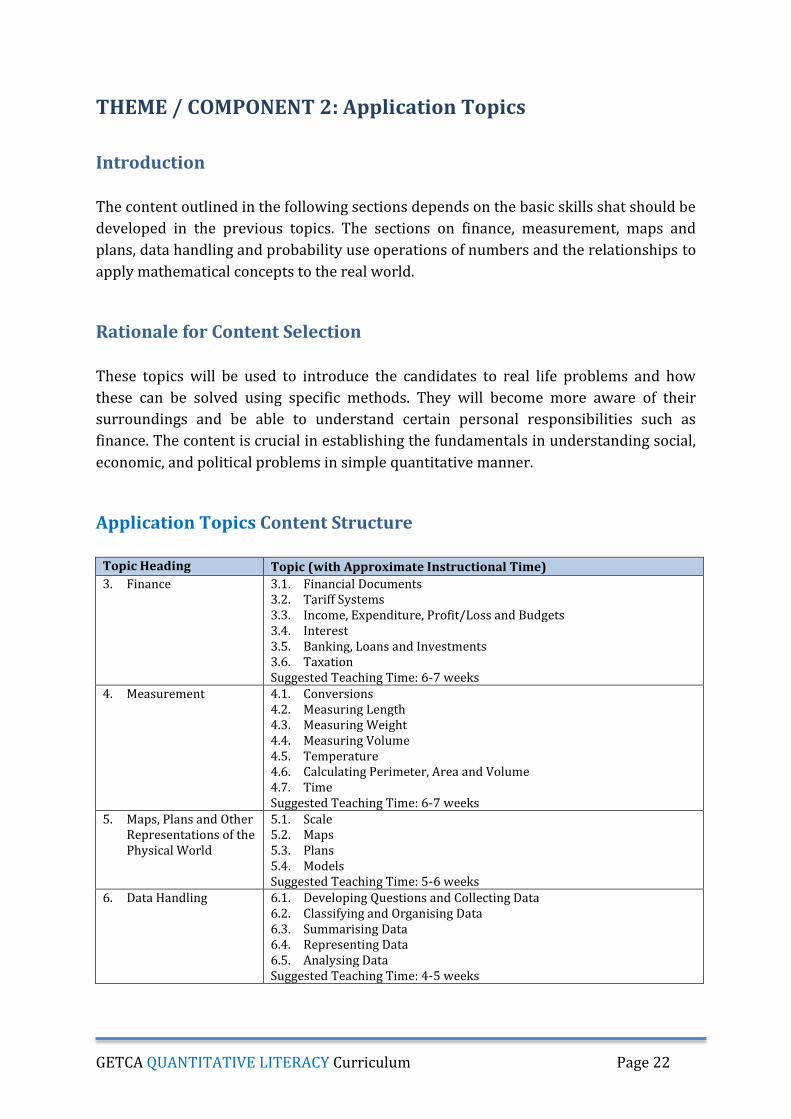
Application Topics Content Structure
Topic Heading Topic (with Approximate Instructional Time)
3. Finance 3.1. Financial Documents 3.2. Tariff Systems 3.3. Income, Expenditure, Profit/Loss and Budgets 3.4. Interest 3.5. Banking, Loans and Investments 3.6. Taxation Suggested Teaching Time: 6-7 weeks
4. Measurement 4.1. Conversions 4.2. Measuring Length 4.3. Measuring Weight 4.4. Measuring Volume 4.5. Temperature 4.6. Calculating Perimeter, Area and Volume 4.7. Time Suggested Teaching Time: 6-7 weeks
5. Maps, Plans and Other Representations of the Physical World
5.1. Scale 5.2. Maps 5.3. Plans 5.4. Models Suggested Teaching Time: 5-6 weeks
6. Data Handling 6.1. Developing Questions and Collecting Data 6.2. Classifying and Organising Data 6.3. Summarising Data 6.4. Representing Data 6.5. Analysing Data Suggested Teaching Time: 4-5 weeks
GETCA QUANTITATIVE LITERACY Curriculum Page 23
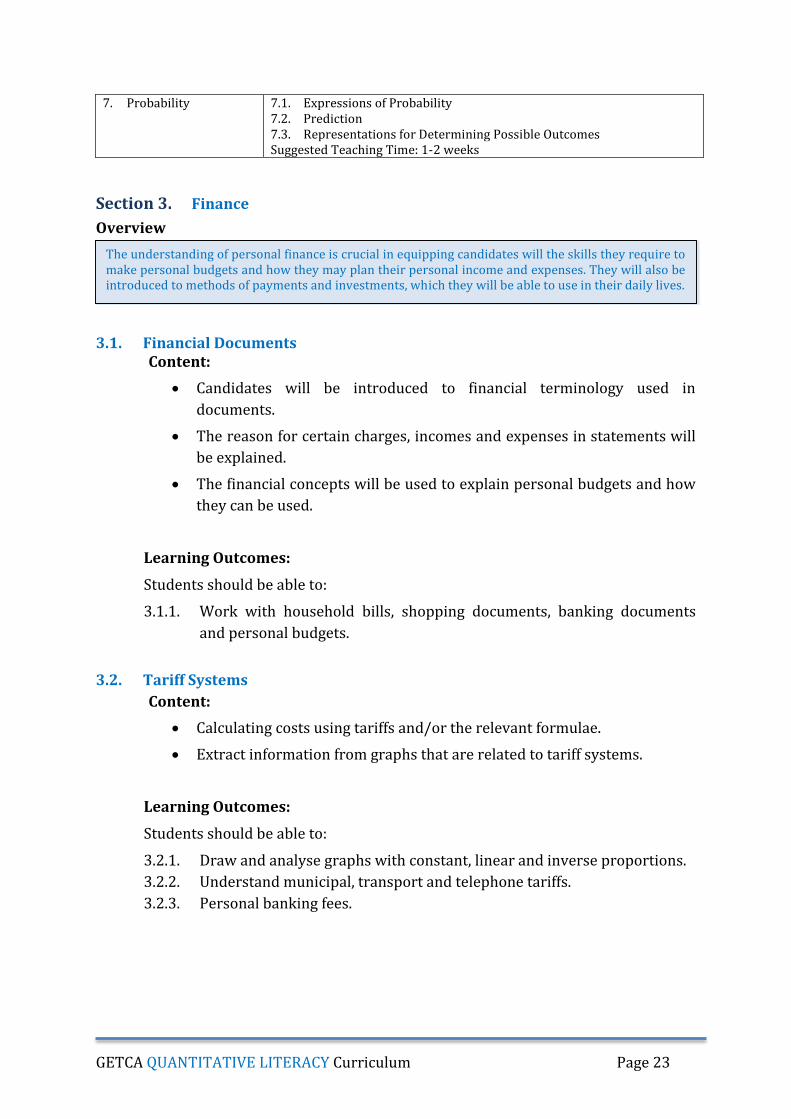
7. Probability 7.1. Expressions of Probability 7.2. Prediction 7.3. Representations for Determining Possible Outcomes Suggested Teaching Time: 1-2 weeks
Section 3. Finance
Overview
3.1. Financial Documents Content:
Candidates will be introduced to financial terminology used in
documents.
The reason for certain charges, incomes and expenses in statements will
be explained.
The financial concepts will be used to explain personal budgets and how
they can be used.
Learning Outcomes:
Students should be able to:
3.1.1. Work with household bills, shopping documents, banking documents
and personal budgets.
3.2. Tariff Systems
Content:
Calculating costs using tariffs and/or the relevant formulae.
Extract information from graphs that are related to tariff systems.
Learning Outcomes:
Students should be able to:
3.2.1. Draw and analyse graphs with constant, linear and inverse proportions.
3.2.2. Understand municipal, transport and telephone tariffs.
3.2.3. Personal banking fees.
The understanding of personal finance is crucial in equipping candidates will the skills they require to make personal budgets and how they may plan their personal income and expenses. They will also be introduced to methods of payments and investments, which they will be able to use in their daily lives.
GETCA QUANTITATIVE LITERACY Curriculum Page 24
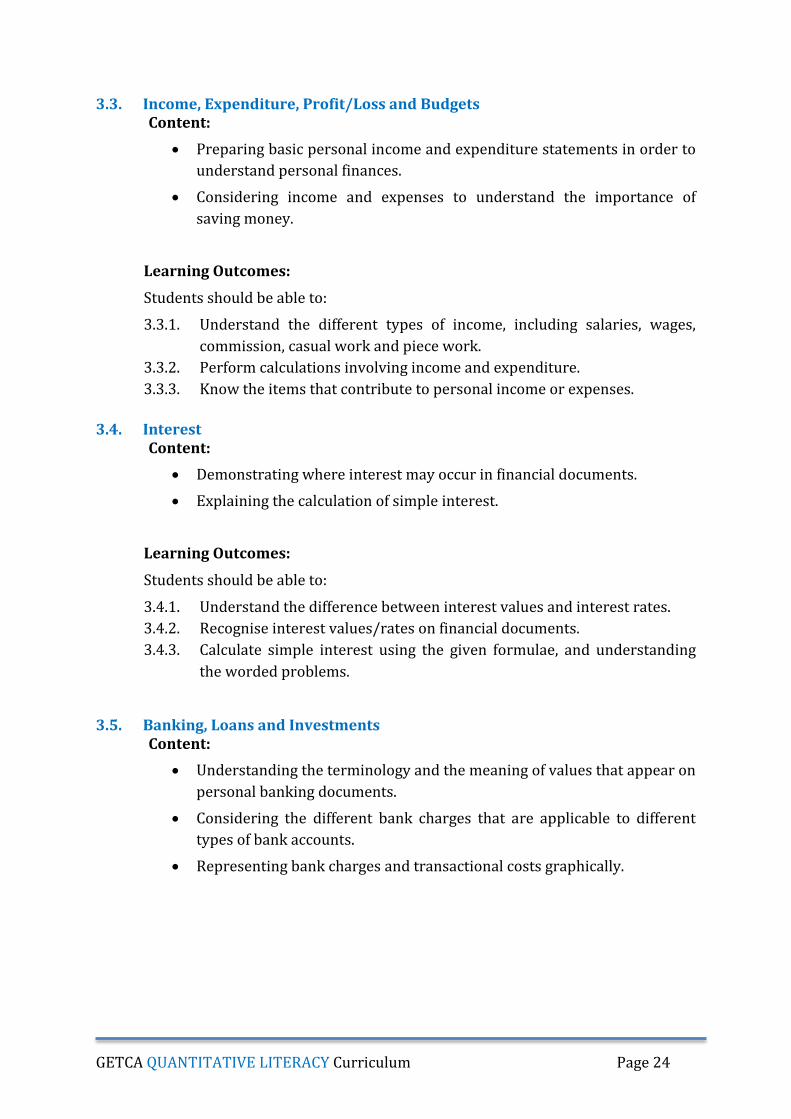
3.3. Income, Expenditure, Profit/Loss and Budgets Content:
Preparing basic personal income and expenditure statements in order to
understand personal finances.
Considering income and expenses to understand the importance of
saving money.
Learning Outcomes:
Students should be able to:
3.3.1. Understand the different types of income, including salaries, wages,
commission, casual work and piece work.
3.3.2. Perform calculations involving income and expenditure.
3.3.3. Know the items that contribute to personal income or expenses.
3.4. Interest
Content:
Demonstrating where interest may occur in financial documents.
Explaining the calculation of simple interest.
Learning Outcomes:
Students should be able to:
3.4.1. Understand the difference between interest values and interest rates.
3.4.2. Recognise interest values/rates on financial documents.
3.4.3. Calculate simple interest using the given formulae, and understanding
the worded problems.
3.5. Banking, Loans and Investments Content:
Understanding the terminology and the meaning of values that appear on
personal banking documents.
Considering the different bank charges that are applicable to different
types of bank accounts.
Representing bank charges and transactional costs graphically.
GETCA QUANTITATIVE LITERACY Curriculum Page 25
Learning Outcomes:
Students should be able to:
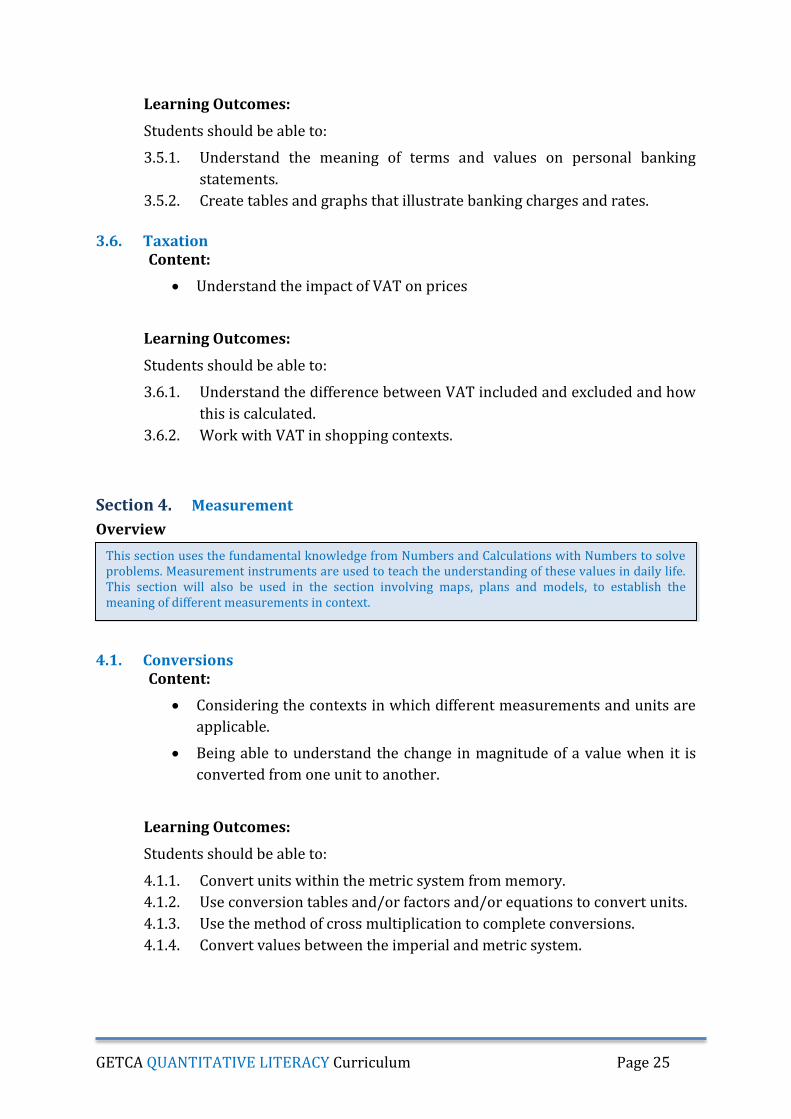
3.5.1. Understand the meaning of terms and values on personal banking
statements.
3.5.2. Create tables and graphs that illustrate banking charges and rates.
3.6. Taxation
Content:
Understand the impact of VAT on prices
Learning Outcomes:
Students should be able to:
3.6.1. Understand the difference between VAT included and excluded and how
this is calculated.
3.6.2. Work with VAT in shopping contexts.
Section 4. Measurement
Overview
4.1. Conversions Content:
Considering the contexts in which different measurements and units are
applicable.
Being able to understand the change in magnitude of a value when it is
converted from one unit to another.
Learning Outcomes:
Students should be able to:
4.1.1. Convert units within the metric system from memory.
4.1.2. Use conversion tables and/or factors and/or equations to convert units.
4.1.3. Use the method of cross multiplication to complete conversions.
4.1.4. Convert values between the imperial and metric system.
This section uses the fundamental knowledge from Numbers and Calculations with Numbers to solve problems. Measurement instruments are used to teach the understanding of these values in daily life. This section will also be used in the section involving maps, plans and models, to establish the meaning of different measurements in context.
GETCA QUANTITATIVE LITERACY Curriculum Page 26
4.2. Measuring Length Content:
Estimation and measurement of values to solve problems.
Using maps and scaled to determine the distance between points.
Learning Outcomes:
Students should be able to:
4.2.1. Be able to estimate the length of certain units in in order to make
comparisons.
4.2.2. Use various measuring instruments.
4.2.3. Calculate the cost of products associated with a certain length.
4.3. Measuring Mass Content:
Measurement of quantities in a recipe, and other applications that may
involve the ratio of masses.
Measuring and recording masses.
Learning Outcomes:
Students should be able to:
4.3.1. Use measurement instruments to obtain numerical values.
4.3.2. Understand the use of mass in daily life.
4.3.3. Perform calculations involving mass.
4.4. Measuring Volume Content:
Measuring volume to solve a problem.
Calculating volumes of shapes using the given formulae.
Learning Outcomes:
Students should be able to:
4.4.1. Use formulae to calculate volumes and solve problems involving cost per
unit volume.
4.4.2. Using measurement instruments to find the volume of quantities.
GETCA QUANTITATIVE LITERACY Curriculum Page 27
4.5. Measuring Temperature Content:
Understanding weather and cooking applications and how these
activities should be planned based on temperature.
Learning Outcomes:
Students should be able to:
4.5.1. Use temperature measuring instruments.
4.5.2. Understand how appropriate temperatures can be used to solve
problems within their context.
4.5.3. Convert between different units of temperature using the given
formulae.
4.6. Calculating Perimeter, Area and Volume
Content:
Using these quantities to determine the appropriate quantities that can
be used for each context.
Determining the cost associated with quantities calculated.
Creating spatial awareness using maps, plans and shapes.
Learning Outcomes:
Students should be able to:
4.6.1. Calculate perimeter, area and volume using the given formulae.
4.6.2. Measure relevant quantities and understand their context.
4.6.3. Using perimeter, area and volume to solve problems in real life.
4.7. Time
Content:
Planning activities and projects based on the time required.
Understanding of how variables change with time and how this can be
represented on a table/graph.
GETCA QUANTITATIVE LITERACY Curriculum Page 28
Learning Outcomes:
Students should be able to:
4.7.1. Use instruments to measure time and record values at certain time
intervals.
4.7.2. Understand the different time formats that can be used in different
situations.
4.7.3. Convert between different units of time.
4.7.4. Make use of calendars and timetables to understand the importance of
time and planning.
GETCA QUANTITATIVE LITERACY Curriculum Page 29
Section 5. Maps, Plans and Other Representations of the Physical World
Overview
5.1. Scale Content:
Using given scales to determine actual lengths and distances using maps
and plans.
Using numbers and ratios to understand the scaling of maps.
Learning Outcomes:
Students should be able to:
5.1.1. Work with the different formats of scale that are used on various maps
and plans.
5.1.2. Understand the advantages and disadvantages of using the different
types of scale and how this can impact on actual representations.
5.1.3. Use scale and ratio to calculate actual distances from a map.
5.2. Maps Content:
Considering the positioning of objects in relation to their surroundings.
Creating spatial awareness.
Identify locations and routes using maps.
Learning Outcomes:
Students should be able to:
5.2.1. Understand maps showing layouts of various surroundings and
buildings.
5.2.2. Use directions and distance to describe the location and route to a
particular object/location.
5.2.3. Recognise the different numbering and grid systems and use them to
identify and describe locations.
Taking maps, plans and models and using them to teach understanding of ones surroundings. This introduces basic Quantitative Literacy to candidates in a way that they can use it to understand the physical world
GETCA QUANTITATIVE LITERACY Curriculum Page 30
5.3. Plans Content:
Following instructions and procedures to complete a design or assembly.
Understanding the spatial orientation and basic construction of defined
objects.
Learning Outcomes:
Students should be able to:
5.3.1. Use instructions to construct shapes and simple models and understand
how certain components fit together.
5.3.2. Recognise how certain electrical appliances use basic plans to achieve a
purpose.
5.3.3. Read and understand diagrams and instructions and be able to follow
this to achieve the desired outcome.
5.3.4. Understand and use the different symbols that appear on plans to
analyse lengths, dimensions and shapes that could be used to specify
material selection.
5.3.5. Use basic floor, layout, elevation plans and design drawings to make
observations.
5.3.6. Constructing basic floor plans to describe a given environment.
5.4. Models Content:
Understand the space occupied by certain objects within certain
packaging and containers.
Using the concept of scale to understand how a model can represent
physical objects and spaces.
Learning Outcomes:
Students should be able to:
5.4.1. Use actual dimensions of objects to determine appropriate packaging
arrangements, to save space and provide cost effective solutions.
5.4.2. Compare different shapes to determine what could be their most
effective use within the context of the model.
5.4.3. Use two dimensional models to describe three dimensional objects and
spaces.
GETCA QUANTITATIVE LITERACY Curriculum Page 31
Section 6. Data Handling
Overview
6.1. Developing Questions and Collecting Data Content:
Considering the type of questions that people have in their personal
context, and what types of data can be collected to solve these problems.
Developing techniques used for data collection.
Learning Outcomes:
Students should be able to:
6.1.1. Develop their own questions and understand problems given to them to
understand the types of data required to solve the problem.
6.1.2. Use observations, interviews, questionnaires and other data collecting
techniques to obtain the relevant information.
6.1.3. Understand and use the appropriate terminology used to describe the
data (population, sample, etc.).
6.1.4. Consider the possible ways in which data can be misused/mis-
represented to convey a certain opinion.
6.2. Classifying and Organising Data Content:
Considering both numerical and non-numerical types of data.
Summarising the data using the appropriate tables and/or graphs.
Learning Outcomes:
Students should be able to:
6.2.1. Sort the collected data according to relevant categories.
6.2.2. Use tallies and frequency tables to organise the data.
6.2.3. Use intervals to sort groups of data.
The different types of data are considered to determine the most effective ways to organise and represent the given information. The data can then be used to analyse and extract the required information. Students will learn to collect and organise data independently to investigate relationships.
GETCA QUANTITATIVE LITERACY Curriculum Page 32
6.3. Summarising Data Content:
Using measures of central tendency and spread to summarise ungrouped
data only.
Consider trends and features of the data that can be used to answer
questions in one’s personal life.
Learning Outcomes:
Students should be able to:
6.3.1. Calculate measures of central tendency and spread, including; mean,
median, mode and range.
6.3.2. Understand the meaning and purpose of the measures of central
tendency and spread.
6.4. Representing Data Content:
Using the collected or given data to find the most appropriate
representation.
Understand the types of data that can be represented in each form.
Learning Outcomes:
Students should be able to:
6.4.1. Represent data using pie charts, histograms, bar graphs and line graphs
with the appropriate axes and labels.
6.4.2. Use the different graphs to determine solutions to problems (without the
need for estimation).
6.5. Interpreting and Analysing Data
Content:
Using data to answer questions that are set in real life contexts.
Understanding the purposes of each data representation and the types of
information that can be obtained.
Learning Outcomes:
Students should be able to:
6.5.1. Read and choose sections of the data to answer questions.
6.5.2. Identify trends that appear in the data.
6.5.3. Consider the origins, and method of organising data that would give the
final representation.
GETCA QUANTITATIVE LITERACY Curriculum Page 33
Section 7. Probability
Overview
7.1. Expressions of Probability Content:
Understanding that the probability of a certain event can be expressed as
a percentage or a fraction.
Introducing different types of events and the likeliness of an outcome.
Learning Outcomes:
Students should be able to:
7.1.1. Recognise the difference between an event and an outcome.
7.1.2. Use games, tests and predictions to determine the probability of an
event occurring.
7.2. Prediction Content:
Understanding that a prediction is the probability of the outcome of an
event.
Learning Outcomes:
Students should be able to:
7.2.1. Predict the outcome of an event using the given probability statements.
7.2.2. Understand worded probability statements and use these to create
mathematical statements.
7.3. Representations for Determining Possible Outcomes Content:
Using different physical and mathematical representations to determine
the probability of a certain outcome.
This section introduces the likeliness of the occurrence of certain events taken from real life situations. The chances of events occurring can be determined based on the types of events and their relationships.
GETCA QUANTITATIVE LITERACY Curriculum Page 34
Learning Outcomes:
Students should be able to:
7.3.1. Use tree diagrams and tables to determine the probability of an outcome.
7.3.2. Understand the possible outcomes when considering games and
predictions.