
Digital Libraries Unmil P. Karadkar Lecturer, School of Information UT Austin.
Quantitative Impact Evaluation of the United NationsMission in Liberia: Final Report
Eric Mvukiyehe∗
Cyrus Samii†
February 9, 2010
Contents
I. Executive summary 1
II. Scope and organization of the study 4
III. Description of the data 6
IV. Exposure to UNMIL 9
V. Respondent perceptions about UNMIL 10
VI. Monitoring cessation of hostilities 12A. Deployment and major re-escalation . . . . . . . . . . . . . . . . . . . . . . . 12B. Excombatant respondent perceptions . . . . . . . . . . . . . . . . . . . . . . 13C. Evidence from household sample respondents . . . . . . . . . . . . . . . . . . 13
VII. Disarmament, demobilization, reintegration and rehabilitation 15A. Describing the ex-combatant sample . . . . . . . . . . . . . . . . . . . . . . 15B. UNMIL’s provision of security during disarmament and demobilization . . . 16C. Participation in the reintegration program . . . . . . . . . . . . . . . . . . . 16D. Economic reintegration . . . . . . . . . . . . . . . . . . . . . . . . . . . . . . 17E. Social reintegration . . . . . . . . . . . . . . . . . . . . . . . . . . . . . . . . 19
VIII. Civilian protection and insecurity 20A. Victimization by armed groups . . . . . . . . . . . . . . . . . . . . . . . . . 21
∗Department of Political Science, Columbia University. Email: [email protected].†Department of Political Science, Columbia University. Email: [email protected].
1

B. Crime . . . . . . . . . . . . . . . . . . . . . . . . . . . . . . . . . . . . . . . 21C. Resettlement . . . . . . . . . . . . . . . . . . . . . . . . . . . . . . . . . . . 22
IX. Humanitarian assistance 24
X. Economic impacts 24A. Peacekeeping economies . . . . . . . . . . . . . . . . . . . . . . . . . . . . . 24B. Quick impact and employment projects . . . . . . . . . . . . . . . . . . . . . 25
XI. Social impacts 27
XII. Re-establishment of political order 28
XIII. Electoral assistance 29
XIV. Human rights promotion 30A. UNMIL’s respect for human rights . . . . . . . . . . . . . . . . . . . . . . . 30B. Social cohesion and human rights attitudes . . . . . . . . . . . . . . . . . . . 30
XV. Public information 32
XVI. Conclusion 32
I. Executive summary
1. This report contains a quantitative impact evaluation of the United Nations Mission inLiberia (UNMIL), commissioned by the United Nations Office of Internal Oversight Ser-vices (UNOIOS). The study is based on surveys and ancillary data collection in Liberia inDecember 2008-January 2009 and December 2009-January 2010 and focuses on mandatedelements that can have security, economic, social and political effects at the micro-level.The objectives of the study are to assess measurable local impacts of UNMIL’s deploymentsand to gauge the success of mandated activities conducted under the auspices of UNMIL’ssubstantive sections. Overall, the study suggests that UNMIL made important contributionto peace and to economic recovery and political rehabilitation. But there are some areas inwhich UNMIL’s impacts are at best mixed.
2. With regards to specific mandated elements, the study finds little evidence to suggestthat UNMIL had direct local impacts on conflict de-escalation and security at the local level.UNMIL assumed control of the peacekeeping operation as of 1 October 2003, two monthsafter the end of major fighting and no subsequent major battle events have been recorded.This suggests UNMIL had little active role to play in dealing with major aggression by armedgroups, although it remains possible that UNMIL’s presence was a blanket deterrent for theentire country against any such aggression.
2

3. However, survey results suggest that UNMIL enjoys high legitimacy as a securityprovider among Liberians represented in our sample. The overwhelming majority of respon-dents in the household sample credited UNMIL with helping to end the war. They alsostated that they have confidence in UNMIL’s ability to prevent armed groups from resuminghostilities and to protect civilians. Similar to their civilian counterparts, a large majority ofex-combatants stated that they were confident that UNMIL was capable of both preventingfighting among armed groups and protecting civilians. Nearly all ex-combatant respondentsstated that UNMIL made it more difficult for them and ”their enemies” to launch attacks andnearly all stated that third party peacekeeping was crucial to their decision to disarm. Theevidence on UNMIL’s impacts on civilian protection is mixed. On the one hand, the studyfinds that the rate of out-migration from communities distant from UNMIL deployments wasabout 1.5 times the rate in deployment communities. The estimated rate of resettlement wasabout 4 times higher in deployment communities than in distant communities, and the rate ofin-migration was about two times higher in deployment communities than in distant commu-nities. These higher rates of settlement into deployment communities may be due to directfacilitation of settlement by UNMIL, the economic attractiveness of such communities dueto market stimulation associated with deployments, or due to perceptions that deploymentareas would be more secure. On the other hand, the study does not find evidence to suggestthat UNMIL reduced crime victimization events such as robberies or physical attacks. Infact, the study finds a positive association between deployment proximity and self-reportedcrime victimization, but this effect is concentrated among recently settled households. Whatneeds to be determined is whether these robberies of attacks prompted the resettlement orwhether they happened after resettlement—something the data are too coarse to distinguish.
4. The legitimacy that UNMIL enjoyed as a security provider does not seem to carry overin the humanitarian realm. For the most part, respondents did not tend to see peacekeepersas having much of a humanitarian assistance role. Such responses did not vary significantlyacross deployment, proximate, and distant communities.
5. With respect to economic revitalization at the local level, the findings are mixed. Onincome, we see that deployments are associated with a substantial increase in the percentageof respondent households earning over the LRD 4500 mark (just under the $2 per day povertybenchmark), although we also see a slight increase in the number of respondents reportingthat their households earn nothing. The study also finds differences in the results for oc-cupations: Deployment communities are associated with higher proportions of respondentsengaged in unskilled labor and in commerce, as well as lower engagement in agriculture. Cer-tain forms of consumption (namely investments in home improvements) occur at a higherrate in deployment communities. The signs point toward deployments as stimulants to locallabor and commercial markets, although the distribution of benefits from such stimulationis not evenly spread. The evidence here does not show that UNMIL’s quick impact projectssignificantly transformed local economies in a manner that benefits recipient communities.In fact, the no-project communities fare better on almost every score.
6. The available data allow for some assessment of UNMIL’s contribution to politicalrehabilitation at the local level. There is some evidence suggesting that UNMIL’s investment
3

in electoral assistance may have helped empower citizens and raise awareness about women’srights. More specifically, nearly all respondents in our household sample indicated thatUNMIL was somehow involved in electoral processes where they lived and a large majorityof respondents stated that they thought the 2005 elections were free and fair. We also notethat while self-reported voter turnout was high among respondents in the household sample(89%), there were no significant differences between distant, proximate, and deploymentcommunities in such reports. However, the self-reported rate of participation in meetingsor rallies was considerably higher among women in deployment communities. We also notethat ex-combatants reported slightly higher levels of political engagement than their non-combatant counterparts in deployment communities, but their participation in meeting orrallies for the 2005 elections was slightly lower in these communities.
7. With respect to human rights promotion, the study suggests impacts associated withperspectives on gender, but there is little to suggest that deployment areas were hubs of ac-tivity that had any significant impact on inter-ethnic cohesion or perspectives on transitionaljustice.
8. Finally, there is evidence to suggest that deployment proximity is associated withless vibrant community life. Respondents from deployment communities tended to be lessengaged in activities such as cultural celebrations, community projects, political rallies orsecurity meetings-all of which underlie vibrant community life. This disturbing finding is alsoevidenced in the combatant sample: ex-combatants’ participation in local cooperatives andassociations is higher in distant communities than in proximate and deployment communities.This result may indicate consequences of economic and resettlement impacts of deploymentsin the localities.
9. With respect to exit strategy, UNMIL and the broader humanitarian community cancontribute to consolidating the peace in Liberia by (i) supporting the reintegration of newlyresettled households; (ii) supporting efforts to foster social and community cohesion, espe-cially among the newly resettled households; and (ii) providing electoral assistance to sustainpolitical interest on the part of the citizens. These efforts, combined with the government’sown initiatives in these areas could provide a more solid foundation for a self-sustainingpeace.
4

II. Scope and organization of the study
10. This report contains a quantitative impact evaluation of the United Nations Mission in
Liberia (UNMIL), commissioned by the United Nations Office of Internal Oversight Services
(UNOIOS). It is based on surveying and ancillary data collection in Liberia in December
2008-January 2009 and December 2009-January 2010.1 The objectives of this report are to
assess measurable aspects of UNMIL’s contribution to consolidating peace in Liberia thus
far, and also to suggest areas for heightened attention in future programming.
11. In style and content, this study is modeled on a previous quantitative impact evalu-
ation of the UN Operation in Cote d’Ivoire (UNOCI).2 However, a key difference should be
noted: the survey in Liberia was designed to exclusively measure impacts of UNMIL. The
study was not designed to characterize the Liberian population generally. The sample is
not a representative sample of the Liberian population, but rather one that intentionally in-
cluded only communities that either (i) received UNMIL deployments or (ii) did not receive
deployments, but resembled recipient communities in terms of socio-economic conditions and
geography, thus providing a comparison group for recipient communities. The results in this
report should not be mistaken as providing a characterization of the Liberian population
generally.
12. The core hypothesis that this evaluation tests is that peacekeeping deployments
have local impacts, laying the seeds of social, economic, and political transformation that can
lead to sustainable peace. These effects are hypothesized to trickle out into society, creating
expanding islands of stability, democratic institutionalization, and economic rehabilitation.
Rigorous cross-national studies have demonstrated that peacekeeping operations are asso-
ciated with more durable peace at the macro-level.3 The local impacts hypothesis is one
of many possible explanations for this pattern. In addition to testing this hypothesis, the
evaluation allows us to gauge the success of local-level activities that take place under the
auspices of the peacekeeping operation. These include quick-impact projects and sensitiza-
tion activities. As independent evaluators, we are quite prepared to reject the local impacts
hypothesis. Indeed, it may be that there are no discernible local impacts, and that all im-
pacts are measurable only at the macro-level. There may be perverse local impacts, whereby
1The Folke Bernadotte Academy, Sweden, sponsored the first round of surveying; ancillary data collectionin 2009-2010 was conducted under the auspices of UNOIOS.
2Eric Mvukiyehe and Cyrus Samii, Laying a Foundation for Peace? A quantitative impact evaluation ofthe United Nations Operation in Cote d’Ivoire, 19 December 2008.
3This association has been demonstrated in three published studies: Doyle, MW and N Sambanis, 2006,Making war and building peace: United Nations peace operations, Princeton University Press; Fortna, VP,2008, Does peacekeeping work?: Shaping belligerents choices after civil war, Princeton University Press; andGilligan, MJ and EJ Sergenti, 2008, “Do UN interventions cause peace? Using matching to improve causalinference,” Quarterly Journal of Political Science, 3:89-122.
5

peacekeeping deployments are locally detrimental. Whatever the case may be, the results
should be useful in designing future programs to maximize positive impact.
13. The impact evaluation is organized according to elements from the United Nations
Mission in Liberia (UNMIL) mandate. UNMIL received its mandate from the UN Security
Council under Chapter VII in resolution 1509 of 19 September 2003. The United Nations
Department of Peace-keeping Operations describes the terms of UNMIL’s mandate as follows:
a. to observe and monitor the implementation of the ceasefire agreement and investigate viola-tions of the ceasefire;
b. to establish and maintain continuous liaison with the field headquarters of all the partiesmilitary forces;
c. to assist in the development of cantonment sites and to provide security at these sites;
d. to observe and monitor disengagement and cantonment of military forces of all the parties;
e. to support the work of the Joint Monitoring Committee (JMC);
f. to develop, as soon as possible, preferably within 30 days of the adoption of this resolution,in cooperation with the JMC, relevant international financial institutions, international de-velopment organizations, and donor nations, an action plan for the overall implementation ofa disarmament, demobilization, reintegration, and repatriation (DDRR) programme for allarmed parties; with particular attention to the special needs of child combatants and women;and addressing the inclusion of non-Liberian combatants;
g. to carry out voluntary disarmament and to collect and destroy weapons and ammunition aspart of an organized DDRR programme;
h. to liaise with the JMC and to advise on the implementation of its functions under theComprehensive Peace Agreement and the ceasefire agreement;
i. to provide security at key government installations, in particular ports, airports, and othervital infrastructure;
j. to protect United Nations personnel, facilities, installations and equipment, ensure the se-curity and freedom of movement of its personnel and, without prejudice to the efforts ofthe government, to protect civilians under imminent threat of physical violence, within itscapabilities;
k. to facilitate the provision of humanitarian assistance, including by helping to establish thenecessary security conditions;
l. to contribute towards international efforts to protect and promote human rights in Liberia,with particular attention to vulnerable groups including refugees, returning refugees andinternally displaced persons, women, children, and demobilized child soldiers, within UNMILscapabilities and under acceptable security conditions, in close cooperation with other UnitedNations agencies, related organizations, governmental organizations, and non-governmentalorganizations;
6

m. to ensure an adequate human rights presence, capacity and expertise within UNMIL to carryout human rights promotion, protection, and monitoring activities;
n. to assist the transitional government of Liberia in monitoring and restructuring the policeforce of Liberia, consistent with democratic policing, to develop a police training programme,and to otherwise assist in the training of police, in cooperation with the Economic Communityof West African States (ECOWAS), international organizations, and interested States;
o. to assist the transitional government in the formation of a new and restructured Liberianmilitary in cooperation with ECOWAS, international organizations and interested States;
p. to assist the transitional Government, in conjunction with ECOWAS and other internationalpartners, in reestablishment of national authority throughout the country, including theestablishment of a functioning administrative structure at both the national and local levels;
q. to assist the transitional government in conjunction with ECOWAS and other internationalpartners in developing a strategy to consolidate governmental institutions, including a na-tional legal framework and judicial and correctional institutions;
r. to assist the transitional government in restoring proper administration of natural resources;
s. to assist the transitional government, in conjunction with ECOWAS and other internationalpartners, in preparing for national elections scheduled for no later than the end of 2005.
14. The impact evaluation covers items a,c-h,k-m,p,q, and s. We do not cover UNMIL’s
assistance in establishing the ceasefire implementation mechanisms and facilities (b); disposal
of weapons and ammunition (part of g); security for government or UN installations or
personnel (i,j); police or army reform (n,o); nor natural resource management (r).
15. The impact evaluation is organized as follows. We begin with introductory dis-
cussions of the data, exposure to UNMIL’s activities, and perceptions among survey re-
spondents about UNMIL. We then present results on mandate elements, grouped into the
following themes: (1) monitoring cessation of hostilities (mandate element a); (2) disar-
mament, demobilization, reintegration and rehabilitation (c-h); (3) civilian protection and
human security (k); (4) humanitarian assistance (k); (5) economic revitalization (k); (6) so-
cial recovery (k); (7) re-establishment of political order (p,q); (8) electoral assistance (s); (9)
human rights promotion (l,m); and (10) public information (no specific mandate element).
III. Description of the data
16. Table 1 shows the demographic breakdown of the sample. Geographic locations of
respondents are also shown below in Figure 1. A separate technical appendix contains details
on the survey design. Respondents were selected according to a cluster-matched sampling
design. A community here refers to a “clan”, which in Liberia refers to a geographic area
7

Table 1: Demographics of the SampleHousehold Excombatant
sample Percent sample Percent
1. Gender a. Men 567 56% 251 91%b. Women 453 44% 24 9%
2. Age a. 15-25 236 23% 70 25%b. 26-35 349 34% 146 53%c. 36-50 309 30% 56 21%d. 51+ 126 12% 3 1%
3. Education a. No formal school 358 35% 68 25%b. Incomplete primary 155 15% 54 20%c. Complete primary 208 20% 85 31%d. More than primary 299 29% 68 25%
4. Household income a. No income reported 245 24% 48 18%b. 1-4500LRD/month 521 51% 147 54%c. +4500LRD/month 254 25% 79 29%
5. Deployment status a. Distant 355 35% 27 10%b. Proximate 341 33% 130 47%c. Deployment 324 32% 118 43%
that contains a cluster of villages that are linked on the basis of traditional ties.4 On average,
a clan contains about 700-1000 households (the average size for a household is between 5 and
6 people). In Monrovia, there are no clans, but rather administrative blocks that the Liberia
Institute of Statistics and Geo-Information Services (LISIGS) has demarcated and that have
approximately the same population as clans. LISGIS lists 673 clans and 165 administrative
blocks, and these 838 units cover the entirety of Liberia’s territory.
17. The sample included 12 communities that hosted UNMIL deployments. These were
sampled from among the 46 communities in total that hosted deployments.5 Data on pre-
deployment socio-economic conditions and geography were used to find 12 matching com-
munities that did not host deployments, but were proximate to communities that did, and
another 12 that neither hosted deployments nor were proximate to any that did. We call these
three types of communities deployment, proximate, and distant communities, respectively.
This approach was designed to maximize our ability to make inferences about the impact
of UNMIL activities in areas where its work was concentrated. The proximate communities
allow us to measure spill-overs from deployment communities. As we show below, the areas
where UNMIL’s activities were concentrated were not typical Liberian communities in the
4“Clan” in this case should not be confused with a family unit. It refers specifically to a geographic area.5The list of 46 communities was taken from the publicly available deployment maps contained in the
Reports of the Secretary-General on UNMIL.
8

sense that they tended to be places with relatively high conflict exposure, large populations,
close proximity to the main road network, and low levels of social infrastructure per capita.
The proximate and distant communities that we chose are meant to serve as “control” com-
munities to compare to the deployment communities. Therefore, the proximate and distant
communities differ from typical communities in Liberia in the same way that the deployment
communities do.
18. The 11 deployment communities that we selected are a random sample from a subset
of deployment communities. This subset does not include the eastern counties of Grand
Kru, Maryland, River Cess, River Gee, and Sinoe and far western counties of Grand Cape
Mount and Gbarpolu. This is shown in the rightmost map in Figure 1. The time available
made it impossible to extend the fieldwork to these areas, which are relatively inaccessible
from the entry point of Monrovia. Substitution communities in Bomi county were selected
to compensate for our lack of access into Gbarpolu and Grand Cape Mount. Nonetheless,
we intend to make clear that while the sample includes a good mix of areas—in terms of
urban/rural character, and geographical coverage—it does not provide an approximation to
the full Liberian population. Given logistical constraints, we sought to minimize bias in our
study of peacekeeping impacts, and thus forwent a significant amount of representativeness.
The sample can be taken to characterize well conditions in the geographic belt containing
Bomi, Montserrado, Margibi, Bong, Grand Bassa, Nimba, and Grand Gedeh counties, with
some weaker coverage of Lofa.
19. The data contain responses from 1,295 completed interviews spread evenly over
the 36 communities. Within each community, approximately 30 respondents were selected
randomly and targeted for interview (in some cases, a bit more than 30 respondents were
targeted). In addition to the household sample, ex-combatants were brought for interview
with the assistance of local officers of the national ex-combatant reintegration program.6
The 1,295 interviews include 1,020 respondents that were selected as part of the household
sample, and 275 ex-combatant respondents selected as part of the auxiliary ex-combatant
sample. The “margin of error”7 is about 3% for the entire household sample and about 6%
for the excombatant sample. The household sample is broken down into 324 households in
deployment communities, 341 in proximate communities, and 355 in distant communities;
thus the margin of error for each these subsamples is about 5.5%. These margins of error
can be used to assess, roughly, the statistical significance of most findings below.
6The current report does not include interviews with excombatants in Monrovia, only in rural areas. Wehave conducted interviews with excombatants in Monrovia, but that data still need to be processed.
7Following standard practice, the “margin of error” here refers to the half the width of the theoretical 95%confidence interval for yes-no questions in the case that responses are evenly split. It is a rough approximation,and it works as an approximate upper bound on the true margin of error when “yes” percentages are withinthe 20% to 80% range.
9
20. Remarkably, 113 (11%) of respondents selected in the household sample also claimed
to have had some experience within an armed faction since 1989, whether as a result of
abduction or voluntary participation. This is considerably higher than the proportion of the
Liberian population that participated in the national ex-combatant reintegration program.
That proportion is about 3%.8 The difference is likely due to two factors: (1) the list of
ex-combatants participating in the reintegration program excludes some ex-combatants that
had reintegrated on their own into civilian life after the end of either the first Liberian
war (1989-1996) or second war (1999-2003); and (2) the set of deployment and matched non-
deployment communities in which we worked may have hosted a relatively high concentration
of ex-combatants. In addition, it is commonly understood that some small percentage of
individuals who participated in the reintegration process may have falsified their combatant
histories to gain access to benefits. There is no doubt that some people are improperly
classified as excombatants and non-combatants in the survey sample, owing to the vagaries
of the process by which ex-combatant status has been determined. But we think the rates
of such misclassification are low, and that important patterns should not be obscured.
IV. Exposure to UNMIL
21. The maps in Figure 1 show roads, district boundaries, and then in the middle and right
maps, conflict exposure levels, deployments base locations, and the locations of the commu-
nities that are included in the sample. Deployment base assignments are clearly associated
with levels of past conflict and road access. The plots in Figure 2 show proximity to de-
ployment bases and three community-level socio-economic indicators that were measured in
2004: number of households (on the base-10 logarithm scale), schools per 100 households,
and health posts per 100 households. We see that deployments tended to be closer to com-
munities that were more populous and slightly less developed in terms of numbers of schools
and health posts per household. We have accounted for these baseline differences in our
sampling plan by matching deployment communities to proximate and distant communities
that have similar values on these community-level variables. Details are in the technical
appendix.
22. Though deployment bases were located in fixed positions, the survey results suggest
that peacekeeping troops were quite mobile. Whereas 3 out of 4 respondents in deployment
communities report at least some exposure to peacekeeper patrols, about 2 out 3 respondents
in proximate and distant communities report the same—only slightly less than in deployment
8UNMIL reported that the national DDRR process serviced 103,019 ex-combatants by the time of itsclosing in July 2009. The population of Liberia was estimated as approximately 3.5 million in the 2008census.
10

Figure 1: Roads, conflict exposure, deployments, and study sample locations
The leftmost map shows the major road network in Liberia. In the middle map, darker shading means higher exposure to major
armed conflict from 1989 to 2003. The middle map also shows UNMIL deployment base locations, marked with an “X”, taken
from Reports of the UN Secretary-General since 2003. The map on the right shows locations of the communities included in
the study. The ”X” points are communities that hosted deployment bases, and the ”O” points are communities that did not.
The lines on the middle and right map show the perimeters of clans. We can see that deployment location is closely related to
conflict history and proximity to the major road network.
communities. Other forms of exposure to UNMIL activities (e.g. electoral programs or quick
impact projects) are described below in the relevant thematic sections.
V. Respondent perceptions about UNMIL
23. The survey shows that UNMIL enjoys high legitimacy as a security provider among re-
spondents. Respondents overwhelmingly stated that they had confidence in UN peacekeep-
ers’ ability to prevent violence. Among the respondents who were able to give an answer to
questions about UNMIL’s effectiveness (this was about 85% of respondents, the rest mostly
said “don’t know”), only 4% stated that they did not have confidence in UNMIL’s ability
to prevent violence, 13% stated that they confidence only in UNMIL’s ability to prevent
fighting among armed groups, 3% stated that they had confidence only in UNMIL’s ability
to protect civilians, and about 78% stated that they were confident that UNMIL was capable
of both preventing fighting among armed groups and protecting civilians. Nearly all (98%)
of these respondents stated, in an unprompted manner, that UNMIL’s primary role with
11

Figure 2: Community proximity to deployment base and socio-economic develop-ment
Each point in the graphs is a community (clan) in Liberia. The large hollow points show the communities that are included in
the study. The lines are locally weighted regression fits that show basic trends.
respect to civilians was to ensure their safety (as opposed to delivering development, etc.).
Along similar lines, about 97% of these respondents said “yes” when asked whether UNMIL
helped end the war. About 93% said that they felt safer now as compared to the time before
UNMIL’s arrival six years earlier. Respondents were asked to list to whom, among inter-
national and domestic forces, they would turn if they faced insecurity from armed groups.
About 88% of these respondents included UNMIL on their list; a bit more than a third of
those who included UNMIL on their list did not name anyone else, implying that about
30% of these respondents overall viewed UNMIL as their sole security provider against the
threat of renewed conflict. About 60% of those who listed UNMIL along with other secu-
rity forces considered UNMIL to be the most important, meaning that about 35% of these
respondents overall considered UNMIL as the most important among a range of security ac-
tors. Taking this together, we find that about 65% of these respondents considered UNMIL
as the primary security provider against threats from armed groups.9 Finally, respondents
were asked whether UNMIL should leave the country now “because they failed”, stay on
longer “to finish the work they started”, or leave “because they have accomplished the work
they came to do”, about 82% of respondents indicated that they should stay. None of these
rates differed significantly across the deployment, proximate, and distant community types,
suggesting that beliefs about UNMIL’s security effectiveness were not closely linked to the
9To clarify the calculation: 88% of respondents listed UNMIL, and 34% of those listed only UNMIL, so88% ∗ 34% = 30% reported UNMIL as the sole security provider; of the 66% that listed UNMIL along withothers, 60% named UNMIL as the most important, meaning 88%∗66%∗60% = 35% of respondents reportedUNMIL as the most important among many. Adding these two together gives the 65% figure.
12

amount of exposure that people had to the peacekeepers.
24. In a vignetting exercise, respondents were asked to consider a hypothetical war in a
foreign country—in this case, the vignette was based on Burundi.10 Each respondent was
randomly presented with a different version of events. The versions differed in the degree
to which government and rebel forces were characterized as compromise-seeking rather than
hard-line. Respondents were then asked what means would be most fruitful in bringing
about a resolution. They could choose between having the protagonists surmount the chal-
lenges themselves, having a third party intervene with a peacekeeping operation, or having
some intermediate approach. The most common response among civilians was third party
intervention: 78% of respondents chose this option, compared to 13% and 9% choosing the
first and last options, respectively. Interestingly, respondents who received a vignette char-
acterizing both rebels and government as hard-line were the most likely to prefer third party
intervention; they were more likely to choose this option (83%) than those who received a vi-
gnette characterizing the belligerents as compromise-seeking (74%). For those who indicated
a preference for third party intervention or some hybrid of a third party/domestic process,
we asked what role was most appropriate for intervening peacekeeping forces for the hypo-
thetical war: a symbolic observational role, a supporting role, or a decisive interventionist
role. In all conditions, majorities stated that a “supporting” role was most appropriate (65%
overall).
VI. Monitoring cessation of hostilities
A. Deployment and major re-escalation
25. According to the Armed Conflict Location and Event Database published by the Peace
Research Institute of Oslo, the last major conflict event in the Liberian civil war occurred
in late July 2003. This anticipated the signature of the Comprehensive Peace Agreement in
Accra on 18 August 2003, which was soon followed by the deployment of ECOWAS forces.
UNMIL assumed control of the peacekeeping operation as of 1 October 2003, two months
after the end of major fighting. No subsequent major battle events have been recorded.
Thus, no major re-escalation occurred on UNMIL’s watch. Of course, there is no definitive
way to attribute the post-Accra peace to UNMIL’s presence as opposed to being the result
of natural progress in the peace process.
10The same vignetting exercise was used in the Cote d’Ivoire/UNOCI study.
13

B. Excombatant respondent perceptions
26. Ex-combatant perceptions provide a glimpse into whether UNMIL has established itself
as a credible deterrent force. Ex-combatant respondents expressed respect for UNMIL in
this way. We focus here on the responses of the 275 respondents from the sample of ex-
combatants that were identified via the national reintegration program. Similar to their
civilian counterparts, 74% of excombatants stated that they were confident that UNMIL
was capable of both preventing fighting among armed groups and protecting civilians, and
94% said “yes” when asked whether UNMIL helped to end the war. Nearly all ex-combatant
respondents stated that UNMIL made it more difficult for them and “their enemies” to
launch attacks (98% and 94% respectively), and nearly all (90%) stated that third party
peacekeeping was crucial to their decision to disarm. Among the respondents who agreed that
peacekeeping was crucial for their decision to disarm, 72% stated that only UN peacekeeping
forces (in contrast to ECOWAS forces, as an alternative) could have played this role. When
asked why, the most common reasons were about evenly split between some expression
of“more trustworthy”, “more powerful”, or “they represent the world.”
C. Evidence from household sample respondents
Table 2: Civilian Insecurity Index Over TimePre-deployment period Early deployment period Late deployment period
Prior to Accords Summer/Fall 03 Fall 03-Fall 05 Since Winter 06Community type Mean (SE) Mean (SE) Mean (SE) Mean (SE)Distant 5.1 (0.1) 1.1 (0.2) 0.4 (0.2) 0.2 (0.1)Proximate 5.1 (0.1) 1.3 (0.3) 0.2 (0.1) 0.3 (0.1)Late Deployment* 5.2 (0.3) 1.5 (0.5) 0.4 (0.2) <0.1 (<0.1)Early Deployment* 4.6 (0.2) 2.0 (0.4) 0.8 (0.2) 0.2 (0.1)
*Late deployment communities refer to those that did not host any deployments until mid-2005. Early deployment communities
are those that hosted a deployment before early 2005.
The table shows mean values of a civilian insecurity index, constructed by adding the number of “yes” responses to questions
about whether the respondent witnessed any of seven types of conflict-related activities (see text for details). “SE” stands for
the standard error of the sample mean. A higher score indicates greater insecurity. Measures were taken for the four time
periods indicated in the column headings. We see that on the whole, insecurity levels declined greatly since the signing of
the peace accords, but that deployment communities did not enjoy more of a decline than comparable distant or proximate
communities.
27. As noted above, nearly all respondents associated UNMIL’s presence with greater sta-
bility and security. There may be some “courtesy bias” in these responses, however. Thus, we
investigate security impacts further with reports of events associated with the risk of conflict
recurrence. We asked respondents a set of seven retrospective questions about whether they
had witnessed activities that were indicative of the possibility of renewed conflict. These ac-
14

tivities include whether one’s community experienced armed group fighting, ethnic violence,
disappearances or presence of “unfamiliar” people, rumors about recruitment, rumors about
possible attacks, people stockpiling food, or people fleeing. Each respondent could say “yes”
or “no” to the questions. The questions were asked with reference to two periods: (1) the
period just prior to the end of the war, and then (2) one randomly selected period in the
post-conflict period—either mid-late 2003, late 2003-late 2005, or early 2006 to present.11
We added the “yes” responses to create what we can call an “index of pessimism,” measuring
respondents’ retrospective assessment of how pessimistic he or she was about the possibility
of renewed conflict at a given time. We then studied whether changes in the pessimism score
over time are associated with proximity to peacekeeping deployments.12
28. Table 2 reports the results of the analysis. There is a very large jump between the
first, pre-Accords period and the period immediately following the signature of the peace
accords. The index captures the dramatic improvement in the security following the Accords
but prior to any deployments. The dip in respondents’ perceptions of insecurity following the
signature of the Accords was not as great in the deployment communities as in the distant
or proximate communities. When we move the early deployment period, we find that the
dip in insecurity in the early deployment communities is not as great (a 60% dip) as in the
other communities that did not host deployments as of early 2005 (64-85% dips). Moving
to the late period (since Winter 2006), insecurity levels in deployment communities finally
come down to the level enjoyed in the distant and proximate communities; indeed there
were almost no reports of conflict-related incidents in late deployment communities for the
last period, although the difference with respect to the other communities is not statistically
significant. The evidence does not suggest that deployments were associated with significant
differences in insecurity at the local level. Security gains seemed to occur in a blanket
manner across the country following the signature of the Accords in 2003. The largest
gains occurred immediately following the signature of the Accords and prior to UNMIL’s
deployment, although conditions improved steadily over time after UNMIL’s deployment.
such improvements were not significantly faster in deployment communities, suggesting that
“local security impacts” were not significant. The country-wide improvements in the security
situation may be due to a general calming and deterring effect associated with UNMIL’s
presence in the country, but our micro-level data do not allow us to study the plausibility of
this macro-level claim.
11Respondents were only asked about one subsequent period to minimize fatigue from answering too manyquestions.
12To ensure that respondents’ relocation histories did not bias the analysis, the mean and standard devia-tion for each time period was computing using only respondents who had settled in their current communityof residence by the given period.
15

VII. Disarmament, demobilization, reintegration and
rehabilitation
Table 3: Faction History (1999-2003), Excombatant RespondentsSample Sample
Faction membership size percent
AFL, LURD, MODEL, Militia groups 2 1%LURD, MODEL, Militia groups 4 1%AFL, LURD 12 4%AFL, MODEL 1 < 1%AFL, Militia groups 20 7%LURD, MODEL 1 < 1%MODEL, Militia groups 5 2%AFL 37 13%LURD 59 21%MODEL 54 20%Militia groups 14 5%No affiliation recorded* 66 24%
*There was no response recorded in the data for these respondents. They may have had factional affiliations from the conflict
prior to 1999, they may have refused to answer, or there may have been an enumerator error in recording the response.
A. Describing the ex-combatant sample
29. The data contain a total of 388 individuals who claim to have participated in an armed
faction at some point during the first or second Liberian civil war. Of those, 275 were identi-
fied via the national excombatant reintegration program, and the other 113 were identified in
the household sample. Among those identified through the reintegration program, 50-60%
of those individuals claim to have joined their faction voluntarily, as opposed to through
forcible recruitment. Among those that were identified via the household sample, around
75-85% claim to have participated voluntarily. For the analysis in this section, we restrict
attention to the 275 respondents in the ex-combatant sample, because their status as actual
ex-combatants has been vetted by the national reintegration program. As we show in Table
3, those who revealed their factional history were fairly evenly split among those who were
affiliated Armed Forces of Liberia (AFL), LURD, and MODEL. We note that on many of
the questions reported below, the rate of non-response due to “don’t know” answers was
quite high—from 5% up to 33% of responses.
16

B. UNMIL’s provision of security during disarmament and demo-bilization
30. The survey asked two questions to get at ex-combatants’ sense of security in regrouping
sites. The first question asked whether ex-combatants feared their regrouping site would
be attacked by opposing factions and the second asked whether ex-combatants feared the
weapons they had surrendered would be stolen by opposing forces. In both of these cases,
large majorities said “no”: among those who gave a response, 85% said “no” on the former
and 72% on the latter; the number of “don’t know” responses was high—40 respondents
and 73 respondents, respectively—although we have no good reason to believe that the
rate of “no” responses among them would be much different. All but 22 out of the 275
ex-combatant respondents claim to have entered the DDR process in 2004 or later. They
would have been processed after UNMIL revised procedures in light of the December 2003
episode at Camp Scheiffelin near Monrovia.13 However, there is no significant difference in
the rate of “insecure” responses among those processed before and after January 2004. (In
fact the rate of insecure responses is higher for post-2003 cases, but the difference is not so
great as to be statistically significant.) Among the 214 respondents that answered, nearly
all of them (91%) indicated that UNMIL was the force assigned to provide security at their
cantonment site; remarkably, all 19 of those respondents who did not identify UNMIL as the
security provider also indicated that they did indeed fear attack. Despite the small sample
size, it is a stark pattern. UNMIL’s absence seems to be associated with insecurity in these
respondents’ minds.
C. Participation in the reintegration program
31. As discussed above, the 275 respondents in the excombatant sample were identified
through the national reintegration program, and so they were all participating in the pro-
gram in some way. Among the 113 excombatants identified in the household sample, approx-
imately half (55 of the respondents, or 49%) indicated that they had not participated in the
reintegration program; 28 of these claimed to have participated in the AFL or LURD factions
during the 1999-2003 war, which would have made them eligible for reintegration benefits.
In addition, it is widely believed that some number of the participants in the reintegration
program had not served in the fighting forces. After so many years of irregular conflict, all
of this is to suggest the degree of “fuzziness” in the line that separates “excombatants” from
civilians in Liberian society.
32. Focusing on the 275 respondents in the excombatant sample, 103 respondents (37%)
13The opening of the DDR process in Monrovia in December 2003 was met with rioting as facilities wereinadequate for processes and delivery of benefits to the 12,000 plus combatants that presented themselves.
17

Table 4: Demographic factors and economic outcomes in the matched excombat-ant and household samples
Matched Matchedhousehold excombatant
sample sample(n=189) (n=168)
Men 93% 93%Women 7% 7%
15-25 21% 21%26-35 56% 56%36-50 23% 23%51+ 0% 0%
a.No formal school 27% 27%b.Primary unfinished 20% 20%
c.Primary finished 29% 29%d.More than primary 24% 24%
Matched Matchedhousehold excombatant
sample sample(n=189) (n=168)
a.No income reported 23% 17%b.1-4500LRD/month 46% 50%c.+4500LRD/month 31% 33%
a. Agriculture 55% 60%b. Unskilled labor 14% 13%
c. Skilled labor 1% 6%d. Commerce 12% 13%
e. Soldier/police 3% 1%f. Professional 4% 0%
g. Student 10% 5%h. No occupation 2% 2%
The left table shows balance in demographic features in the matched household and excombatant samples. The right table
shows economic outcomes for this matched sample.
indicated that they had registered for benefits, and 90 (33%) indicated that they had not
(the remaining 82 stated that they did not know). Reasons for non-registration were given in
only a small fraction of the 90 cases, and these were spread across “card lost”, “too far”, and
“rejection by the JIU.” Among those that did register, the vast majority (88 respondents, or
85%) indicated that they chose only vocational training (rather than education or education
plus vocational training), as might be expected from the age distribution of the excombatants
(refer to Table 1). A solid majority of (80 respondents, or 78%) of the trainees received
some information about what kinds of training would be economically viable; carpentry
and mechanics were by far the most common vocational training options. Only about half
(53 respondents, or 51%) indicated that they had completed their training; reasons for non-
completion were given by only a small number (21) of the respondents, and the most common
among these responses were “lost my card”, ”dissatisfaction”, and ”program stopped.”
D. Economic reintegration
33. The goal in current reintegration programs is to close gaps between the economic con-
ditions of excombatants and their civilian counterparts, and to help excombatants achieve a
sustainable livelihood. While an in-depth examination of reintegration is beyond the scope of
this report, we provide some broad-brush results from the survey. Table 4 shows demographic
characteristics and economic outcomes for a subset of our data that include members of the
excombatant and household sample. In this subset, we have done the best we can to match
up respondents from the household sample to the profile of the excombatant sample. The
reason for doing this is straightforward. In comparing the economic outcomes of respondents
in the excombatant sample to those in the household sample, we want to account for demo-
18
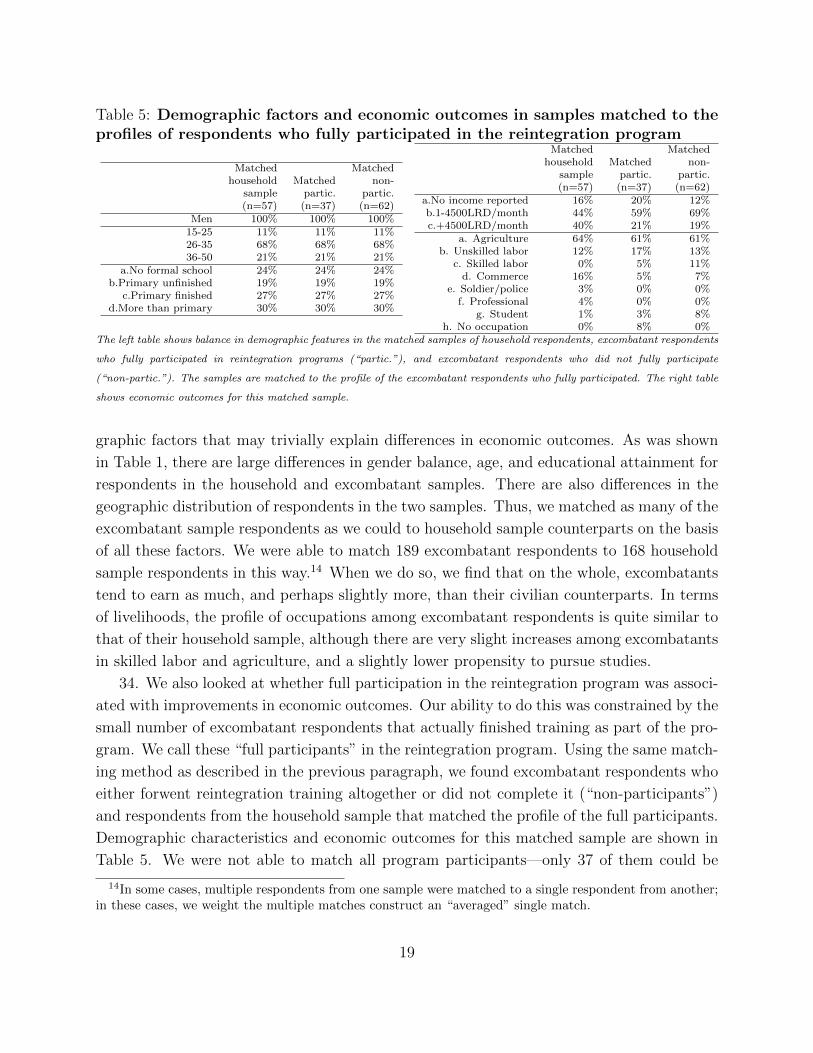
Table 5: Demographic factors and economic outcomes in samples matched to theprofiles of respondents who fully participated in the reintegration program
Matched Matchedhousehold Matched non-
sample partic. partic.(n=57) (n=37) (n=62)
Men 100% 100% 100%15-25 11% 11% 11%26-35 68% 68% 68%36-50 21% 21% 21%
a.No formal school 24% 24% 24%b.Primary unfinished 19% 19% 19%
c.Primary finished 27% 27% 27%d.More than primary 30% 30% 30%
Matched Matchedhousehold Matched non-
sample partic. partic.(n=57) (n=37) (n=62)
a.No income reported 16% 20% 12%b.1-4500LRD/month 44% 59% 69%c.+4500LRD/month 40% 21% 19%
a. Agriculture 64% 61% 61%b. Unskilled labor 12% 17% 13%
c. Skilled labor 0% 5% 11%d. Commerce 16% 5% 7%
e. Soldier/police 3% 0% 0%f. Professional 4% 0% 0%
g. Student 1% 3% 8%h. No occupation 0% 8% 0%
The left table shows balance in demographic features in the matched samples of household respondents, excombatant respondents
who fully participated in reintegration programs (“partic.”), and excombatant respondents who did not fully participate
(“non-partic.”). The samples are matched to the profile of the excombatant respondents who fully participated. The right table
shows economic outcomes for this matched sample.
graphic factors that may trivially explain differences in economic outcomes. As was shown
in Table 1, there are large differences in gender balance, age, and educational attainment for
respondents in the household and excombatant samples. There are also differences in the
geographic distribution of respondents in the two samples. Thus, we matched as many of the
excombatant sample respondents as we could to household sample counterparts on the basis
of all these factors. We were able to match 189 excombatant respondents to 168 household
sample respondents in this way.14 When we do so, we find that on the whole, excombatants
tend to earn as much, and perhaps slightly more, than their civilian counterparts. In terms
of livelihoods, the profile of occupations among excombatant respondents is quite similar to
that of their household sample, although there are very slight increases among excombatants
in skilled labor and agriculture, and a slightly lower propensity to pursue studies.
34. We also looked at whether full participation in the reintegration program was associ-
ated with improvements in economic outcomes. Our ability to do this was constrained by the
small number of excombatant respondents that actually finished training as part of the pro-
gram. We call these “full participants” in the reintegration program. Using the same match-
ing method as described in the previous paragraph, we found excombatant respondents who
either forwent reintegration training altogether or did not complete it (“non-participants”)
and respondents from the household sample that matched the profile of the full participants.
Demographic characteristics and economic outcomes for this matched sample are shown in
Table 5. We were not able to match all program participants—only 37 of them could be
14In some cases, multiple respondents from one sample were matched to a single respondent from another;in these cases, we weight the multiple matches construct an “averaged” single match.
19

matched. Thus, despite the small sample size, a few things can be discerned. First, in gen-
eral, full participation in the program was not associated with improvement in earnings or
occupation—earnings are lower on average, and the “no occupation” rate is higher. Second,
as is evident from comparing Table 4 to Table 5, high earning excombatants drop out of the
sample after we match to the profile of full participants, however high earning household
sample respondents remain. Perhaps the most compelling explanation of both of these facts
is that excombatants selected whether or not to remain in the reintegration program based
on whether or not they had better options elsewhere. Thus, the more skilled, capable, or
better-connected excombatants seem to have chosen to forgo training to pursue otherwise
available economic opportunities. Given that reasons for non-participation included things
like “office was too far” and “dissatisfaction”, it does seem that excombatants were engaging
in cost-benefit calculations of this sort. For those respondents who found training to be
sufficiently valuable as to complete it, the training does not seem to have closed the gap
with either their non-participating excombatant counterparts or their civilian counterparts.
35. Subjective perceptions from respondents in the excombatant and households samples
suggest that economic reintegration problems are not a pressing concern on the minds of
many. Perhaps surprisingly, both excombatant and household sample respondents tended to
describe their economic conditions now as “good” (77% and 82% respectively). Among ex-
combatants, this was not something that varied over income groups, although upper income
group respondents in the household sample were more likely to report their current condi-
tions as ”good” or “excellent.” When asked to compare their economic conditions to those
of excombatants in their communities, respondents in the household sample tended to state
that their conditions were the “same” (40%) or “better” (40%); remarkably, perceptions on
this question were similar among excombatants, with 54% stating that conditions were the
“same” and 36% stating that conditions were “better.”
E. Social reintegration
36. The evidence on social reintegration shows that in general, excombatant respondents
do not face major problems in gaining acceptance. The high rates of reported acceptance
suggest that UNMIL’s role in fostering acceptance could only have been limited. A large
majority (77%) of excombatant respondents indicated that they spent most of their time with
“family and civilian friends” as opposed to “friends from faction” (12%) or “alone” (10%).
Nearly all excombatant respondents indicated that they faced “no problems” in gaining
acceptance from their families (94%) or their communities (93%). The evidence does not
suggest that discrimination of excombatants is a major concern. In both the household and
excombatant samples, responses varied widely on the question of whether excombatants were
20
more or less easy to distinguish from noncombatants: 42% of household sample respondents
said “very easily”, 12% said “somewhat easily”, 23% “somewhat difficult”, and 24% “very
difficult”; for excombatants, the percentages were 33%, 16%, 24%, and 27% respectively.
No striking geographic pattern was found in average responses at the clan level, nor did it
seem that our measure of conflict history did much to explain this variation. In clans where
more than half of household respondents indicated that excombatants were “very easy” to
identify, excombatant income levels tended to be lower on average. Given the totality of
the evidence on social reintegration, it does not seem that this is indicative of excombatant
discrimination leading to economic problems, but rather that in some communities, there
are some excombatants who are conspicuously challenged in their ability to settle into a
productive livelihood. This does not appear to characterize excombatants in general though.
37. The data do suggest that UNMIL’s presence was associated with excombatants being
less engaged in local associations, although the reasons for this are unclear. We compared
rates of participation in local cooperatives and community associations among respondents
in the matched household and excombatant samples displayed in Table 4; 28% of matched
household sample respondents said that they were involved such groups, and 34% of matched
excombatant sample respondents indicated the same. In looking at the relationship between
such social engagement and peacekeeping deployments, we find a curious pattern. Rates
of participation among excombatants are much higher in the distant communities (68%) as
opposed to the proximate communities (26%) and deployment communities (27%). There
are no such differences for respondents from the household sample.
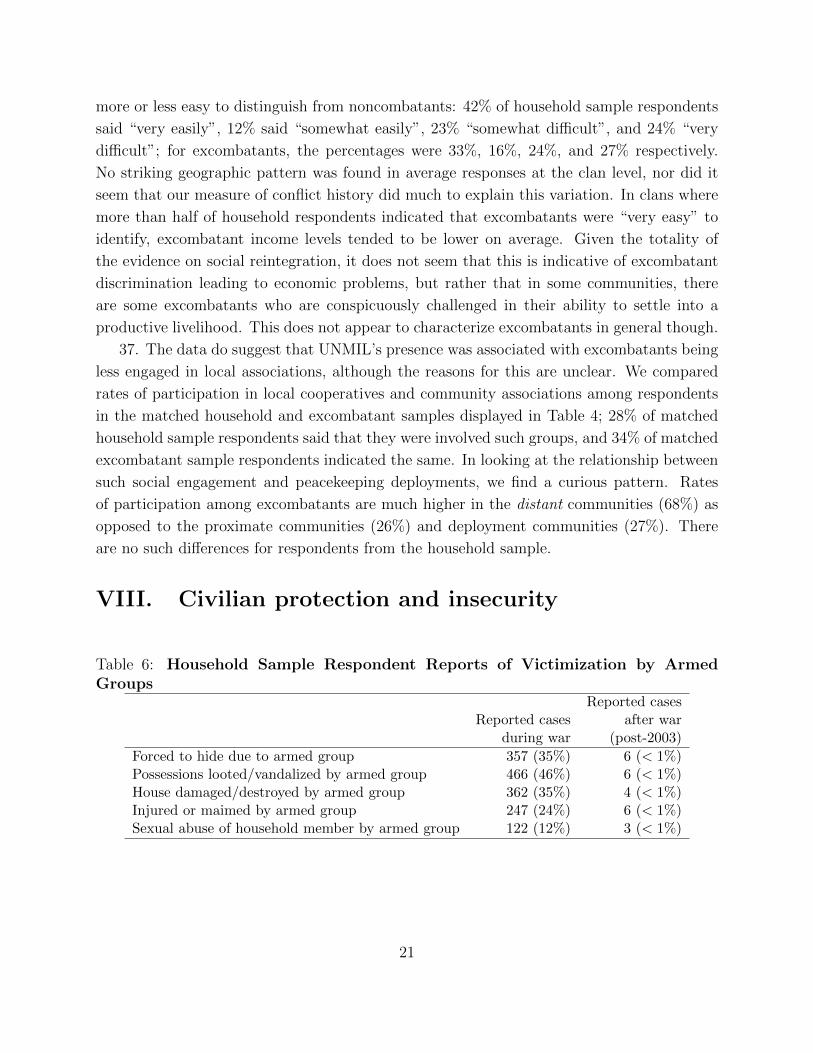
VIII. Civilian protection and insecurity
Table 6: Household Sample Respondent Reports of Victimization by ArmedGroups
Reported casesReported cases after war
during war (post-2003)
Forced to hide due to armed group 357 (35%) 6 (< 1%)Possessions looted/vandalized by armed group 466 (46%) 6 (< 1%)House damaged/destroyed by armed group 362 (35%) 4 (< 1%)Injured or maimed by armed group 247 (24%) 6 (< 1%)Sexual abuse of household member by armed group 122 (12%) 3 (< 1%)
21

A. Victimization by armed groups
38. We discussed above how UNMIL enjoyed great legitimacy among respondents as a
security provider, although such responses may somewhat overstate this legitimacy due to
courtesy biases. We also noted above that UNMIL took control of the peacekeeping operation
after the end of major hostilities, and that no major re-escalation took place. Along those
lines, we asked household respondents to tell us if they were subject to various forms of
victimization by armed groups. The responses are displayed in Table 6, which provides
further evidence of the fact that when the war ended with the Accra agreement in 2003, it
ended everywhere in the country. Areas more or less proximate to UNMIL’s deployments did
not differ in this regard. The evidence suggests that UNMIL had little active role to play in
dealing with major aggression by armed groups, although it remains possible that UNMIL’s
presence was a blanket deterrent for the entire country against any such aggression.
39. The measured shown in 6 show incidence of victimization at the level of households.
A special interest area is in violence towards women. The survey asked respondents whether
they had ever been taken prisoner or hostage by an armed group. About 21% of respondents
indicated that this had happened to them; this rate of reported victimization did not differ
significantly across men and women (22% and 20%, respectively).
B. Crime
40. Unfortunately, the data do not permit us to properly assess whether proximity to de-
ployments is associated with more or less crime. The crime reports data do not contain
enough detail for us to determine the precise timing of crime victimization events. We asked
respondents to indicate whether, in the years “since 2004”, they had feared robbery of phys-
ical attack or had actually been the victim of robbery or physical attack. Respondents in
deployment and proximate communities were a bit more likely to report that they feared
or have actually experienced robbery or physical attack within the past few years: 28%
of respondents in deployment and proximate communities reported fearing such attacks,
as compared to 24% in distant communities; 22% and 27% of household respondents re-
port actually having experienced such attacks in deployment and proximate communities,
respectively, as compared to 19% in distant communities. None of these reported rates of
victimization differed significantly across the male and female respondents in the sample.
But the negative association between deployment proximity and reports of attacks is con-
centrated among among recently settled households: the odds of experiencing actual attack
are about 30% higher for newly settled households in proximate communities than for their
longer-settled counterparts. What we do not know is is whether these robberies of attacks
prompted the resettlement or whether they happened after resettlement. If yes, then this
22

would be evidence of security benefits in deployment communities; if no, then this would
suggest that resettlement into deployment communities comes with higher rates of crime-
based victimization. The data are not fine grained enough for us to parse this out, and so
we recommend analysis of crime statistics from other sources to determine what is actually
going on.
C. Resettlement
41. Households often respond to insecurity by relocating. For this reason, data on displace-
ment, migration, and resettlement are important indicators in the analysis of human security
dynamics. Table 7 shows our best estimates of settlement patterns in relation to peacekeep-
ing deployments. As a baseline, we use the household population data gathered as part of UN
Office for the Coordination of Humanitarian Affairs (UN-OCHA) special rapid assessment
in 2004-5. These data are used to construct a rough estimate of the number of households
per community at the time of the end of the war. The fact that the assessment was done
some months after the end of the war means that some post-war dynamics are already cap-
tured in the measure, but it is the best baseline measure that is available. We show that
the baseline values are very similar across distant, proximate, and deployment communities.
This is an intentional feature of our sample: we designed the sample so that such differences
would be small, allowing us to isolate the impact of deployments. We emphasize that this
does not characterize the population, but is rather the result of a sampling tactic that we
used to increase our leverage in making statements about the impact of deployments (refer
to section III and Figure 2 above). The next line shows estimates from the 2008 national
census. It shows substantial differences in the number of households over distant, proximate,
and deployment communities. Assuming that any biases and error in the UN-OCHA are
not overwhelming, these differences can be attributed to distant, proximate, and deployment
communities experiencing vastly different settlement patterns between 2004 and 2008. We
estimate that deployment communities experienced both substantially lower out-migration
and substantially higher resettlement and in-migration. We estimate that the rate of out-
migration from distant communities was about 1.5 times the rate in deployment communities
(74%/50%, from section V of the table). The estimated rate of resettlement was about 4
times higher in deployment communities than in distant communities (17%/4%, from sec-
tion VI) and the rate of in-migration was about two times higher in deployment communities
than in distant communities (18%/10%, from section VIII).
42. These higher rates of settlement into deployment communities may be due to direct
facilitation of settlement by UNMIL, the economic attractiveness of such communities due
to market stimulation associated with deployments, or due to perceptions that deployment
23

areas would be more secure. The data on insecurity displayed in Table 2 above shows that
armed-conflict-related insecurity did not differ substantially from community to community,
so the available evidence does not favor of the security interpretation at this level. As
discussed in the previous section, the crime data are too coarse to permit any conclusions
about whether crime-related insecurity may explain the differences in settlement dynamics.
Data on economic outcomes presented below (in section X below) do show marked differences
in the market vitality of deployment communities as compared to distant communities,
lending some credence to the “economic attractiveness” explanation. Data on facilitated
resettlement/migration were not available to allow us to assess the validity of the “direct
facilitation” explanation.
Table 7: Settlement Patterns, by Deployment Proximity
Distant Proximate Deploymentclans in clans in clans insample sample sample
I. Average number of households 2,573 2,102 2,582per clan, 2004 (UN-OCHA Estimate)II. Average number of households 1,019 1,227 2,232per clan, 2008 (LISGIS Census Estimate)III. 2009 Sample Survey Results:a. Prewar inhabitants who never left 31% 21% 20%b. Prewar inhabitant displacees/migrants who returned during war 6% 9% 6%c. Displacees/migrants from other clans who arrived during war 29% 25% 32%d. Prewar inhabitant displacees/migrants who returned after war 9% 10% 20%e. Displacees/migrants from other clans who arrived after war 25% 35% 21%IV. Estimated household distribution per clana
a. Prewar inhabitants who never left 316 258 446b. Prewar inhabitant displacees/migrants who returned during war 61 110 134c. Displacees/migrants from other clans who arrived during war 296 307 714d. Prewar inhabitant displacees/migrants who returned after war 92 123 446e. Displacees/migrants from other clans who arrived after war 255 430 469
V. Estimated percentage of 2004 households who out-migrated by 2008b 74% 68% 50%VI. Estimated number resettling households as a percentage of 2004 householdsc 4% 6% 17%
VII. Estimated number in-migrating households as a percentage of 2004 householdsd 10% 20% 18%
aThe estimates in section IV of the table come from combining the estimates from sections II and III.
bThe estimates in section V come from subtracting lines a, b, and c in section IV from the estimates in section I and then
dividing by the latter.
c,dThe estimates in sections VI and VII come from adding lines c and d, respectively, from section IV and dividing by the
estimates in section I.
UN-OCHA estimates come from a rapid assessment conducted in 2004-5. Clans in the sample were matched on these estimates.
The 2008 census enumeration shows that the population sizes differ substantially. Assuming that bias or error in the UN-OCHA
data is not overwhelming, this reflects significant differences in settlement dynamics.
24

IX. Humanitarian assistance
43. We showed above that UNMIL enjoyed great legitimacy as a security provider. This
was not quite the case with respect to the peacekeeping operation’s reputation as a provider
of humanitarian assistance. Respondents were asked what activities peacekeepers engaged
in regularly in their communities. We recorded whether respondents reported “nothing”,
various types of indirect humanitarian assistance (that is, meeting or providing security for
local leaders), or various types of direct humanitarian assistance (that is, discussing problems
with civilians, distributing food or water, medical assistance, or repairing local infrastruc-
ture). For the most part, respondents did not tend to see peacekeepers as having much of
an humanitarian assistance role: 41% of respondents reported “nothing.” Among those who
reported and UNMIL peacekeepers played some humanitarian role, 26% reported some in-
direct assistance, and 25% reported some direct assistance (these latter two percentages are
not exclusive, as some respondents reported both direct and indirect assistance). Of course,
these responses may simply reflect respondents separating in their minds the humanitarian
assistance provided by UN agencies from the peacekeeping mission itself. The responses did
not vary significantly across deployment, proximate, and distant communities.
X. Economic impacts
A. Peacekeeping economies
44. Peacekeeping forces are known to affect local economies in various ways due to procure-
ment and individual staff spending.15 In addition, peacekeeping deployments provide local
“security bubbles” which create an attractive spaces for local investment. For these reasons,
we study how deployment patterns are associated with the economic well being of house-
hold sample respondents. Table 8 shows economic outcomes for respondents in deployment,
proximate, and distant communities. The results are indicative of how deployments may
transform community-level economies. On income, we see that deployments are associated
with a substantial increase in the percentage of respondent households earning over the LRD
4500 mark (just under $2 per day), although we also see a slight increase in the number of
respondents reporting that their households earn nothing. Such a change in the income distri-
bution may be due to the fact that on the one had, deployment communities provide greater
earning opportunities, which in turn attract people from other communities who may earn
no income as they wait to realize such opportunities. This “transformation” interpretation
15Refer to Michael Carnahan, William Durch, and Scott Gilmore, Economic Impact of Peacekeeping,United Nations Department of Peacekeeping Operations Best Practices Unit and the Peace Dividend Trust,2006.
25

Table 8: Economic Outcomes, by Proximity to DeploymentsDistant Proximate Deployment
(n=355) (n=341) (n=324)
Household a.No income reported 20% 28% 25%income b.1-4500LRD/month 59% 50% 44%
c.+4500LRD/month 22% 23% 31%
Respondent a. Agriculture 56% 50% 45%occupation b. Unskilled labor 6% 4% 10%
c. Skilled labor 3% 6% 3%d. Commerce 17% 18% 21%e. Soldier/police 1% 1% 1%f. Professional 5% 6% 6%g. Student 8% 8% 11%h. No occupation 5% 6% 5%
Consumption (1): 0 meals 3% 6% 5%Meals eaten yesterday 1 meal 39% 40% 43%
2 meals 47% 45% 42%3 meals 11% 9% 10%
Consumption (2): No 82% 82% 74%Recent home improvement Yes 18% 18% 26%
The table shows the percent distributions of respondents for economic outcomes in communities that hosted peacekeeping
deployments, were proximate to deployment communities, and were distant from peacekeeping deployment locations. The
results suggest that deployments are associated with important differences in community economies.
is also consistent with the differences in the results for occupations. Deployment commu-
nities are associated with higher proportions of respondents engaged in unskilled labor and
in commerce, as well as lower engagement in agriculture, although the differences are not
very pronounced. In terms of basic consumption—the number of meals eaten—there are no
differences that stand out. But in terms of more substantial consumption—home repairs and
improvements—we find a positive association. The signs point toward deployments serving
as stimulants to local labor and commercial markets.
B. Quick impact and employment projects
45. The economic impact described in the previous section is what we might call “inciden-
tal,” because the changes are not necessarily intended. UNMIL also engaged in programs
that sought to have direct effects. These included quick impact and employment projects.
We obtained information from UNMIL staff on the location of these projects. Such infor-
mation could only be obtained after the household sample data were collected, and so this
limits our analysis somewhat. The reason is that UNMIL undertook quick impact and unem-
26

Table 9: Economic Outcomes by Quick Impact or Employment Projects in theMatched Subsample
Project No-projectcommunities communities
(n=175) (n=131)
Household a.No income reported 13% 13%income b.1-4500LRD/month 70% 56%
c.+4500LRD/month 17% 31%
Respondent a. Agriculture 69% 67%occupation b. Unskilled labor 6% 3%
c. Skilled labor 1% 6%d. Commerce 13% 12%e. Soldier/police 0% 0%f. Professional 3% 4%g. Student 4% 7%h. No occupation 6% 3%
Consumption (1): 0 meals 4% 4%Meals eaten yesterday 1 meal 40% 37%
2 meals 43% 41%3 meals 13% 18%
Consumption (2): No 84% 78%Recent home improvement Yes 16% 22%
The table shows the percent distributions of respondents for economic outcomes in communities that did and did not receive quick
impact or employment projects. The data do not suggest that these projects significantly improved local economic conditions.
ployment projects in deployment, proximate, and distant communities alike, although they
were considerably more common in the sampled deployment communities (10 out 13 had
either a quick impact or employment project) than in the sampled proximate and distant
communities (4 out of 11 and 6 out of 13, respectively, had either quick impact or employ-
ment projects). In order to identify the impact of these projects, per se, in isolation from
deployments, we thus need to match up deployment communities that received projects with
deployment communities that did not, and so on for proximate and distant communities,
while also accounting for the conflict history, population size, and social infrastructure vari-
ables used to design the original sample. We are able to match up 6 out of the 20 sampled
clans that received projects with 4 out of the 13 sampled clans that did not. The matched
set includes 3 proximate clans and 7 distant clans—no deployment clans could be matched.
The no-project clans (with deployment proximities) are: Deygbo (proximate), Lower Mecca
(distant), and Lower Zor (distant) in Bomi county, and Tchien Menyea (distant) in Grand
Gedeh county. The project clans are Gbor (distant), Manna (proximate), and Tehr (proxi-
mate) in Bomi county, Gborbo (distant) and Tarleh (distant) in Grand Gedeh county, and
27

Mehn (distant) in Rural Montserrado. The data are appropriately weighted to ensure the
the project and no-project communities are balanced in their deployment status and the
other background variables.16 The results are shown in Table 9. The evidence here does
not show that the projects had significant economic benefits for the recipient communities.
In fact, the no-project communities fare better on almost every score. The sample size is
small, however, so small differences (e.g. less than 15 percentage points) are not statistically
meaningful.
XI. Social impacts
Table 10: Percentage of Respondents Able to Affirm that Community ActivitiesTook Place within Past Six Months, by Proximity to Deployments
Distant Proximate Deployment(n=355) (n=341) (n=324)
Public celebrations 79% 75% 64%Public projects 84% 80% 67%
Rallies 35% 33% 27%Security meetings 48% 48% 36%
The table shows percentage of respondents who were able to affirm that public celebrations, public projects, political rallies,
or security meetings took place in their community in the past six months. Respondents are categorized by whether they are
from communities that hosted peacekeeping deployments, were proximate to deployment communities, or were distant from
peacekeeping deployment locations. The results suggest that deployment communities are less cohesive.
46. We have already noted above that excombatant respondent participation in local
cooperatives and associations is higher in distant communities than in proximate and de-
ployment communities. Household sample respondent participation rates in these activities
do not vary by deployment proximity. Other evidence indicates that deployment proximity
is associated with less vibrant community life in other ways as well. Table 10 shows results
from questions that asked respondents whether any celebrations, public projects, political
rallies, or security meetings took place in their community in the past six months. For a
respondent to answer “yes”, there must have been such activities, and the respondent must
have been aware of it. Both of these requirements get at the same underlying quantity of
interest—namely, engagement in community life. The table shows that respondents from
deployment communities tended to be less engaged in community life. This result may be
16As should be clear, two of the no-project communities were each matched to single project communities,and the two other no-project communities were each matched to a pair of project communities. For thelatter, a weighted average was taken to construct a “synthetic” match. This procedure makes more use ofthe information in the data than would one-to-one matching procedure.
28

indicate consequences of economic and resettlement impacts of deployments in the localities.
We recommend that this issue be the subject of further investigation.
XII. Re-establishment of political order
47. Respondents expressed satisfaction with the Comprehensive Peace Accords, with only 6%
saying they were “not satisfied” with the Accords, 62% “satisfied”, and 32% “very satisfied.”
Demographically, those reporting that they earned “no income” were considerably less likely
to say that they were “very satisfied” (no significant education, gender, or age differences).
When asked what was the most important feature of the Accord, respondents tended to
emphasize elections (33%), reconciliation (26%), and power-sharing (28%). When asked
who benefitted the most from the Accords, the most common response was “don’t know”
(42%), followed by “LURD” (25%) and then “the government” (15%). Responses to these
questions did not vary in meaningful ways based on whether communities were more or less
proximate to peacekeepers.
48. We measured people’s levels of political trust with an index that added up responses
to questions about whether respondents believe that politicians are concerned with citizens’
welfare, have an interest in helping people like the respondent, and whether civilians should
generally be patient with respect to government action. Demographically, higher educated
men tended to exhibit less trust. Respondents in deployment communities also tended to
exhibit considerably less trust than their counterparts in proximate and distant communities.
This is further evidence of relative social malaise in deployment communities, which as we
mentioned in the section on social impacts, is worthy of more attention.
49. Finally, we asked respondents whether their community chiefs had fled during the
time of the conflict, and if so, whether they had returned.17 Out of the 36 clans included
in the study, the evidence suggests that 11 experienced such leadership flight, including 5
that received deployments, 3 that would be proximate communities, and three that would be
distant communities. The numbers are too small to meaningfully test whether deployments
facilitated leadership return, but we note here that only in one out of the four deployment
communities did the leader return, as compared to two out of three distant communities; in
none of the proximate communities did the leader return.
17This information was gathered from the surveys. We only used answers from respondents who indicatedthat they had been living in the same community prior to the onset of the second civil war in 1999. Sometimesrespondents gave different answers about whether local leaders fled and, if they fled, when they returned.There was always a clear modal response, so that is the one that was assigned to the clan.
29

XIII. Electoral assistance
50. We collected basic data on voting and campaign participation in the 2005 elections.
Self-reported voter turnout was high among respondents in the household sample, with
89% of respondents reporting that they voted; there were no significant differences between
distant, proximate, and deployment communities in such reports. The self-reported rate
of participation in meetings or rallies was about 42%. Interestingly, this was considerably
higher among women in deployment communities: the odds of a women in a deployment
community participating in the 2005 campaign was about double that of women in distant
communities. Respondents tended to say that they thought the 2005 elections were free
and fair (74%). Excombatants reported slightly higher levels of political engagement than
their counterparts in the household sample: 91% reported that they voted, and 55% reported
having participated in meeting or rallies for the 2005 elections. Excombatants were somewhat
less likely than respondents from the household sample to report that the elections were
fair (64%). For excombatants, reports of voting were higher in deployment and proximate
communities as compared to distant communities (92% and 93% versus 82%, respectively),
although excombatant reports of having participated in meetings or rallies were slightly lower
in deployment communities (54%) versus proximate (70%) or distant communities (67%).
51. Nearly all respondents (92%) in the household sample indicated that UNMIL was
somehow involved in electoral processes where they lived, with 61% of respondents affirming
that UNMIL sensitization took place in their community, 8% affirming that training took
place, and 31% affirming that UNMIL personnel were involved in security polling places.
Affirming that sensitization took place in one’s community was not related to a respondent’s
perception of whether or not the 2005 elections were fair, perhaps because respondents formed
opinions based on what actually happened on election day. Affirming that sensitization took
place was associated with a slightly higher propensity to report having voted in 2005 (92%
for those affirming that sensitization took place, and 85% for those who did not). The
rather small number of respondents who affirmed that UNMIL training took place in their
community were both more likely to consider the elections to have been fair (91% instead
of 72%) and to report that they voted (96% instead of 88%). A rather curious result is that
those who reported UNMIL security activity in their local polling stations were less likely
to report elections as having been fair (67% as opposed to 77%), but were nonetheless more
likely to report having voted than those who could not affirm security activity having taken
place (96% versus 86%).18
52. What we cannot establish from these associations are whether they indicate effects
18The associations reported here are bivariate associations. When we study the associations jointly withmultiple regression, the marginal relationships are just as pronounced.
30

of the electoral activities on individuals, or if they reflect some disposition in respondents
that makes them more likely to report on UNMIL electoral activities and election conditions
in certain ways. Sorting this out is challenging. Comparisons between respondents from
different communities is plagued by the fact that different communities faced very different
electoral circumstances—something that is not adequately captured in the data. Comparing
respondents from the same community who nonetheless differed in what UNMIL electoral
activities is problematic, because we don’t have a good sense of why respondents from the
same community would have reported different types of activity (or non-activity). One
approach is to study outcomes at the level of communities themselves—that is, by using
average responses as a measure of “extent of penetration” of UNMIL electoral activities.
When we do so, only the positive association between training and perceptions of fairness
and the negative association between security activity and perceptions of fairness stay the
same. A negative association emerges between security activity and voting, however, and
other associations effectively disappear. Because the measured associations are intriguing, we
recommend that a more sound analysis be conducted—one that uses data on actual UNMIL
program activity. Such data could not be furnished to us during our period of fieldwork.
XIV. Human rights promotion
A. UNMIL’s respect for human rights
53. Respondents appreciated UNMIL peacekeeping personnel as respectful. We asked re-
spondents whether they thought UNMIL peacekeepers treated people in their communities
“with respect and dignity”; 84% responded “always”, 8% “sometimes”, 2% rarely, and 5%
“never.”
B. Social cohesion and human rights attitudes
54. We examine whether proximity to deployments is associated with differences in human
rights perceptions. We hypothesize that deployment bases facilitate the establishment and
operation of NGOs and civil society organizations; in addition, human rights promotion done
under the auspices of the peacekeeping operation itself will tend to be concentrated near base
areas. We test whether deployment and proximate communities show greater progress in
human rights promotion than comparable “distant” communities. The evidence suggests
impacts associated with perspectives on gender, but there is little to suggest that deploy-
ment areas were hubs of activity that had any significant impact on inter-ethnic cohesion or
perspectives on transitional justice.
55. We first examine attitudes toward political and gender rights. We asked whether
31

people feel that it is important to hold their leaders accountable, whether they deem violent
protest to be legitimate, whether they think that women should be granted equal rights
and responsibilities, and whether they feel that women should be allowed to hold office. In
comparing deployment, proximate, and distant communities, we find no significant differ-
ences in attitudes toward accountability or violent protest; 80% of people agree that they
have a right to keep a close eye on their leaders, 76% say that violent protest is not okay.
These percentages do not differ significantly across community types. We do find significant
differences in perceptions toward women’s rights promotion. Whereas about 63% of people
in both distant and proximate communities agree that women should have equal rights and
responsibilities, the percentage is about 71% in the deployment communities. Interestingly,
this effect is concentrated among men. On the rights of women to hold office, we find that
approximately 61% of people in distant and proximate communities agree with this right,
whereas the percentage in deployment communities is approximately 64%. In this case, the
effect is concentrated among women.
56. We next examine ethnic identity, and the extent to which individuals in different
communities tend, on average, to cling to a strong sense of ethnic identity. While ethnic
identification can provide a basis for joint community action, given the politicization of
ethnicity during the course of the Liberian conflict and the fact that violence was often
interpreted along ethnic lines, we might take strong signs of ethnic parochialism as being
worrying. We used an index that measures levels of ethnic parochialism. Respondents were
asked three questions: whether they thought it is necessary to support co-ethnics even if
they disagree with them; whether they thought the fate of co-ethnics had more to do with
politics than hard work; and whether they thought their personal fate depended a lot on the
fate of their co-ethnics as a group. The index is simply the number of “yes” responses. On
this score, we find that respondents in deployment communities express significantly higher
levels of parochialism than their counterparts in proximate and distant communities. This
difference is totally attributable to the much more parochial responses of recently resettled
individuals in deployment communities. This is further evidence on the importance of effects
that deployments may have on post-conflict household settlement patterns.
57. Finally, we examine whether activities in the vicinity of peacekeepers may have
improved public awareness of transitional justice processes and stimulated demands for such
processes. We asked whether respondents had heard “nothing”, “not much”, “some”, or
“a great deal” about the national Truth and Reconciliation Commission; about 44% of
respondents indicated that they had heard some or a great deal, and there were no differences
across deployment, proximate, and distant communities. In terms of demands for transitional
justice, we asked what respondents think would be the appropriate thing to do to combatants
that committed violent abuses during wartime; 65% indicated a preference to “forgive those
32

who admit wrongdoing”, 30% indicated “forgive all of them”, and 7% indicated a preference
for punishment. These percentages did not differ across deployment, proximate, and distant
communities. Finally, we asked whether respondents thought that it was better to “seek
the truth” about what happened during the war or “try to forget about the past.” We find
that 35% of respondents in distant communities express a preference for seeking the truth.
This figure is 31% and 41% for respondents in deployment and proximate communities,
respectively; these are not significantly different from the distant community percentage,
although they are significant different from each other.
XV. Public information
58. UNMIL Radio enjoyed widespread listenership among our respondents: 77% of respon-
dents indicated that they had listened to it. Among listeners, 48% indicated listening every
day, 41% indicated a few times per week, 9% a few times per month, and only about 2%
indicated listening less than once a month. Listenership patterns were roughly similar in de-
ployment, proximate, and distant communities, with slightly more of the respondents from
deployment communities listening every day than in proximate and distant communities
(53% in deployment communities, versus 49% and 43% in proximate and distant communi-
ties, respectively). These commonly high levels of engagement with UNMIL’s public infor-
mation could help to explain why attitudes toward UNMIL’s role in the peace process were so
similar across the different types of communities. When asked what programs they listened
to most often, the largest number of listener respondents said “peace and reconciliation”
(41%), followed by “news” (30%), and “culture, sports, and music” (19%). 84% of listener
respondents considered UNMIL radio to be “more objective” than other local, national, or
international stations, and 80% considered UNMIL radio to be more detailed.
XVI. Conclusion
59. This study sought to identify UNMIL’s impacts at the local level and to gauge the success
of certain activities conducted under the auspices of UNMIL’s substantive sections. Although
UNMIL assumed control of peacekeeping operations after fighting ended, it enjoys high
legitimacy as a security provider among Liberians represented in our sample. This perception
may help explain the substantially lower out-migration and higher resettlement and in-
migration that deployment communities have experienced in recent years. The study also
finds that UNMIL has helped revitalize local economies, generate political interest (especially
on the part of women and former combatants), and increase awareness about human and
gender rights.
33

60. Nonetheless, there are a few areas that still need improvement. First, the legitimacy
that UNMIL enjoys as a security provider can result in a dependency that could be difficult
to sever. Indeed, most respondents stated that UNMIL should stay in the country. If the
new security forces do manage to gain the same level of confidence, this could threaten the
sustainability of peace.
61. A second priority area is the reintegration of newly resettled households. This
population seems to experience more social malaise than the rest of the population. For
instance, reported crime victimizations were concentrated within this population. Whether
such malaise prompted resettlement in the first place or occurred after resettlement, they
cannot be ignored. Furthermore, we noted that deployment communities tended to be less
engaged in associational and community life. Whether this result reflects the social costs of
years of civil war or simply indicates the consequences of economic and resettlement impacts
of deployments in the localities, it is a serious problem that may threaten to undo the growing
political interest among Liberians and indeed the peace itself.
62. Finally, with respect to exit strategy, UNMIL and the broader humanitarian com-
munity can contribute to consolidating the peace in Liberia by (i) supporting the reinte-
gration of newly resettled households; (ii) supporting efforts to foster social and community
cohesion, especially among the newly resettled households; and (ii) providing electoral as-
sistance to sustain political interest among ordinary citizens. These efforts, combined with
the government’s own initiatives in these areas could provide a more solid foundation for a
self-sustaining peace.
34


![Research Article Multivariate Analysis, Mass Balance ...downloads.hindawi.com/journals/tswj/2014/793236.pdfquantitative view of igneous petrological mechanisms [ , ]. Particularly,](https://static.fdocuments.in/doc/165x107/5f08debd7e708231d4241f2f/research-article-multivariate-analysis-mass-balance-quantitative-view-of-igneous.jpg)