Quantitative exposure assessment for Listeria ... (02) 2010/IFRJ-2010-267-280_Titik_Malaysia... ·...
14
© All Rights Reserved *Corresponding author. Email: [email protected] International Food Research Journal 17: 267-280 (2010) 1* Titik, B. and 2 Naiyana, C. 1 Food Technology Division, School of Industrial Technology, Universiti Sains Malaysia-Penang, Malaysia 2 Food Microbiology Laboratory, Wageningen University, Wageningen, The Netherlands Introduction L. monocytogenes are pathogenic for humans and animals (Vazquez-Boland et al., 2001) and grow in a wide temperature range, from -1.5 to 45ºC (Gray et al., 1966; Junttila et al., 1988; Hudson et al., 1994). The growth of the organism at -1.5ºC is very slow, with a lag time of 174 h (Hudson et al., 1994). Listeria can move with flagella and polymerizing actin comet tails with a protein called ActA. Some studies suggest that 1 to 10% of humans may carry L. monocytogenes in their intestines (EMLab, 2009). Listeriosis, caused by L. monocytogenes, is a food borne infection of great public health concern due to its clinical severity and high case fatality. Mostly affected by severe disease are people who are elderly or immunocompromised, pregnant women and neonates (younger than four weeks). L. monocytogenes can cause meningoencephalitis and/or septicemia in newborns, elderly, immunocompromised patients and abortion in pregnant women (Marchant, 2003). The infective dose of L. monocytogenes is unknown but is believed to vary with the strain and susceptibility of the victim. The mortality rate of L. monocytogenes (20– 30% in some epidemic cases) is greater than that of other pathogens, such as Escherichia coli O157:H7, Salmonella and Campylobacter (Farber, 1991; Norrung, 2000; Öktem, 2006). The reported yearly incidence of human listeriosis ranges from 0.1 to 11.3 cases per million persons (Notermans et al., 1998), 0.3 to 7.5 cases per million people in Europe (Anonymous, 1999), 4.4 cases per million people in the United States of America (Mead et al., 1999) and 3 cases per million people in Australia. Most listeriosis cases are associated with a restricted number of serotypes: 1/2a (15–25%); 1/2b (10–35%); 1/2c (0–4%); 3 (1–2%); 4b (37–64%); and 4 not b (0–6%) (McLauchlin, 1990; Farber and Peterkin, 1991). Outbreaks of listeriosis have been associated with the consumption of many kinds of food products, mainly ready-to-eat (RTE) food (Coillie, 2004). Roughly about 80% death and listeriosis cases were caused by RTE-deli meat (Galagher et al., 2003). RTE cooked meats are frequently contaminated with L. monocytogenes during post-processing steps (Beresford et al., 2001). L. monocytogenes can be present in product’s ingredients due to a processing error. Even this product has successfully undergone a lethality treatment, Listeria contamination is still Quantitative exposure assessment for Listeria monocytogenes in cooked ham Abstract: The objectives of this study were predicting the transmission and survival of L. monocytogenes in cooked ham during supply chain. Cooked ham are frequently contaminated with L. monocytogenes during post- processing steps through contact on surface of processing, handling, packaging equipment. Transfer rate of L. monocytogenes on static and dynamic condition in various surface type was investigated. The prevalence and level of L. monocytogenes in cooked ham at plant as well as the prevalence of unsatisfactory processing at retail were studied. A Monte Carlo simulation model was created by using @risk. The simulation predicted that the prevalence was 11.76 % with 90% confidence interval of 2% to 25% and estimated level was -4.02 log CFU/ cm 2 . It was estimated to be occurred on slicing step at plant. Our results suggest that, the prevalence and level of L. monocytogenes can be reduced by Good Handling Process application and/or HACCP application. Keywords: Quantitative assessment, Listeria monocytogenes, cooked ham
Transcript of Quantitative exposure assessment for Listeria ... (02) 2010/IFRJ-2010-267-280_Titik_Malaysia... ·...

© All Rights Reserved*Corresponding author. Email: [email protected]
International Food Research Journal 17: 267-280 (2010)
1*Titik, B. and 2Naiyana, C.
1Food Technology Division, School of Industrial Technology,Universiti Sains Malaysia-Penang, Malaysia
2Food Microbiology Laboratory, Wageningen University, Wageningen, The Netherlands
Introduction
L. monocytogenes are pathogenic for humans and animals (Vazquez-Boland et al., 2001) and grow in a wide temperature range, from -1.5 to 45ºC (Gray et al., 1966; Junttila et al., 1988; Hudson et al., 1994). The growth of the organism at -1.5ºC is very slow, with a lag time of 174 h (Hudson et al., 1994). Listeria can move with flagella and polymerizing actin comet tails with a protein called ActA. Some studies suggest that 1 to 10% of humans may carry L. monocytogenes in their intestines (EMLab, 2009).
Listeriosis, caused by L. monocytogenes, is a food borne infection of great public health concern due to its clinical severity and high case fatality. Mostly affected by severe disease are people who are elderly or immunocompromised, pregnant women and neonates (younger than four weeks). L. monocytogenes can cause meningoencephalitis and/or septicemia in newborns, elderly, immunocompromised patients and abortion in pregnant women (Marchant, 2003). The infective dose of L. monocytogenes is unknown but is believed to vary with the strain and susceptibility of the victim.
The mortality rate of L. monocytogenes (20–
30% in some epidemic cases) is greater than that of other pathogens, such as Escherichia coli O157:H7, Salmonella and Campylobacter (Farber, 1991; Norrung, 2000; Öktem, 2006). The reported yearly incidence of human listeriosis ranges from 0.1 to 11.3 cases per million persons (Notermans et al., 1998), 0.3 to 7.5 cases per million people in Europe (Anonymous, 1999), 4.4 cases per million people in the United States of America (Mead et al., 1999) and 3 cases per million people in Australia. Most listeriosis cases are associated with a restricted number of serotypes: 1/2a (15–25%); 1/2b (10–35%); 1/2c (0–4%); 3 (1–2%); 4b (37–64%); and 4 not b (0–6%) (McLauchlin, 1990; Farber and Peterkin, 1991).
Outbreaks of listeriosis have been associated with the consumption of many kinds of food products, mainly ready-to-eat (RTE) food (Coillie, 2004). Roughly about 80% death and listeriosis cases were caused by RTE-deli meat (Galagher et al., 2003). RTE cooked meats are frequently contaminated with L. monocytogenes during post-processing steps (Beresford et al., 2001). L. monocytogenes can be present in product’s ingredients due to a processing error. Even this product has successfully undergone a lethality treatment, Listeria contamination is still
Quantitative exposure assessment for Listeria monocytogenes in cooked ham
Abstract: The objectives of this study were predicting the transmission and survival of L. monocytogenes in cooked ham during supply chain. Cooked ham are frequently contaminated with L. monocytogenes during post-processing steps through contact on surface of processing, handling, packaging equipment. Transfer rate of L. monocytogenes on static and dynamic condition in various surface type was investigated. The prevalence and level of L. monocytogenes in cooked ham at plant as well as the prevalence of unsatisfactory processing at retail were studied. A Monte Carlo simulation model was created by using @risk. The simulation predicted that the prevalence was 11.76 % with 90% confidence interval of 2% to 25% and estimated level was -4.02 log CFU/ cm2 . It was estimated to be occurred on slicing step at plant. Our results suggest that, the prevalence and level of L. monocytogenes can be reduced by Good Handling Process application and/or HACCP application.
Keywords: Quantitative assessment, Listeria monocytogenes, cooked ham

268 Titik, B. and Naiyana, C.
International Food Research Journal 17: 267-280
possible through several means such as contact with biofilms on surfaces of processing, handling, packaging equipment that can harbor pathogens, exposure to environmental contamination or cross-contamination in the processing environment encountered after the lethality treatment. (Saulo, 2005). A survey of L. monocytogenes contamination in the products was conducted at retail markets. The overall prevalence was 1.82%, with prevalence ranging from 0.17% to 4.7% among the product categories, with in-store-packaged foods significantly higher than manufacturer packaged foods (Gombas et al., 2003).
L. monocytogenes can be spread easily by direct contact of food with a contaminated surface, growth at refrigeration temperatures as low as 2oC or under low oxygen tension such as found in vacuum-packaged RTE meats (Samelis et al., 2002). The processing steps after cooking such as peeling, sorting, loading, slicing, packaging, etc., are potential sources of recontaminations for pathogens such as L. monocytogenes. A USDA-FSIS survey published in 2001 showed that 1-10% of retail RTE meat products were contaminated with L. monocytogenes (Levine et al., 2001). So, the evaluation of the transfer rate of L. monocytogenes on cooked ham due to contact surface is useful to inform the regulator, industry and retailer setting appropriate handling process. From this point of view, the purpose of this article was to provide the analysis of L. monocytogenes contamination on cooked ham on plant to retail. We propose in this study to examine the transfer rate of L. monocytogenes on different surface type (stainless steel, normal belt, antimicrobial belt) in static and dynamic condition. Pressure and moisture level condition on surface were investigated as well.
The objectives of this study were predicting the transmission and survival of L. monocytogenes in cooked ham during supply chain. This analysis is essential to provide information of exposure assessment for L. monocytogenes in cooked ham.
Material and Methods
L. monocytogenes ATCC 35152 (Microbiologics, MediMark,Europe) were inoculated in brain-heart infusion (Oxoid) and incubated overnight at 37oC. Approximately 700 µl of this strain were mixed with 300 µl of glycerol (R and M) in the 0.1 ml cryo vials (Greiner Bio-one, Frickenhausen, Germany) and 5 glass beads (Ø 2 mm, Emergo, Landsmeer, The Netherlands). The stock cultures were maintained at -80oC in cryo vials (Greiner Bio-one, Frickenhausen, Germany).
Strains were cultured by transferring one glass bead onto Tryptic Soy Agar (Oxoid) for 24 h at 30oC. One formed colony is transferred onto 10 ml of BHI broth followed by incubation for 24 h at 37oC. The test suspensions were prepared by making serial dilutions of the micro organisms in Neutralized Bacteriological Peptone (Oxoid). Selective agar media were used for the enumeration of pathogens: PALCAM (Merck) for L. monocytogenes ATCC 35152 incubated for 24-48 h at 37oC. The viable counts from surfaces were carried out using contact plates with RODAC Plate. Cooked ham (approximately 2 kg) was purchased in chub form from a local retailer held at 4oC, and used within 7 days.
Transfer rate of L. monocytogenes from surface to cooked ham and vice versa (static condition)
About 1 ml of bacterial cell suspension of range from 1 to 6 Log CFU/cm2 respectively was dropped and spread to the stainless steel surface (20 by 20 cm2) with the pipette. The uncontaminated cooked ham and RODAC plate was placed as samples of about 4 and 5 pieces respectively.
Prior to inoculation, stainless steel trays were sterilized in an autoclave 121oC for 25 min. Antimicrobial conveyor belt (Habasit) and normal conveyor belt (Habasit), were sprayed in a alcohol 70% ethanol for 30 minutes, and then air dried in a laminar hood.
The transfer rates of L. monocytogenes ATCC 35152 from cooked ham to surfaces were collected by laboratory experiments. For this, 2 ml of bacterial cell suspension of approximately 5 Log CFU/cm2 was spread evenly with a pipette onto cooked ham and held at room temperature for 15 min to facilitate attachment. The level of micro organisms on this artificially contaminated cooked ham was determined by sampling a 2 by 2 cm2 area with cotton swab (on the surface). Thereafter, the swab was suspended in 1: 10 of peptone saline solution and subsequently enumerated on selective media PALCAM.
The cooked ham was then put on a surface of stainless steel (20 by 20 cm2), antimicrobial conveyor belt (20 by 10 cm2) or normal conveyor belt (20 by 10 cm2). After 10 seconds, the cooked ham portion was removed, and the surface area where the cooked ham portion had been placed was sampled using RODAC plates for 10 seconds. The measurements were done on wet and dry condition of surface. Wet condition samples were taken directly after artificial contamination. The dry condition samples were taken 15 minutes after artificial contamination.
Pressure and non pressure condition were applied to the product in order to press the product on the
Quantitative exposure assessment for Listeria monocytogenes in cooked ham 269
International Food Research Journal 17: 267-280
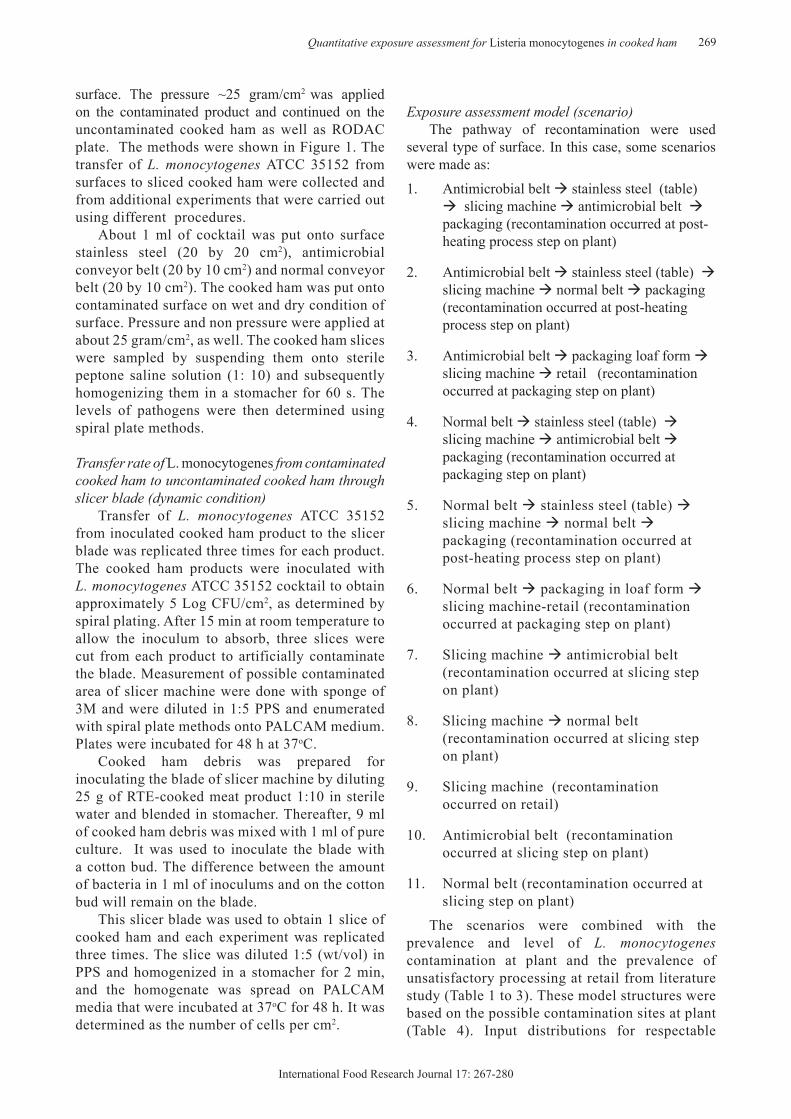
surface. The pressure ~25 gram/cm2 was applied on the contaminated product and continued on the uncontaminated cooked ham as well as RODAC plate. The methods were shown in Figure 1. The transfer of L. monocytogenes ATCC 35152 from surfaces to sliced cooked ham were collected and from additional experiments that were carried out using different procedures.
About 1 ml of cocktail was put onto surface stainless steel (20 by 20 cm2), antimicrobial conveyor belt (20 by 10 cm2) and normal conveyor belt (20 by 10 cm2). The cooked ham was put onto contaminated surface on wet and dry condition of surface. Pressure and non pressure were applied at about 25 gram/cm2, as well. The cooked ham slices were sampled by suspending them onto sterile peptone saline solution (1: 10) and subsequently homogenizing them in a stomacher for 60 s. The levels of pathogens were then determined using spiral plate methods.
Transfer rate of L. monocytogenes from contaminated cooked ham to uncontaminated cooked ham through slicer blade (dynamic condition)
Transfer of L. monocytogenes ATCC 35152 from inoculated cooked ham product to the slicer blade was replicated three times for each product. The cooked ham products were inoculated with L. monocytogenes ATCC 35152 cocktail to obtain approximately 5 Log CFU/cm2, as determined by spiral plating. After 15 min at room temperature to allow the inoculum to absorb, three slices were cut from each product to artificially contaminate the blade. Measurement of possible contaminated area of slicer machine were done with sponge of 3M and were diluted in 1:5 PPS and enumerated with spiral plate methods onto PALCAM medium. Plates were incubated for 48 h at 37oC.
Cooked ham debris was prepared for inoculating the blade of slicer machine by diluting 25 g of RTE-cooked meat product 1:10 in sterile water and blended in stomacher. Thereafter, 9 ml of cooked ham debris was mixed with 1 ml of pure culture. It was used to inoculate the blade with a cotton bud. The difference between the amount of bacteria in 1 ml of inoculums and on the cotton bud will remain on the blade.
This slicer blade was used to obtain 1 slice of cooked ham and each experiment was replicated three times. The slice was diluted 1:5 (wt/vol) in PPS and homogenized in a stomacher for 2 min, and the homogenate was spread on PALCAM media that were incubated at 37oC for 48 h. It was determined as the number of cells per cm2.
Exposure assessment model (scenario)The pathway of recontamination were used
several type of surface. In this case, some scenarios were made as:
Antimicrobial belt 1. stainless steel (table) slicing machine antimicrobial belt packaging (recontamination occurred at post-heating process step on plant)
Antimicrobial belt 2. stainless steel (table) slicing machine normal belt packaging (recontamination occurred at post-heating process step on plant)
Antimicrobial belt 3. packaging loaf form slicing machine retail (recontamination occurred at packaging step on plant)
Normal belt 4. stainless steel (table) slicing machine antimicrobial belt packaging (recontamination occurred at packaging step on plant)
Normal belt 5. stainless steel (table) slicing machine normal belt packaging (recontamination occurred at post-heating process step on plant)
Normal belt 6. packaging in loaf form slicing machine-retail (recontamination occurred at packaging step on plant)
Slicing machine 7. antimicrobial belt (recontamination occurred at slicing step on plant)
Slicing machine 8. normal belt (recontamination occurred at slicing step on plant)
Slicing machine (recontamination 9. occurred on retail)
Antimicrobial belt (recontamination 10. occurred at slicing step on plant)
Normal belt (recontamination occurred at 11. slicing step on plant)
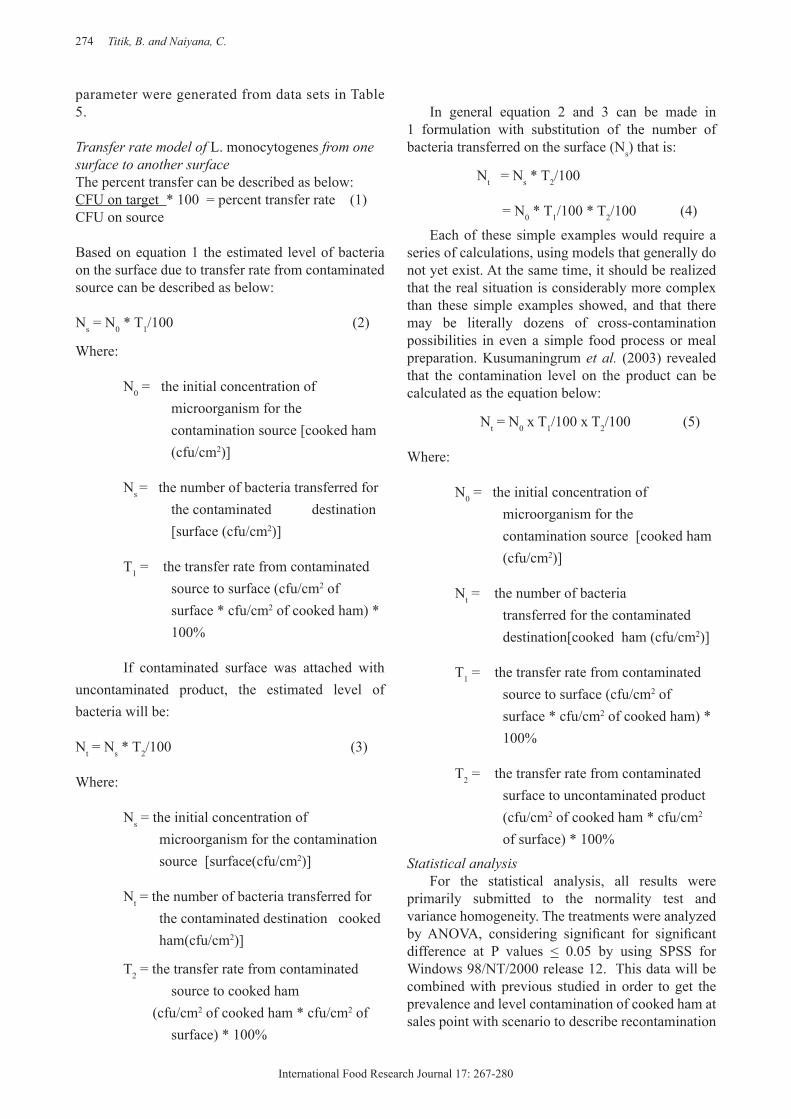
The scenarios were combined with the prevalence and level of L. monocytogenes contamination at plant and the prevalence of unsatisfactory processing at retail from literature study (Table 1 to 3). These model structures were based on the possible contamination sites at plant (Table 4). Input distributions for respectable

270 Titik, B. and Naiyana, C.
International Food Research Journal 17: 267-280
Source No of samples (ni) No. of positives Prevalence F(x)Samelis et al., 1999 10 1a 0.1 0.476Samelis et al., 1999 6 1b 0.167 0.762Samelis et al., 1999 4 1c 0.25 0.952Total 20 3
Table 1. Prevalence of L. monocytogenes on cooked ham at plant with Listeria spp. positive.
aUnsliced vacuum pack cooked meatbSliced product like hamcSliced cooked ham dF(x) is the cumulative probability, with ∑ [(ni)/(n + 1)] , where ni is the number of the samples taken in each reference, and n is the total number of samples taken for all references.
Source No of samples (ni) No. unsatisfactory Prevalence F(x)a Remark
Elson, 2004 159 35 0.22 0.062 Cleaning frequency not recorded
Elson, 2004 1997 450 0.23 0.842 Not cleaned periodicallyElson, 2004 403 120 0.3 0.999 Cleaning at the end of tradingTotal 2559 605
Table 2. Prevalence of unsatisfactory processing at retail
aF(x) is the cumulative probability, with ∑ [(ni)/(n + 1)] , where ni is the number of the samples taken in each reference, and n is the total number of samples taken for all references.
Level (CFU/g) Calculated levels (CFU/cm2)b n F(x)a Source 0.001 - 0.04 0.000162 – 0.0065 2901 0.96 USDA, 20030.041 – 0.1 0.0066-0.01621 125 0.99 USDA, 2003Total 3026
Table 3. Level of L. monocytogenes on cooked ham at plant with Listeria spp. positive.
aF(x) is the cumulative probability, with ∑ [(ni)/(n + 1)] , where ni is the number of the samples taken in each reference, and n is the total number of samples taken for all references.bCalculated with formula = CFU / (width area / weight) = CFU / (132.786/21.525) = CFU/6.169 cm2. Width area of 1 side cooked ham (with diameter 13 cm and thickness 0.2 cm) was 132.786 cm2
Contamination site ReferenceProcessing environment Nesbakken et al., 1996
Tumbling machine Samelis et al., 1998; Samelis et al., 1999Slicing machine Suihko et al., 2002
Conveyor belt Salvat et al., 1995; Giovannacci et al., 1999; Chasseignaux et al., 2001; Suihko et al., 2002
Skinning machine Suihko et al., 2002Mould Salvat et al., 1995
Table 4. L. monocytogenes contamination sites in meat plant

Quantitative exposure assessment for Listeria monocytogenes in cooked ham 271
International Food Research Journal 17: 267-280
Variable Distribution Rankb
At plant Pc Risk Cumul (0.01, 0.30{0.1,0.167,0.25},{0.476,0.762,0.952})a
P (unclean properties in retail) Risk Cumul (0.22,0.30, {0.22, 0.23, 0.3},{0.062,0.842,0.999})a
At plant Nd (log) Risk Cumul (-3,-1, {-2.988, -1.985},{0.96,0.99})a T1e (log %) Stainless steel Pref = 1, Mg = 1 Risk Normal(2.027h, 0.003i) 2 Pre = 0 , M = 0 Risk Normal(-1.90, 0.174) 2 Antimicrobial belt Pre = 1, M = 1 Risk Normal(0.854, 0.346) 2 Pre= 0 , M = 0 Risk Normal(0.268, 0.346) 2 Normal belt Pre= 1, M = 1 Risk Normal(1.583, 0.057) 2 Pre= 0 , M = 0 Risk Normal(1.025, 0.03) 2 Slicer machine Pre= 1, M = 0 Risk Normal(-0.51, 0.631) 2 T2j (log %) Stainless Steel Pre= 1, M = 1 Risk Normal(1.67, 0.025) 2 Pre= 0 , M = 0 Risk Normal(0.556, 0.10) 2 Antimicrobial belt Pre= 1, M = 1 Risk Normal(1.561, 0.199) 2 Pre= 0 , M = 0 Risk Normal(0.163, 0.04) 2 Normal belt Pre= 1, M = 1 Risk Normal(1.338,0.012) 2 Pre= 0 , M = 0 Risk Normal(1.29,0.087) 2 Slicer machine Pre= 1, M = 0 Risk Normal(0.286, 0.185) 2
aUsing the mean of the range of log valuebNormal distribution rank by the Anderson-Darling testcPrevalencedLevel of contaminationeTransfer rate of L. monocytogenes from contaminated ham onto uncontaminated surfacefPressure which consist of 1 (with pressure application) and 0 (without pressure application)gMoisture which consist of 1 (wet surface) and 0 (dry surface) hMean data which was obtained from experiment iStandard deviation data which was obtained from experimentjTransfer rate of L. monocytogenes from contaminated surface onto uncontaminated ham
Table 5. Input distribution

272 Titik, B. and Naiyana, C.
International Food Research Journal 17: 267-280
Table 6. Prevalence of contaminated cooked ham and levels of contamination on cooked ham (estimated by mean Monte Carlo simulation using log-transformed data)

Quantitative exposure assessment for Listeria monocytogenes in cooked ham 273
International Food Research Journal 17: 267-280
Table 7. Prevalence of contaminated cooked ham and levels of contamination on cooked ham (estimated by worst case using log-transformed data)
274 Titik, B. and Naiyana, C.
International Food Research Journal 17: 267-280
parameter were generated from data sets in Table 5.
Transfer rate model of L. monocytogenes from one surface to another surfaceThe percent transfer can be described as below: CFU on target * 100 = percent transfer rate (1)CFU on source
Based on equation 1 the estimated level of bacteria on the surface due to transfer rate from contaminated source can be described as below:
Ns = N0 * T1/100 (2)
Where:
N0 = the initial concentration of microorganism for the contamination source [cooked ham (cfu/cm2)]
Ns = the number of bacteria transferred for the contaminated destination [surface (cfu/cm2)]
T1 = the transfer rate from contaminated source to surface (cfu/cm2 of surface * cfu/cm2 of cooked ham) * 100%
If contaminated surface was attached with uncontaminated product, the estimated level of bacteria will be:
Nt = Ns * T2/100 (3)
Where:
Ns = the initial concentration of microorganism for the contamination source [surface(cfu/cm2)]
Nt = the number of bacteria transferred for the contaminated destination cooked ham(cfu/cm2)]
T2 = the transfer rate from contaminated source to cooked ham
(cfu/cm2 of cooked ham * cfu/cm2 of surface) * 100%
In general equation 2 and 3 can be made in 1 formulation with substitution of the number of bacteria transferred on the surface (Ns) that is:
Nt = Ns * T2/100
= N0 * T1/100 * T2/100 (4)
Each of these simple examples would require a series of calculations, using models that generally do not yet exist. At the same time, it should be realized that the real situation is considerably more complex than these simple examples showed, and that there may be literally dozens of cross-contamination possibilities in even a simple food process or meal preparation. Kusumaningrum et al. (2003) revealed that the contamination level on the product can be calculated as the equation below:
Nt = N0 x T1/100 x T2/100 (5)
Where:
N0 = the initial concentration of microorganism for the contamination source [cooked ham (cfu/cm2)]
Nt = the number of bacteria transferred for the contaminated destination[cooked ham (cfu/cm2)]
T1 = the transfer rate from contaminated source to surface (cfu/cm2 of surface * cfu/cm2 of cooked ham) * 100%
T2 = the transfer rate from contaminated surface to uncontaminated product (cfu/cm2 of cooked ham * cfu/cm2 of surface) * 100%
Statistical analysisFor the statistical analysis, all results were
primarily submitted to the normality test and variance homogeneity. The treatments were analyzed by ANOVA, considering significant for significant difference at P values < 0.05 by using SPSS for Windows 98/NT/2000 release 12. This data will be combined with previous studied in order to get the prevalence and level contamination of cooked ham at sales point with scenario to describe recontamination

Quantitative exposure assessment for Listeria monocytogenes in cooked ham 275
International Food Research Journal 17: 267-280
on direct contact between food and surface. Data sets for T1 (transfer rate from contaminated ham onto uncontaminated surface) and T2 (transfer rate from contaminated surface onto uncontaminated ham) were fitted using Bestfit (@Risk software version 4, Palisade, New York). The accuracy of fit of a distribution was ranked using Anderson-Darling test. A Monte-Carlo simulation with Latin-Hypercube sampling was used for simulation in 10,000 iterations. This simulation was done in order to get the distribution of probability and level contamination of L. monocytogenes on cooked ham from food contact surface.
Results
The transfer rate of L.monocytogenes from cooked ham onto stainless steel in static condition was higher than dynamic condition. It was 5.23% ± 1.13% and 4.29% ± 2.15 %. In the opposite direction, it was 2.057% ± 0.903% and 0.51% ± 0.45 %, respectively.
By using antimicrobial belt, we found the transfer rate of L. monocytogenes from cooked ham to surface (1st direction) and surface to cooked ham (2nd direction) were 7.15% ± 2.22% and 36.39% ± 1.58%, respectively. These were studied on P1M1 (with pressure, wet surface). It was higher than P0M0 (without pressure, dry surface). The results of P0M0 were 1.85% ± 2.22% and 1.46% ± 1.10% for 1st and 2nd direction.
By using normal belt, the study showed the transfer rates were 38.28% ± 1.14% and 21.78% ± 1.03% on P1M1. It was observed on 1st and 2nd direction. P0M0 showed to be lower for 10.59% ± 1.07% and 19.50% ± 1.22%, respectively.
By using stainless steel, the transfer rates on P1M1 were observed 106.41% ± 1.01% and 46.77% ± 1.06%. This result was shown by cooked ham to surface and the opposite direction. As comparison, the transfer rates on P0M0 were 0.01% ± 1.49% and 3.60% ± 1.26%, respectively.
The presence of L. monocytogenes on cooked ham on plant quantitatively was observed in 10% to 25%. These data was found on unsliced vacuum pack cooked meat, sliced product like ham and sliced cooked ham. These findings indicated that listeriae was associated with product handled after cooking. Post process contamination was likely to occur in the cutting room. Level of contamination L. monocytogenes on cooked ham was assumed from -3 to -1 log CFU/cm2. The prevalence of unsatisfactory processing at retail was estimated from 1% to 30%.
The probabilities of cooked ham contaminated with L. monocytogenes as the result of recontamination
were shown in Figure 1 and 2. The mean value of the probability of contamination with L. monocytogenes was 11.76% with 90% confidence interval from 2% to 25%. The highest level of L. monocytogenes on cooked ham due to recontamination was estimated in scenario 11 (recontamination occurred at slicing step on plant via normal belt) with the mean -4.02 log CFU/ cm2 in a 90% confidence interval of -4.15 to -3.92 log CFU/cm2. It means that 5% of the cooked ham may be contaminated with L. monocytogenes at a level 7.08/105 cm2 or less but also 5% of cooked ham may be contaminated with 1.20 CFU / 104 cm2
or more. The lowest levels was found in scenario 1
(recontamination occurred at post-heating step on plant) in the dry condition and no pressure application (P0M0). The mean value was -19.65 log CFU/cm2 with 90% confidence interval of -21.26 to -18.05 log CFU/cm2.
The scenario of cooked ham processing calculated the highest and lowest estimation level. Scenario 11 (recontamination occurred at slicing step on plant via normal belt) showed the highest estimated level of L. monocytogenes on cooked ham. It was followed by scenario 10 (recontamination occurred at slicing step on plant via antimicrobial belt). It means conveyor belt is a favor site for L. monocytogenes to be attached on its surface and can make recontamination on food product. The scenarios showed bacteria can still transfer in dry condition. In worst case, it was calculated for 0.001550454 CFU/cm2 or 155 CFU/105 cm2.
The highest level of L. monocytogenes on cooked ham due to recontamination was estimated in scenario 11 (recontamination occurred at slicing step on plant via normal belt) with the mean -4.02 log CFU/ cm2 in a 90% confidence interval of -4.15 to -3.92 log CFU/cm2. It means that 5% of the cooked ham may be contaminated with L. monocytogenes not only at a level 7.08/105 cm2 or less but also at a level 1.20 CFU / 104 cm2 or more. The lowest levels was found in scenario 1 (recontamination occurred at post-heating process step on plant) in the dry condition and without pressure. The mean value was -19.65 log CFU/cm2 in a 90% confidence interval of -21.26 to -18.05 log CFU/cm2.
Prevalence of L. monocytogenes at the retail level was shown at figure 5. The mean value of the probability of contamination with L. monocytogenes was 2.71% with 90% confidence interval of 0% to 6%. The highest level of L. monocytogenes contamination on cooked ham due to recontamination was estimated in scenario 9 (recontamination at slicing step) with the mean -7.17 log CFU/ cm2 in a 90% confidence

276 Titik, B. and Naiyana, C.
International Food Research Journal 17: 267-280
M ean = 2.720909E-02
X <=0.0695%
X <=05%
0
5
10
15
20
25
0 22.5 45 67.5 90
Prevalence of L. monocytogenes contamination (Values in 10^-3)
Pro
babi
lity
dens
ity
@RISK Student VersionFor Academic Use Only
@RISK Student VersionFor Academic Use Only
@RISK Student VersionFor Academic Use Only
@RISK Student VersionFor Academic Use Only
@RISK Student VersionFor Academic Use Only
@RISK Student VersionFor Academic Use Only
@RISK Student VersionFor Academic Use Only
@RISK Student VersionFor Academic Use Only
@RISK Student VersionFor Academic Use Only
@RISK Student VersionFor Academic Use Only
Mean = -4.021455
X <=-3.9295%
X <=-4.155%
0
1
2
3
4
5
6
-4.5 -3.875 -3.25 -2.625 -2
Estimated level of L. monocytogenes contamination (Log CFU/cm2)
Pro
babi
lity
dens
ity
@RISK Student VersionFor Academic Use Only
@RISK Student VersionFor Academic Use Only
@RISK Student VersionFor Academic Use Only
@RISK Student VersionFor Academic Use Only
@RISK Student VersionFor Academic Use Only
@RISK Student VersionFor Academic Use Only
@RISK Student VersionFor Academic Use Only
@RISK Student VersionFor Academic Use Only
@RISK Student VersionFor Academic Use Only
@RISK Student VersionFor Academic Use Only
Figure 1. Prevalence of L. monocytogenes contamination (Scenario 11 – Pressure, wet)
Figure 2. Prevalence of L. monocytogenes contamination (Scenario 1 – Non pressure,dry)
Figure 3. The highest estimated levels of L. monocytogenes (Scenario 11–Pressure, wet)

Quantitative exposure assessment for Listeria monocytogenes in cooked ham 277
International Food Research Journal 17: 267-280
Mean = -19.64842
X <=-18.0595%
X <=-21.265%
0
0.05
0.1
0.15
0.2
0.25
0.3
0.35
0.4
0.45
-24 -21 -18 -15
Estimated level of L. monocytogenes contamination (Log CFU/cm2)
Pro
babil
ity de
nsity
@RISK Student VersionFor Academic Use Only
@RISK Student VersionFor Academic Use Only
@RISK Student VersionFor Academic Use Only
@RISK Student VersionFor Academic Use Only
@RISK Student VersionFor Academic Use Only
@RISK Student VersionFor Academic Use Only
@RISK Student VersionFor Academic Use Only
@RISK Student VersionFor Academic Use Only
@RISK Student VersionFor Academic Use Only
@RISK Student VersionFor Academic Use Only
Mean = 0.0271
X <=05%
X <=0.0695%
0
5
10
15
20
25
0 22.5 45 67.5 90
Prevalence of L. monocytogenes contamination in cooked ham at sales point due to direct contact surface
(values in 10^-3)
Pro
babi
lity d
ensit
y
@RISK Student VersionFor Academic Use Only
@RISK Student VersionFor Academic Use Only
@RISK Student VersionFor Academic Use Only
@RISK Student VersionFor Academic Use Only
@RISK Student VersionFor Academic Use Only
@RISK Student VersionFor Academic Use Only
@RISK Student VersionFor Academic Use Only
@RISK Student VersionFor Academic Use Only
@RISK Student VersionFor Academic Use Only
@RISK Student VersionFor Academic Use Only
Mean = -10.73543
X <=-11.965%
X <=-9.4795%
0
0.1
0.2
0.3
0.4
0.5
0.6
-14 -13 -12 -11 -10 -9 -8 -7
Estimated level of L. monocytogenes (log CFU/cm2)
Pro
babi
lity d
ensit
y
@RISK Student VersionFor Academic Use Only
@RISK Student VersionFor Academic Use Only
@RISK Student VersionFor Academic Use Only
@RISK Student VersionFor Academic Use Only
@RISK Student VersionFor Academic Use Only
@RISK Student VersionFor Academic Use Only
@RISK Student VersionFor Academic Use Only
@RISK Student VersionFor Academic Use Only
@RISK Student VersionFor Academic Use Only
@RISK Student VersionFor Academic Use Only
Mean =-7.166448
X <=-8.275%
X <=-6.0395%
0
0.1
0.2
0.3
0.4
0.5
0.6
0.7
-10 -8 -6 -4
Estimated level of L. monocytoges (Log CFU/cm2)
Pro
babi
lity
dens
ity
@RISK Student VersionFor Academic Use Only
@RISK Student VersionFor Academic Use Only
@RISK Student VersionFor Academic Use Only
@RISK Student VersionFor Academic Use Only
@RISK Student VersionFor Academic Use Only
@RISK Student VersionFor Academic Use Only
@RISK Student VersionFor Academic Use Only
@RISK Student VersionFor Academic Use Only
@RISK Student VersionFor Academic Use Only
@RISK Student VersionFor Academic Use Only
Figure 4. The lowest estimated levels of L. monocytogenes (Scenario 1– Non pressure,dry)
Figure 5. Prevalence of L. monocytogenes contamination at retail
Figure 6. Lowest level of L. monocytogenes contamination on cooked ham at sales point (found on scenario 3 – P0M0) (antimicrobial belt - slicing at retail)
Figure 7. Highest level of L. monocytogenes contamination on cooked ham at sales point due to direct contact surface with slicer machine at the retail (found on scenario 9)
interval of -8.27 to -6.03 log CFU/cm2. It means that 5% of the cooked ham may be contaminated with L. monocytogenes at a level 6.76 CFU /108 cm2 or less but also 5% of cooked ham may be contaminated with 9.33 CFU/ 107 cm2 or more. The lowest levels were found in scenario 3 (antimicrobial belt - slicing at retail). The mean value was -10.73 log CFU/cm2 in a 90% confidence interval of -11.96 to -9.47 log CFU/cm2. It was observed that prevalence of L. monocytogenes on ham at sales point of retail’s processing was 11.76% with 90% confidence interval 2% to 25% (Monte Carlo simulation) and 7.5% (worst case). These results agreed with the studies of Elson (2004) and Wong (2005) studies which were 0.00035 and 0.333. The prevalence of L. monocytogenes at sales point without retail’s processing was 25% (worst case). In Monte Carlo simulation, it was found 2.72% with 90% confidence interval 0% to 6%.
Discussion
Scenarios were calculated and the consideration was based on application of pressure and moisture level due to its significance difference (P<0.05) on transfer rate. Sattar et al. (2001) found that the
bacterial transfer from moist donor fabrics was always higher than that to and from dry ones. Moreover the transfer rate would be higher if pressure was applied (Vorst, 2006).
Bloomfield and Scott (1997) proposed that the risk of food borne illness associated with cross-contamination depend on two factors: the level of contamination on the surface and the probability of its transfer to the foods being consumed. The probability of bacterial transfer between surfaces or between surface and food is poorly characterized. Kusumaningrum et al. (2003) studied that Salmonella enteridis, Staphilococcus aureus and Campylobacter jejuni were still viable on dry stainless steel surfaces for hours (C. jejuni) or days after contamination (S. enteridis and S. aureus) depended on their initial number.
Other factor can influence the transfer rate of bacteria has been studied, such as surface type (Sinde and Carballo, 2000). L. monocytogenes was stronger to attach polyurethane than stainless steel (Sinde et al., 2000). Thus, L. monocytogenes can contaminate food processing plants for extended periods of time, and the contamination is often caused by a few dominating strains or persistent strains (Autio

278 Titik, B. and Naiyana, C.
International Food Research Journal 17: 267-280
et al., 1999; Lunden, 2002). This happening make opportunity for the bacteria to attach for a long time in following process due to inadequate cleaning and can persist. It may make a recontamination. The sliced product would be a risk product due to a larger area of the surface and can contact directly with equipment surface. Lunden (2002) revealed that conveyor is generally contaminated after slicing process. This means slicing process could be a critical point for L. monocytogenes to contaminate cooked ham product. The probabilities of cooked ham contaminated with L. monocytogenes as the result of recontamination from plant were 11.76 % with 90% confidence interval of 2% to 25%.
The recontamination on several scenarios indicated that the highest was found at slicing step via normal belt in wet condition-pressure application for 0.00033572 CFU/cm2. Midelet and Carpentier (2002) reported that L. monocytogenes attached more strongly to polymer than stainless steel. Conveyor belt materials are polyvinyl chloride and polyurethane. Some microorganism, including L. monocytogenes strains, adheres in higher numbers to more hydrophobic materials (Cunliffe et al., 1999; Sinde and Carballo 2000; Donlan 2002). Rubber and plastic are hydrophobic materials; meanwhile glass and stainless steel are hydrophilic materials (Sinde et al., 2000; Donlan, 2002).
In worst case, it was 0.001550454 CFU/cm2. It can be described that persistence of L. monocytogenes in equipment of cooked ham production becomes important factor. The scenario showed that recontamination in dry condition can occur in longer time to do recontamination than in wet condition.
The lowest levels was found in scenario 1 (recontamination occurred at post-heating process step on plant via antimicrobial belt) in the dry condition and without pressure. The mean value was -19.65 log CFU/cm2 in a 90% confidence interval of -21.26 to -18.05 log CFU/cm2.
Antimicrobial belt was impregnated by silver ion which can prevent the attachment of bacteria. Silver ions are used to coat surface of food processing properties. Silver ion is an inorganic anti-microbial. It controls a wide variety of pathogens in several ways such as destroying the cell walls of microbes, disrupting the microbe growth by interrupting RNA replication, interfered the respiration of bacteria, inhibition the production of enzymes in assimilation of nutrients. Moreover silver ion is an inorganic biocide which can be useful in managing a wide range of bacteria and moulds (Anonymous, 2001).
Level of contamination of cooked ham in the retail (9th scenario) was 5.025x10⁻⁶ CFU/cm2 for
worst case. It was very low when compare with Elson (2003) about 104 – 105 CFU/gram in 1 sample of 2894 and Wong (2005) about 50 CFU / gram in 1 sample of 3. The high contamination was observed due to food contact surface and abuse temperature. In this study the recontamination mentioned on food contact surface only. Thus, it will be interesting if the future study can study further more on the temperature abuse and can include this factor into model’s input.
Elson (2005) revealed that poor microbiological quality was associated with pre-sliced meats, infrequent cleaning of slicing equipment and poor control of practices that may lead to cross contamination. In order to reduce level of L. monocytogenes from plant and retail, some action should be done.
Adequate cleaning on the susceptible equipment1.
Applying the proper methods by using ham Good 2. Handling Process and/or HACCP system.
Conclusions
Factors that had effect on transfer rate of L. monocytogenes were application of pressure, moisture level of surface, source and destination of transfer (include type of surface), inoculums size, and static-dynamic condition. Inadequate cleaning can cause recontamination on the cooked ham from plant to at sales point in retail. Some actions that can be done are adequate cleaning of equipment cooked ham production at retail and plant and Good Handling Process application and/or HACCP application. Other product should be studied in order to get more data of transfer rate and can be implied with the real condition in the market. Deli meat has a high risk of listeriosis. It is therefore type of deli meat should be studied as a different character of its tissue. These data can be put in the scenario in order to describe with the real condition. References
Anonymous. 1999. Opinion of the Scientific Committee on Veterinary Measures Relating to Public Health on Listeria monocytogenes. 23 September 1999. European Commission, Health & Consumer Protection Directorate-General (SANCO).
Anonymous. 2001. Silver ion. Download from http://www.meatnews.com/mp/northamerican/dsp_article_mp.cfm?artNum=252&issueyear=2001&issuemonth=12 on 17 July 2005.
Autio. T., Hielm. S., Miettinen, M., Sjoberg, A.M., Aarnisal, K., Bjorkroth, J., Mantilla - Sandholm,

Quantitative exposure assessment for Listeria monocytogenes in cooked ham 279
International Food Research Journal 17: 267-280
T. and Korkeala, H. 1999. Sources of Listeria monocytogenes contamination in a coldsmoked rainbow trout processing plant detected by pulsed-field gel electrophoresis. Applied and Environmental Microbiology 65: 150–155.
Beresford, M.R., Sharma, G. and Andrew, P.W. 2001. Listeria monocytogenes adheres to many materials found in food processing environments. Journal of Applied Microbiology 90: 1000-1005.
Bloomfield, S.E. and Scott, E. 1997. Cross contamination and infection in the domestic environment and the role of chemical disinfectant. Journal Applied Microbiology 83: 1-9.
Chasseignaux, E., Toquin, M.T., Raqimbeau, C., Salvat, G., Colin, P. and Ermel, G. 2001. Molecular epidemiology of Listeria monocytogenes isolates collected from the environment, raw meat and raw products in two poultry- and pork-processing plants. Journal Applied Microbiology 91: 888-899.
Chasseignaux, E., Géfault, P., Toquin, M.T., Raqimbeau, C., Salvat, G., Colin, P. and Ermel, G. 2002. Ecology of Listeria monocytogenes in the environtment of raw poultry meat and raw pork meat processing plant. FEMS Microbiology Letters 210: 271-275.
Coillie, E., Webroouck, H., Heyndrickx, M., Herman L. and Rijpens, N. 2004. Prevalence and typing of Listeria monocytogenes in ready-to-eat food products on the Belgian market. Journal of Food Protection 67(11): 2480-2487.
Cunliffe, D., Smart, C.A., Alexander, C. and Vulfson, E.N. 1999. Bacterial adhesion at synthetic surfaces. Applied and Environmental Microbiology 65: 4995–5002.
Donlan, R.M. 2002. Biofilms: microbial life on surfaces. Emerging Infectious Diseases 8: 881–890.
Elson, R., Burgess, F., Little, C.L. and Mitchell, R.T. 2004. Microbiological examination of ready to eat cold sliced meat and pate from catering and retail premises in the UK, Journal of Applied Microbiology 96 : 499-509.
EMLab P and K. 2009. Food Microbiology Glossary– Listeria monocytogenes. download from http://www.emlab.com/s/sampling/FoodMicroGlossary.html# listeria_monocytogenes on 16th August 2009.
Farber, J. M., Sanders, G.W., Dunfield, S. and Prescott, R. 1989. The effect of various acidulants on the growth of Listeria monocytogenes. Letters in Applied Microbiology 9: 181-183.
Farber, J.M. and Peterkin, P.I. 1991. Listeria monocytogenes, a foodborne pathogen. Microbiology Review 55:
476–511.
Gallagher, D.L., Ebel, E.D. and Kause, J.R. 2003. FSIS Risk Assestment for Listeria monocytogenes in Deli Meats. FSIS.
Giovannacci, I., C. Ragimbeau, C., Queguiner, S., Salvat, G., Vendeuvre, J.L., Carlier, V. and Ermel, G. 1999. Listeria monocytogenes in pork slaughtering and cutting plants: use of RAPD, PFGE and PCRREA for tracing and molecular epidemiology. International Journal Food Microbiology 53: 127-140.
Gombas, D.E., Chen, Y., Clavero, R.S. and Scott, V.N. 2003. Survey of L. monocytogenes in ready to eat foods. Journal of Food Protection 66: 559-569
Gray, M. L. and Killinger, A.H. 1966. L. monocytogenes and listeric infections. Bacteriology Review 30: 309-382.
Hudson, J. A., Mott, J.S. and Penney, N. 1994. Growth of Listeria monocytogenes, Aeromonas hydrophilla, and Yersinia enterocolitica on vacuum and saturated carbon dioxide controlled atmosphere packaged sliced roast beef. Journal of Food Protection 57: 204-208.
Junttila, J. R., Niemelä, S.I. and Hirn. J. 1988. Minimum growth temperatures of Listeria monocytogenes and non-haemolytic listeria. Journal Applied Bacteriology 65: 321-327.
Kusumaningrum, H.D., Riboldi, G., Hazeleger, W.C. and Beumer, R.R. 2003. Survival of foodborne pathogens on stainless steel surfaces and cross contamination to foods. International Journal of Food Microbiology 85: 227-236.
Kusumaningrum, H.D., Asselt, E.D., Beumer, R.R. and Zwietering, M.H. 2004. A Quantitative Analysis of Cross-Contamintation of Salmonella and Campylobacter spp. Via Domestic Kitchen Surface. Journal of Food Protection 67 (9): 1892-1903.
Levine ,P., Rose ,B., Green ,S., Ransom ,G. and Hill, W. 2001. Pathogen testing of ready-to-eat meat and poultry products collected at federally inspected establishments in the United States 1990 to 1999. Journal of Food Protection 64: 1188–1193.
Lunden, J., Autio, T.J. and Korkeala, H.J. 2002. Transfer of persistent Listeria monocytogenes contamination between food-processing plants associated with a dicing machine. Journal of Food Protection 65: 1129-1133
Marchant, G. and Ducoffre, G. 2003. News on Outbreaks and Infectious Diseases. Download from http://www.iph.fgov.be/epidemio/epien/plaben/idnews/ID031008. pdf on 23 September 2008.

280 Titik, B. and Naiyana, C.
International Food Research Journal 17: 267-280
McLauchlin, J. 1990. Distribution of serovars of Listeria monocytogenes isolated from different categories of patients with listeriosis. European Journal of Clinical Microbiology and Infectious Diseases 9: 210–213.
Mead, P.S., Slutsker, L., Dietz, V., McCraig, L.F., Bresee, S., Shapiro, C., Griffin, P.M. and Tauxe, R.V. 1999. Food-related illness and death in the United States. Emerging Infectious Diseases 5: 607–625.
Midelet, G. and Carpentier, B. 2002. Transfer of microorganism, including L. monocytogenes from various materials to beef. Applied and Environment Microbiology 68 (8): 4015-4024.
Nesbakken, T., Kapperud, G. and Caugant, D.A. 1996. Pathways of Listeria monocytogenes contamination in the meat processing industry. International Journal of Food Microbiology 31:161–171.
Norrung, B. 2000. Microbiological criteria for Listeria monocytogenes in foods under special consideration of risk assessment aproaches. International Journal of Food Microbiology 62: 217–221.
Notermans, S., Dufrenne, J., Teunis, P. and Chackraborty, T. 1998 . Studies on the risk assessment of Listeria monocytogenes. Journal of Food Protection 61: 244–248.
Öktem, A.B., Bayram, G., Ceylan, A.E. and Yentur, G. 2006. Prevalence of L. monocytogenes in some Turkish Foodstuffs. Journal of Food Quality 29 (1): 76-86.
Salvat, G., Toquin, M.T., Michel, Y. and Colin, P. 1995. Control of Listeria monocytogenes in the delicatessen industries: lesson of the listeriosis outbreak in France. International Journal of Food Microbiology 25: 75-81.
Samelis, J., Kakouri, A., Geargiadou, K.G. and Metaxopoulos, J. 1998. Evaluation of the extent and type of bacterial contamination at different stages of processing of cooked ham. Journal of Applied Microbiology 84: 649-660.
Samelis, J. and Metaxopoulos, J. 1999. Incidence and principal sources of Listeria sp. and Listeria monocytogenes contamination in processed meats and a meat processing plant. Food Microbiology 16: 465-477.
Samelis, J., Bedie, G.K., Sofos, J.N., Belk, K.E., Scanga, J.A. and Smith, G.C. 2002. Control of Listeria monocytogenes with combined antimicrobials after postprocess contamination and extended storage of Frankfurters at 4oC in vacuum packages. Journal of Food Protection 65: 299-307.
Saulo. 2005. Ready-To-Eat Foods and Listeriosis. Food Safety and Technology FST-14 . Download from http://www.ctahr.hawaii.edu/oc/freepubs/pdf/FST-14.pdf on 15 July 2009.
Schaffner, D.W. 2003. Modelling Microbial Responses in Foods. Download from http://foodsci.rutgers.edu/schaffner/pdf%20files/Schaffner%20CRC%202003.pdf on 15 July 2009.
Sinde, E. and Carballo, J., 2000. Attachment of Salmonella spp. and Listeria monocytogenes to stainless steel, rubber and polytetrafluorethylene: the influence of free energy and the effect of commercial sanitizers. Food Microbiology 17: 439–447.
Suihko, M-L., Salo, S., Niclasen, O., Gudbjörnsdóttir, B., Torkelsson, G., Bredholt, S., Sjöberg, A.M. and Gustavsson, P. 2002. Characterization of Listeria monocytogenes isolates from the meat, poultry and seafood industries by automated ribotyping. International Journal of Food Microbiology 72: 137-146.
USDA/FDA. 2003. Quantitative Assessment of Relative Risk to Public Health from Foodborne Listeria monocytogenes Among Selected Categories of Ready-to-Eat Foods. USDA/FDA. pp: 19-21
USDA/FDA. 2003. Draft Assestment of the Relative Risk to Public Health from Foodborne L. monocytogenes Among Selected Ready-to-Eat Foods. USDA-FDA pp: 489-497
Vazquez-Boland, J.A., Kuhn, M., Berche, P., Chakraborty, T., Dominguez-Bernal, G., Goebel, W., Gonzalez-Zorn, B. and Wehland, J. 2001. Listeria pathogenesis and molecular virulence determinants. Clinical Microbiology Reviews 14: 584–640.
Vorst, K.L., Todd., E.C.D. and Ryser, E.T. 2006. Transfer of Listeria monocytogenes during mechanical slicing of turkey breast, bologna and salami. Journal of Food Protection 69 (3): 619-626.
Wong, T.L., Carey-Smith, G.V., Hollis, L. and Hudson, J.A. 2005. Microbiological survey of pre prepackaged pate and ham in New Zealand. Letter in Applied Microbiology 41: 106-111.