Quantitative Evaluation of THOR, World SID and Hybrid III under … · Abstract: The occupant...
22
Abstract: The occupant kinematics under far‐side impact is of prime interest to researchers, as there are no Federal Motor Vehicle Safety Standards for this impact scenario. Traditionally, post‐mortem human surrogates and anthropometric test devices (ATDs) are used in various impact scenarios, to understand the occupant kinematics and injury mechanisms. The advantages of using ATDs are their cost‐effectiveness, repeatability with lesser setup time compared to PMHS, and calibrated internal instrumentation. Currently available ATDs are primarily designed for frontal, near side or rear impact scenarios. This study aims to identify an ATD that exhibits the most biofidelic response, under far‐side impact scenario, due to the lack of an ATD designed for this impact mode. The finite element models of THOR, World SID and Hybrid III were used for the study. Each ATD was validated under two far‐side impact conditions using experimental data. The validated ATD FE models were used to perform match pair simulations, and the responses were compared with PMHS experimental responses, under 90 deg and 60 deg far‐side impacts. The comparisons were made based on head, T1, T12 and sacrum excursions, anatomical regional accelerations, rigid panel and seatbelt forces. The correlation between the experimental and simulation data was quantified using correlation analysis (CORA). The biofidelity of the ATDs was determined using average CORA value for all responses. The most biofidelic ATD can be used to develop counter measures for far‐side crashes. Keywords Anthropometric test device, far‐side impacts, finite element modeling. I. INTRODUCTION Automotive vehicle occupants are susceptible to higher injury severity in side impacts compared to frontal impacts [1]. Accident database analysis of 1400 cases from National Automotive Sampling System (NASS), Crash Injury Research and Engineering Network (CIREN) and Australian National Crash In‐depth Study (ANCIS) databases showed that far‐side accidents contribute 21% to the total accidents including 38% frontal, 37.2% near‐side and 3.8% rear accidents [2]. In another study, analysis of NASS/CDS accident data from 1993 to 2002 showed that far‐side accidents resulted in AIS 3+ injuries to occupants in more than 40% of the cases [3]. Despite its higher prevalence, the injury mechanics of the occupants in far‐side impacts are yet not fully understood. Efforts have been made to study occupant kinematics and injury mechanism using post mortem human surrogates (PMHS) [1], [4], human body finite element models [5] and anthropometric test devices (ATDs) [6][7]. From an economic and instrumentation stand point, ATDs prove to be plausible surrogates as compared to PMHS. Pintar et al. [1] tested the World SID and THOR‐NT ATDs in a series of configurations under far‐side impact, in 90 deg and 60 deg orientations and compared with PMHS responses. In the study, to evaluate ATD biofidelity, PMHS were subjected to multiple impacts, which might risk progressive response deterioration. The biofidelity assessments of the ATDs were performed based on a single PMHS response test. Furthermore, the study did not provide a quantitative measure for biofidelity of the ATDs, instead, peaks were compared However, to be used as surrogates for designing countermeasures under far‐side, modifications were suggested for both the ATDs. In another study, a human volunteer, Hybrid III physical ATD, Hybrid III ATD with a modified flexible spine and a 50 th percentile male TNO Facet Finite Element Model were used to inspect factors influencing occupant to seatbelt interaction in far‐side crashes [6]. The Hybrid III and volunteers were tested for a very low acceleration of 1G due to ethical reasons. Both the Hybrid III ATDs were inefficient to reproduce seatbelt retention as in the human volunteer. The validation of the TNO finite element human body model indicated limited biofidelity compared to PMHS and World SID [1]. Also, only peak shoulder belt forces were compared to validate the kinetic response, which may be influenced by seatbelt‐torso friction. As the Hybrid III and TNO human FE model did not correlate with PMHS responses, the engagement of the seatbelt might not have been realistic. In a study S agar Umale is a Post‐Doctoral Fellow ([email protected]), Mike W J Arun is an Assistant Professor, Hans Hauschild and John R. Humm are Research Engineers, Frank A. Pintar and Narayan Yoganandan are Professors, in the Department of Neurosurgery at Medical College of Wisconsin, USA. Quantitative Evaluation of THOR, World SID and Hybrid III under Far‐Side Impacts: A Finite Element Study Sagar Umale, Mike W J Arun, Hans Hauschild, John R. Humm, Frank A. Pintar, Narayan Yoganandan IRC-18-90 IRCOBI conference 2018 - 608 -
Transcript of Quantitative Evaluation of THOR, World SID and Hybrid III under … · Abstract: The occupant...

Abstract: The occupant kinematics under far‐side impact is of prime interest to researchers, as there are no Federal Motor Vehicle Safety Standards for this impact scenario. Traditionally, post‐mortem human surrogates and anthropometric test devices (ATDs) are used in various impact scenarios, to understand the occupant kinematics and injury mechanisms. The advantages of using ATDs are their cost‐effectiveness, repeatability with lesser setup time compared to PMHS, and calibrated internal instrumentation. Currently available ATDs are primarily designed for frontal, near side or rear impact scenarios. This study aims to identify an ATD that exhibits the most biofidelic response, under far‐side impact scenario, due to the lack of an ATD designed for this impact mode. The finite element models of THOR, World SID and Hybrid III were used for the study. Each ATD was validated under two far‐side impact conditions using experimental data. The validated ATD FE models were used to perform match pair simulations, and the responses were compared with PMHS experimental responses, under 90 deg and 60 deg far‐side impacts. The comparisons were made based on head, T1, T12 and sacrum excursions, anatomical regional accelerations, rigid panel and seatbelt forces. The correlation between the experimental and simulation data was quantified using correlation analysis (CORA). The biofidelity of the ATDs was determined using average CORA value for all responses. The most biofidelic ATD can be used to develop counter measures for far‐side crashes.
Keywords Anthropometric test device, far‐side impacts, finite element modeling.
I. INTRODUCTION
Automotive vehicle occupants are susceptible to higher injury severity in side impacts compared to frontal impacts [1]. Accident database analysis of 1400 cases from National Automotive Sampling System (NASS), Crash Injury Research and Engineering Network (CIREN) and Australian National Crash In‐depth Study (ANCIS) databases showed that far‐side accidents contribute 21% to the total accidents including 38% frontal, 37.2% near‐side and 3.8% rear accidents [2]. In another study, analysis of NASS/CDS accident data from 1993 to 2002 showed that far‐side accidents resulted in AIS 3+ injuries to occupants in more than 40% of the cases [3]. Despite its higher prevalence, the injury mechanics of the occupants in far‐side impacts are yet not fully understood. Efforts have been made to study occupant kinematics and injury mechanism using post mortem human surrogates (PMHS) [1], [4], human body finite element models [5] and anthropometric test devices (ATDs) [6][7]. From an economic and instrumentation stand point, ATDs prove to be plausible surrogates as compared to PMHS. Pintar et al. [1] tested the World SID and THOR‐NT ATDs in a series of configurations under far‐side impact, in 90 deg and 60 deg orientations and compared with PMHS responses. In the study, to evaluate ATD biofidelity, PMHS were subjected to multiple impacts, which might risk progressive response deterioration. The biofidelity assessments of the ATDs were performed based on a single PMHS response test. Furthermore, the study did not provide a quantitative measure for biofidelity of the ATDs, instead, peaks were compared However, to be used as surrogates for designing countermeasures under far‐side, modifications were suggested for both the ATDs.
In another study, a human volunteer, Hybrid III physical ATD, Hybrid III ATD with a modified flexible spine and a 50th percentile male TNO Facet Finite Element Model were used to inspect factors influencing occupant to seatbelt interaction in far‐side crashes [6]. The Hybrid III and volunteers were tested for a very low acceleration of 1G due to ethical reasons. Both the Hybrid III ATDs were inefficient to reproduce seatbelt retention as in the human volunteer. The validation of the TNO finite element human body model indicated limited biofidelity compared to PMHS and World SID [1]. Also, only peak shoulder belt forces were compared to validate the kinetic response, which may be influenced by seatbelt‐torso friction. As the Hybrid III and TNO human FE model did not correlate with PMHS responses, the engagement of the seatbelt might not have been realistic. In a study
Sagar Umale is a Post‐Doctoral Fellow ([email protected]), Mike W J Arun is an Assistant Professor, Hans Hauschild and John R. Humm are Research Engineers, Frank A. Pintar and Narayan Yoganandan are Professors, in the Department of Neurosurgery at Medical College of Wisconsin, USA.
Quantitative Evaluation of THOR, World SID and Hybrid III under Far‐Side Impacts: A Finite Element Study
Sagar Umale, Mike W J Arun, Hans Hauschild, John R. Humm, Frank A. Pintar, Narayan Yoganandan
IRC-18-90 IRCOBI conference 2018
- 608 -

[8] to evaluate a suitable ATD in far‐side impacts, full vehicle and MDB crash and sled tests were performed using BioSid, EuroSid and World SID prototype under ECE test procedure at a speed of 65km/h. The study lacked a quantitative comparison of the ATD and PMHS responses. However, for World SID and Bio SID ATDs, changes in lumbar spine were suggested to improve biofidelity under far‐side impacts. The WORLD SID biofidelity assessment documentation [9] also suggests that WORLD SID is suitable for near side impacts as compared to Bio SID, Euro SID 1, Euro SID 2 and USDOT‐SID.
The Hybrid III ATD is also commonly used as a pedestrian, in military and medical applications, and sport equipment design[10][11]. Considering the wide range of applications and high frequency of usage, the Hybrid III ATD was used for this study. Test device for Human Occupant Restraint (THOR) is another relatively recent ATD, and both the physical THOR ATD and THOR ATD FE model are considered to be more biofidelic as compared to other ATDs due to the flexible spine and realistic shoulder construction [12][13]. Worldwide harmonized Side Impact Dummy (World SID) is considered to be most biofidelic among the side impact ATDs in near‐side impact scenarios[9]. Thus, this study aims to quantify the most biofidelic ATD under far‐side impact scenario, out of these most commonly used and most biofidelic ATDs in different impact scenarios.
Till date, there are no ATDs specifically designed to be biofidelic in far‐side impact scenario. Thus, the current study aims a quantitative biofidelity evaluation of the three ATDs: Hybrid III, THOR and World SID, in this impact scenario, using finite element modeling. The ATD FE models were first validated with the responses of respective physical ATDs, to access the suitability of the FE models as a surrogate to the physical ATDs. Then the responses of the ATD models were compared to the PMHS responses using matched pair simulations to determine the most biofidelic ATD under far‐side. The biofidelity of the FE ATDs was quantified using correlation and analysis (CORA), and the most biofidelic ATD was determine using average correlation. Responses from the most biofidelic ATD can be used to develop counter measures for far‐side crashes.
II. METHODS
The finite element models of THOR V1.4 (Humanetics Innovative solutions, Plymouth, Michigan, USA), World SID V0.5 ALPHA and Hybrid III Version: LSTC.NCAC_130528_BETA (Livermore Software Technology Corporation, Livermore, California USA) were used for the study. The methodology of the study consisted of, validation of each ATD under far‐side impact, and then comparing the response of each ATD with the PMHS response. The ATD models were validated using far‐side sled experiments for respective physical ATDs, to access the usability of the models as a surrogate to physical models. The tests reported by Pintar et al. [1] were used to validate the THOR and WORLD SID FE ATDs. Far‐side sled experiments were carried out in‐house to validate the Hybrid III FE ATD.
The validated ATD FE models were simulated under similar conditions as of the PMHS reported by Pintar et al. [1], and the responses were compared. The methods are presented below for validation of ATDs (experimentation and simulation) and the comparison of ATD responses with PMHS responses.
Validation of ATDs:
Experiments for validation of THOR & WSID: The sled experiments for THOR and World SID by Pintar et al. [1] were used for validation of the ATD models. The rigid buck sled setup shown in Fig 1, was used to simulate the response of ATDs under pure lateral (90 deg) and oblique (60 deg) impact orientation. A far‐side buck was mounted on the sled and the buck assembly included a standard configuration ‐ center console and a three‐point seat belt restraint system. The center console was composed of a vertical pelvis plate, vertical leg plate, and a horizontal console plate. The pelvis and leg plates were designed to engage the respective anatomical regions of the ATD. The ATDs were seated in the rigid sled in the driving posture with arms loosely placed on a rigid bar in the same way as described in Pintar et al. [1]. A low elongation webbing seatbelt was used to restrain the ATD occupants. A dynamic pretensioner and retractor mechanism was not used for the tests, however, to reproduce the effect of a pretensioner the ATDs were tightened manually by pulling the shoulder seatbelt 10 cm prior to the tests. The same buck was used in both the lateral, and oblique impact scenarios by changing the orientation of the entire buck assembly. Data were collected at 20.0 kHz as per SAEJ211. A VICON motion tracking system (1000 fps) was used to quantify the 3D kinematics of the ATD head using retro‐reflective markers. The tests were repeated two to three times for both impact scenarios.
IRC-18-90 IRCOBI conference 2018
- 609 -

Fig 1. Experimental setup (THOR & WSID) Fig 2. Pre‐test experimental setup (Hybrid III)
Experiments for Validation of Hybrid III: The experimental setup used to perform Hybrid III sled tests consisted of a rigid seat, B pillar, modular simulated door, center console, front dash secured to the sled carriage as shown in Fig 2. The tests were carried out in oblique orientations (45 deg) with two positions of the far‐side modular door. The modular door was comprised of four vertical panels, mounted with load cells. The load cells were connected to 1‐inch aluminum plates lined with Ethafoam 220, to secure the ATD instrumentation from a rigid impact. The 50th percentile Hybrid III ATD was seated on a rigid seat as a far‐side occupant, with hands loosely placed on a rigid bar. A three‐point seatbelt for a 2007 Toyota Yaris vehicle with a pretensioner and load limiter was used to restrain the ATD, and load cells were attached at the shoulder and lap portions of the webbing. The seatbelt system pretensioner fired at 10 ms. The modular simulated door was placed 425mm and 820 mm away from occupant seat center, for the two cases. In the case with modular door 425mm away the center console was removed from the setup, whereas in the case with modular door 820mm away the center console was maintained with loadcells to measure pelvis load. The experimental setup and the distance of the modular door mimicked constraints in a vehicle model. Impact direction was input from the ATD’s right side. Data were collected at 20.0 kHz as per SAEJ211. Both the cases were repeated twice for repeatability. A VICON motion tracking system (1000 fps) was used to quantify the 3D kinematics of the ATD head, thorax and pelvis using retro‐reflective markers. The test results were used to validate the finite element model of the Hybrid III ATD.
Simulation setup for validation of THOR & WSID: The finite element simulation setup was developed similar to experiments with rigid seat, B‐pillar, rigid panels etc., using various element types, and appropriate materials. The simulation setups for THOR and WORLD SID ATDs are shown in Fig 3 and Fig 4 respectively. The sled platform and components were not explicitly modeled in the simulation, and, the constraints associated with the sled system were mathematically implemented using constraints. The rigid seat was constructed using shell elements and assigned steel material properties. Rigid shell elements were used to construct buckles and B‐pillar that were used to anchor the seatbelt. A generic low‐elongation three‐point seatbelt system was used to restrain the occupant. To simulate the tightening a simulation was performed to pull the seatbelt 10 cm in the negative x‐direction for both the ATDs. The deformed model was exported, and the free‐end of the seatbelt was attached to the B‐pillar using tie constraint. Each load plate was constructed using two parts – a rigid plate, and paper honeycomb. The plates on the load walls were made using shell elements and the paper honeycombs were constructed using solid elements. The honeycomb elements were assigned material properties corresponding to 208 kPa paper honeycomb. The thickness of the paper honeycomb was assigned 25 mm as observed in the experiments. Separate surface‐to‐surface contact interaction definitions were assigned between load plates and ATD body regions. The entire buck model was given an initial velocity of 8.3 m/s using *INITIAL_VELOCITY keyword. The deceleration pulse (Fig 5) from the experiments were directly applied to the seat using the *BOUNDARY_PRESCRIBED_MOTION LS‐DYNA keyword. Two orientations, lateral and oblique were simulated as in the experiments. Responses such as regional accelerations and forces from leg and pelvis plates were compared using correlation and analyses (CORA), to quantify the goodness‐of‐fit between simulation and experimental responses.
IRC-18-90 IRCOBI conference 2018
- 610 -

Fig 3. Simulation setup (THOR) Fig 4. Simulation setup (WSID) Fig 5. Acceleration pulse used in the lateral
and oblique impacts
Simulation setup for validation of Hybrid III: Similar to THOR and WSID, the finite element simulation setup for Hybrid III was developed using various element types, appropriate materials and constraints (Fig 6). A generic low‐elongation three‐point seatbelt with pretensioner and retractor was used to restrain the Hybrid III occupant. The pretensioner and retractor limiting loads were set as 1.25kN and 3.5kN. The front dash and center console was developed with rigid shell elements and were covered with solid honey comb padding. The modular door was modeled as in experiments with four panels connected to a rigid modular structure. The panels were mounted with load cells, and half inch‐thick aluminum plate which was covered with solid Ethafoam 220 material elements. The modular door was moved 425mm and 820mm away from the center of the driver seat for the two cases. The entire buck model was given a deceleration pulse shown in Fig 7, using the *BOUNDARY_PRESCRIBED_MOTION LS‐DYNA keyword. Responses such as head accelerations and forces from side wall or pelvis plates and seatbelt retractor forces were compared using correlation and analyses (CORA).
Fig 6. Simulation setup (Hybrid III) Fig 7. Acceleration pulse used in the head and abdomen
injury cases
Comparison of ATD Responses with PMHS:
Experiments: The three validated ATDs were simulated under similar boundary conditions as the PMHS experiments [1]. In the study, five PMHS were tested under far‐side (three lateral, and two oblique loading) using a sled system (Age: 79±7 years; height: 1.8±0.1 m; weight: 75±7 kg). The buck assembly was the same as that of the THOR and WSID explained before (Fig 1), which was mounted on the sled and the buck assembly included a standard configuration ‐ center console and a three‐point belt system. The center console was composed of a pelvis, leg, console plates, instrumented with tri‐axial load cells. The PMHS were restrained using a standard three‐point seatbelt system, without pre‐tensioner and retractor. The arms of the PMHS were placed on a rigid bar and loosely taped using a paper masking tape to maintain the driving posture. However, prior to the experiments, the PMHS were tightened until a belt pull length of 10 cm was achieved, to simulate a pre‐tensioner. A VICON motion tracking system (1000 fps) was used to quantify the 3D kinematics of the PMHS using retro‐reflective markers. The markers were screwed into the bones at the head, T1, T12, and pelvis. The
IRC-18-90 IRCOBI conference 2018
- 611 -

PMHS were instrumented with tri‐axial accelerometers at T1 and T12. The head CG accelerations were derived using a pyramid nine accelerometer package (PNAP)[14][15]. The same buck was used in both the lateral, and oblique impact scenarios by changing the orientation of the entire buck assembly. The experimental data were normalized using equal the stress equal velocity method to represent a 50th percentile male [16].
FE Simulations: The finite element simulation setup was developed for World SID and THOR ATD validation was used. The experimental setup for PMHS and simulation setup for THOR, World SID and Hybrid III ATDs are shown in Fig 8. The sled platform and component constraints were mathematically implemented. The rigid seat, backrest, and seatbelt buckles were constructed using rigid shell elements. A generic low‐elongation three‐point seatbelt system was used to restrain the ATD occupant. To simulate the tightening as in PMHS experiments a simulation was performed for each ATD, to pull the seatbelt 10 cm in the negative x‐direction using a predefined displacement. The deformed model was exported, and the free‐end of the seatbelt was attached to the B‐pillar using tie constraint. Each load plate was constructed using two parts – a rigid plate, and paper honeycomb as mentioned previously. Separate surface‐to‐surface contact interaction definitions were assigned between load plates and ATD body regions.
The ATD models were placed very close to the top of the seat and were settled on the seat using the acceleration due to gravity. The contact force between ATDs and the seat model was monitored to confirm the absence of transience. The deformed geometry was then exported for restraint attachment. To incorporate pre‐tensioning, the seatbelt was pulled 10 cm in the negative x‐direction using a predefined displacement. The deformed ATD models were exported and the free‐end of the seatbelt was attached to the B‐pillar using tie constraint. The friction between the seatbelt and the ATDs for every simulation was considered as 0.4 [17].
The entire buck model was given an initial velocity using *INITIAL_VELOCITY keyword and the deceleration pulse from the experiments was applied to the seat using the *BOUNDARY_PRESCRIBED_MOTION LS‐DYNA keyword. Two orientations, lateral and oblique were simulated as in the experiments. Responses such as regional accelerations and forces from leg and pelvis plates were compared using correlation and analyses (CORA), to quantify the goodness‐of‐fit between simulation and experimental responses.
PMHS THOR World SID Hybrid III
Fig 8. The simulations setup of ATDs developed as PMHS experiments
III. RESULTS
The results for validation of each ATD and the comparison of responses of the ATDs with PMHS are presented below:
Results for Validation of ATDs:
THOR: Each THOR validation simulation took approximately five hours to solve on a high‐performance computing cluster. The head excursion, regional accelerations, seatbelt forces and rigid panel forces were obtained and compared with the physical ATD experimental data. The head excursion with respect to the rigid seat is shown in Fig 9(a) and Fig 9(b) for the lateral and oblique impacts. The Y displacement signifies excursion
IRC-18-90 IRCOBI conference 2018
- 612 -

in lateral direction, whereas, Z displacement signifies excursion in axial direction. The grey curves are for the physical ATD from experiments and the green curves are for the FE model of the ATD. The head excursion for the THOR FE model was comparatively less in lateral as well as axial direction than the physical ATD in both the impact scenarios. This might be due to slight difference in the lesser seatbelt tightening, or difference in seatbelt friction due to the cloth material, for the physical ATD. However, the excursion pattern of the ATD FE model was in line with the physical.
Fig 9(a). Head Excursion (90 deg ‐lateral)
Fig 9(b). Head Excursion (60 deg ‐ oblique)
Fig 9(c). Average CORA
The comparison of resultant head, T1, T12 and sacrum accelerations between physical and FE THOR ATD model is shown in Appendix 1 (a) and Appendix 1 (b) for the lateral and oblique impacts, respectively. The head acceleration for the ATD FE Model was comparable to the physical ATD in 90 deg impact scenario however, for oblique impact, the head acceleration was on the lower side for the FE model. The second peak in the head acceleration for 90 deg impact was higher and resulted as the head impacted the shoulder. Correlation and analyses (CORA) was used to quantify the goodness‐of‐fit between the physical and FE ATD model responses. CORA values measured for head acceleration were 0.88 and 0.81, for lateral and oblique impact scenarios respectively. Similarly, the CORA values for T1, T12 and sacrum acceleration were measured as 0.68,0.69,0.69 and 0.74,0.76,0.80 for lateral and oblique impacts respectively. The forces measured from seatbelt (shoulder and lap belt), leg, pelvis and console load panels are also shown in Appendix 1 (a) and Appendix 1 (b) for lateral and oblique impacts respectively. The force measurements for the physical ATD and the ATD FE model indicated good correlation. The CORA values for the shoulder belt, lap belt, leg, pelvis and console panel forces were measured as 0.76, 0.83, 0.70, 0.66, 0.53 and 0.74, 0.59, 0.62, 0.67, 0.75 for lateral and oblique impacts respectively. The average CORA for the two orientations (90 deg and 60 deg) was calculated as 0.71 and 0.72 respectively and is plotted in Fig 9(c).
World SID: Each WSID validation simulation took approximately three hours to solve on a high‐performance computing cluster. The head excursion with respect to the rigid seat is shown in Fig 10 (a) and Fig 10 (b) for the lateral and oblique impacts. The Y displacement signifies excursion in lateral direction, whereas, Z displacement signifies excursion in the axial direction. The grey curves show the response of the physical ATD from experiments and the pink curves are for the ATD FE model. The lateral head excursion for the World SID FE model was lower for 90 deg impact scenario, whereas it was slightly higher for the 60 deg impact scenario as compared to the physical ATD. The axial excursion of the ATD FE model was comparable for both 90 deg and 60 deg impact scenarios.
Fig 10(a). Head Excursion (90 deg ‐ lateral)
Fig 10 (b). Head Excursion (60 deg ‐ oblique)
Fig 10 (c). Average CORA
IRC-18-90 IRCOBI conference 2018
- 613 -

The comparison of resultant head, T1, T12 and sacrum accelerations between physical and FE World SID ATD is shown in Appendix 2 (a) and Appendix 2 (b) for the lateral and oblique impacts, respectively. The head acceleration for lateral impact was comparable to the physical ATD and, for oblique impact head acceleration was within the experimental corridor. The CORA values measured for head acceleration were 0.87 and 0.83 for lateral and oblique orientation cases respectively. Similarly, the CORA values for T1, T12 and sacrum acceleration were measured as 0.61, 0.60 ,0.5 and 0.61, 0.56 ,0.5 for lateral and oblique impacts respectively. The forces measured from seatbelt (shoulder and lap belt), leg, pelvis and console load panels are also shown in Appendix 2 (a) and Appendix 2 (b) for lateral and oblique impacts respectively. The CORA values for the shoulder belt, lap belt, leg, pelvis and console panel forces were measured as 0.92, 0.76, 0.82, 0.70, 0.42 and 0.82, 0.82, 0.66 0.70, 0.64 for lateral and oblique impacts respectively. The average CORA for the two orientations (90 deg and 60 deg) was calculated as 0.69 and 0.68 respectively and is plotted in Fig 10(c).
Hybrid III: Each simulation for Hybrid III validation took approximately six hours to solve on a high‐performance computing cluster. The excursion of the head CG, T1, T6, and sacrum with respect to the seat is shown in Fig 11(a) and Fig 11(b) for the two modular door (MD) position cases: 425mm and 820mm from center of the driver seat respectively. The grey curves show the response of the physical ATD and the blue curves show the response of the ATD FE model. The Y displacement signifies excursion in lateral direction, whereas, X displacement signifies excursion in the frontal direction. For the door 425mm away case, the head and sacrum excursions of the ATD FE model were comparable to physical ATD response, whereas the T1 and T6 excursion were less in the lateral direction. For the door 820mm away case, the FE ATD model showed less frontal excursion, whereas the lateral excursion was comparable to the physical ATD.
The comparison of head accelerations, seatbelt forces and reaction forces with the modular door / pelvis plate between physical and FE Hybrid III ATD are shown in Appendix 3 (a) and Appendix 3 (b) for the two cases. The head acceleration from simulations for the first case was comparable to experiments, whereas the head acceleration for the second case was a bit delayed and oscillating. The CORA values measured for head acceleration for the two cases were 0.75 and 0.57 respectively. Similarly, the CORA values for retractor force and modular wall / pelvis plate were measured as 0.81, 0.76 and 0.76, 0.75 for the two cases respectively. The average CORA for the two modular door positions cases was calculated as 0.77 and 0.69 respectively and is plotted in Fig 11(c).
Fig 11(a). Head Excursion (MD 425mm away)
Fig 11(b). Head Excursion (MD 820mm away)
Fig 11(c). Average CORA
Results for ATD comparison with PMHS: Each simulation took approximately three to six hours to solve on a high‐performance computing cluster as
per the ATD. The visual representation of the comparison of the kinematics of the three ATDs with PMHS is show in Fig 12(a). The THOR ATD was observed to best reproduce the kinematics of the PMHS. The head, T1, T12 and sacrum excursions of the three ATDs with respect to the rigid seat are compared with PMHS excursions in Fig 12(b) and Fig 12(c) for the lateral and oblique impacts. The Y displacement signifies excursion in lateral direction, whereas, Z displacement signifies excursion in the axial direction. The grey curves are for the PMHS tests from experiments and the green, pink and blue curves are for the THOR, World SID and Hybrid III ATD FE models, respectively. The head lateral excursions for the THOR and World SID FE models were comparable with the PMHS, for both 90 deg and 60 deg impact scenarios. The excursion at T1 vertebra was comparable to the PMHS for 90 deg impact scenario, whereas was less for 60 deg impact scenarios, for all ATDs. Hybrid III showed less head and T1 excursions for both 90 deg and 60 deg impact scenarios. The PMHS T1 excursion showed
IRC-18-90 IRCOBI conference 2018
- 614 -

higher variation, which could be a result of anthropometric differences or age‐related posture differences. The T12 and sacrum excursions for all three ATDs were comparable to the PMHS for both impact scenarios.
Fig 12(a). Kinematics of PMHS, THOR, World SID, and Hybrid III (left to right) at 100 ms.
Fig 12(b). Head, T1, T12, Sacrum excursion (90 deg ‐ lateral)
Fig 12(c). Head, T1, T12, Sacrum excursion (60 deg ‐ oblique)
The resultant Head, T1 and T12 accelerations of the ATD FE models is compared to the PMHS in Fig 13(a) and Fig 13(b) for the lateral and oblique impacts, respectively. The grey region represents the PMHS corridors, whereas, the green, pink and blue curve represent respective ATD FE model responses. The head accelerations for Hybrid III and World SID were comparable to the PMHS for the 90 deg impact scenario, whereas the THOR head acceleration was greater. The head accelerations for THOR and World SID showed good correlation for 60 deg impact scenario, whereas for the Hybrid III the head acceleration was lower. Similarly, good correlation was observed for T1 and T12 accelerations for all three ATDs and with the PMHS. The CORA values for head, T1 and T12 accelerations were 0.67, 0.65 and 0.73 for THOR, 0.81, 0.64 and 0.72 for World SID and 0.85, 0.63 and 0.62 for Hybrid III for the 90 deg impact scenario. Whereas, the CORA values for head, T1 and T12 accelerations were 0.81, 0.66 and 0.74 for THOR, 0.82, 0.66 and 0.71 for World SID and 0.56, 0.54 and 0.54 for Hybrid III for the 60 deg impact scenario.
IRC-18-90 IRCOBI conference 2018
- 615 -

Fig 13(a). Head, T1, T12 acceleration (90 deg – lateral)
Fig 13(b). Head, T1, T12acceleration (60 deg ‐ oblique)
The forces measured from the seatbelt (shoulder and lap belt), leg, pelvis and console load panels for all the ATDs are compared with PMHS in Fig 14(a) and Fig 14(b) for lateral and oblique impacts respectively. The lack of enclosure for the Hybrid III ATD caused the seatbelt to get stuck in the shoulder cavity resulting in higher seatbelt forces. The human like contours, rubber and foam paddings in the THOR shoulder created a human like response, and the seatbelt engaged adequately with the ATD in both the impact scenarios. Whereas, the shape of continuous shoulder of the World SID and only the upper arm resulted in gradual slipping of the seatbelt resulting in lower seatbelt forces. The CORA values for the shoulder belt, lap belt, leg, pelvis and console panel forces were measured as 0.60, 0.52, 0.55, 0.56 and 0.48 for THOR, 0.70, 0.48, 0.60, 0.62 and 0.58 for World SID, and 0.63, 0.26, 0.52, 0.55 and 0.47 for Hybrid III, for the 90 deg impact scenario. Whereas, the CORA values for the shoulder belt, lap belt, leg, pelvis and console panel forces were measured as 0.78, 0.64, 0.57, 0.73 and 0.56 for THOR, 0.72, 0.67, 0.57, 0.67 and 0.58 for World SID, and 0.68, 0.49, 0.61, 0.65 and 0.54 for Hybrid III, for the 60 deg impact scenario.
IRC-18-90 IRCOBI conference 2018
- 616 -

Fig 14(a). Shoulder belt, Lap belt, Leg, Pelvis, Console Panel Forces (90 deg – lateral)
Fig 14(b). Shoulder belt, Lap belt, Leg, Pelvis, Console Panel Forces (60 deg ‐ oblique)
IRC-18-90 IRCOBI conference 2018
- 617 -
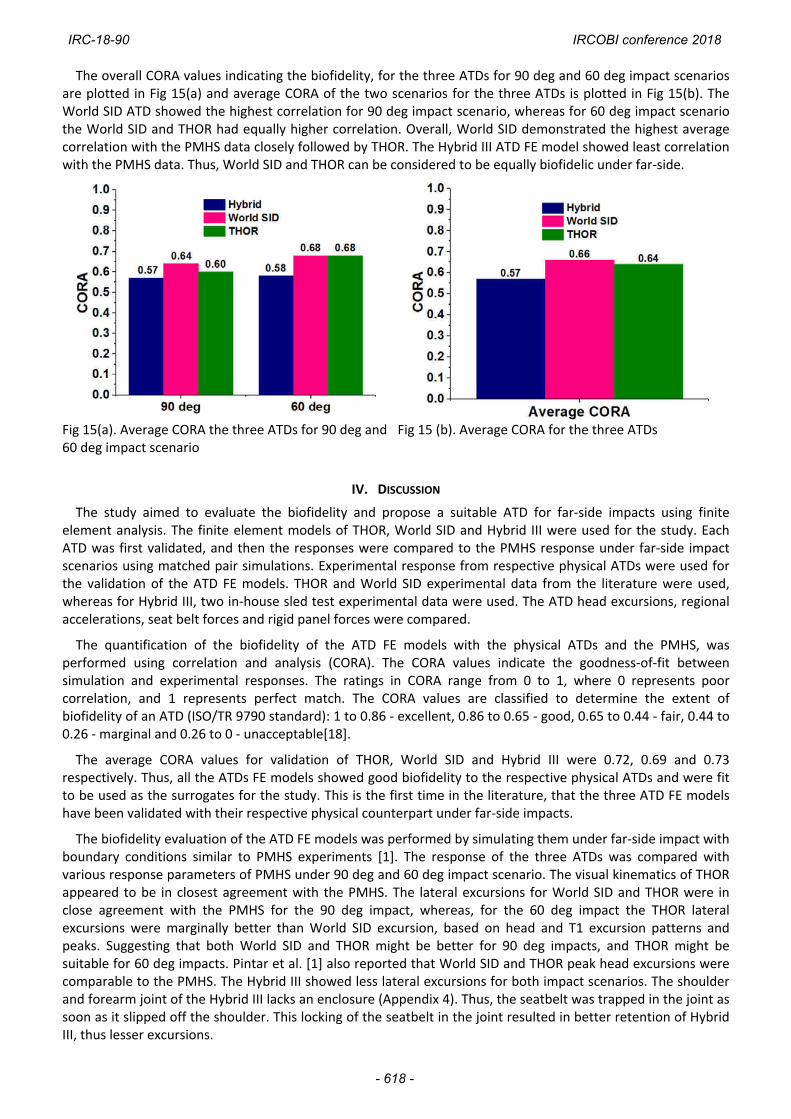
The overall CORA values indicating the biofidelity, for the three ATDs for 90 deg and 60 deg impact scenarios are plotted in Fig 15(a) and average CORA of the two scenarios for the three ATDs is plotted in Fig 15(b). The World SID ATD showed the highest correlation for 90 deg impact scenario, whereas for 60 deg impact scenario the World SID and THOR had equally higher correlation. Overall, World SID demonstrated the highest average correlation with the PMHS data closely followed by THOR. The Hybrid III ATD FE model showed least correlation with the PMHS data. Thus, World SID and THOR can be considered to be equally biofidelic under far‐side.
Fig 15(a). Average CORA the three ATDs for 90 deg and 60 deg impact scenario
Fig 15 (b). Average CORA for the three ATDs
IV. DISCUSSION
The study aimed to evaluate the biofidelity and propose a suitable ATD for far‐side impacts using finite element analysis. The finite element models of THOR, World SID and Hybrid III were used for the study. Each ATD was first validated, and then the responses were compared to the PMHS response under far‐side impact scenarios using matched pair simulations. Experimental response from respective physical ATDs were used for the validation of the ATD FE models. THOR and World SID experimental data from the literature were used, whereas for Hybrid III, two in‐house sled test experimental data were used. The ATD head excursions, regional accelerations, seat belt forces and rigid panel forces were compared.
The quantification of the biofidelity of the ATD FE models with the physical ATDs and the PMHS, was performed using correlation and analysis (CORA). The CORA values indicate the goodness‐of‐fit between simulation and experimental responses. The ratings in CORA range from 0 to 1, where 0 represents poor correlation, and 1 represents perfect match. The CORA values are classified to determine the extent of biofidelity of an ATD (ISO/TR 9790 standard): 1 to 0.86 ‐ excellent, 0.86 to 0.65 ‐ good, 0.65 to 0.44 ‐ fair, 0.44 to 0.26 ‐ marginal and 0.26 to 0 ‐ unacceptable[18].
The average CORA values for validation of THOR, World SID and Hybrid III were 0.72, 0.69 and 0.73 respectively. Thus, all the ATDs FE models showed good biofidelity to the respective physical ATDs and were fit to be used as the surrogates for the study. This is the first time in the literature, that the three ATD FE models have been validated with their respective physical counterpart under far‐side impacts.
The biofidelity evaluation of the ATD FE models was performed by simulating them under far‐side impact with boundary conditions similar to PMHS experiments [1]. The response of the three ATDs was compared with various response parameters of PMHS under 90 deg and 60 deg impact scenario. The visual kinematics of THOR appeared to be in closest agreement with the PMHS. The lateral excursions for World SID and THOR were in close agreement with the PMHS for the 90 deg impact, whereas, for the 60 deg impact the THOR lateral excursions were marginally better than World SID excursion, based on head and T1 excursion patterns and peaks. Suggesting that both World SID and THOR might be better for 90 deg impacts, and THOR might be suitable for 60 deg impacts. Pintar et al. [1] also reported that World SID and THOR peak head excursions were comparable to the PMHS. The Hybrid III showed less lateral excursions for both impact scenarios. The shoulder and forearm joint of the Hybrid III lacks an enclosure (Appendix 4). Thus, the seatbelt was trapped in the joint as soon as it slipped off the shoulder. This locking of the seatbelt in the joint resulted in better retention of Hybrid III, thus lesser excursions.
IRC-18-90 IRCOBI conference 2018
- 618 -

The regional accelerations for the three ATDs were compared with the PMHS for the two impact scenarios. The head acceleration of THOR for 90 deg impact was higher between 100 ms and 150 ms, as the head impacted the shoulder. The head acceleration for Hybrid III was low for 60 deg impact, which can be attributed to the lesser excursion and stiffer neck of the Hybrid III[11][18][19][21]. The Hybrid III neck is constructed with steel plates and butyl rubber, with a steel cable running through the center. The construction restricts large rotations of the neck [20]. Whereas, The THOR‐50M neck assembly is made from a series of aluminum disks and elliptically shaped rubber pucks which are molded together using an epoxy resin system, to provide the desired frontal and lateral bending responses for the neck assembly [22]. The World SID neck is a molded rubber with interface plates at the top and bottom, attached with fore‐aft and lateral buffers. This assembly of neck rubber and buffers provide realistic directional stiffness to neck in lateral direction [23]. In the 60 deg impact the head swings over the right shoulder of the occupant. However, the restricted rotational motion in the Hybrid III ATD, might have resulted in less head and T1 accelerations, combined with locking of the seatbelt in the shoulder joint, for the 60 deg impacts. Head accelerations for World SID were comparable for both impact scenarios. T1 acceleration for 90 deg impacts and T12 acceleration for both 90 deg and 60 deg impacts agreed with the PMHS for all three ATDs.
The force comparison shows that, Hybrid III ATD forces were out of phase and marginally on the higher side. The lap‐belt forces showed an increasing trend for the Hybrid III in both the impact scenarios after 150 ms. The locking of seatbelt in the shoulder joint caused rotation about the left shoulder away from the side panels. This resulted in seatbelt stretch at the slipring, and thus higher lap belt forces for the Hybrid III ATD. Whereas, for 60‐deg impact the shoulder belt force peaked earlier for the Hybrid III ATD, which could be a result of a stiff thorax[24]. The seatbelt forces for World SID were on the lower side as compared to the PMHS for both impact scenarios. The seatbelt slipped out of the World SID shoulder, and the upper arm only construction was inefficient to restrict the slipping, resulting in lower seatbelt forces. The world SID ATD is constructed only with upper arms, instead of the complete limb. The complete limb construction helps for better retention, as the fore arm swings to the principal direction of impact as observed for THOR in Fig 12 (a). The difference in seatbelt forces can also be due to the difference in tightening of the seatbelt in the physical tests. The level of pretensioning alters the kinematics of the occupants to a considerable extent [17]. The shoulder joint of THOR includes realistic connections and articulation between clavicle, shoulder yoke, encapsulated in a shoulder support and is lined with multiple layers of foam and rubber (Appendix 5). This human like shoulder of THOR [25] engaged with the seatbelt throughout the event, resulting in good correlation with the PMHS.
The rigid panel forces were influenced by the overall kinematics of the ATDs and the interaction with the seatbelt. The leg panel forces showed a mixed trend for all the three ATDs, whereas pelvis panel forces were higher for Hybrid III and lower for World SID. The rotation of Hybrid III about the left shoulder due to locking of seatbelt in the shoulder joint might have resulted in a sharp impact with the pelvis plate, thus higher pelvis force. Whereas, gradual slipping of the World SID from the seatbelt might have resulted in lesser force (Appendix 6). The console forces were high for World SID for 90 deg impact scenario, which was due to leaning over the console panel after slipping from the restraint system. Whereas right hand impacting on the console panel in 60 deg impact scenario might have resulted in higher forces for Hybrid III.
Based on the CORA values, for the 90 deg impact scenario the force response of World SID ATD showed good correlation to the PMHS, and for the 60 deg impact scenario, force responses for both World SID and THOR showed good correlation to the PMHS. Contrary to excursion comparison, the overall CORA values suggest that WORLD SID is most biofidelic for 90 deg impact scenario with the highest CORA of 0.64, whereas for 60 deg impact scenario both World SID and THOR were equally biofidelic with the same CORA scores of 0.68. The average CORA of the two impact scenarios suggests that, both World SID and THOR were almost equally biofidelic under the far‐side impact scenario with the CORA scores of 0.66 and 0.64. Considering the CORA classification for biofidelity, World SID and THOR showed good biofidelity, whereas Hybrid III showed average biofidelity. Based on the overall response comparison Pintar et al. [1] concluded that World SID performed better in 90 deg impact scenario and THOR‐NT performed better in the 60 deg impact scenario, which is in line with the observations of the current study.
In the literature, none of the available ATD FE models were evaluated under far‐side impact scenarios to the best of our knowledge. A few studies have tried to evaluate the physical ATDs under far‐side. Fildes et al. [8] studied suitability of side impact dummies in far‐side. The World SID ATD was observed to offer improved performance over other ATDs due to the thorax and abdomen construction. In the current study as well, World
IRC-18-90 IRCOBI conference 2018
- 619 -

SID reproduced better thorax accelerations as compared to the other ATDs. World SID biofidelity is often compared to other side impact ATDs, under nearside/oblique impact scenarios [26]–[30]. Sutterfileld et al. [28] evaluated and compared biofidelity of the EuroSID‐2 ATD with World SID and reported that the biofidelity of EuroSID‐2 ATD was considerably lower than that of World SID ATD. The abdominal loads for EuroSID‐2 were well below the injury reference value, whereas the World SID loads were realistic and above the injury reference values. In a similar study, the Euros SID‐2 and World SID ATDs were compared using PMHS sled impacts and, two accident reconstruction cases [29]. Based on overall excursions, thoracic and abdominal rib deflections, the World SID was reported to be more biofidelic compared to the EuroSID‐2. In the current study, World SID showed most comparable response to PMHS under the two far‐side impact scenarios as compared to other ATDs.
In the literature, Hybrid III and THOR physical ATDs were compared with the PMHS under frontal impact scenario [25], [31]. Vezin et al.[25] compared Hybrid III and Thor‐α ATDs responses, with PMHS at 50km/h and 30km/h using frontal sled tests. The comparisons were based on seatbelt forces and regional body accelerations. Though, the responses of both the ATDs were not identical to the PMHS, it was concluded that, in majority, the Thor‐α ATD had more similar responses to the PMHS than the Hybrid III. The human like behavior of the chest and the thoracic spine of Thor‐α ATD was attributed to the flexible joints in the thoracic spine. Whereas, due to the rigid construction, Hybrid III did not mimic the flexibility of a human thoracic spine. Better shoulder design of THOR‐α ATD also exhibited better seatbelt force correlation to the PMHS as compared to Hybrid III. Similar observations were reported for chest deflection, from the comparison of THOR and Hybrid III with PMHS in frontal impact at 40km/h [31]. The THOR ATD shoulder exhibited PMHS like sensitivity to seatbelt position, thus a better response. Whereas, the Hybrid III motion was limited by the stiff shoulder, limiting the range of motion and the chest deflection. In the current study as well, the human like shoulder and flexible thoracic spine construction of THOR ATD resulted in excursions comparable to PMHS, better seatbelt engagement and a good biofidelity correlation.
Thus, World SID, THOR and Hybrid III ATD FE models were used in this study to evaluate the biofidelity of the ATDs under far‐side impacts. The ATD FE model demonstrated good biofidelity with respective physical ATDs and were used as surrogates for their physical counterpart. The responses of the three ATDs were compared with PMHS under 90 deg and 60 deg far‐side impact scenarios. World SID was able to reproduce a biofidelic response in 90 deg impact scenarios whereas, both World SID and THOR reproduced biofidelic responses under 60 deg impact scenario. Both the ATDs will be suitable for development of countermeasures under far‐side impact scenarios.
V. CONCLUSIONS
The three most commonly used ATDs were used to evaluate their suitability under a far‐side impact scenario. The THOR, World SID and Hybrid III ATD models were validated using experimental response of the physical ATDs. The CORA values for each ATD showed good correlation between the physical ATD and the ATD FE model. The ATD FE model responses were further compared to PMHS by performing matched pair simulations. The World SID and THOR ATD showed more biofidelic responses as compared to the Hybrid III. Thus, for far‐side accident reconstructions and development of counter measures, it is advisable to use World SID and/or THOR over other ATDs.
VI. ACKNOWLEDGEMENT
The study was supported by the US Department of Transportation DTNH22‐13‐D‐00290L. This material is the result of work supported with resources and the use of facilities at the Zablocki VA Medical Center, Milwaukee, Wisconsin and the Medical College of Wisconsin in the USA. The authors would also like to thank Argonne National Laboratory for providing cluster resources. Any views expressed in this article are those of the authors and not necessarily representative of the funding organizations.
IRC-18-90 IRCOBI conference 2018
- 620 -

VII. REFERENCES
[1] Pintar F A, Yoganandan N, Stemper B D, Bostrom O, Rouhana S W, Digges K H, and Fildes B N. “Comparison
of PMHS, WorldSID, and THOR‐NT Responses in Simulated Far Side Impact.” Stapp Car Crash Journal, 2007,
51, 313–60.
[2] Yoganandan N, Fitzharris M, Pintar F A, Stemper B D, Rinaldi J, Maiman D J, and Fildes B N. “Demographics,
Velocity Distributions, and Impact Type as Predictors of AIS 4 + Head Injuries in Motor Vehicle Crashes.”
Association for the Advancement of Automotive Medicine 2011, 55, 267–80.
[3] Gabler H C, Digges K, Fildes B N, and Sparke L. “Side Impact Injury Risk for Belted Far Side Passenger Vehicle
Occupants.” SAE Technical Paper 2005‐1–2.
[4] Forman J L, Lopez‐valdes F, Lessley D J, Riley P, Sochor M, Ash J, Perz R, Kent RW, Seacrist T, Arbogast KB,
Tanji H, Higuchi K. “Occupant Kinematics and Shoulder Belt Retention in Far‐Side Lateral and Oblique
Collisions: A Parametric Study.” Stapp Car Crash Journal, 2013, 57 (343).
[5] Arun M W J, Umale S, Humm J R, Yoganandan N, Hadagali P, and Pintar F A. “Evaluation of Kinematics and
Injuries to Restrained Occupants in Far‐Side Crashes Using Full‐Scale Vehicle and Human Body Models.”
Traffic Injury Prevention, 2016, 17, 116–123.
[6] Douglas C A, Fildes B N, Gibson T J, Boström O, and Pintar F A. “Factors Influencing Occupant‐to‐Seat Belt
Interaction in Far‐Side Crashes.” Association for the Advancement of Automotive Medicine, 2007, 51 (2000):
319–39.
[7] Fildes B N, Linder A, Douglas C, Digges K, Morgan R, Pintar F A, Yoganandan N, Gabler HC, Duma S, Stitzel J,
Bostrom O, Sparke L, Smith S, Newland C. “Occupant Protection In Far Side Crashes,” 19th International
Technical Conference on the Enhanced Safety of Vehicles (ESV) 2005. 1–6.
[8] Fildes B N, Sparke L J, Bostrom O, Pintar F A, Yoganandan N, and Morris A P. “Suitability of Current Side
Impact Test Dummies in Far‐Side Impacts.” In IRCOBI Conference 2002, Munich, Germany, 18‐20
September, 43–55.
[9] N398, ISO TC22/SC12/WG5 WorldSID TG. 2003. “Biofidelity.”
[10] Schmitt K, Niederer PF, Muser M H, and Walz F. 2004. Trauma Biomechanics Introduction to Accident Injury.
Vol. 49.
[11] Bartsch A, Benzel E, Miele V, Morr D, and Prakash V. “Hybrid III Anthropomorphic Test Device (ATD)
Response to Head Impacts and Potential Implications for Athletic Headgear Testing.” Accident Analysis and
Prevention, 2012, 48, 285–91.
[12] Sunnevång C, Lecuyer E, Hynd D, Carroll J, Kruse D, and Boström O. “Evaluation of Near‐Side Oblique Frontal
Impacts Using THOR with SD3 Shoulder.” Traffic Injury Prevention, 2014, 15, 96–102.
[13] Pipkorn B, Lopez‐Valdes F J, Juste‐Lorente O, Maza M, and Sunnevång C. “Study of the Kinematics of the
THOR Dummy in Nearside Oblique Impacts Bengt.” IRC‐16‐85 IRCOBI Conference, 2016, 46, 381–82.
[14] Yoganandan N, Zhang J, Pintar F A, and Liu Y K. “Lightweight Low‐Profile Nine‐Accelerometer Package to
Obtain Head Angular Accelerations in Short‐Duration Impacts.” Journal of Biomechanics 2006, 39, 1347–54.
[15] Padgaonkar A J, Krieger K W, and King A I. “Measurement of Angular Acceleration of a Rigid Body Using
Linear Accelerometers,” 2016, 1975: 552–56.
[16] Yoganandan N, Arun M W J, and Pintar F A. 2014. “Normalizing and Scaling of Data to Derive Human
Response Corridors from Impact Tests.” Journal of Biomechanics 47 (8). Elsevier: 1749–56.
[17] Umale S, Yoganandan N, Pintar F A, and Arun M W J. “Factors Influencing the Effectiveness of Occupant
Retention under Far‐Side Impacts: A Parametric Study.” Journal of the Mechanical Behavior of Biomedical
Materials, 2018, 84, 235–48.
[18] Thunert, C. 2012. CORA Release 3.6 User’s Manual.
[19] Hering A M and Derler S. “Motorcycle Helmet Drop Tests Using a Hybrid III Dummy.” Proceedings of the
International Research Council on Biomechanics of Injury (IRCOBI) Conference 2000, 307–21.
[20] Spittle E, Shipley B W, Kaleps I. “Hybrid III and Hybrid III Dummy Neck Properties for Computer Modeling.”
Air Force Systems Command, Wright‐Patterson Air Force Base, Ohio, 1992.
[21] Yoganandan N, Pintar F A, Moore J, and Maiman D J, “Sensitivity of THOR and Hybrid III dummy lower neck
loads to belt systems in frontal impact,” Traffic Inj. Prev., vol. 12, no. 1, pp. 88–95, 2011.
[22] Humanatics Innovative Solutions User Manual, “THOR‐50M,” 2017.
IRC-18-90 IRCOBI conference 2018
- 621 -

[23] Humanatics Innovative Solutions User Manual, “World SID‐50M,” 2013.
[24] Kallieris D, Rizzetti A and Mattern R. “The Biofidelity of Hybrid III Dummies.” IRCOBI Conference 1995. 135‐
154.
[25] Vezin P, Bruyere‐garnier K, Bermond F, and Verriest J P. “Comparison of Hybrid III, Thor‐ α and PMHS
Response in Frontal Sled Tests 46th Stapp Car Crash Conference.” Stapp Car Crash Journal, 2002, 46, 1–26.
[26] Sunnevång C, Rosén E, Boström O. “Thoracic Injury Risk as a Function of Crash Severity – Car‐to‐Car Side
Impact Tests with WorldSID Compared to Real‐Life Crashes.” Annals of Advances in Automotive Medicine,
2010, 159–68.
[27] Sunnevång C, Subit D, Kindig M, Lessley D, Lamp J, Boström O, and Kent R. “Response of the Worldwide Side
Impact Dummy (WorldSID) to Localized Constant‐Speed Impacts.” Annals of Advances in Automotive
Medicine, 2011, 55:231–41.
[28] Sutterfield A, Pecoraro K, Rouhana S W, Xu L, Abramczyk J, Berliner J, Irwin A, Jensen J, Mertz H J, Nusholtz
G, Pietsch H, Scherer R, Tylko S “Evaluation of the ES‐2re Dummy in Biofidelity, Component, and Full Vehicle
Crash Tests.” Stapp Car Crash Journal, 2005, 49, 481–508.
[29] Damm R, Schnottale B and Lorenz B. “Evaluation of the Biofidelity of the WorldSID and the ES‐2 on the Basis
of PMHS Data.” IRCOBI Conference 2006, 225–37.
[30] Yoganandan N and Pintar F A. “Deflections from Two Types of Human Surrogates in Oblique Side Impacts.”
Annals of Advances in Automotive Medicine, 2008.
[31] Shaw G, Lessley D, Ash J, Crandall J and Parent D. “Response Comparison for the Hybrid III, THOR Mod Kit
with SD‐3 Shoulder, and PMHS in a Simulated Frontal Crash.” In Enhanced Safety of Vehicles (ESV), 2013,
Paper Number 13‐0130, 1‐19.
IRC-18-90 IRCOBI conference 2018
- 622 -

VIII. APPENDIX
Appendix 1 (a). Comparison of THOR physical and FE model under far‐side at 90 deg (lateral)
Appendix 1 (b). Comparison of THOR physical and FE model under far‐side at 60 deg (oblique)
IRC-18-90 IRCOBI conference 2018
- 623 -

IRC-18-90 IRCOBI conference 2018
- 624 -

Appendix 2 (a). Comparison of WSID physical and FE
model under far‐side at 90 deg (lateral) Appendix 2 (b). Comparison of WSID physical and FE
model under far‐side at 60 deg (oblique)
IRC-18-90 IRCOBI conference 2018
- 625 -

s
IRC-18-90 IRCOBI conference 2018
- 626 -

Appendix 3 (a). Comparison of Hybrid III physical and FE model under far‐side at 90 deg (lateral)
Appendix 3 (b). Comparison of Hybrid III physical and FE model under far‐side at 60 deg (oblique)
IRC-18-90 IRCOBI conference 2018
- 627 -

Appendix 4. The unenclosed shoulder of Hybrid III, results in shoulder belt getting stuck
Appendix 5. The human like shoulder of THOR with clavicle joint, rubber and foam paddings
IRC-18-90 IRCOBI conference 2018
- 628 -

Appendix 6. The gradual slipping of seatbelt over the World SID shoulder
IRC-18-90 IRCOBI conference 2018
- 629 -