Quantitative Dynamic PET Imaging of the Heart: Min Zhong ...
139
Quantitative Dynamic PET Imaging of the Heart: From Mouse to Man Min Zhong Wuhan, Hubei, China Bachelor of Science, University of Science and Technology of China, 2009 A Dissertation presented to the Graduate Faculty of the University of Virginia in Candidacy for the Degree of Doctor of Philosophy Department of Physics University of Virginia May, 2014
Transcript of Quantitative Dynamic PET Imaging of the Heart: Min Zhong ...

Quantitative Dynamic PET Imaging of the Heart:
From Mouse to Man
Min Zhong
Wuhan, Hubei, China
Bachelor of Science, University of Science and Technology of China, 2009
A Dissertation presented to the Graduate Faculty
of the University of Virginia in Candidacy for the Degree of
Doctor of Philosophy
Department of Physics
University of Virginia
May, 2014
Abstract
Positron emission tomography (PET) imaging is an excellent tool to evaluate
molecular, metabolic, physiologic and pathologic conditions of the body for diagnosis,
therapy planning and research. It is based on annihilation coincidence detection technique,
wherein a positron annihilates with an electron to generate two 511 keV photons that can
be detected simultaneously. Several factors such as the detector element size, positron
range, and noncollinearity of annihilation photons together limit the system spatial
resolution of a PET system. Quantification of PET data is thus very challenging due to
the limited spatial resolution. Tracer kinetic modeling is commonly used for quantitative
evaluation of dynamic PET data. The image derived time-resolved curves are susceptible
to incomplete radioactivity recovery called partial volume (PV) effect, and cross-
contamination between adjacent regions called spillover (SP) effect, thereby image
derived data do not reflect the true activity concentration in the region of interest. The
objective of this dissertation is to develop tracer kinetic models for evaluation of
metabolism and perfusion in the heart using dynamic PET imaging in vivo, accounting
for PV and SP corrections.
Using Siemens microPET Focus F120 small animal scanner, efforts were devoted into
the development and validation of an in vivo quantification methodology for 2-[18F]
fluoro-2deoxy-D-glucose (FDG) dynamic PET images of mouse heart, which can
simultaneously give an accurate estimation of metabolic kinetic parameters, and model

corrected blood input function with PV and SP corrections in a 3-compartment glucose
transport model [1]. This advanced method not only improves quantitation but is also
repeatable. Using the developed kinetic model, this dissertation also discussed the non-
invasive measurement of the myocardial glucose uptake rate ki in mouse heart subjected
to transverse aortic constriction (TAC) surgery induced pressure overload left ventricle
hypertrophy (LVH), to test the hypothesis that metabolic changes precede and possibly
trigger cardiac dysfunction in the pressure overloaded heart [2].
Adapting the quantification methodology developed in small animals to clinical
practice, a first-in-human study was carried out on a Siemens Biograph mCT PET/CT
clinical scanner using dynamic FDG PET imaging, to test the hypothesis that significant
changes in glucose metabolism precede any structural and functional changes of the heart
in patients with hypertension [3][4].
Also, this dissertation explored quantitative assessment of absolute blood flow in
mouse heart using dynamic 13
N-ammonia PET imaging in a 3-compartment tracer kinetic
model [5]. Larger positron range of isotope 13
N leads to further degradation of the spatial
resolution, thereby making quantification more challenging than that in FDG PET
imaging. Poor image quality, small size of the mouse heart and rapid heart rate results in
significant PV effect and SP contamination. A quantitative 3-compartment tracer kinetic
model was developed to measure blood flow in mouse heart in vivo. A correlation
between blood flow and metabolism was established in the stressed mouse heart, for the
first time, using dynamic 13
N-ammonia and FDG PET imaging respectively.

Acknowledgements
After a long cold winter, it is spring again in this small town. As I am approaching to
the end of my student life, I would like to express my sincere appreciations to all the
people who supported and encouraged me in this important era of my life.
My first gratitude goes to my thesis advisor, Prof. Bijoy Kundu, for all I have learned
from him and his constant help throughout my graduate study. His continuous guidance
helped me succeed, and his scientific dedication lightened my way. From the past four
years, not only have I gained the knowledge that solves specific problems, but also I have
acquired the methodology that will benefit me for a life time. I truly appreciate his
professional advice as a mentor and his personal guidance as a friend.
I am grateful to Prof. Heinrich Taegtmeyer for sharing his knowledge and experience,
and fruitful discussions on our projects. I would like to thank Drs. Jamieson Bourque,
Yasmin Hamirani, David Glover and Julien Dimastromatteo, for the collaboration and
effective teamwork. Many thanks to my colleagues: Dr. Landon Locke, Clayton Alonso,
and Maanasi Mistry for working and solving the difficult problems together. I also would
like to thank Gina Wimer and Bobi Thornhill for their productive assistance. The Physics
department made sure I am on the track, and the Molecular Imaging Core provided me
with a great platform to launch a range of interesting and useful projects. Therefore, I
would like to thank all the members of department of Physics, Radiology and Medical
Imaging for their support. It was a great pleasure to work in such a congenial and
enjoyable environment.

I would like to express my special thanks to my dissertation committee members: Prof.
P.Q. Hung, Prof. Gordon Cates, and Prof. Mark Williams. Thank you for all the
insightful suggestions about my thesis research and my career concerns.
Last but not least, I would like to send my deepest thanks to my parents Weifang Liu
and Yaosheng Zhong for making me who I am. Your unconditional love, support and
beliefs in me are my greatest encouragement during the hard times. I would like to
dedicate this dissertation work to you, my dearest mother and father.

Table of Contents
ABSTRACT ....................................................................................................................... ii
ACKNOWLEDGEMENTS ............................................................................................ iv
TABLE OF CONTENTS ................................................................................................ vi
LIST OF FIGURES ......................................................................................................... xi
LIST OF TABLE ........................................................................................................... xiv
1 INTRODUCTION................................................................................................. 1
1.1 Fundamental Concepts of Nuclear Medicine .................................................. 1
1.2 Advantages of Nuclear Medical Imaging ....................................................... 2
1.3 Diagnostic Nuclear Medical Imaging ............................................................. 3
1.4 Motivation ....................................................................................................... 4
2 PHYSICS OF POSITRON EMISSION TOMOGRAPHY ............................... 5
2.1 Basic Nuclear Physics Principles in PET........................................................ 5
2.1.1 Unit of Radioactive Measurements ......................................................... 5
2.1.2 Positron Emission and Annihilation ....................................................... 6
2.2 Events Detection in PET ................................................................................. 8
2.2.1 Coincidence Detection ............................................................................ 8
2.2.2 Types of Events..................................................................................... 11
2.3 Detector Principles and Configurations in PET System ............................... 15
2.3.1 Scintillation Detectors ........................................................................... 15

2.3.2 Detector Design .................................................................................... 21
2.3.3 PET Scanner Camera Configuration ..................................................... 24
2.4 Data Acquisition for PET.............................................................................. 26
2.5 Data Correction ............................................................................................. 29
2.5.1 Normalization ....................................................................................... 29
2.5.2 Attenuation Correction.......................................................................... 30
2.5.3 Scatter Correction ................................................................................. 32
2.5.4 Random Correction ............................................................................... 33
2.5.5 Dead Time Correction........................................................................... 34
3 TRACER KINETIC MODELING .................................................................... 36
3.1 Limited System Resolution ........................................................................... 36
3.1.1 Geometric Component .......................................................................... 36
3.1.2 Physical Component ............................................................................. 39
3.2 Partial Volume and Spillover Effect ............................................................. 42
3.3 Tracer Kinetic Modeling ............................................................................... 44
3.3.1 3-Compartment Model .......................................................................... 44
3.3.2 Correction for Partial Volume and Spillover Effects ............................ 47
4 OPTIMIZATION OF A MODEL CORRECTED BLOOD INPUT
FUNCTION FROM DYNAMIC FDG-PET IMAGES OF SMALL ANIMAL
HEART IN VIVO ............................................................................................................ 49
4.1 Introduction ................................................................................................... 49
4.2 Materials and Methods .................................................................................. 51
4.2.1 Arterial and Venous Blood Sampling ................................................... 51
4.2.2 Imaging Protocols ................................................................................. 53
4.2.3 Recovery Coefficient (RC) Measurements ........................................... 54
4.3 Data Analysis ................................................................................................ 56
4.4 Results ........................................................................................................... 58
4.5 Discussion ..................................................................................................... 61
4.6 Conclusions ................................................................................................... 63
5 EARLY DETECTION OF METABOLIC REMODELING IN A MOUSE
MODEL OF PRESSURE OVERLOAD LEFT VENTRICULAR HYPERTROPHY
IN VIVO ........................................................................................................................... 64
5.1 Introduction ................................................................................................... 64
5.2 Animal Model ............................................................................................... 65
5.3 MicroPET Imaging Protocol ......................................................................... 66
5.4 Data Analysis ................................................................................................ 67
5.4.1 Dynamic Data Analysis ........................................................................ 68
5.4.2 Statistical Analysis ................................................................................ 69
5.4.3 Quantitative Accuracy of MCBIF Applied to IDIF from OSEM-MAP
Gated Images ............................................................................................................ 69
5.5 Metabolic Remodeling in LVH in Mice In vivo ........................................... 71
5.6 Conclusions ................................................................................................... 76

6 NON-INVASIVE DETECTION OF EARLY METABOLIC REMODELING
FROM DYNAMIC FDG PET IMAGES OF THE HEART: FIRST IN HUMAN
STUDY ............................................................................................................................. 81
6.1 Introduction ................................................................................................... 81
6.2 Materials and Methods .................................................................................. 83
6.2.1 Patients .................................................................................................. 83
6.2.2 Echocardiography ................................................................................. 83
6.2.3 FDG PET Imaging Protocol.................................................................. 83
6.2.4 Data Analysis ........................................................................................ 84
6.3 Results ........................................................................................................... 84
6.4 Discussion ..................................................................................................... 87
6.5 Conclusions ................................................................................................... 89
7 MYOCARDIAL BLOOD FLOW MEASURED BY 13
N-AMMONIA
DYNAMIC PET IMAGING .......................................................................................... 90
7.1 Introduction ................................................................................................... 90
7.2 Measuring Absolute Myocardial Blood Flow (MBF) using a 3-Compartment
Tracer Kinetic Model in Mouse Heart .......................................................................... 92
7.2.1 MicroPET Imaging Protocol ................................................................. 92
7.2.2 Tracer Kinetic Model Development for Absolute MBF Measurement 93
7.3 Measuring Absolute MBF and glucose metabolism mismatch in a TAC
Mouse Model ................................................................................................................ 97
7.3.1 MicroPET Imaging Protocol ................................................................. 98

7.3.2 Left Ventricle Segmentation Analysis .................................................. 99
7.4 Discussion ................................................................................................... 100
7.5 Conclusions ................................................................................................. 101
8 CONCLUSION AND FUTURE WORK ........................................................ 102
8.1 Research Summary ..................................................................................... 102
8.2 Future Work ................................................................................................ 104
REFERENCE ................................................................................................................ 106
List of Figures
Figure 2-1 Positron-electron annihilation as a result of β+ decay. ................................. 7
Figure 2-2 Diagram of a basic annihilation coincidence detection system. ................... 9
Figure 2-3 Schematic diagram showing timing signal processing in a PET camera. .. 11
Figure 2-4 Different types of coincidence events. ....................................................... 13
Figure 2-5 Compton scattering..................................................................................... 16
Figure 2-6 A typical energy distribution for photoelectrons involved in interactions
with the incident 511 keV photons. .................................................................................. 17
Figure 2-7 Schematic figure of block detector. ............................................................ 22
Figure 2-8 Schematic figure of continuous gamma camera......................................... 23
Figure 2-9 PET scanner configurations........................................................................ 25
Figure 2-10 2D data acquisition for PET. .................................................................... 26
Figure 2-11 3D data acquisition for PET. .................................................................... 28
Figure 3-1 The change of response function when the event approaches the surface of
the detector. ....................................................................................................................... 37
Figure 3-2 Depth of interaction effect. ......................................................................... 38
Figure 3-3 Positron range. ............................................................................................ 40
Figure 3-4 Photon noncollinearity ............................................................................... 42
Figure 3-5 The schematic block diagram of 3-compartment FDG model. .................. 45
Figure 4-1 Plot of RC with different rod sizes using OSEM-MAP (dash line with
diamonds) and FBP reconstruction algorithm (dotted line with open squares). ............... 55
Figure 4-2 Select coronal dynamic end-diastolic PET images at 0, 0.5, 2 and 56
minutes fused with transmission images, and representative estimated results of mouse
model correction. .............................................................................................................. 59
Figure 4-3 Residual plot shows the difference between MCBIF applied to OSEM-
MAP cardiac and respiratory gated images (diamonds) and FBP un-gated images (open
squares) ............................................................................................................................. 60
Figure 5-1 MCBIF estimation for the whole scan duration and first 5 minutes of the
scan. .................................................................................................................................. 70
Figure 5-2 Gated transverse PET images in vivo. End-diastolic transverse PET images
at last time bin for sham mice, TAC mice, and TAC mice treated with propranolol at
baseline, day 1, and day 7 after surgery are shown. ......................................................... 72
Figure 5-3 Measured rates of myocardial 18F-FDG uptake ki and LVEF of the three
groups over the 7 days period. .......................................................................................... 73
Figure 5-4 Blood glucose levels and rMGU of three groups over the 7 days period. . 74
Figure 5-5 Comparison between ki and rMGU measured in vivo at day 7. ................. 76
Figure 6-1 Myocardial metabolism and left ventricle structure in hypertension induced
LVH patients. .................................................................................................................... 86
Figure 7-1 The schematic block diagram of 3-compartment myocardial blood flow
model................................................................................................................................. 93
Figure 7-2 Dynamic 13
N-ammonia PET imaging in vivo in mouse heart and model fits
at rest. ................................................................................................................................ 96
Figure 7-3 13
N-ammonia PET images of mouse heart at rest and during vasodilator
stress (regadenoson, 2.5 ug/kg in 50 uL) in vivo. ............................................................. 97

Figure 7-4 Left ventricle segmentation analysis for metabolism and perfusion .......... 99

List of Table
Table 2-1 Properties of scintillators material useful at 511 keV .................................. 20
Table 3-1 Maximum positron energy and mean and maximum positron ranges of
commonly used isotopes ................................................................................................... 41
Table 4-1 Initial guess values and bounds for parameters used in the optimization
routine applied to OSEM-MAP gated images .................................................................. 57
Table 4-2 SP, PV factors, and FDG influx constant generated by model correction on
OSEM-MAP gated images in n = 6 mice. ........................................................................ 61

1 Introduction
1.1 Fundamental Concepts of Nuclear Medicine
Nuclear medicine is a medical specialty. It uses safe, noninvasive and low-cost
method of radioactive principle, to evaluate molecular, metabolic, physiologic and
pathologic conditions of the body for diagnosis, therapy and research.
In nuclear medicine study and preparation, gamma-ray-emitting or positron-emitting
radionuclides are combined with other elements to form radioactive substances, or
combined with existing pharmaceutically active molecules to form radiopharmaceuticals,
which happen to have chemical properties that allow them to be concentrated in places of
medical interest for disease detection. The radiopharmaceuticals are more commonly
referred as traces or radiotracers.
Nuclear medicine uses very low dosage of radiopharmaceuticals to diagnose and treat
disease. Once the radiopharmaceutical is administered into the body, it can be localized
in specific organs or cellular receptors, after which the radionuclide tracer atom enables it
to be detected with a gamma camera or other imaging device, which then can provide
very precise images of the body area being imaged. This property of radiopharmaceutical
allows nuclear medicine the ability to image the extent of the metabolic process in the
body, based on the chemical and biological properties of the radiopharmaceutical itself,
rather than relying on structural changes in the tissue anatomy.

Nuclear medicine treatment of diseased tissue is using focused high energy ionizing
radiation interfering cell multiplying based on metabolism. Cells multiply rates differs
and the quicker multiplying cells are affected much stronger than standard cells, so the
diseased cells have less time for detecting and fixing DNA errors before they multiply, so
it is more likely to destroy them when corrupted by nuclear radiation [6].
1.2 Advantages of Nuclear Medical Imaging
Nuclear medical imaging is different from most of the traditional diagnostic imaging
modalities that provide outstanding anatomic images but are limited in the ability of
providing functional processes information, such as x-ray computed tomography (CT)
and magnetic resonance imaging (MRI). They offer the potential to identify abnormalities
at very early stage in the progression of the disease in vivo long before some medical
problems are anatomically apparent. This early detection provides an early intervention
timing window in the disease progression when there may be a better prognosis [7].
Nuclear medicine studies have the ability to provide exquisitely sensitive
measurements of a wide range of functional processes in the body non-invasively. In
addition, there are also nuclear medicine studies that allow imaging of the whole body
depends on certain radiopharmaceuticals and functions [8][9]. Information regarding the
location of abnormally active metabolism obtained from the whole-body scan helps
physicians effectively pinpoint the source of disease [10].
To understand of biological processes at the cellular level in living organs is
expanding [11]. Innovation and development of new tracers technology and “smart
probes” [12] enable not only visualization and characterization of biological processes at

the molecular level, but also quantification analysis, which allow nuclear medicine to be
more organ- or tissue-specific and reveal very specific functional process of interest
underlying a particular disease [13][14].
1.3 Diagnostic Nuclear Medical Imaging
There are two major instruments of nuclear medicine imaging: positron emission
tomography (PET) and single photon emission computed tomography (SPECT). PET
scan provides a three-dimensional image of functional processes within the body.
Positrons are emitted during radiopharmaceuticals decay, followed by annihilation with
an electron in the surrounding tissue; simultaneously send two photons in opposite
directions that subsequently are detected by the gamma-ray cameras grouped around the
body. The distribution of the recorded events is used to assess the distribution of the
injected radiopharmaceuticals or products of metabolized radiopharmaceuticals, and to
calculate the tomographic images.
Single photon imaging technique uses radionuclides that emit single instead of double
gamma rays, which can be measured by using a gamma-ray camera directly. The image
obtained by a gamma-ray camera from one particular angle is a planar view of 3-D
distribution of the radionuclides with the body (also called projection), and SPECT
imaging is performed by using a gamma-ray camera to acquire multiple 2-D projections
from multiple angles. This information can be presented as cross-sectional slices along
any chosen axis through the body.
The higher efficiency of PET scanner detects and records coincident events in time,
which provides more radiation event localization information, thus higher resolution than

SPECT. However, SPECT offers a wider observation timing window due to its longer
half-life radionuclides, thus allowing nuclear medicine researchers to observe longer
biological process in vivo several hours or days after administration of the
radiopharmaceutical [15].
1.4 Motivation
Nuclear medicine studies determine the cause of the medical problem based on
functional process, it has major impacts on diagnosis and treatment of disease, among
which PET scans allow researcher do accurate quantitative analysis to obtain more
information [16], thus exploit the way that the body handles substance differently when
there is a disease progressing. For example, PET can detect most cancer stages, often
before they are evident through other medical tests. PET can also give important early
detection about cardiovascular disease and many neurological disorders, like Alzheimer's.
While the quantification ability of PET data is unique and unsurpassed, it has its own
limitations. The highest resolution of PET scanner is limited by physical and geometrical
conditions, which introduces in inaccuracy in quantitative analysis [17]. Hence, there is a
need to develop in vivo correction techniques of accurate PET data quantification for the
diagnosis and treatment of disease.

2 Physics of Positron Emission Tomography
2.1 Basic Nuclear Physics Principles in PET
Radioactive decay is a physical process that an unstable nucleus loses energy by
emitting particles of ionizing radiation, and transform to a nucleus in a more stable state,
or to a nucleus containing different numbers of protons and neutrons. Among many
different types of radioactive decay, positron emission, or called beta plus decay (β+
decay) is a particular type of radioactive decay.
2.1.1 Unit of Radioactive Measurements
Radioactive activity is measured in SI-derived unit becquerel (Bq) or non-SI unit curie
(Ci) [18]. One Bq is defined as the amount of radioactive material of which one nucleus
decays per second.
1 1secondper decay 1 1 sBq 2-1
The non-SI unit Ci was originally defined as the activity of the quantity of radium
emanation (radon-222) in equilibrium with one gram of radium isotope Ra-226. At
present the curie is equal, by definition, to 3.7×10¹⁰
decays per second.
BqsCi 10110 107.3 107.3 1
2-2
The unit curie is current discouraged by the SI. Low activities are also measured in
disintegration per second (dpm).

2.1.2 Positron Emission and Annihilation
In a β+ decay, an unstable radionuclide nucleus loses energy, a proton inside the
nucleus emits a positron (e+) and an electron neutrino (νe) while it is converted into a
neutron. Schematically, the process is
eenp
2-3
The positron is emitted with a neutrino that is not detected. Positron emission typically
happens in proton-rich radionuclides since the decay decreases proton number relative to
neutron number.
The positron is the antiparticle of an ordinary electron (e-), it has a very short life after
ejection from the nucleus in electron-rich matters. The low-energy positron rapidly loses
its kinetic energy in collisions with atomic electrons in the surrounding matter. The
collision results in the annihilation of both the positron and electron, and creation of
gamma ray photons [19][20][21]. The frame of reference in which the positron-electron
system has zero net linear momentum before the annihilation, and this is also the most
common case, thus two gamma ray photons are emitted in opposite direction after
collision, and the rest energy of the positron and electron is evenly shared between them:
keVcmcmE ep 51122
2-4
ee 2-5
The energy is released as a pair of high-energy gamma ray photons. Higher order
annihilation is also possible [21], but the probability becomes lower because these more
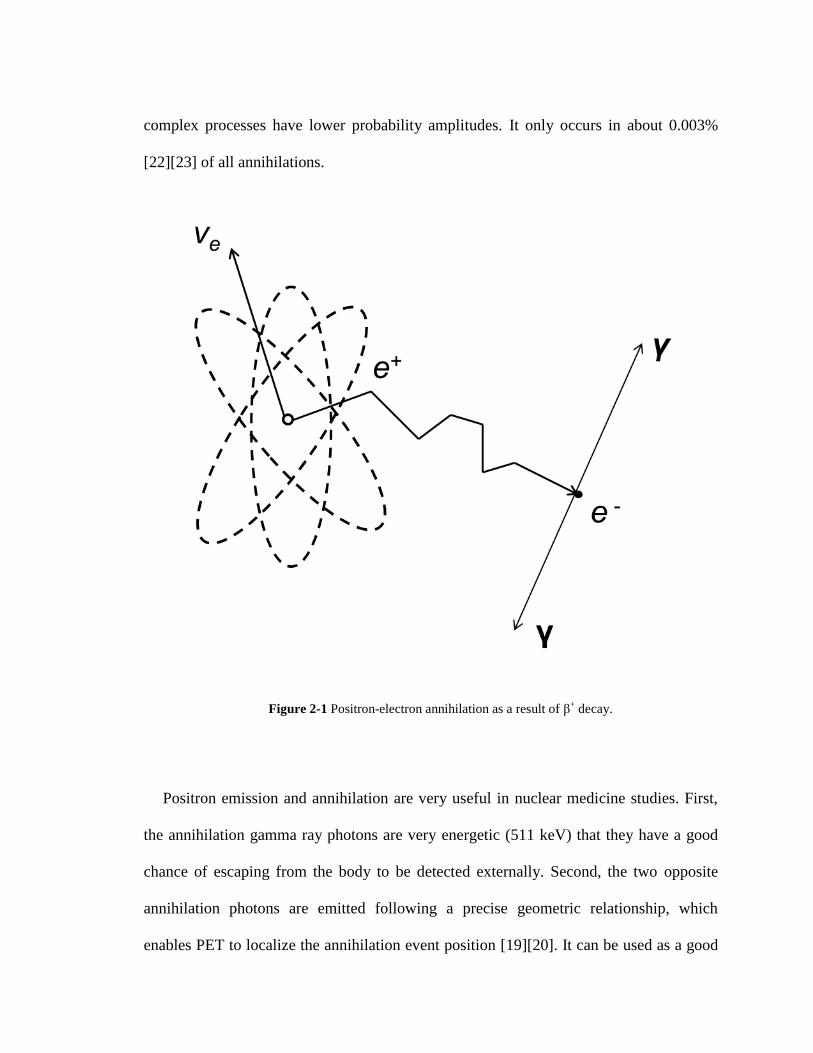
complex processes have lower probability amplitudes. It only occurs in about 0.003%
[22][23] of all annihilations.
Figure 2-1 Positron-electron annihilation as a result of β+ decay.
Positron emission and annihilation are very useful in nuclear medicine studies. First,
the annihilation gamma ray photons are very energetic (511 keV) that they have a good
chance of escaping from the body to be detected externally. Second, the two opposite
annihilation photons are emitted following a precise geometric relationship, which
enables PET to localize the annihilation event position [19][20]. It can be used as a good

indicator of where the radioactive atoms are in the body because the annihilation event
site is very close to the positron emission point.
2.2 Events Detection in PET
A PET scanner is designed to detect the simultaneous emitted back-to-back
annihilation photons and localize the site of corresponding positron emission events. This
unique mechanism is called annihilation coincidence detection (ACD) [24][25].
2.2.1 Coincidence Detection
A simple coincidence detection system consists of a pair of 511 keV gamma radiation
detectors with associated electronics and a coincidence circuit.
The simultaneous detection of two annihilation photons allows PET to determine the
annihilation site from which line the annihilation photons were emitted along, or more
accurately which part of volume, connecting the two detectors. This line between the
coincidence detector pairs is referred as a line of response (LOR). To obtain the complete
3D information of an object, a large number of LORs data are collected at different
angles and different radial offsets that cover the entire field of view of the PET system. In
a typical PET scan, millions of pairs of annihilation photons will be detected and
recorded after a positron-emitting nucleus labeled chemical compound being
administrated into the body [26][27].
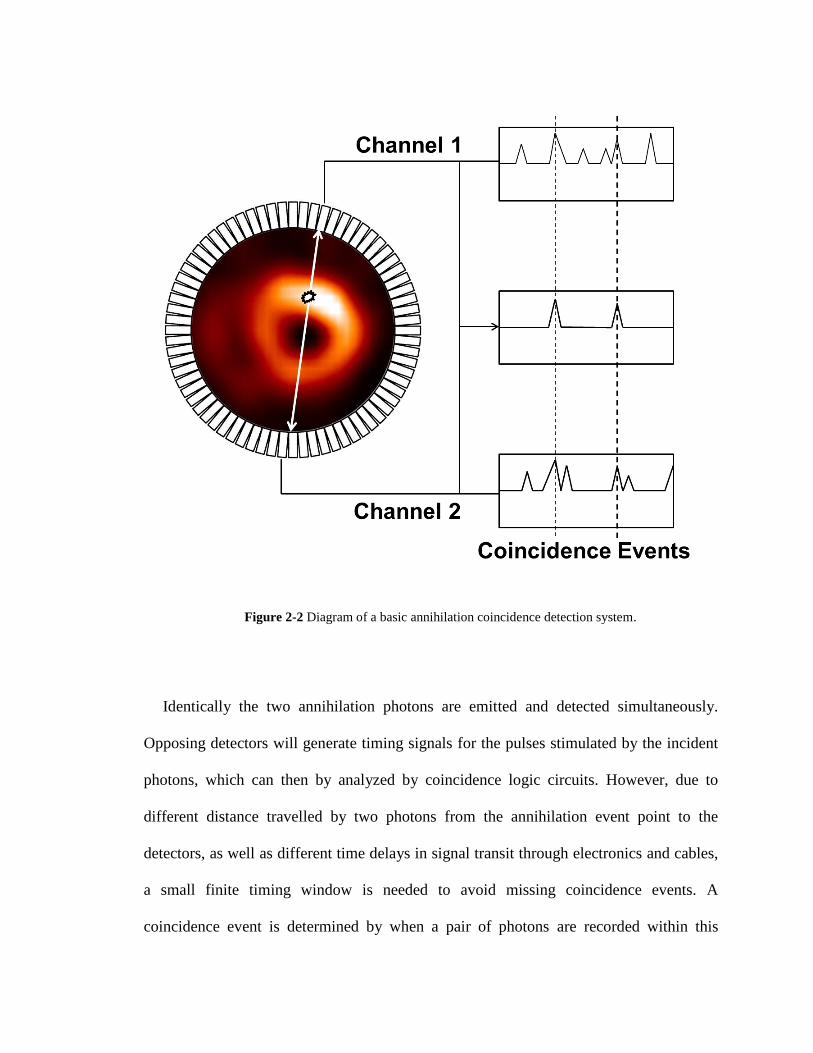
Figure 2-2 Diagram of a basic annihilation coincidence detection system.
Identically the two annihilation photons are emitted and detected simultaneously.
Opposing detectors will generate timing signals for the pulses stimulated by the incident
photons, which can then by analyzed by coincidence logic circuits. However, due to
different distance travelled by two photons from the annihilation event point to the
detectors, as well as different time delays in signal transit through electronics and cables,
a small finite timing window is needed to avoid missing coincidence events. A
coincidence event is determined by when a pair of photons are recorded within this

coincidence timing window. In the same time, the timing window should be as narrow as
possible to prevent from detection of other types of unrelated events that accidentally
happen within the timing window. Usually the width of timing window is chosen to be as
wide as the time resolution of a pair of coincidence detectors, which is 6-12 ns. Timing
signal is generated from each pulse, and then it is passed to coincidence circuitry for
processing [28].
Figure 2-3 shows the mechanism of a coincidence circuit. Except for the time-of-flight
effect, two timing pulses arising from the same coincidence event usually can have some
time differences due to the finite time resolution of the detector and coincidence circuit.
To address this issue, a gate generator is adopted to process the timing pulses and then
creates an electronic pulse lasts for time Δt, which is known as the coincidence resolving
time of the system [26][27]. These fixed-width pulses then pass through a logic unit,
which generates a pulse if there are two signals processing at the same time [29]. For
example, a coincidence event will be recorded if a timing pulse is detected on one
channel at time t, while there is another timing pulse detected on the other channel
between t - Δt and t +Δt. There are set criteria for choosing the value of Δt. If Δt is too
small compared to the time resolution of the detection system, many true coincidences
will be missed. If Δt is too large, more coincidences other than true events will be
counted.

Figure 2-3 Schematic diagram showing timing signal processing in a PET camera.
If choosing sufficiently small Δt, then time-of-flight effects may arise problems. These
effects occur when one photon from an annihilation event takes significantly different
time to reach the detectors than the other. With proper alterations made to the PET
imaging systems, time-of-flight information can be used for improving spatial resolution
and signal-to-noise ratio [30]. These require extremely fast scintillators such as barium
fluoride (BaF2), which has a fast-component decay constant of 0.8 ns.
2.2.2 Types of Events
In the majority of total events detected by the PET system, only one of the two
annihilation photons is registered. The other photon may be not on a trajectory that would
intersect a detector, or may not deposit enough energy in the detectors to be registered.
Normally these single events are rejected by the system.
ACD generates a signal whenever a pair of events is recorded by opposing detectors
with the timing window, and all the events detected by the coincidence circuit in a PET
system are referred as prompt coincidences [26][29]. In ideal discussion, only true
coincidence events result from a pair of photons produced by the same annihilation event
would be recorded. However, due to other possible interactions of the 511 keV photons
within the object body, other types prompt coincidence could also occur within the timing
window.
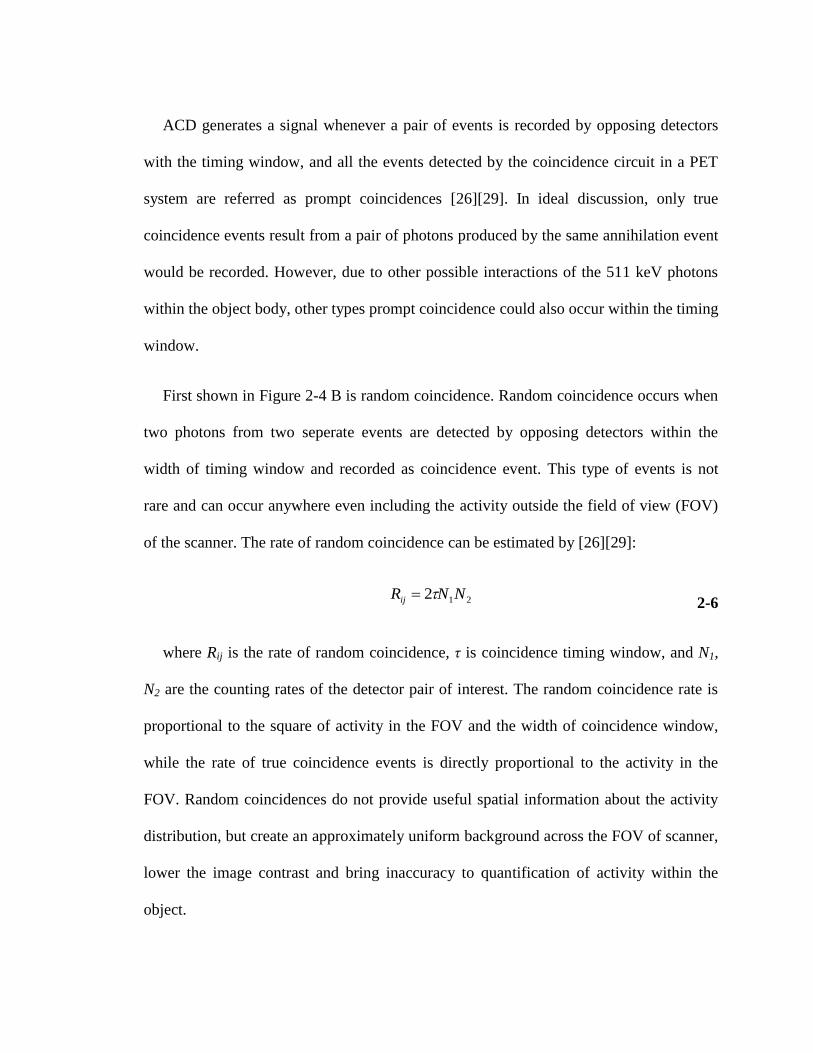
First shown in Figure 2-4 B is random coincidence. Random coincidence occurs when
two photons from two seperate events are detected by opposing detectors within the
width of timing window and recorded as coincidence event. This type of events is not
rare and can occur anywhere even including the activity outside the field of view (FOV)
of the scanner. The rate of random coincidence can be estimated by [26][29]:
212 NNRij 2-6
where Rij is the rate of random coincidence, τ is coincidence timing window, and N1,
N2 are the counting rates of the detector pair of interest. The random coincidence rate is
proportional to the square of activity in the FOV and the width of coincidence window,
while the rate of true coincidence events is directly proportional to the activity in the
FOV. Random coincidences do not provide useful spatial information about the activity
distribution, but create an approximately uniform background across the FOV of scanner,
lower the image contrast and bring inaccuracy to quantification of activity within the
object.
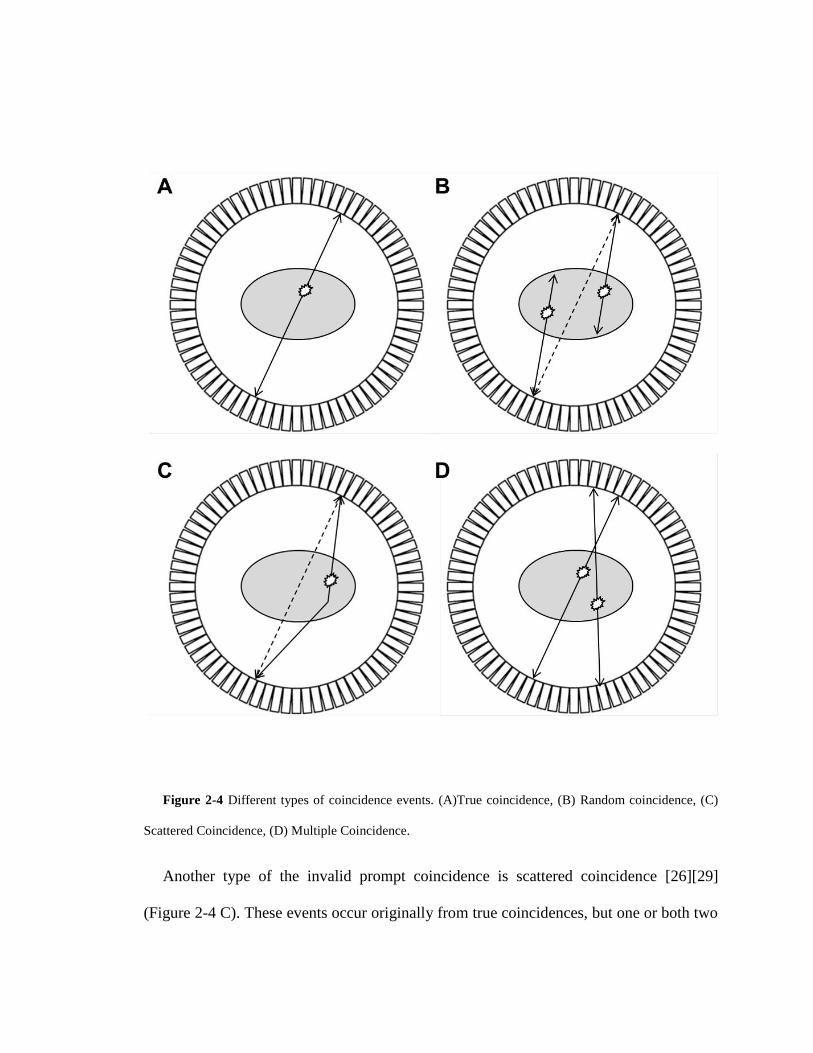
Figure 2-4 Different types of coincidence events. (A)True coincidence, (B) Random coincidence, (C)
Scattered Coincidence, (D) Multiple Coincidence.
Another type of the invalid prompt coincidence is scattered coincidence [26][29]
(Figure 2-4 C). These events occur originally from true coincidences, but one or both two
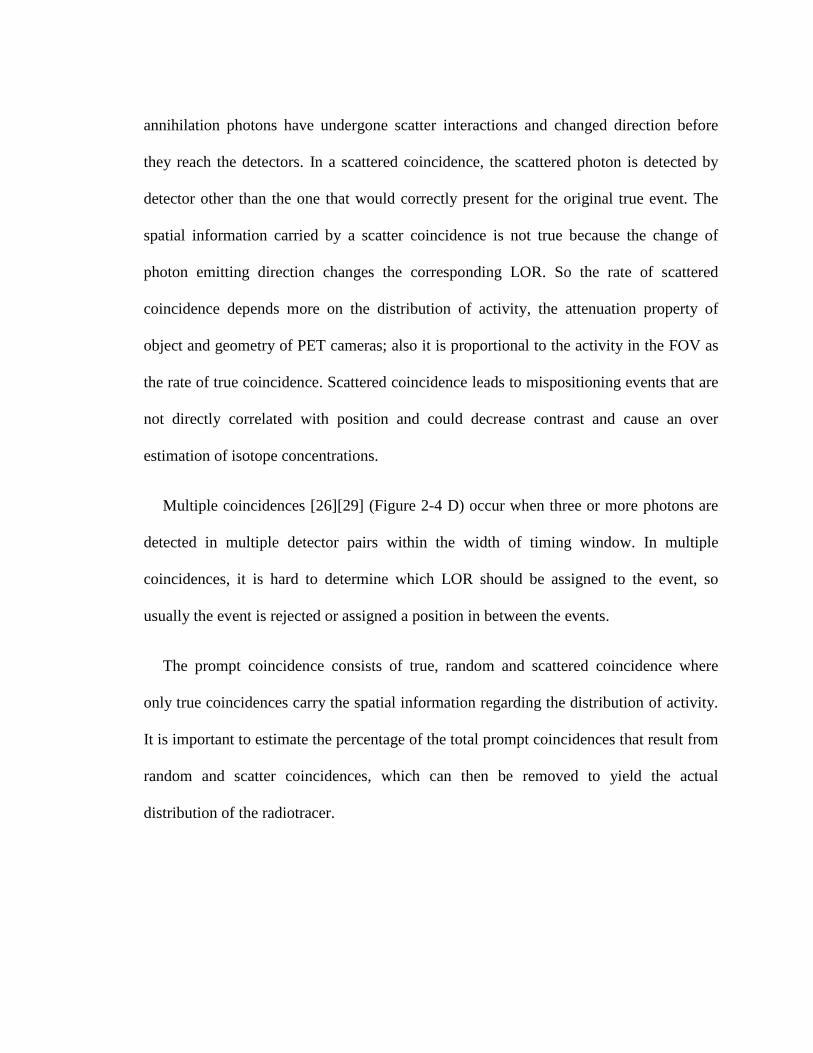
annihilation photons have undergone scatter interactions and changed direction before
they reach the detectors. In a scattered coincidence, the scattered photon is detected by
detector other than the one that would correctly present for the original true event. The
spatial information carried by a scatter coincidence is not true because the change of
photon emitting direction changes the corresponding LOR. So the rate of scattered
coincidence depends more on the distribution of activity, the attenuation property of
object and geometry of PET cameras; also it is proportional to the activity in the FOV as
the rate of true coincidence. Scattered coincidence leads to mispositioning events that are
not directly correlated with position and could decrease contrast and cause an over
estimation of isotope concentrations.
Multiple coincidences [26][29] (Figure 2-4 D) occur when three or more photons are
detected in multiple detector pairs within the width of timing window. In multiple
coincidences, it is hard to determine which LOR should be assigned to the event, so
usually the event is rejected or assigned a position in between the events.
The prompt coincidence consists of true, random and scattered coincidence where
only true coincidences carry the spatial information regarding the distribution of activity.
It is important to estimate the percentage of the total prompt coincidences that result from
random and scatter coincidences, which can then be removed to yield the actual
distribution of the radiotracer.

2.3 Detector Principles and Configurations in PET System
To record millions of annihilation events in one PET scan from all directions, a large
number of small detector pairs are need to be arranged in an array around the object, or a
large area detector need to be placed near the object with the ability of determining
positions hit by 511 keV photons enabled. Also, it is crucial for the detectors to be able to
precisely identify when a photon strike the detectors, thus all the collected times can be
compared to determine when the annihilation pairs were emitted.
2.3.1 Scintillation Detectors
Scintillators are transparent materials that exhibit the property of emitting visible light
when excited by ionizing radiation (scintillation). These materials can be in solid, liquid
or gas form and can be organic or inorganic compounds. The scintillation process
converts high-energy photons into visible light via interaction with a scintillating material.
In scintillators, when an incoming high energy photon strike and gets absorbed, it creates
an energetic electron by either photoelectric absorption or Compton process. A
photoelectric energy distribution is determined by photoelectric absorption and Compton
scatter generate electrons of different. In photoelectric absorption, all the photon energy
is transferred to the electron, so the energy distribution of the photoelectrons is sharply
peaked close to the energy of the incident 511 keV photon [31][32]. In Compton
scattering (Figure 2-5), the energy of scattered electron depends on the scattering angle
[18]:

)cos1(2
1
'
Ce
m
EEE 2-7
where φ is the photon scattering angle, E is the energy of the incident photon and E' is
the energy of the scattered photon. E' reaches a maximum when φ = 0. A typical
theoretical energy distribution spectrum for the electrons interacted with 511 keV
photons is shown in Figure 2-6.
Figure 2-5 Compton scattering. A photon of energy E collides with a target electron at rest, then a new
photon of energy E’ emerges at scattering angle φ.
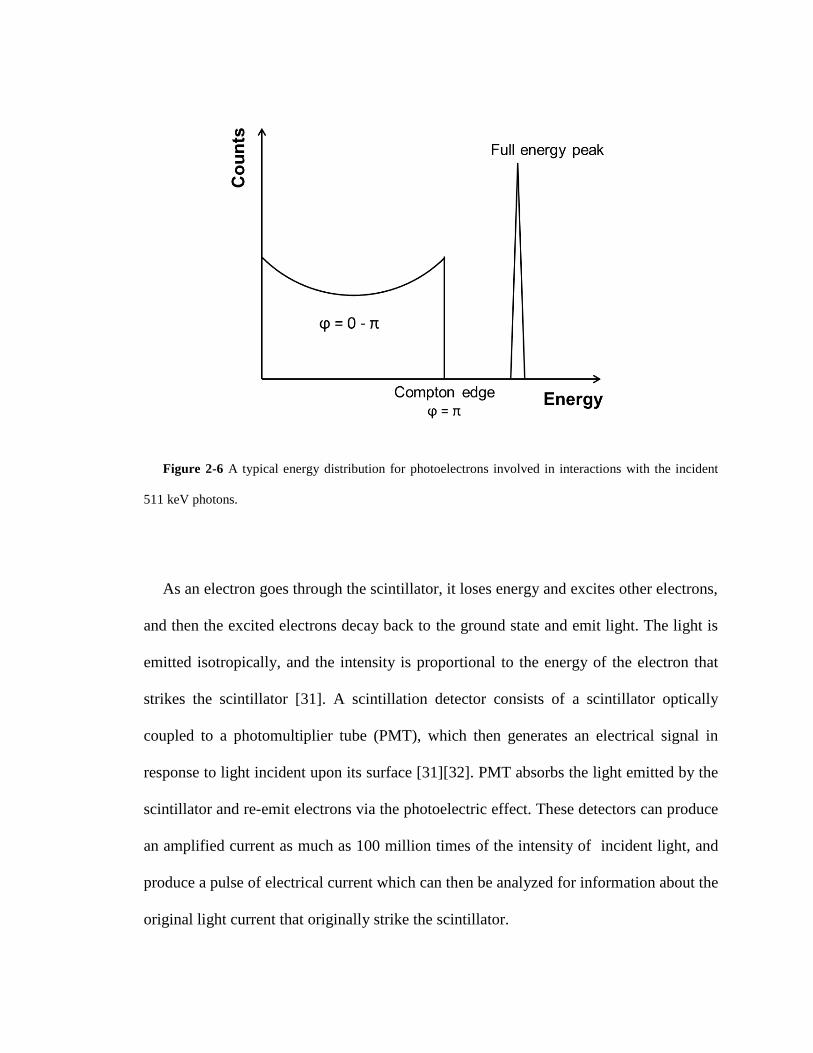
Figure 2-6 A typical energy distribution for photoelectrons involved in interactions with the incident
511 keV photons.
As an electron goes through the scintillator, it loses energy and excites other electrons,
and then the excited electrons decay back to the ground state and emit light. The light is
emitted isotropically, and the intensity is proportional to the energy of the electron that
strikes the scintillator [31]. A scintillation detector consists of a scintillator optically
coupled to a photomultiplier tube (PMT), which then generates an electrical signal in
response to light incident upon its surface [31][32]. PMT absorbs the light emitted by the
scintillator and re-emit electrons via the photoelectric effect. These detectors can produce
an amplified current as much as 100 million times of the intensity of incident light, and
produce a pulse of electrical current which can then be analyzed for information about the
original light current that originally strike the scintillator.

The energy distribution is blurred by the limited energy resolution of the detector. In
sufficiently large detectors, most photons can deposit all of their energy in the crystal and
be registered in full energy peak, while in small size detectors only a portion of photons
can undergo several Compton scattering processes prior to detection. The photons may
escape before depositing all energy and give a continuous distribution lower within the
full energy peak. There can also be some events with energy greater than the full energy
peak because two or more photon interactions occur too close together to be resolved as
separate events. So the actual energy distribution is smoother and wider [33].
Each 511 keV photon detected by a scintillation detector will ultimately generate a
single electrical pulse by the PMT. A timing signal is done by passing the electrical pulse
through a constant fraction discriminator (CFD), which generates a digital pulse if the
pulse signal reaches a certain fraction of the peak pulse height. The digital pulse can then
be used in the coincidence circuitry. Usually there is an upper energy-level discriminator
(ULD), and a lower energy-level discriminator (LLD) which are used to reject electrical
pulses out of a particular range [34]. The ULD is used to reject some events where more
than one photon strikes on the detector within system time resolution. The LLD can be
used for removing scattered annihilation photons since they have lower energy than those
which are unscattered. However not all scatter photons can be removed by LLD because
many of them have energy very close to 511 keV and the system energy resolution is not
sufficient enough to distinguish them from unscattered photons. On the other hand, the
majority of unscattered photons undergoes Compton process with the scintillation
crystals and loses their energy within the crystal; thus choosing high LLD value will
cause losing a significant part of true events. So there is a trade-off between scatter
photons rejection and sensitivity to true events [34].
There are many criteria for choosing scintillation materials, such as high density and
fast responding time. As discussed above, the proportion of events registered in the full
energy peak increases with increasing detector size, which makes it possible to remove
most events arising from photons scattered within the object by using a higher LLD in a
detector system with sufficiently fine energy resolution. However, the spatial resolution
of the system decreases with increasing detector size. The number of events registered in
the full energy peak can also be increased by increasing the proportion of photons
involved interactions of photoelectric absorption, and this can be achieved by choosing
scintillator materials with a large value of effective atomic number Z (effective Z) [29].
Usually higher density materials have heavier ions that significantly increase the stopping
power. High density materials with high stopping power reduces the size needed for
stopping high energy γ-photons, therefore enables the ability of building more compact
detector; for lower energy γ-rays, the range of Compton scattered photons will
significantly decrease in high density materials. This results in better segmentation of
higher proportion of photons in full peak energy and leads to better spatial resolution.
PET detectors have to work at high count rates for millions of events, so high responding
speed is needed for sufficient time resolution. Accordingly the scintillator decay time
should be short since precision of time measurement with a scintillation detector is
proportional to [35].

Several other properties are also demanded for a good detector scintillator: high
efficiency of converting the incident gamma photons into scintillation photons,
transparency to its own scintillation light spectrum, an index of refraction close to that of
glass that allow optimum optical coupling between the scintillator and PMT window,
good linear attenuation over a wide range of energy [29][31][32]. And obviously the
scintillator should be sturdy and easy to manufacture.
Table 2-1 Properties of scintillators material useful at 511 keV
Properties ρ (g/ cm3)
Decay time
(ns)
Photons yield
(per keV)
Index of
refraction
Ration between
photoelectric
and Compton
NaI(Tl) 3.67 230 37.9 1.85 0.22
BGO 7.13 300 8.22 2.15 0.78
LSO: Ce 7.40 47 25.4 1.82 0.52
GSO: Ce 6.71 56 9.00 1.85 0.35
BaF2 4.89 0.8†, 630
‡ 1.37
†, 9.59
‡ 1.56 0.24
†, ‡: slow and fast components.
The properties of some important scintillation crystals are shown in Table 2-1
[32][36][37][38]. NaI has been widely used in SPECT and also used to a lesser extent in
PET. The scintillation crystal widely used in clinical PET are bismuth germanate oxide

(BGO), gadolinium oxyorthosilicate (GSO) or cerium-doped lutetium oxyorthosilicate
(LSO) [39].
2.3.2 Detector Design
There are several variations to decode the detector signals. For example, a 2D pixel
related array of scintillation crystals are coupled to four single channel PMTs via a light
guide to form the block detector [26] (Figure 2-7) is one major method of PET scanners
[40].
When a photon incident is on one of the crystal elements, it will create a unique
scintillation light signal that is shared by all four PMTs. Location of the event crystal
element can be obtained from the individual PMT outputs [41]:
DCBA
BAx
2-8
DCBA
CAy
2-9
where A-D are fraction of light detected by each PMT.
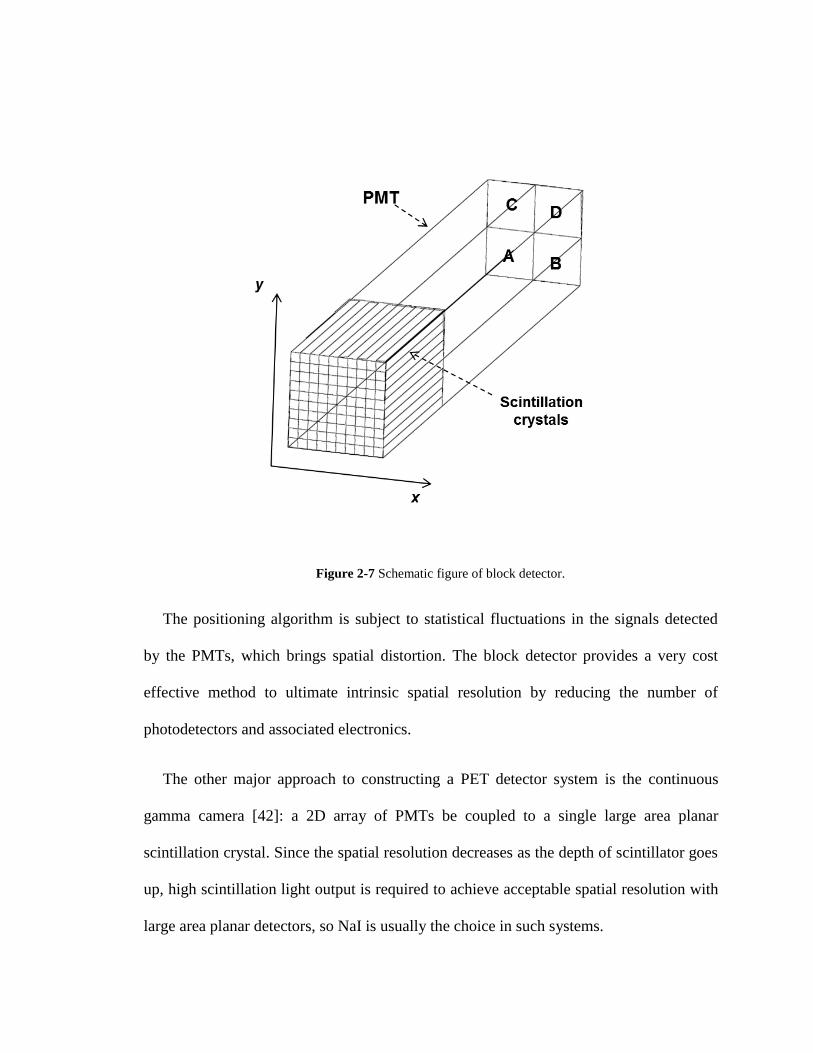
Figure 2-7 Schematic figure of block detector.
The positioning algorithm is subject to statistical fluctuations in the signals detected
by the PMTs, which brings spatial distortion. The block detector provides a very cost
effective method to ultimate intrinsic spatial resolution by reducing the number of
photodetectors and associated electronics.
The other major approach to constructing a PET detector system is the continuous
gamma camera [42]: a 2D array of PMTs be coupled to a single large area planar
scintillation crystal. Since the spatial resolution decreases as the depth of scintillator goes
up, high scintillation light output is required to achieve acceptable spatial resolution with
large area planar detectors, so NaI is usually the choice in such systems.

Figure 2-8 Schematic figure of continuous gamma camera.
Unlike the block detector, the location of the event is determined by analyzing the
distribution of scintillation light among the PMT matrix in this continuous gamma
camera detector [42]. The location information provided by this design is continuous, and
then sampling can be done on the continuous location information based on different
criteria. This positioning algorithm needs to take special efforts to allow detection of
multiple events happening in different places on the same planar scintillator, otherwise
the detector dead time (time interval required for properly processing one event after
another) becomes a major problem. Also, due to the shape of large area scintillation
crystal, significant dead space occurs on the edges of detectors and gaps between
detectors [29].
There are also other scintillation detector configurations such as position-sensitive and
multi-channel PMT, depth-encoding detectors, avalanche photodiodes, other gamma ray
detectors like multi-wire proportional chambers (MWPCs), or direct detection using

semiconductor materials [26]. However, due to different limitations, they are not as
widely used in practice like the two major designs talked above.
2.3.3 PET Scanner Camera Configuration
Several pairs of block detectors or only one pair of large area planar detector would
not make a PET system. The most common configuration of PET scanners is placing
adjacent rings of block detectors around the object bed [26][29]. The plane of the detector
ring is often referred in terms transverse or transaxial, while the directions perpendicular
to this plane (along the object bed) is referred in term axial. It is also common to put less
number of planar detectors in a polygonal geometry [26][29]. Both geometries will allow
full coverage of the entire cross-section of the object and detection of many LORs with
moving detectors, so they are very useful for rapid imaging of tracer dynamic distribution
or short half-life radionuclide labeled tracers.

Figure 2-9 PET scanner configurations. (A) discrete design in a ring geometry; (B) discrete design
rotation; (C) continuous design in a polygonal geometry; (D) continuous design in a ring geometry [26][29].
In PET system for static imaging with a long half-life radiolabeled tracers, a pair of
opposing partial ring of detectors or large area planar detectors may be used to lower cost.
This configuration requires rotating detectors around object to acquire sufficient data to
reconstruct a tomographic image [26][29].
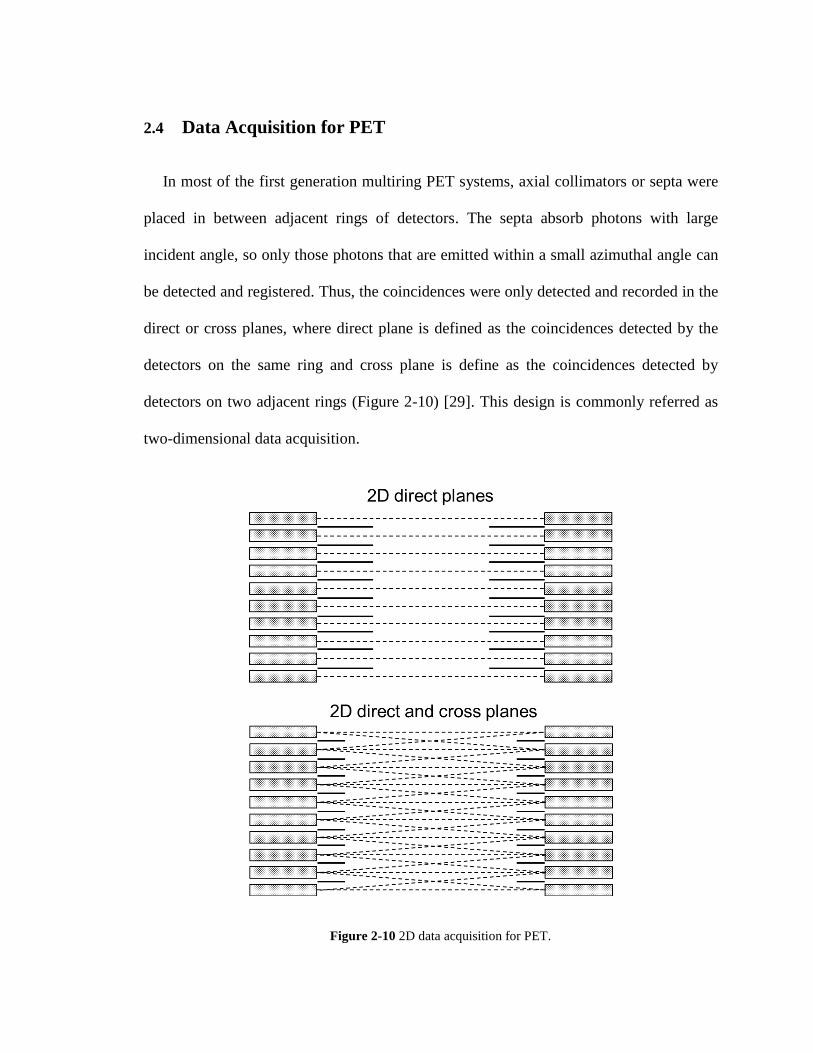
2.4 Data Acquisition for PET
In most of the first generation multiring PET systems, axial collimators or septa were
placed in between adjacent rings of detectors. The septa absorb photons with large
incident angle, so only those photons that are emitted within a small azimuthal angle can
be detected and registered. Thus, the coincidences were only detected and recorded in the
direct or cross planes, where direct plane is defined as the coincidences detected by the
detectors on the same ring and cross plane is define as the coincidences detected by
detectors on two adjacent rings (Figure 2-10) [29]. This design is commonly referred as
two-dimensional data acquisition.
Figure 2-10 2D data acquisition for PET.

The septa reduces the single-channel counting rate by rejecting large angle photons
that have a large possibility of being scattered within object body, therefore not only the
scattered coincidences but also the random coincidences can be efficiently removed, and
dead time can be minimized. In the cross planes, data are obtained from two different
LORs, so they roughly have twice the sensitivity (twice the counting rates) than the
positions in direct planes. However, the efficiency is low because the septa absorbs the
annihilation photons on oblique LORs from many potentially valid coincidence events
[29][43].
Newer PET systems remove septa in between adjacent rings, and the data is collected
from all possible LORs. Because the coincidence planes are not only transaxial planes,
this acquisition mode is referred as three-dimensional acquisition. The sensitivity of PET
system can get dramatic improvement by defining addition coincidence planes. Typically
3-D acquisition leads to a fourfold to eightfold higher sensitivity compared to 2-D
acquisition. In 3-D acquisition, the sensitivity profile along the axial direction is a
triangular shape function with a peak in the middle of the FOV, so it is important to place
object near center of FOV. The sensitivity on the edge on FOV is equivalent to 2-D
acquisition.

Figure 2-11 3D data acquisition for PET. The highest sensitivity is in the middle of the FOV.
The 3-D acquisition can be used to reduce imaging time for its higher sensitivity, and
also reduce the injection dose of radioactivity. While 3-D acquisition provides overall
higher sensitivity, the number of scattered coincidences and random coincidences is
increased. Noise due to subtraction of random and scattered coincidence raises new
problems when large amount activity is presented in the FOV. Also, there is a loss of
spatial resolution along the axial direction due to the superposition of data from different
positions [29][43]. Despite this, for the greatly improved sensitivity, 3-D acquisition
mode is generally used on current commercially available PET scanners.
The basic data acquisition protocol is the collection of a single static frame over a
period. The radioactive concentration represents the average distribution during the scan
time. In some studies, it is necessary to follow the dynamic changes in radioactive
concentration distribution to yield more information of interest about the dynamics of
tracer delivery, accumulation and clearance in tissue. PET scanners with full cross-
section coverage designs can simultaneously acquire data from all angles without
detector motion, and have the ability to do dynamic studies. The scan usually starts as the
radioactive tracer is being injected into object body and lasts for a number of time frames.
2.5 Data Correction
To produce a tomographic image which can reflect the true activity concentration, a
number of corrections need to be applied to make sure the intensity of reconstructed
image is proportional to the true activity in the corresponding area in the object.
2.5.1 Normalization
Fourier-based reconstruction method assumes all LORs have the same efficiency.
However, the sensitivity of each LOR is affected by geometrical variations, non-
uniformities in individual detector elements and difference in detector electronics. The
normalization corrects each LOR with a multiplication factor referred as normalization
coefficients (NCs), to compensate for the non-uniformities.
The most straightforward method of determining the NCs is to perform a scan of an
uniform activity plane source, positioned at a number of equally spaced projection angles.
This process will directly give a complete set of relative variation in coincidence
detection efficiencies between all the LORs in the system. To reduce dead time and pile-
up effects, the uniform source activity should be low [44], and this results in it taking
quite large amount of time to acquire sufficient counts per LOR for good statistical
estimation (tens of hours).
The time consuming problem can be solved by using a component-based variance
reduction method [45][46], in which the coincidence detection efficiency between a pair

of detectors of interest is assumed to be the product of the detector efficiencies and
geometric factor, which can be written as:
ijji gNC
1
2-10
Where εi and εj are the individual detector efficiencies of the detector pair and gij is
the geometric factor between them. The individual detector efficiencies can be obtained
by performing a scan of uniform activity circularly symmetric source placing in the
center of FOV. For each detector, the sum of coincidences between the detector of
interest and all its opposing detectors is directly proportional to the detector efficiency.
The geometric factors for a particular PET system can be determined by solid angle
projected by the activity source at the detector and distance between the source and the
detector, and can be assumed to remain constant. This process provides an estimation of
NCs with low statistical noise because the measurement is based on averaging over a
large number of detectors. However, the component-based method depends on empirical
geometrical factor that could introduce systematic errors. There is a trade-off when
choosing from these two correction methods [47].
2.5.2 Attenuation Correction
As discussed in section 2.2.2, one or both annihilation photons could have undergone
Compton scatter interaction before escaping from the object material, and this results in
the removal or attenuation of primary photons of the LOR and the potential detection of
scattered photons in different LORs.
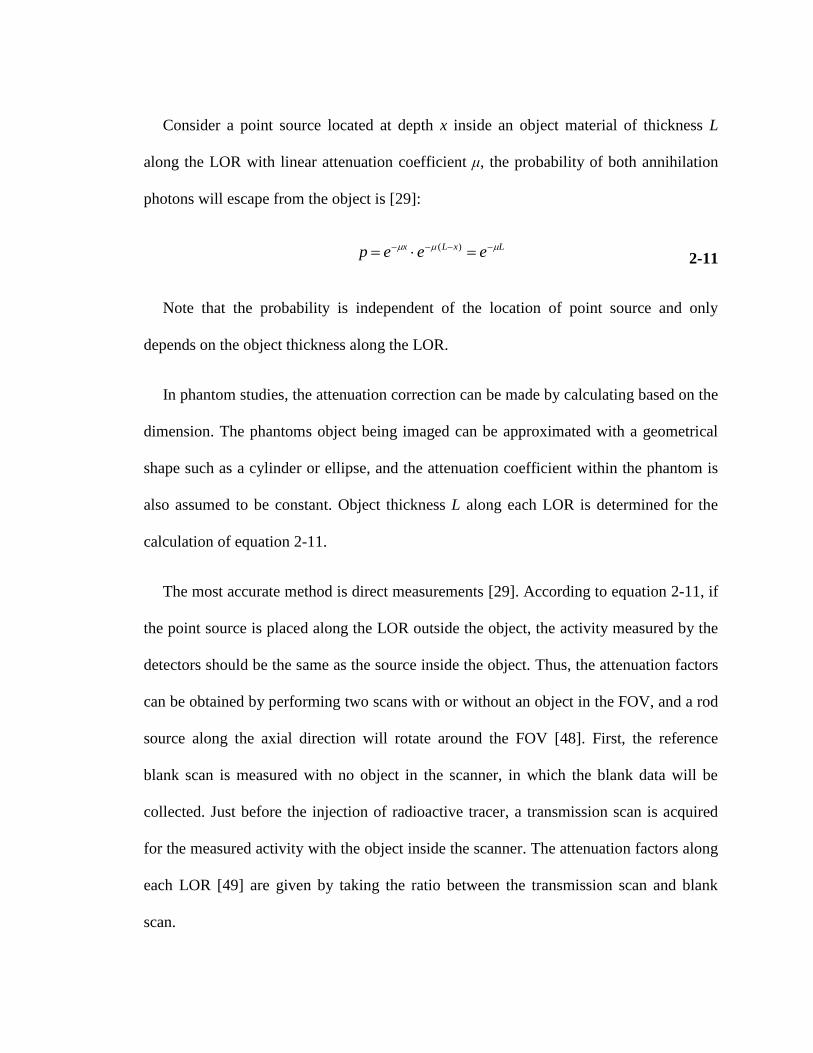
Consider a point source located at depth x inside an object material of thickness L
along the LOR with linear attenuation coefficient μ, the probability of both annihilation
photons will escape from the object is [29]:
LxLx eeep )(
2-11
Note that the probability is independent of the location of point source and only
depends on the object thickness along the LOR.
In phantom studies, the attenuation correction can be made by calculating based on the
dimension. The phantoms object being imaged can be approximated with a geometrical
shape such as a cylinder or ellipse, and the attenuation coefficient within the phantom is
also assumed to be constant. Object thickness L along each LOR is determined for the
calculation of equation 2-11.
The most accurate method is direct measurements [29]. According to equation 2-11, if
the point source is placed along the LOR outside the object, the activity measured by the
detectors should be the same as the source inside the object. Thus, the attenuation factors
can be obtained by performing two scans with or without an object in the FOV, and a rod
source along the axial direction will rotate around the FOV [48]. First, the reference
blank scan is measured with no object in the scanner, in which the blank data will be
collected. Just before the injection of radioactive tracer, a transmission scan is acquired
for the measured activity with the object inside the scanner. The attenuation factors along
each LOR [49] are given by taking the ratio between the transmission scan and blank
scan.
2.5.3 Scatter Correction
As discussed in section 2.2.2, scatter coincidence leads to many mispositioned events
which change slowly with position and could reduce contrast and cause the isotope
concentrations to be overestimated. The correction for scatter coincidence is difficult
because it is impossible to distinguish the scatter events inside the object from the scatter
events in the detector crystals on the bias of energy pulse height. Also, the scintillation
crystal used in PET systems, mostly BGO detectors, have an energy resolution of 20% to
25% [50], which makes it hard to separate high energy scatter coincidence from true
coincidence. Note that scatter and attenuation are the same physics phenomenon, when
one annihilation photon undergoes the Compton scattering interaction with the object
material, it gets attenuated; if the photon is barely absorbed by the object and reaches the
detector on another LOR, it becomes a scatter event. For this reason, scatter correction
should be performed before attenuation correction.
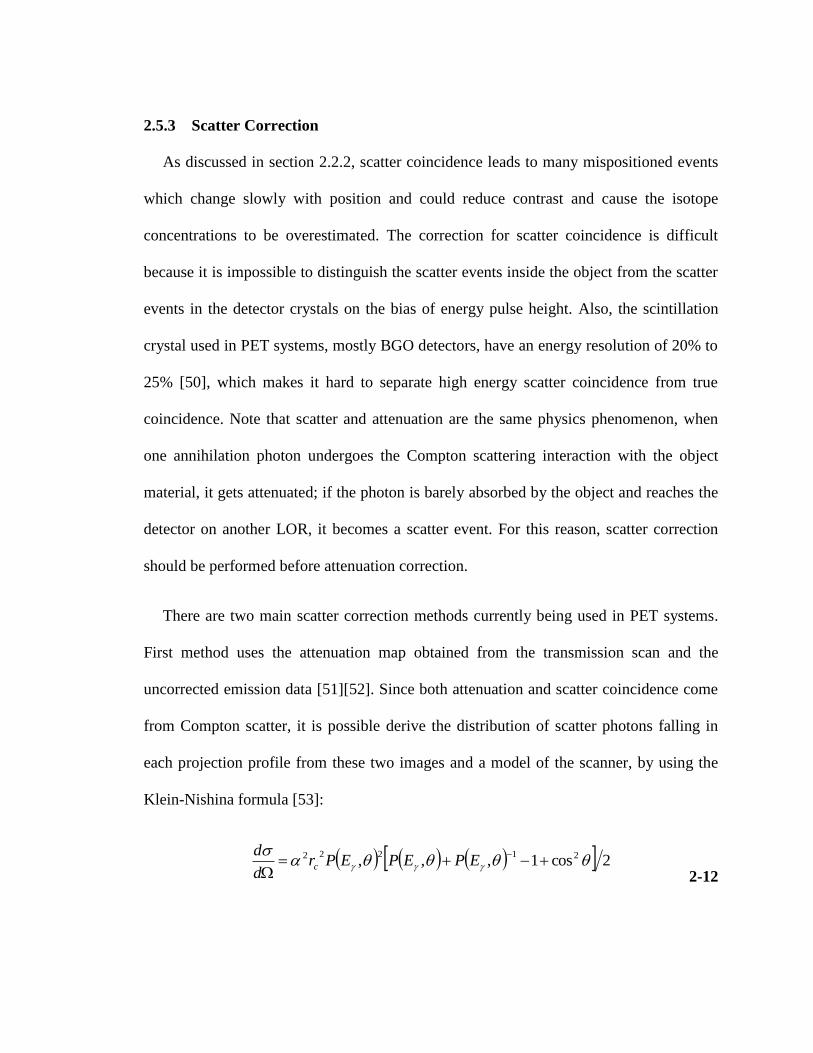
There are two main scatter correction methods currently being used in PET systems.
First method uses the attenuation map obtained from the transmission scan and the
uncorrected emission data [51][52]. Since both attenuation and scatter coincidence come
from Compton scatter, it is possible derive the distribution of scatter photons falling in
each projection profile from these two images and a model of the scanner, by using the
Klein-Nishina formula [53]:
2cos1,,, 21222
EPEPEPr
d
dc
2-12

where α is the fine-structure constant, θ is the scattering angle, rc is the
reduced Compton wavelength of the electron, and P(Eγ, θ) is the ratio of photon energy
after and before Compton scattering [52].
Then this estimated distribution can be subtracted from the profiles and reconstruction.
This method gives very accurate result when all the volume contains radioactivity is
within the FOV of the PET system. Problems will arise if there is a volume containing
high radioactivity lying outside the FOV [29]. Also repeatedly creating projection
profiles increases the calculation intensity.
The other method is fitting a Gaussian projection profile to the scatter distribution on
the edge of each projection that requires the examination of the projection profiles
immediately outside the FOV [54][55]. Since the scatter coincidence creates a low-
frequency background, data on the edge of projection profiles can be extrapolated using
smooth function over the entire area. The fitted scatter distribution is subtracted from the
projection profiles which can then use for reconstruction. This method works fast and
effective when the scatter situation is simple, and the object has a volume containing
activity both inside and outside the FOV. If there is nothing outside, this method may
cause significant error.
2.5.4 Random Correction
Random coincidence creates an approximately uniform background across the FOV of
system, reduces the image contrast and can cause significant artifacts; thus it is necessary
to remove random coincidence from the prompt coincidence to obtain quantitative PET
image data. As discussed in section 2.2.2, the rate of random coincidence Rij can be

calculated for each LOR [56], which can be then subtracted. To accomplish this method,
the single counting rate of each detector element and the coincidence window must be
accurately known.
Another common method for estimating the random rate is delayed coincidence
window method [29]. In this method, the timing signal from one of the two detectors is
delayed by a time significantly greater than coincidence timing window. Therefore, no
true coincidence will be recorded in the delayed window, so the coincidences found in
this delayed window can only come from random coincidence. This estimated number
from the delayed window can be subtracted from the prompts coincidences on-line. This
method is free of systematic error because the delayed window is measured in the same
electronic circuit used for the prompt coincidences. However the subtraction of two
independent measurements leads to increased statistical uncertainty.
2.5.5 Dead Time Correction
Ideally the rate of the prompt coincidence should be directly proportional to the
activity in the FOV. However in radiation detectors, there will be losses due to dead time
at high counting rates, and the radioactive activity concentration could be significant
underestimated if not corrected for dead time. The common method to do dead time
correction is fitting the detector response function to paralyzable or nonparalyzable
[57][58] dead time model.
Paralyzable model:
truetruetmeasuremen RRR exp
2-13

Nonparalyzable model:
true
truetmeasuremen
R
RR
1 2-14
where Rmeasurement and Rtrue are the rate of measured coincidence and true coincidence,
and τ is the dead time constant, which is usually the integration time of detectors and
response time of coincidence circuit. Therefore, the dead time could be reduced by using
faster scintillator and faster circuit.
3 Tracer Kinetic Modeling
3.1 Limited System Resolution
Ideally, after all corrections discussed above being performed to the PET data prior to
the reconstruction of the image, the activity concentration should be proportional to the
absolute activity in the volume of interest (VOI), which can then be calibrated to yield the
true activity information. Due to limited system resolution, quantification of PET data is
subject to partial volume (PV) and spillover effects (SP) which may cause overestimation
or underestimation of activity concentration, depending on the distribution of activity in
the VOI.
The design of scanner geometry, the properties of detectors and coincidence circuit
will together contribute to the final resolution. The factors that determine system spatial
resolution can be divided into two main components: geometric and physical. The final
system resolution is the convolution of all the factors affecting resolution response
function including both geometric and physical components.
3.1.1 Geometric Component
The geometric component is the best possible resolution that can be achieved for a
particular scanner design using ideal detection elements [26].
For a detector pair of interests, the geometric resolution between the detector pairs can
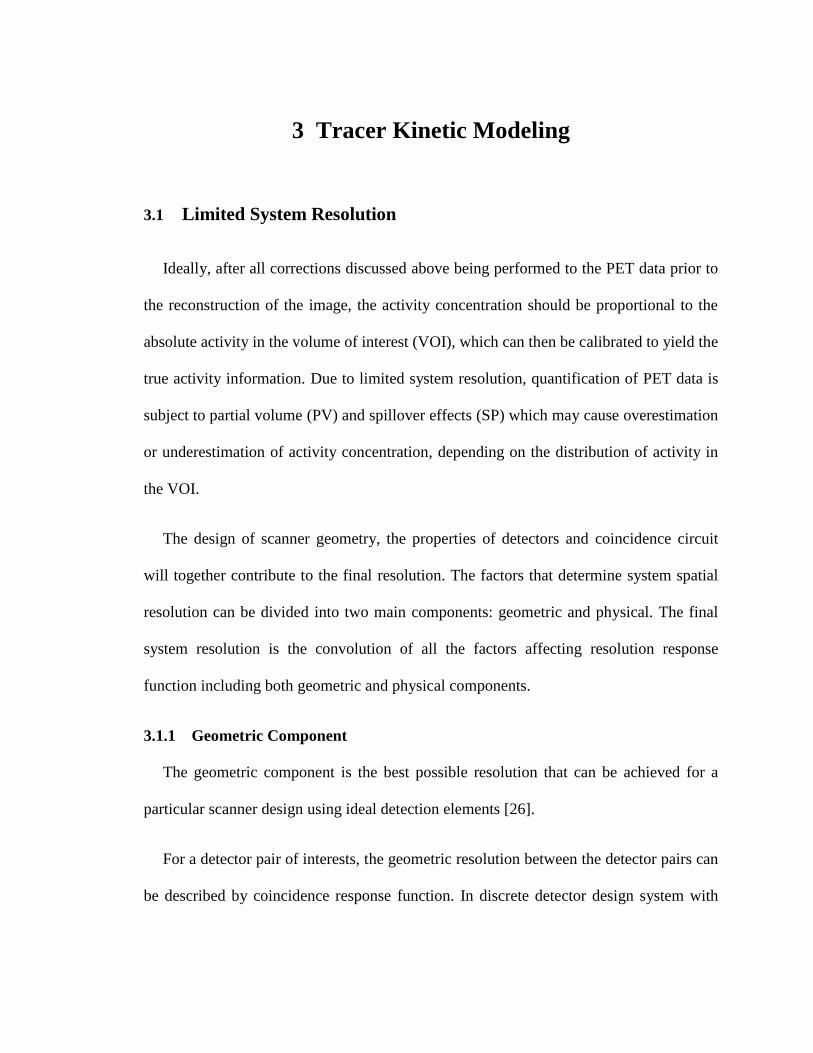
be described by coincidence response function. In discrete detector design system with
detector size w, the coincidence response function is the possibility of the event is
detected by detector pair of interest when the event is moving along the detector width.
Figure 3-1 The change of response function when the event approaches the surface of the detector. (A)
discrete design system; (B) continuous design system [26].
In the middle of the two detectors, the geometric resolution can be described by a
triangular shaped coincidence response function with full width at half maximum

(FWHM) = 2w , and as the source is approaching either detector surface, the response
function becomes trapezoidal and eventually becomes a square function on the surface of
detector with FWHM equals w. In continuous design systems, the coincidence response
function can be described by a Gaussian with FWHM equals 2w . As approaching the
detector surface, the coincidence response functions become broader and eventually
become to have FWHM equals w [26]. Therefore, the detector size w is a limit factor for
the intrinsic spatial resolution in both discrete and continuous design systems.
Figure 3-2 Depth of interaction effect.

Another geometric effect that degrades spatial resolution is called depth of interaction
[26], caused by the thick scintillation crystals used for detectors. In the center of a ring
design system, the annihilation photons will penetrate detectors perpendicular to the
detector surface. When the source has a radial offset, the detector pair of interest is placed
with an oblique angle to the line of response, and the annihilation photons may penetrate
through the first detector interacted and then be detected by the adjacent detector.
The depth of interaction effect leads to mispositioning of events because the event is
assigned to position on an LOR other than the true LOR. The other consequence is the
coincidence response function becomes broader, because the detector is presenting a
larger area to the LOR than the ideal perpendicular direction when the annihilation
photons incident from an angle respect to the detector surface, which degrades the system
spatial resolution. So the amount of decrease of resolution when the source is moving
away from ring center depends on the scintillator size, absorption properties and
geometry of the scintillation crystals. Also, PET systems using other scanner geometries
like polygonal geometry suffer from the same problem. The center of FOV has the best
system spatial resolution.
3.1.2 Physical Component
Based on the schematic of radiation detection, there are two physical effects lead to
errors in determining the spatial information of coincidence event, which can degrade the
system spatial resolution of PET systems.
The first effect is called positron range [59], and it is the distance from the site of
positron emission to the site of annihilation. In 511 keV photons detection, scanner

records the annihilation photons which define the line along the site of annihilation, not
the decaying atom. Note here used the assumption that annihilation and photon emission
happen in the same place. As the positrons travel through the object material, they give
up their kinetic energy principally by Coulomb interactions with surrounding electrons.
Since positrons have the same rest mass as electrons, the positrons may have undergone
multiple direction-changing interactions and follow a tortuous path before eventually
annihilating with electrons. Thus, there is an offset between where the photons are
emitted and where the annihilation takes place blurring the final image.
Figure 3-3 Positron range. It is radionuclide dependent: higher positron energy leads to larger positron
range.
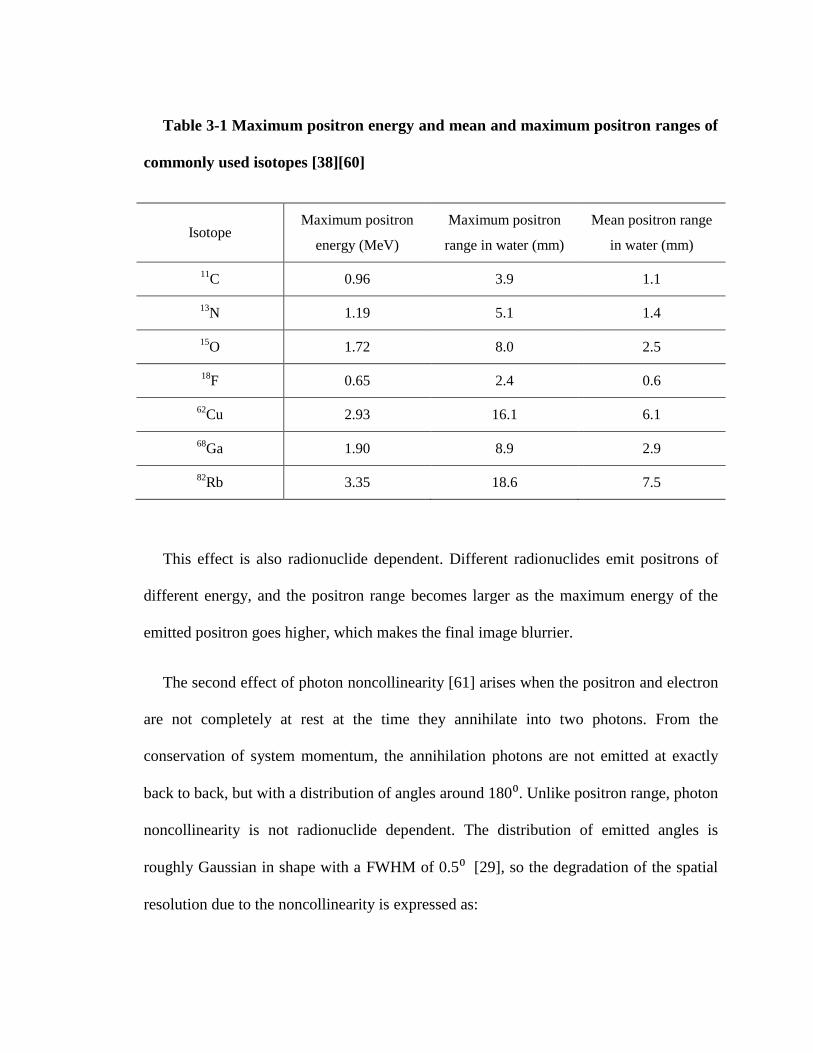
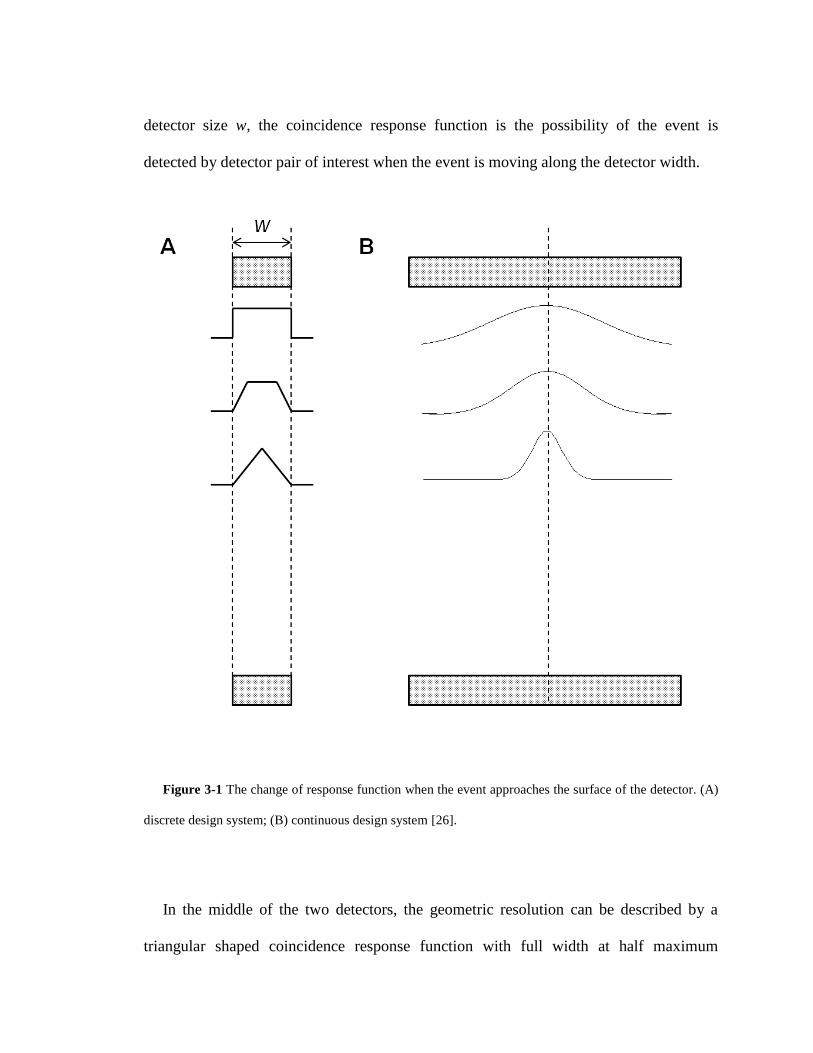
Table 3-1 Maximum positron energy and mean and maximum positron ranges of
commonly used isotopes [38][60]
Isotope Maximum positron
energy (MeV)
Maximum positron
range in water (mm)
Mean positron range
in water (mm)
11C 0.96 3.9 1.1
13N 1.19 5.1 1.4
15O 1.72 8.0 2.5
18F 0.65 2.4 0.6
62Cu 2.93 16.1 6.1
68Ga 1.90 8.9 2.9
82Rb 3.35 18.6 7.5
This effect is also radionuclide dependent. Different radionuclides emit positrons of
different energy, and the positron range becomes larger as the maximum energy of the
emitted positron goes higher, which makes the final image blurrier.
The second effect of photon noncollinearity [61] arises when the positron and electron
are not completely at rest at the time they annihilate into two photons. From the
conservation of system momentum, the annihilation photons are not emitted at exactly
back to back, but with a distribution of angles around 180⁰. Unlike positron range, photon
noncollinearity is not radionuclide dependent. The distribution of emitted angles is
roughly Gaussian in shape with a FWHM of 0.5⁰ [29], so the degradation of the spatial
resolution due to the noncollinearity is expressed as:
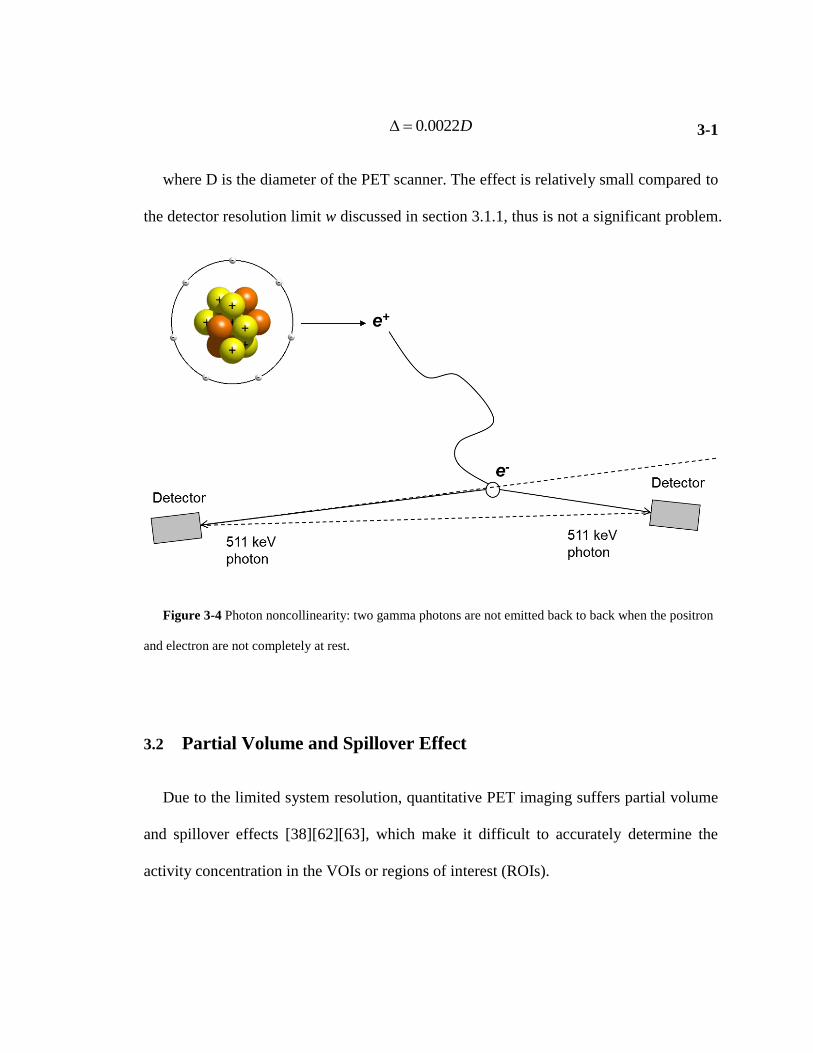
D0022.0 3-1
where D is the diameter of the PET scanner. The effect is relatively small compared to
the detector resolution limit w discussed in section 3.1.1, thus is not a significant problem.
Figure 3-4 Photon noncollinearity: two gamma photons are not emitted back to back when the positron
and electron are not completely at rest.
3.2 Partial Volume and Spillover Effect
Due to the limited system resolution, quantitative PET imaging suffers partial volume
and spillover effects [38][62][63], which make it difficult to accurately determine the
activity concentration in the VOIs or regions of interest (ROIs).

In the measurement of radioactive sources in the scanner, the intensity of the images
reflects not only about the concentration but also the distribution in the measured volume
and immediate adjacent volume. The annihilation events will be determined within a
small region around their actual sites due to the schematic of radioactive detection. For
objects that are small compared to the resolution volume of the PET scanner, the
radionuclide's information is spread over a volume greater than the object. Although the
total amount of measured activity stays the same, the measured radioactivity
concentration should be lower than the true concentration. For the objects that are large
compared to the resolution volume, the center radioactivity concentration could be
accurately measured, while the edge of the objects appears to have lower than the actual
concentration due to the spread over of radionuclides location information.
In a simulation work, a smoothing 10 mm filter has been applied to simulate a 10 mm
resolution system [26]. The concentration of larger objects is accurately measured,
although there is smearing on the edge. However, as the source becomes smaller, the
measured concentration diminishes and only partial concentration can be recovered in the
images.
The partial volume (PV) effect is characterized by recovery coefficient (RC):
ionconcentratactivtyTrue
ionconcentratactivitypeakMeasuredRC
3-2
The RC is a function of object size and the resolution of PET system, which can be
characterized by phantom study for a particular PET system. It is crucial to correct for
partial volume effect to prevent from underestimation of activity concentration when the
object size is comparable to the system resolution.
When the ROI or VOI is surrounded by tissue with radioactivity, the problem gets
more complicated. It is necessary to do corrections for not only the partial volume effect,
but also the cross contamination or activity spillover from the surrounding regions with
radiotracer uptake into the region of interest. This is called spillover (SP) effect [62].
3.3 Tracer Kinetic Modeling
The spatial distribution of radioactive tracer in the object depends on the uptake,
utilization and washout dynamics of the tracer inside body. The time-dependent
radioactive concentration functions of tissue and blood yield information about the
biological process of interest, especially the rate of change of tracer concentration usually
directly reveals the rate of a specific metabolic process of interest. Therefore the
radiopharmaceutical should be chosen wisely and the PET data should be analyzed
carefully.
3.3.1 3-Compartment Model
Tracer kinetic modeling is commonly used for quantitative evaluation of dynamic PET
data [64][65][66]. Most models in use are compartment models with first order of kinetic
parameter indicating the exchange rate of radiotracer between compartments.
Following a general approach of a 3-compartment glucose transport model [67] for
evaluating FDG metabolism in the heart (Figure 3-5), the differential equations for FDG
transport can be written as:

Figure 3-5 The schematic block diagram of 3-compartment FDG model. It indicates the rate
constants, K1-k4, between the 3 compartments of the FDG kinetic model.
)()()()()(
4321 tCktCkktCkdt
tdCmea
e 3-3
)()()(
43 tCktCkdt
tdCme
m 3-4
The three compartments shown in Figure 3-5 can be described as equation 3-3 and 3-4:
Ca(t) is the FDG concentration in the vascular space, Ce(t) is the concentration of FDG in
the interstitial and cellular spaces and Cm(t) is the FDG concentration within the cell of
the phosphorylated FDG-6-Phosphate. k1 and k2 are the forward and reverse rate
constants respectively between the first two compartments. k3 and k4 are the rates of
phosphorylation and de-phosphorylation between compartments 2 and 3. Ce(t) and Cm(t)
can be solved in terms of Ca(t) and the rate constants, k1-k4:
Rewriting equation 3-4:
)()(
)( 43 tCkdt
tdCtCk m
me 3-5

)()()(
)()(
)()()(
4343213
42
2
3
tCkktCkdt
tdCkktCkk
dt
tdCk
dt
tCd
dt
tdCk
mmm
a
mme
3-6
Taking derivative of equation 3-6 and reorganizing gives:
0)()()(
)()(
31424322
2
tCkktCkkdt
tdCkkk
dt
tCdam
mm 3-7
Consider the characteristic equation of 3-7:
0)( 42432
2 kkxkkkx 3-8
has two solutions –α1, -α2, where
42
2
4324321,2 4)(2
1kkkkkkkk
3-9
and the solutions for characteristic equation are t
ey 1
1
and
tey 2
2
Use Green’s kernel: 12
21
tt
ee and )()( 21 tCkktf a
)()()()( 21
12
31
0tCee
kkdftktC a
ttt
m
3-10
)(])()[( 21
432143
12
1 tCekkekkk
CCC a
tt
met
3-11

ki is the net myocardium tissue concentration. Assuming the rate of de-
phosphorylation k4 =0 in equilibrium status, which is commonly true in this case, the net
myocardial FDG influx constant ki [68], can be written as:
)( 3231 kkkkki 3-12
3.3.2 Correction for Partial Volume and Spillover Effects
In a situation where there is no PV or SP, when a region of interest is drawn within the
cavity of the left ventricle, the image derived input function (IDIF) would equal the
whole-blood time activity curve Ca(t). However, due to SP and PV effects, the model
equation for an image-derived time activity curve from the blood pool can be written in
terms of fraction of the tissue concentration in the blood compartment and partial
recovery of radioactivity concentration from the blood as:
i
b
i
e
t
t
abmemb
iIDIFtt
dtCrtCtCS
m
ie
ib
]))()(([
,
3-13
and similarly for the myocardium tissue, one can write the model equation as:
i
b
i
e
t
t
abmmem
imyott
dtCStCtCr
m
ie
ib
]))()(([
,
3-14
rm, rb, are the recovery coefficients (accounting for PV effect) for the myocardium and
blood pool respectively. Sbm, Smb are the SP coefficients from the blood pool to the
myocardium and vice versa respectively. tbi and tei are the beginning and end times

respectively for frame i in a dynamic PET scan. Equation 3-13 and 3-14 represent the
average radioactivity during the time of frame i, which matches the way with image
derived raw data. The model equation for the blood input function can be written for 3-
compartment model as [69]:
otherwiseeAeAeAAtA
tifC
tLtLtLa ,)(
,0
)(
3
)(
2
)(
321321
3-15
where each of the terms determines the amplitude, shape and wash-out of the tracer
over time. The model equations can be fitted to the blood (PETIDIF) and myocardium
(PETmyo) time activity curves (TACs) obtained from OSEM-MAP cardiac and respiratory
gated PET images with attenuation correction, as indicated below:
n
myomyoIDIFIDIF PETmPETmpO1
22 ])()[()(
3-16
Minimization of equation 3-16 results in simultaneous estimation of the blood input
function, and compartment model parameters k1-k4 and hence ki along with the SP and
PV coefficients (Smb, rb, Sbm, rm).
4 Optimization of a Model Corrected Blood Input
Function from Dynamic FDG-PET Images of Small
Animal Heart in vivo
4.1 Introduction
Tracer kinetic modeling is commonly used for quantitative evaluation of dynamic PET
data. The estimation of kinetic rate constants requires an accurate knowledge of the blood
input function. However, quantitation of dynamic PET data of the mouse heart in vivo is
challenging due to the small size of the heart and the limited system resolution of the PET
scanner [70][71].As a result, the image-derived blood input function (IDIF), which is the
same as blood pool (BP) time activity curve (TAC), is susceptible to partial volume (PV)
effect and spill-over (SP) radioactivity [72] from the surrounding myocardium tissue and
vice versa. Also, cardiac and respiratory motion can cause further cross contamination
between BP and myocardium by blurring the images. Although invasive arterial blood
sampling is the gold standard for measuring the blood input function [73], it requires
extensive animal handling. Hybrid imaging method is another technique which is a
combination of the image-derived approach at the early time points and blood sampling
at the late time points in a dynamic PET scan [74]. Factor Analysis is an image-derived
approach which lacks the ability to account for the significant SP into the blood from the
surrounding left ventricle (LV) and the right ventricle (RV) at the early time points [75].
Earlier work by El Fakhri et al [76] also accounted for blood volume contribution from
both the RV and LV into the tissue, but did not account for SP contamination from the
tissue to the blood in a factor analysis approach to measure myocardial perfusion using
82Rb PET in a 2-compartment kinetic model.
The effect of iterative OSEM-MAP reconstruction algorithm on IDIF has been
reported by Stout et al [77] and more recently by Shogi et al [78]. The authors reported
significant SP contamination from the tissue to the blood especially at the late time points,
in spite of using iterative algorithm. In an earlier work from our laboratory, we
established the significance of cardiac gating and OSEM-MAP reconstruction algorithm
in reducing SP contamination in IDIF [79]. Recent work by Fang et al concluded that a
compartment model corrected blood input function when applied to IDIFs obtained from
high-resolution images with less severe PV recovery and SP contamination, may result in
an improved estimate of the downstream FDG influx constant [80]. The combined effect
of resolution and model correction with correct bounds for PV recovery and SP
contamination on the estimation of input function and FDG influx constant, has not been
shown to-date. In this study, we optimized a compartment model which can
simultaneously account for SP and PV effects for both BP and the myocardial tissue,
compute kinetic rate parameters and generate model corrected blood input function
(MCBIF) from OSEM-MAP cardiac and respiratory gated 18
F-FDG PET images of the
mouse heart with attenuation correction in vivo, without the need for any invasive blood
sampling. We validate our methodology by blood sampling and also measure the
downstream rate of myocardial FDG uptake. We compare our results with the usual
method of performing FBP reconstruction without gating [80].

4.2 Materials and Methods
All experiments were performed in compliance with the Guide for the Care and Use of
Laboratory Animals, published by the National Institutes of Health and was conducted
under protocols approved by the Institutional Animal Care and Use Committee at the
University of Virginia.
4.2.1 Arterial and Venous Blood Sampling
Tracer kinetic modeling used in conjunction with positron emission tomography (PET)
imaging is an excellent tool for the noninvasive quantification of physiological and
molecular processes and their alterations due to disease. These kinetic models require
two key measurements of tracer activity over time: tracer activity in the arterial blood
(input function) and tracer activity in the organ or tissue of interest [72]. Direct blood
sampling is considered the reference standard for obtaining the input function, however
for small animal 18F-FDG studies, this procedure is challenging because of the small size
of the blood vessels and the limited blood volume. Invasive surgery is required to insert
the catheter into the femoral or carotid artery which is time-consuming, technically
difficult, and is also challenging for the animal. In addition, the loss of blood through
sampling may perturb the physiology and compromise the experimental outcome.
Blood input functions can be measured from PET images using methods that are not
as well established as direct blood sampling. Using the left ventricular blood pool as the
largest available vascular space, we can draw regions of interest on dynamic PET images
to extract the blood input function. This technique offers a non-invasive way to estimate
the blood input function and drastically simplifies the overall protocol. Because the LV
is small compared to the scanner spatial resolution, we must take additional steps to
correct for possible errors in the image-derived blood input function. We have taken a
phantom based approach to correct for partial volume effects, or incomplete recovery of
the total radioactivity in the LV blood pool and the myocardial wall due to their small
size (~1 mm) comparable to the system resolution of the MicroPET scanner (1.32 mm
FWHM in the center of the FOV) [71]. In order to replace invasive blood sampling with
the non-invasive, imaging-based technique of determining the blood input function, we
must directly compare the two techniques in living mice.
The surgical procedure for arterial blood sampling to validate the image-derived blood
input function obtained from dynamic PET images was performed as follows: Prior to
surgery, anesthesia was induced with 3% Isoflurane in Oxygen (0.5-0.8 L/ min) and
maintained at 1.5% - 2.5% Isoflurane. Animals were carefully checked for pain response
by toe and tail pinch prior to surgery and monitored for respiration and color throughout.
Surgery was performed on a thermostatically controlled operating table maintained at 37-
39 oC. Hair from the surgery area was removed and cleaned with alcohol (this was a non-
survival surgery). An incision was made in the neck or the groin and the carotid or
femoral artery exposed by blunt dissection. A catheter was formed from PE-50 tubing
with the end stretched and placed in the carotid or femoral artery. The artery was tied off
above the insertion site with 7-0 prolene and temporarily occluded distal to the insertion
site using clamps or pressure from an untied ligature. The catheter was ligated in place
with prolene in three places and all clamps removed. The incision was closed with
prolene suture. Following the surgery the animal was placed in prone position in the

MicroPET scanner and a dynamic acquisition over 60 minutes initiated. Seventeen blood
samples (< 30 μL each) were taken over the course of the scan by the following schedule:
3 blood samples were taken at 20, 40 and 60 seconds during tail-vein injection of FDG,
then every minute up to 10 minutes and then 1 sample was taken every 10 minutes until
the 60 minute mark. Blood draws are followed by flushing the catheter with a small
volume of heparinized saline. Blood loss volume was replaced with an equal volume of
sterile saline at the end of the first 10 min period. Each whole-blood sample is weighed
and its FDG activity measured in a gamma counter (2480 Wizard, Perkin Elmer Inc.).
Since arterial blood sampling was very challenging we resorted to venous blood samples
from the tail-vein, at 43 and 56 minutes post FDG administration in n=6 mice, when the
SP from the tissue to the blood is expected to be maximum [77]. Also, Fang et al [80]
showed earlier that arterial blood is well approximated by venous blood at late time
points.
4.2.2 Imaging Protocols
Following the protocol in [80], the animals were fasted overnight with only access to
water. PET scans were performed between 9 a.m. and 5 p.m. on anesthetized animals. We
used a similar imaging protocol as described in [79] except for using a different
anesthesia and respiratory gating in addition to cardiac gating. Briefly, n=6 adult
C57BL/6 male mice (9 to 10 weeks of age) obtained from Charles River, with ECG
surface electrodes (Blue Sensor, Ambu Inc., Glen Burnie, MD) and a respiratory pillow
attached to their limbs and chests respectively, were imaged using a MicroPET Focus-
F120 scanner (Siemens, Inc.) under sevoflurane anesthesia [82]. Transmission scan using
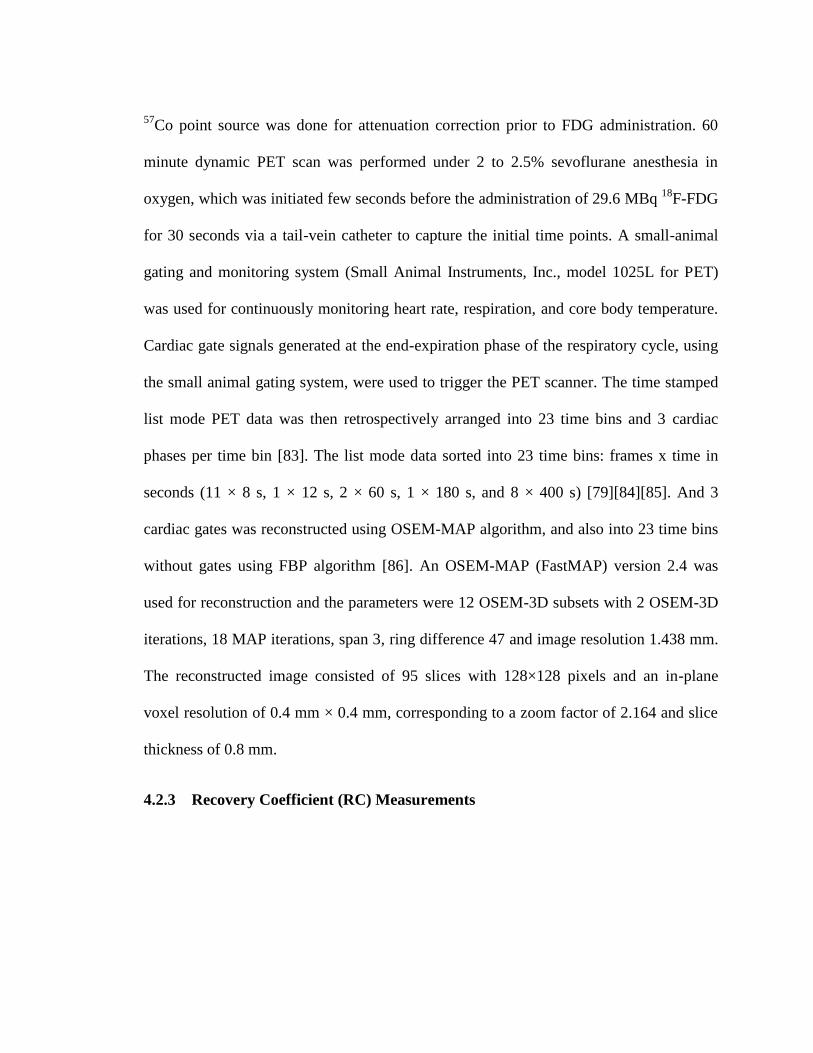
57Co point source was done for attenuation correction prior to FDG administration. 60
minute dynamic PET scan was performed under 2 to 2.5% sevoflurane anesthesia in
oxygen, which was initiated few seconds before the administration of 29.6 MBq 18
F-FDG
for 30 seconds via a tail-vein catheter to capture the initial time points. A small-animal
gating and monitoring system (Small Animal Instruments, Inc., model 1025L for PET)
was used for continuously monitoring heart rate, respiration, and core body temperature.
Cardiac gate signals generated at the end-expiration phase of the respiratory cycle, using
the small animal gating system, were used to trigger the PET scanner. The time stamped
list mode PET data was then retrospectively arranged into 23 time bins and 3 cardiac
phases per time bin [83]. The list mode data sorted into 23 time bins: frames x time in
seconds (11 × 8 s, 1 × 12 s, 2 × 60 s, 1 × 180 s, and 8 × 400 s) [79][84][85]. And 3
cardiac gates was reconstructed using OSEM-MAP algorithm, and also into 23 time bins
without gates using FBP algorithm [86]. An OSEM-MAP (FastMAP) version 2.4 was
used for reconstruction and the parameters were 12 OSEM-3D subsets with 2 OSEM-3D
iterations, 18 MAP iterations, span 3, ring difference 47 and image resolution 1.438 mm.
The reconstructed image consisted of 95 slices with 128×128 pixels and an in-plane
voxel resolution of 0.4 mm × 0.4 mm, corresponding to a zoom factor of 2.164 and slice
thickness of 0.8 mm.
4.2.3 Recovery Coefficient (RC) Measurements
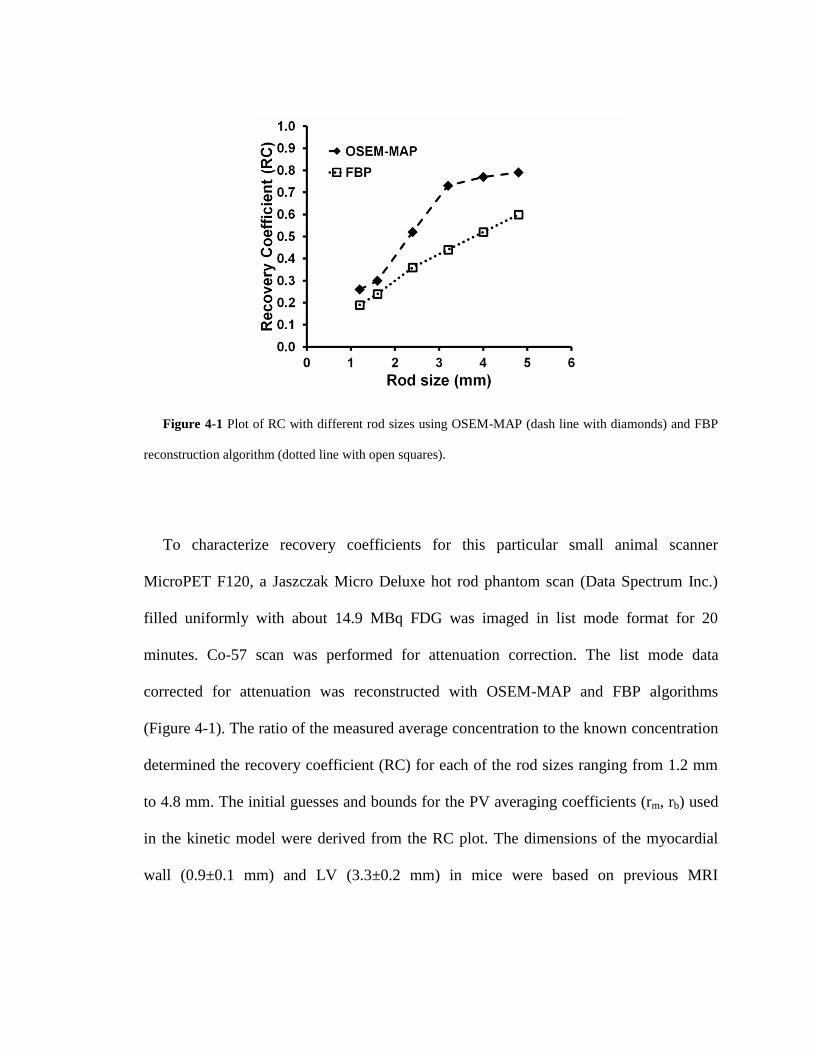
Figure 4-1 Plot of RC with different rod sizes using OSEM-MAP (dash line with diamonds) and FBP
reconstruction algorithm (dotted line with open squares).
To characterize recovery coefficients for this particular small animal scanner
MicroPET F120, a Jaszczak Micro Deluxe hot rod phantom scan (Data Spectrum Inc.)
filled uniformly with about 14.9 MBq FDG was imaged in list mode format for 20
minutes. Co-57 scan was performed for attenuation correction. The list mode data
corrected for attenuation was reconstructed with OSEM-MAP and FBP algorithms
(Figure 4-1). The ratio of the measured average concentration to the known concentration
determined the recovery coefficient (RC) for each of the rod sizes ranging from 1.2 mm
to 4.8 mm. The initial guesses and bounds for the PV averaging coefficients (rm, rb) used
in the kinetic model were derived from the RC plot. The dimensions of the myocardial
wall (0.9±0.1 mm) and LV (3.3±0.2 mm) in mice were based on previous MRI
measurements [87]. These dimensions are consistent with published work using
ultrasound in mice of similar age and strain [88].
4.3 Data Analysis
Regions of interest (ROI) in the region corresponding to the left ventricle BP and the
myocardium were drawn on short-axis slices in the last frame and the last gate of the
dynamic image data and time activity curves (TAC) generated for the whole scan
duration of 60 minutes. The blood pool ROIs were round shape of diameter
approximately 1.6 mm located in the middle of the LV cavity, and the myocardium ROIs
were donut shape of inner diameter ~ 3.2 mm and outer diameter ~ 5.6 mm drawn along
the LV wall.
The initial guesses and bounds for all the parameters used in the optimization routine
are shown in Table 4-1. Minimization of equation 3-12 results in simultaneous estimation
of the blood input function, and compartment model parameters k1-k4 and hence ki along
with the SP and PV coefficients (Smb, rb, Sbm, rm).
The general formalism described above is following [80] and [88], however the main
difference lies in choosing correct PV bounds for the myocardium and the blood pool,
based on the reconstruction algorithm Figure 4-1, in equation 3-16, as opposed to
arbitrary bounds used in [80][89]. The difference also lies in using IDIF from high
resolution gated images as opposed to the normal method of relying on IDIFs from FBP
un-gated images.
Table 4-1 Initial guess values and bounds for parameters used in the optimization
routine applied to OSEM-MAP gated images
Parameter k1
(1/min)
k2
(1/min)
k3
(1/min)
k4
(1/min) Smb rb rm Sbm
Initial
value 0.01 0.01 0.001 0.001 0.5 0.75 0.3 0.5
Upper
bound 1 1 1 0.001 1 0.9 0.4 1
Lower
bound 0 0 0 0 0 0.6 0.15 0
Parameter A1
(MBq/min/mL)
A2
(MBq/mL)
A3
(MBq/mL)
L1
(1/min)
L2
(1/min)
L3
(1/min)
τ
(min)
Initial
value 111 0.296 0.259 -27 -0.55 0.04 0.15
Upper
bound 500 500 100 0 0 0 0.5
Lower
bound 0 0 0 -200 -10 -10 0
The optimization was performed by minimizing the objective function 3-16 in the
MATLAB programming environment using the function “fmincon”, which is based on an
interior-reflective Newton method. The initial guesses and bounds for the PV averaging
coefficients (rm, rb) are determined beforehand by performing phantom experiments [79].
We have kept the bounds for all the kinetic parameters (k1-k4) and SP factors (Sbm, Smb)
open between 0 and 1. As for the input function, one side of the bounds is determined by

the distribution of the input function (A1, A2, A3 > 0 and L1, L2, L3 < 0) while the other
side is wide open. Minimization of equation 3-16 results in simultaneous estimation of
the blood input function equation 3-15, and compartment model parameters k1-k4 and
hence ki along with the SP and PV coefficients, without the need for any blood sampling.
4.4 Results
Figure 4-1 shows a plot of the RC obtained using OSEM-MAP and FBP
reconstruction algorithms as a function of the rod size. The plot indicates that OSEM-
MAP results in improved PV recovery as compared to FBP over the entire range. The
initial guess values and the bounds used in the optimization routine for the two different
algorithms were determined from this plot.
Representative results of comparison between TACs derived from dynamic gated PET
images (Figure 4-2 E) (PETIDIF and PETmyo TAC) and model corrected output time
activity curves obtained (Modelblood and Modelmyo) of mouse left ventricle BP and
myocardium respectively, are shown in Figure 4-2 E. Arterial blood samples collected
over the whole scan duration for one mouse compared with the MCBIFs applied to the
IDIFs obtained from OSEM-MAP gated image and from FBP un-gated image are shown
in Figure 4-2 F. The figure indicates that, in this animal, MCBIF from OSEM-MAP gated
image matches late time points better than FBP un-gated image.
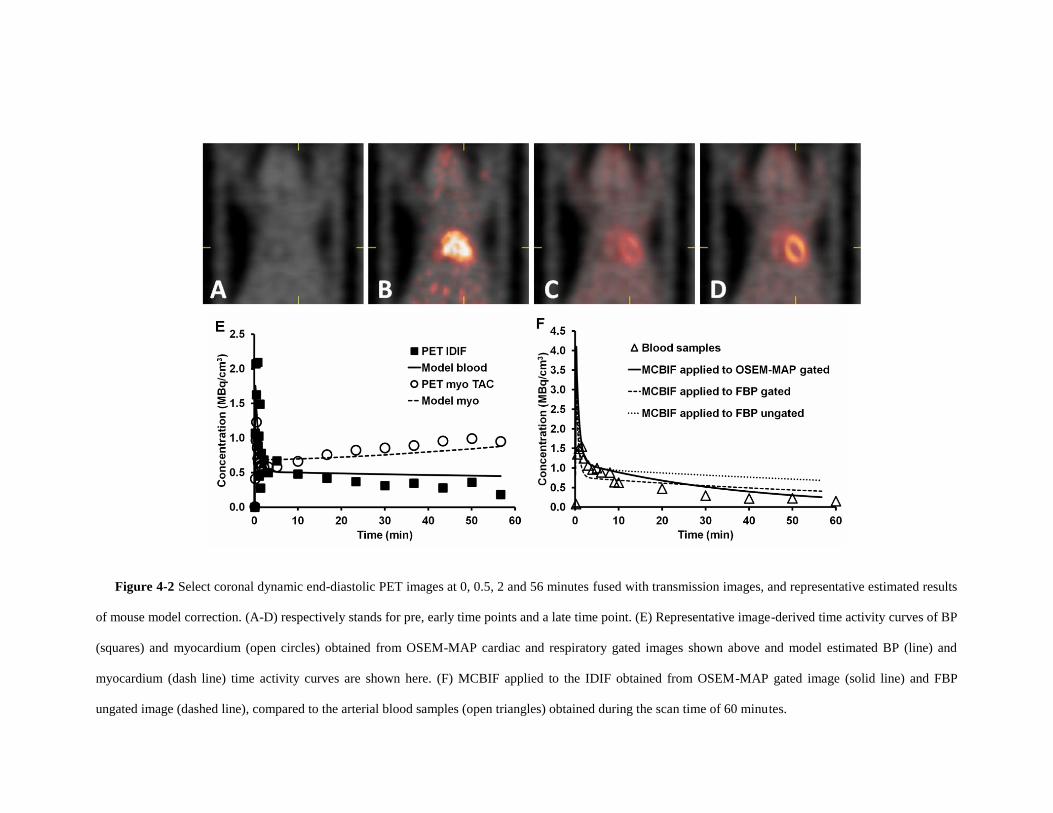
Figure 4-2 Select coronal dynamic end-diastolic PET images at 0, 0.5, 2 and 56 minutes fused with transmission images, and representative estimated results
of mouse model correction. (A-D) respectively stands for pre, early time points and a late time point. (E) Representative image-derived time activity curves of BP
(squares) and myocardium (open circles) obtained from OSEM-MAP cardiac and respiratory gated images shown above and model estimated BP (line) and
myocardium (dash line) time activity curves are shown here. (F) MCBIF applied to the IDIF obtained from OSEM-MAP gated image (solid line) and FBP
ungated image (dashed line), compared to the arterial blood samples (open triangles) obtained during the scan time of 60 minutes.

Figure 4-3 Residual plot shows the difference between MCBIF applied to OSEM-MAP cardiac and
respiratory gated images (diamonds) and FBP un-gated images (open squares), when compared to the 2 late
venous blood samples obtained at 43 and 56 minutes post FDG administration.
A residual plot of MCBIF applied to OSEM-MAP gated images, when compared to
the two late venous blood samples obtained from n = 6 mice, is shown in Figure 4-3. The
analysis reveals an average difference of 0.017 MBq/ cm3. The precision (standard
deviation of differences) was calculated to be 0.13 MBq/ cm3. The figure also shows the
analysis obtained from FBP un-gated images. An average difference of 0.28 MBq/ cm3
and precision of 0.33 MBq/ cm3 were obtained from FBP un-gated data sets. The residual
plot exhibits the quantitative accuracy and repeatable behavior of MCBIF when applied
to OSEM-MAP gated images.
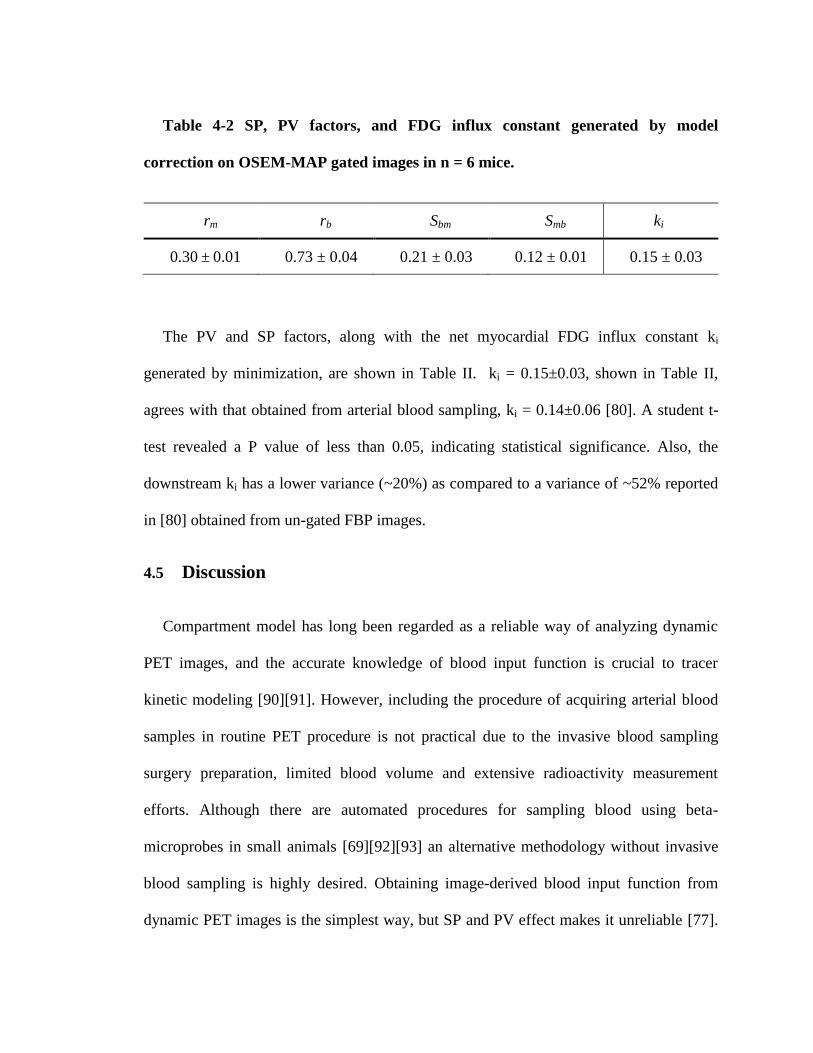
Table 4-2 SP, PV factors, and FDG influx constant generated by model
correction on OSEM-MAP gated images in n = 6 mice.
rm rb Sbm Smb ki
0.30 ± 0.01 0.73 ± 0.04 0.21 ± 0.03 0.12 ± 0.01 0.15 ± 0.03
The PV and SP factors, along with the net myocardial FDG influx constant ki
generated by minimization, are shown in Table II. ki = 0.15±0.03, shown in Table II,
agrees with that obtained from arterial blood sampling, ki = 0.14±0.06 [80]. A student t-
test revealed a P value of less than 0.05, indicating statistical significance. Also, the
downstream ki has a lower variance (~20%) as compared to a variance of ~52% reported
in [80] obtained from un-gated FBP images.
4.5 Discussion
Compartment model has long been regarded as a reliable way of analyzing dynamic
PET images, and the accurate knowledge of blood input function is crucial to tracer
kinetic modeling [90][91]. However, including the procedure of acquiring arterial blood
samples in routine PET procedure is not practical due to the invasive blood sampling
surgery preparation, limited blood volume and extensive radioactivity measurement
efforts. Although there are automated procedures for sampling blood using beta-
microprobes in small animals [69][92][93] an alternative methodology without invasive
blood sampling is highly desired. Obtaining image-derived blood input function from
dynamic PET images is the simplest way, but SP and PV effect makes it unreliable [77].
In this study we proposed a reliable and practical method, which can simultaneously
correct for the SP and PV effects and generate kinetic rate constants without any invasive
blood sampling.
A recent study by Shogi et al indicated that IDIFs obtained from high-resolution
images still have about 15-20% SP contamination in them [78]. We showed, for the first
time, that model correction on high resolution FDG PET gated images with correct PV
bounds, models the wash-in and wash-out dynamics of the tracer from mouse blood,
without the need for any blood sampling (equation 3-16) as opposed to [80]. Our study
compares the gold standard blood input function obtained by arterial blood sampling
from a single mouse and model corrected estimate of blood input function, for validation
purposes only. Since the arterial blood samples are well approximated by venous blood at
the late time points [80], we established statistical significance by sampling blood from
the tail-vein at 43 min and 56 min, with same time points on MCBIF in n=6 mice. The
residual plot indicates that MCBIF applied to OSEM-MAP gated images are repeatable
compared to that obtained from FBP un-gated images. The downstream rate of
myocardial FDG influx, Ki is not only quantitative but also repeatable as indicated in the
results section.
The kinetic model proposed in this study may also be adapted to different PET tracers
such as 13
N-ammonia for measuring myocardial perfusion or 11
C-acetate for measuring
flow and oxygen consumption in vivo [93]. The kinetic rate constants and compartments
can be adjusted to adapt to different metabolic processes for different tracers, while the
form of the equations of the model corrected image-derived heart ventricle and image-

derived tissue time activity would have a similar form. Also, the initial values and
optimization bounds should be modified when switching to other tracers or animal
models. In addition, blood samples from a number of experimental subjects may be
necessary to validate model output estimates. Nevertheless, application of this technique
to other scanners and isotopes would require careful validation since positron range and
depth of interaction will be different for other isotopes and scanners.
4.6 Conclusions
MCBIF applied to OSEM-MAP gated images correctly accounts for the shape, wash-
in and wash-out dynamics of FDG from mouse blood without the need of any invasive
blood sampling. Lower SP of radioactivity from the myocardium to the BP and higher
PV recovery from OSEM-MAP gated images lead to improved MCBIF estimate as
compared to that obtained from un-gated FBP images in a dynamic PET scan of the
mouse heart.

5 Early Detection of Metabolic Remodeling in a Mouse
Model of Pressure Overload Left Ventricular
Hypertrophy in vivo
5.1 Introduction
Myocardial hypertrophy is considered initially an adaptive response to stress. When
stress is sustained, however, hypertrophy becomes maladaptive. Both functional and
structural changes are accompanied by changes in energy substrate metabolism. A
hallmark finding in myocardial hypertrophy is a shift away from fatty-acid to glucose
oxidation [94]. Based on earlier work ex vivo, we have proposed that this metabolic
remodeling precedes and triggers left ventricle (LV) structural and functional remodeling
in pressure overload left ventricular hypertrophy (LVH) and induces the fetal gene
program [95][96][97]. However, this hypothesis has never been evaluated in vivo. For
this purpose we used the mouse model of left ventricular pressure overload after
transverse aortic constriction (TAC) as a clinically relevant model to assess metabolism
and function of the heart subjected to pressure overload [98] using 2-[18F] fluoro-
2deoxy-D-glucose (FDG) Positron Emission Tomography (PET) imaging.
A compartmental modeling technique was used to analyze images obtained
dynamically to compute rate of myocardial FDG uptake and utilization. The
quantification of these rates has been limited by two important factors: a) the limited

spatial resolution of the small animal PET scanners [70][71]leading to partial volume (PV)
effects, and b) the spill-over (SP) of radioactivity from the blood pool (BP) to the
myocardium and vice-versa. A major shortcoming of the image-derived blood input
function (IDIF) method is that it is susceptible to SP and PV effects [70].
In this study, a compartment model corrected blood input function (MCBIF) was
optimized, wherein the blood input function with SP and PV corrections and the
metabolic rate constants in a 3-compartment model were simultaneously estimated from
OSEM-MAP cardiac and respiratory gated PET images with attenuation correction
[1][2]. Left ventricular ejection fraction (LVEF) was also measured using high resolution
gated PET images, which enabled us to perform a side-by-side comparison of cardiac
metabolism, and LV function.
5.2 Animal Model
Sixteen adult C57BL/6 male mice (9-10 weeks of age) obtained from Charles River
were imaged at baseline using a MicroPET Focus-F120 scanner (Siemens, Inc.) under
sevofluorane anesthesia [82]. A subset of these mice (n = 11) were subjected to a
transverse aortic constriction (TAC) surgical procedure to induce pressure-overload
hypertrophy [79]. Briefly, mice were anesthetized with isoflurane and intubated for
ventilation. A thoracotomy was performed and a 7-0 silk suture was tied around the
transverse aorta between the proximal and distal carotid arteries against a 27-gauge
needle, after which, the needle was removed. Osmotic mini-pumps containing either
propranolol (5 mg/kg/day) obtained from Sigma Aldrich Inc. (n = 6) or vehicle alone (n =
5) were implanted subcutaneously at the end of surgery. In addition, five sham-operated
animals were subjected to the same surgical protocol, without tying off the suture. Before
and after surgery all mice were kept in a 12 hrs light/12 hrs dark cycle environment.
Prior to imaging, animals were fasted overnight with only access to water [81].
PET scans were performed between 9 a.m. and 5 p.m. on anesthetized animals. All
experiments were performed in compliance with the Guide for the Care and Use of
Laboratory Animals, published by the National Institutes of Health and was conducted
under protocols approved by the Institutional Animal Care and Use Committee at the
University of Virginia.
5.3 MicroPET Imaging Protocol
PET imaging for measuring myocardial FDG uptake and glucose utilization was
carried out using 18F-FDG in the sham, TAC and TAC treated with propranolol mice as
follows: Following the insertion of a tail-vein catheter, ECG surface electrodes (Blue
Sensor, Ambu Inc., Glen Burnie, MD) were placed on both forepaws and the left
hindpaw and a pneumatic respiratory pillow was placed on the animal's chest. 60 minute
dynamic PET scan was performed under 2.5% sevoflurane anesthesia in oxygen [82],
where data acquisition was initiated a few seconds before the slow administration of
about 800 µCi FDG over 30-60 seconds via the catheter. Small Animal Instruments, Inc.,
model 1025L for PET was used for continuously monitoring heart rate, respiration, and
core body temperature (rectal probe). Cardiac gate signals were generated at the end-
expiration phase of the respiratory cycle to time-stamp the PET scanner data for

subsequent retrospective reordering into heart and respiratory-cycle based time-bins [83].
Transmission scan using Co57 point source was done for attenuation correction prior to
FDG administration. The list mode data sorted into 23 time bins (11 × 8 s, 1 × 12 s, 2 ×
60s, 1 × 180 s, and 8 × 400 s) and 3 gates (hence referred to as gated) were reconstructed
using OSEM-MAP algorithm [1][79][86] with attenuation correction. For comparison the
data were also reconstructed using Filtered Back Projection (FBP) algorithm (ramp filter
cutoff at the Nyquist frequency) with the same spatial resolution without gating. The
images were corrected for radioactive decay, random coincidences and dead-time losses
using the MicroPET Manager (Siemens Inc.). Regions of interest (ROI) in the region
corresponding to the LV blood pool (LVBP) and the myocardium were drawn in the last
frame and the last gate of the dynamic image data and time activity curves for the LVBP
and the myocardium were generated for the whole scan duration of 60 minutes. Blood
samples were also collected at around 43 and 56 minutes post FDG administration from
the tail vein to validate the MCBIF. Three blood samples before and 3 blood samples
after the PET scan were drawn by a tail-vein nick to measure blood glucose levels using a
glucometer (Accu-Chek, Roche). The average of these blood glucose readings were used
to compute the rate of myocardial glucose utilization (rMGU).
5.4 Data Analysis
A compartment model corrected blood input function (MCBIF) [1][80] was optimized
in this manuscript (see below), which is based on simultaneous estimation of the blood
input function with SP and PV corrections and the metabolic rate constants. The
formalism for MCBIF was utilized to measure the net myocardial FDG influx, ki and

hence glucose utilization, rMGU, in the sham, TAC, and TAC treated with propranolol
mice in vivo.
End-systolic volumes (ESV) and end-diastolic volumes (EDV) were also measured by
drawing ROIs at the end-systolic and end-diastolic phases of the heart cycle over multiple
slices covering the whole heart from the apex to the base. The volumes obtained in each
phase over multiple slices were summed to obtain net ESV and EDV in micro liters (µl).
The LVEF was measured by:
%100
EDV
ESVEDVLVEF 5-1
5.4.1 Dynamic Data Analysis
The rate of myocardial glucose utilization can then be computed as:
LCGlukrMGU i /][ 5-2
in µmoles/g/min, where [Glu] is the average non-radioactive blood glucose levels
measured using a glucometer and LC is the lumped constant. The lumped constant
corrects the difference of affinity between glucose and FDG to glucose transporters and
the phosphorylating system. In recent years the value of the lumped constant has been
questioned, and it is uncertain which value should be used [99][100][101][102]. In the 3-
compartment model of glucose transfer into cells, the lumped constant is a function of the
correlation between the net and the unidirectional rates of uptake of glucose and glucose
tracers such as FDG. For sake of simplicity, like many investigators we have used LC =1
[103][104].

5.4.2 Statistical Analysis
Statistical analysis was performed using SigmaStat 3.0 (SPSS, Inc, Chicago, IL).
Mean values of ki, [Glu], rMGU and LVEF were calculated with standard error. Two way
repeated measures analysis of variance (ANOVA) and Holm-Sidak post hoc test were
used to compare mean values in the sham, TAC and TAC treated with propranolol groups
at different time points. A p value of less than 0.05 was considered as statistically
significant.
5.4.3 Quantitative Accuracy of MCBIF Applied to IDIF from OSEM-MAP Gated
Images
Representative IDIF’s obtained from OSEM-MAP gated images (line with open
squares) and from FBP un-gated images (line with open circles) with attenuation
correction are shown in Figure 5-1A. MCBIF applied to IDIF obtained from OSEM-
MAP gated (line with solid squares) and FBP un-gated images (line with solid circles) are
also shown in the figure. The venous blood samples at 43 and 56 minutes are shown for
comparison (open triangles). MCBIF applied to the IDIF obtained from high resolution
gated images correctly accounted for the wash-out dynamics of FDG from the blood,
when compared to the late venous blood samples. Fig. 2B shows MCBIF estimation
during the first 5 minutes of the scan, indicating improved PV recovery when applied to
IDIF obtained from OSEM-MAP gated images as compared to that obtained from un-
gated FBP images.
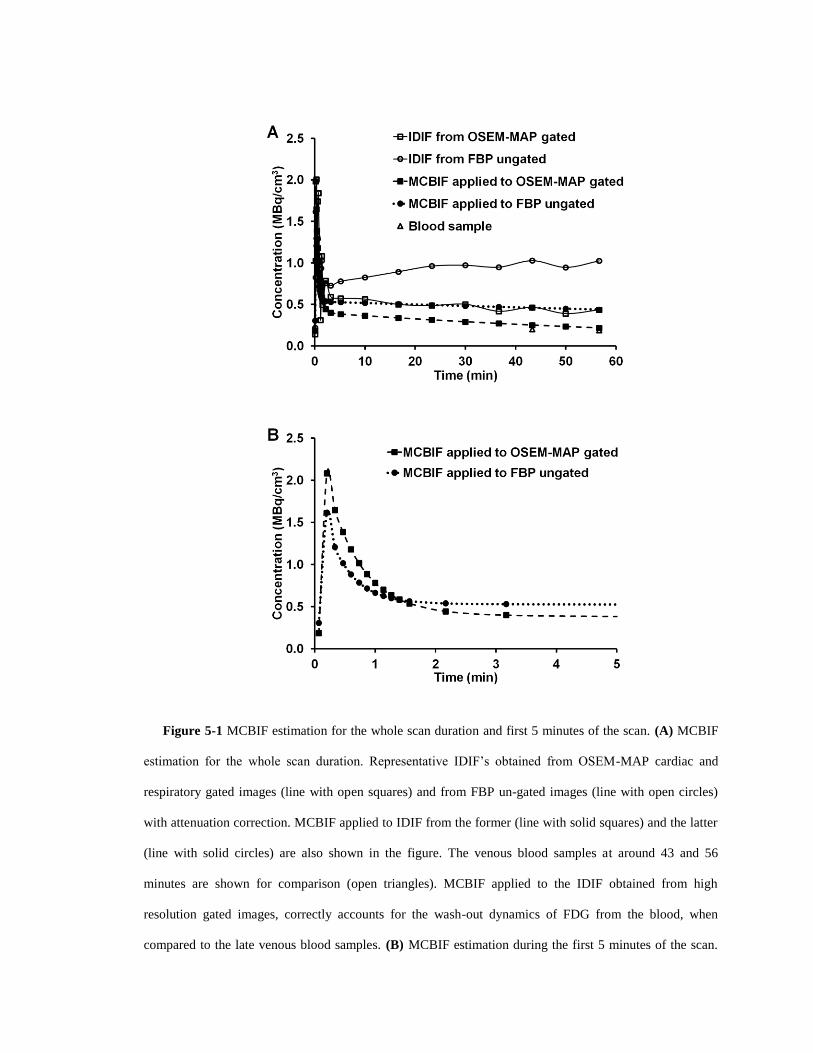
Figure 5-1 MCBIF estimation for the whole scan duration and first 5 minutes of the scan. (A) MCBIF
estimation for the whole scan duration. Representative IDIF’s obtained from OSEM-MAP cardiac and
respiratory gated images (line with open squares) and from FBP un-gated images (line with open circles)
with attenuation correction. MCBIF applied to IDIF from the former (line with solid squares) and the latter
(line with solid circles) are also shown in the figure. The venous blood samples at around 43 and 56
minutes are shown for comparison (open triangles). MCBIF applied to the IDIF obtained from high
resolution gated images, correctly accounts for the wash-out dynamics of FDG from the blood, when
compared to the late venous blood samples. (B) MCBIF estimation during the first 5 minutes of the scan.

The scan indicates improved PV recovery when applied to IDIF obtained from OSEM-MAP gated images
as compared to that obtained from un-gated FBP images.
5.5 Metabolic Remodeling in LVH in Mice In vivo
The measured rate of myocardial FDG uptake, ki (ml/g/min), for the mice in the 3
categories are shown in Figure 5-3(A) over a period of 7 days. The plot shows increased
myocardial FDG uptake at day 1 post TAC surgery by 580% indicating an adaptive
response with preserved LVEF (Figure 5-3(B)). ki increased further at day 7 with a drop
in function by 24%.
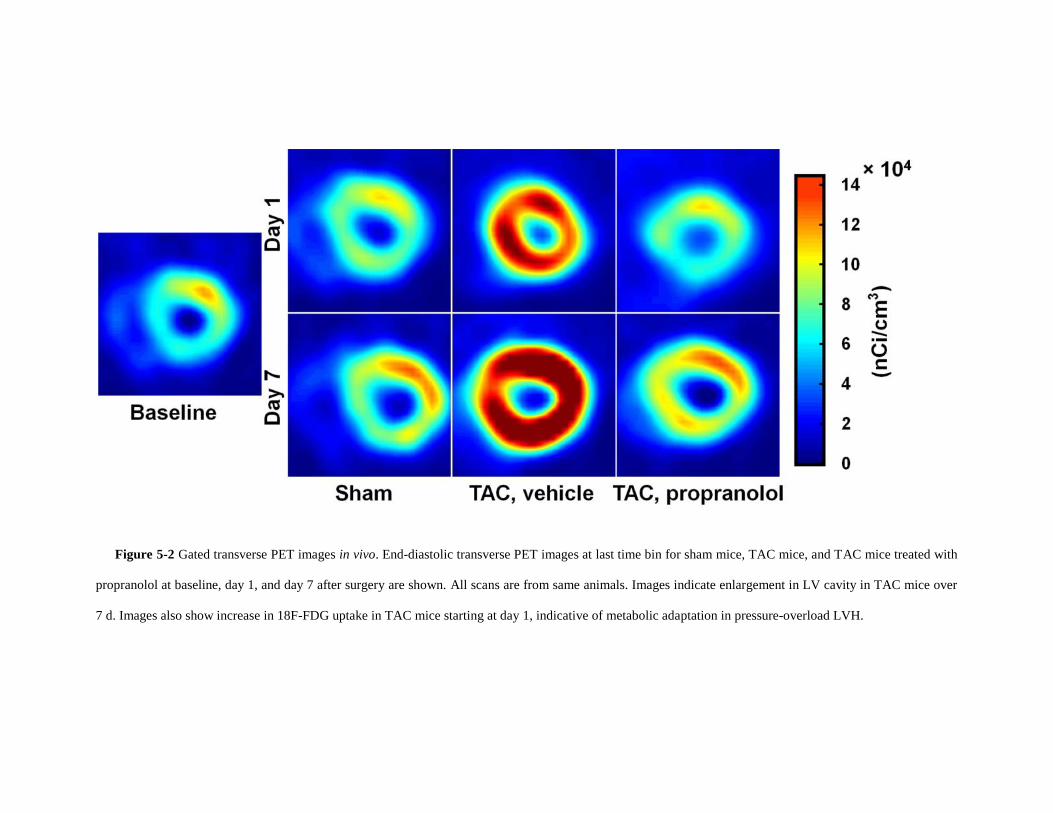
Figure 5-2 Gated transverse PET images in vivo. End-diastolic transverse PET images at last time bin for sham mice, TAC mice, and TAC mice treated with
propranolol at baseline, day 1, and day 7 after surgery are shown. All scans are from same animals. Images indicate enlargement in LV cavity in TAC mice over
7 d. Images also show increase in 18F-FDG uptake in TAC mice starting at day 1, indicative of metabolic adaptation in pressure-overload LVH.

Figure 5-3 Measured rates of myocardial 18F-FDG uptake ki and LVEF of the three groups over the 7
days period. (A) Measured rates of myocardial 18F-FDG uptake in vivo. ki (mL/g/min) for sham mice (n =
5), TAC mice, vehicle (n = 5) mice, and TAC mice treated with propranolol (n = 6) are shown. Myocardial
18F-FDG uptake at day 1 after TAC surgery is increased by 580%, indicating adaptive response to stress. ki
increased further on day 7 in TAC mice, whereas TAC mice treated with propranolol exhibited attenuated
rate of myocardial 18F-FDG uptake over 7-d period. Metabolic changes in TAC mice treated with
propranolol were comparable to sham group. All values are mean ± SEM. (B) Measured LVEF from
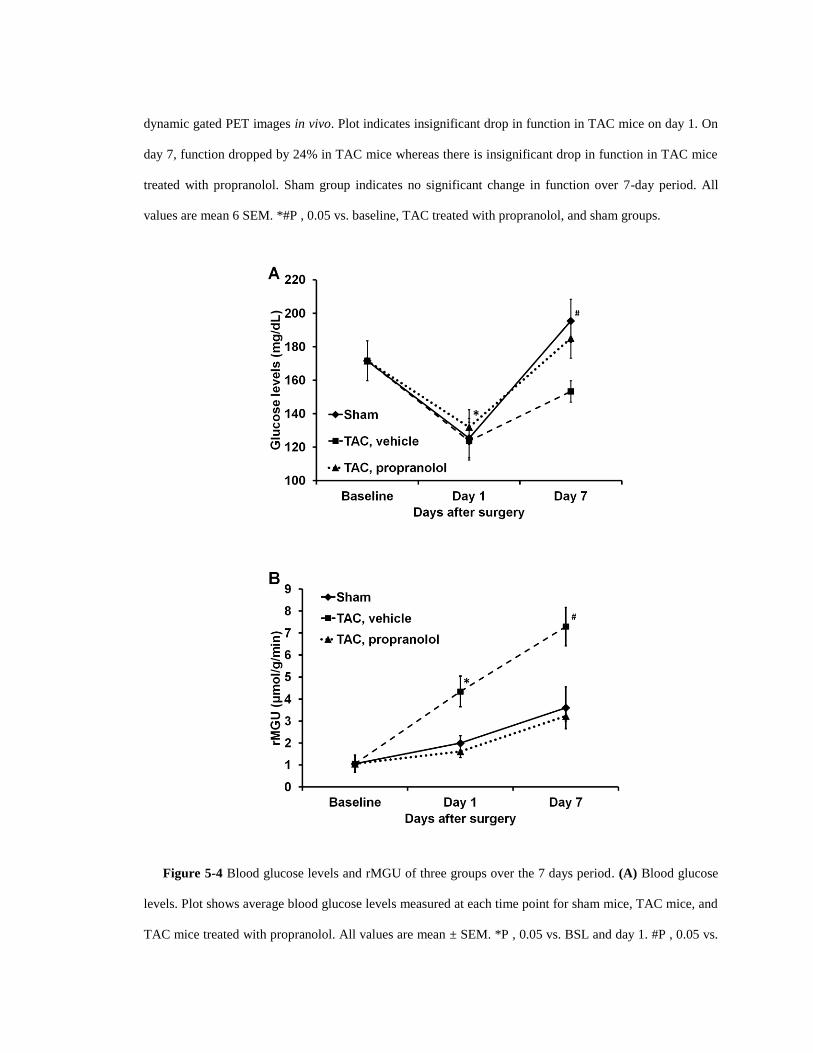
dynamic gated PET images in vivo. Plot indicates insignificant drop in function in TAC mice on day 1. On
day 7, function dropped by 24% in TAC mice whereas there is insignificant drop in function in TAC mice
treated with propranolol. Sham group indicates no significant change in function over 7-day period. All
values are mean 6 SEM. *#P , 0.05 vs. baseline, TAC treated with propranolol, and sham groups.
Figure 5-4 Blood glucose levels and rMGU of three groups over the 7 days period. (A) Blood glucose
levels. Plot shows average blood glucose levels measured at each time point for sham mice, TAC mice, and
TAC mice treated with propranolol. All values are mean ± SEM. *P , 0.05 vs. BSL and day 1. #P , 0.05 vs.

TAC at day 7. (B) rMGU was measured at each time point for sham mice, TAC mice, and TAC mice
treated with propranolol. All values are mean ± SEM. *P , 0.05 vs BSL, day 1, TAC treated with
propranolol, and sham groups. #P , 0.05 vs baseline, TAC treated with propranolol, and sham groups.
The blood glucose levels and rate of myocardial glucose utilization (rMGU) are also
shown in Figure 5-4 (A-B) for the 3 categories over a period of 7 days. We observe a
drop in the blood glucose levels at day 1 for the sham, TAC and TAC mice treated with
propranolol. Mice treated with propranolol show an elevation in blood glucose levels at
day 7 significantly different from day 1 and comparable to shams or mice at baseline. The
TAC mice exhibit an insignificant increase in the blood glucose levels between day 1 and
day 7 (Figure 5-4(A)). The rMGU (Figure 5-4(B)) did not increase linearly with ki.
Rather, rMGU increased at a much slower rate than ki, thereby resulting in a mismatch of
29% between ki and rMGU in the TAC mice (Figure 5-5).
On the other hand, early treatment with propranolol [105] targeting metabolic
alterations attenuated rate of myocardial FDG uptake (Figure 5-3 (A)), reduced mismatch
between ki and rMGU to 9% and rescued cardiac function (Figure 5-3 (B)). The
metabolic changes and cardiac function in the TAC mice treated with propranolol were
comparable to the shams. The in vivo imaging results suggest that early metabolic
remodeling may precede and trigger the onset of severe contractile dysfunction in LVH
in mice.
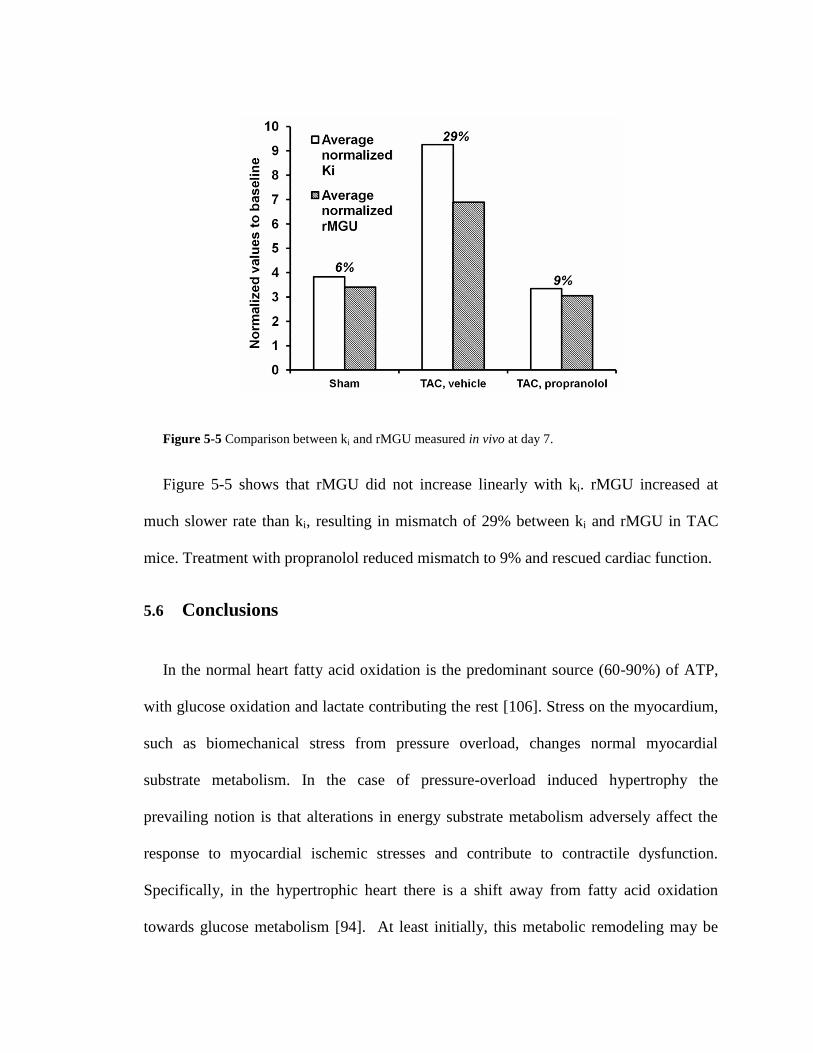
Figure 5-5 Comparison between ki and rMGU measured in vivo at day 7.
Figure 5-5 shows that rMGU did not increase linearly with ki. rMGU increased at
much slower rate than ki, resulting in mismatch of 29% between ki and rMGU in TAC
mice. Treatment with propranolol reduced mismatch to 9% and rescued cardiac function.
5.6 Conclusions
In the normal heart fatty acid oxidation is the predominant source (60-90%) of ATP,
with glucose oxidation and lactate contributing the rest [106]. Stress on the myocardium,
such as biomechanical stress from pressure overload, changes normal myocardial
substrate metabolism. In the case of pressure-overload induced hypertrophy the
prevailing notion is that alterations in energy substrate metabolism adversely affect the
response to myocardial ischemic stresses and contribute to contractile dysfunction.
Specifically, in the hypertrophic heart there is a shift away from fatty acid oxidation
towards glucose metabolism [94]. At least initially, this metabolic remodeling may be
considered as adaptive, most likely because glucose oxidation yields more ATP per atom
of oxygen [95]. With time, however, the adaptive response becomes maladaptive as this
shift in metabolism does not increase ATP production commensurate with the increased
demand for energy by the heart.
Recently we have proposed a requirement for hexose 6-phosphate in mTOR signaling,
and cardiac growth [107]. However, in the setting of insulin resistance, an oversupply of
substrate (glucose) may “starve the heart in the midst of plenty” [108]. The hypothesis,
however, has never been tested serially in vivo due to the limited availability of
technologies for studying complex metabolic parameters and LV function. It is tempting
to speculate that strategies to improve myocardial substrate utilization and to improve
metabolic flexibility [96][109] in the hypertrophic heart may improve contractile
performance and prevent the onset of heart failure.
During acute pressure overload and inotropic stimulation [110], glucose oxidation is
increased, but it is not yet completely clear how glucose uptake is related to LV function
during pressure overload LVH. Studies using Single Photon Emission Computed
Tomography (SPECT) imaging have demonstrated that the metabolic switch can be
measured in both small animals and human beings [111][112]. However, a serial study
on the temporal relationship between glucose uptake and cardiac function in vivo in mice
using PET has not been done. We demonstrated that MCBIF applied to an IDIF obtained
from high resolution gated images with less severe SP and PV effects is quantitative and
also repeatable as compared to that obtained from low resolution un-gated images [80].
The results of our present study support the hypothesis that increase in glucose
metabolism in the form of increased FDG uptake precedes and triggers the onset of
severe dysfunction of the heart in LVH. This is an important point, since early detection
of metabolic remodeling may lead to early intervention targeting metabolic changes to
prevent the onset of severe contractile dysfunction and improve patient outcomes
clinically. We also observe that early treatment with propranolol attenuated myocardial
glucose uptake and rescued cardiac function in vivo. Thus, metabolic imaging with FDG-
PET may provide an early indication of a beneficial effect of a therapy, which may
provide a platform for aggressive treatment strategies to improve outcomes clinically.
Dietary conditions affect FDG PET imaging studies [113]. Some clinical studies use
glucose load conditions without fasting to obtain higher quality images. On the other
hand, fasting can produce similar quality images. Because we are interested in FDG
dynamics, a reasonable contrast between the blood pool and the myocardial tissue
enables us to draw ROI’s and determine rate of myocardial FDG influx with SP and PV
corrections. Moreover, performing glucose clamps in mice is challenging in addition to
the TAC surgery, so we resort to overnight fasting for our FDG PET scans in order to
achieve uniform metabolic conditions to obtain ki, and rMGU.
The lumped constant, LC, is an important parameter in the determination of the rMGU
in a dynamic PET scan. This value may vary, depending upon plasma substrate and
hormonal conditions. Many authors have used a constant value of LC to compute MGU
in humans with T2D [114]. Botker et al. [115] proposed that LC is a function of rates of
FDG transport and phosphorylation and applied the method to assess MGU in humans
with ischemic cardiomyopathy [116]. In a study by Herrero et al [117], a constant value

of LC was used for assessing myocardial glucose uptake for FDG PET studies in dogs.
However, they also observe that the correlation between Fick derived and PET derived
rMGU has lower correlation with variable LC. The correlation coefficient does not differ
after correcting for LC=0.67 for FDG PET studies. They also observe that using variable
LC leads to significant underestimation of rMGU in large animals. In the current work,
we used LC=1 as we did not measure this constant and there is no consensus on how to
deal with this issue. The concerns expressed earlier by Botker et al [115] do not apply
because here the metabolic conditions were the same for all animals and in steady state.
Nevertheless, further studies need to be done to characterize LC in small animal PET
imaging of the heart.
Our study is not without limitations. First, FDG can only be considered as a surrogate
marker for glucose metabolism. While FDG indirectly assesses glucose transport and
phosphorylation the tracer analog is subjected to changes in the lumped constant [100].
Secondly, although clinically relevant, the acute nature of the model may be a limitation
in evaluating the hypothesis of metabolic remodeling precede and trigger cardiac
dysfunction in LVH. The slowly progressive Dahl salt sensitive hypertensive rat model
may be more relevant to evaluate metabolic and functional changes in the heart, in vivo,
but the costs for a study like the present one would be prohibitive [118]. Using the one-
kidney, one-clip rabbit model of hypertension we have already shown by invasive
measurements that metabolic remodeling of the heart precedes hypertrophy [95]. Third,
we have not considered any possible differences in plasma substrate or hormone levels,
although all scans were obtained under the same conditions and errors would be
systematic errors.
Non-invasive serial imaging of the heart subjected to pressure overload hypertrophy
using PET supports the hypothesis that changes in glucose analogue FDG metabolism
precedes and triggers the onset of severe cardiac dysfunction in LVH. We found that
enhanced uptake of FDG by the myocardium in mice subjected to pressure overload
hypertrophy precedes and possibly triggers the onset of contractile dysfunction. Early
intervention with a standard of care treatment prevented maladaptive response and
rescued cardiac function. We speculate that early detection of metabolic remodeling may
offer a metabolic target for modulation of hypertrophy.
6 Non-Invasive Detection of Early Metabolic
Remodeling from Dynamic FDG PET Images of the
Heart: First in Human Study
6.1 Introduction
Hypertension, characterized by an increase in systemic arterial blood pressure affects
about 30% of the US population ≥ 20 years of age [119] and is a common cause of left
ventricular hypertrophy (LVH) [120]. LVH is a powerful and independent predictor of
increased cardiovascular morbidity and mortality in patients with hypertension. There is a
lack of effective therapies to treat LVH due to hypertension; therefore early detection and
prevention are important. Acute pressure overload prompts the heart muscle to switch
from fatty acids to glucose as its main source for oxidative energy production
[94][110][121]-[123]. This adaptive response is beneficial to cardiac function in the acute
situation. However, sustained pressure overload reactivates the fetal gene program [124]
and makes the metabolic change permanent. This in turn leads to metabolic inflexibility
and dysregulation that characterizes the failing heart [96][97]. Therefore, strategies to
improve energy generation and use have received renewed interest as a therapeutic target
to improve patient outcomes [125]-[131]. The key issue is to identify the temporal and
causal relationship between metabolic remodeling and impaired cardiac function and the
development of LVH, and to define a window for aggressive therapy to prevent disease
progression. PET imaging is an excellent tool to address this issue [2][132][133].

Accurate non-invasive imaging of myocardial substrate metabolism that can be
performed in animals and humans will be important in identifying changes in myocardial
metabolism before and during the development of LVH and in identifying and
establishing therapies to prevent LVH [132][134]. We hypothesize that alterations in
glucose metabolism in the pressure-overloaded heart precede the development of
impaired cardiac function and thus, targeting the changes in glucose metabolism may
prevent the development of functional and consequently structural changes in the
pressure-overloaded heart that lead to LVH and heart failure.
In chapter 4 and 5 we developed an improved methodology for non-invasive
quantification of rate of myocardial glucose uptake in vivo in the mouse heart using
dynamic FDG PET imaging [1][2]. Using this method we tested the hypothesis in mice
heart in vivo, that early metabolic remodeling in the form of increased myocardial FDG
uptake precedes structural LV remodeling in conjunction with a decrease in cardiac
function, in an acute mouse model of transverse aortic constriction (TAC) induced
pressure overload LVH [2][87]. The TAC mouse model [79][136] lacks some of the key
features of the human disease, most importantly the slow progressive development of
pressure overload. This makes it difficult to distinguish the maladaptive from the
adaptive metabolic response and to identify the window for aggressive therapeutic
strategies that improve outcome and could be readily translated to clinical practice. In this
first-in-human clinical study, adapting the dynamic FDG PET imaging and quantitative
techniques developed in mouse heart, we tested the hypothesis that metabolic remodeling
precedes structural and functional remodeling in hypertension-induced LVH.

6.2 Materials and Methods
6.2.1 Patients
Thirty-one patients (11 men, 20 women) participated in the study. The presence of
hypertension was determined through chart review. All patients without known coronary
disease or symptoms of ischemia underwent resting 2-dimensional echocardiography at
the University of Virginia Echocardiography Laboratory.
6.2.2 Echocardiography
All patients underwent resting 2-dimensional transthoracic echocardiography. LVH
was considered present in the setting of an end-diastolic left ventricular interventricular
septal or posterior wall dimension ≥ 1.2mm measured after closure of the mitral valve at
end-diastole (ASE Chamber Quant). Left ventricular mass was calculated using the
Devereaux formula, and dividing by the body surface area gives the left ventricular mass
index [135]. Left ventricular diastolic function assessment included assessment of tissue
Doppler and mitral inflow velocity Doppler. LV ejection fraction was also determined by
echocardiography. Heart weight to body weight ratios (HW/BW) were calculated using
LV mass. The echocardiogram was ordered clinically, and the imaging study was
performed following the clinical protocol.
6.2.3 FDG PET Imaging Protocol
All the patients in the 3 different groups were fasted for > 6 hours prior to the PET
procedure. During the initial phase of each protocol, the patients were positioned in a
Siemens Biograph mCT PET-CT scanner. A 10 minutes 40-slice CT scan was acquired
before the FDG PET scan for attenuation correction.
For evaluation of myocardial glucose metabolism, 20 minutes dynamic 2-[18
F] fluoro-
2deoxy-D-glucose (FDG) PET scan was performed with cardiac gating on a Siemens
Biograph mCT PET-CT scanner. FDG in the amount of 10-15 mCi was slowly
administrated over 30 seconds via an intravenous catheter, 20 minutes of dynamic PET
data acquisition followed within a few seconds. The list mode PET data were
reconstructed using an iterative reconstruction algorithm into 30 dynamic frames as
follows: frames x time (seconds) (12 × 10 s; 8 × 30 s; 8 × 60 s; 2 × 180 s).
6.2.4 Data Analysis
The data were analyzing blinded of clinical data. For each patient, midventricular
transaxial slice from the last time frame of dynamic PET image was used for drawing
regions of interest (ROIs) in the areas corresponding to the LV blood pool and the
myocardium, and time activity curves generated from the dynamic PET images using
Siemens Syngo. The methodology [1] in which the blood input function with spillover
and partial volume corrections and the metabolic rate constants were simultaneously
estimated in a 3-compartment tracer kinetic model, was used to determine the rate of
myocardial FDG uptake, ki (ml/ min/ g). Mean values of Ki, HW/BW ratios and wall
thickness in the 3 groups of patients were compared using ANOVA and Tukey’s
Studentized Range testing.
6.3 Results
Among the thirty-one patients enrolled, 9 were with hypertension (HTN) with left
ventricular hypertrophy (LVH), 11 were with HTN without LVH, and 11 controls were
with neither LVH nor hypertension. All patients had normal left ventricle ejection

fraction (55-65 %). The mean age differed significantly between the groups (p = 0.017);
it was lower in the control group (43 ± 13 y) than in HTN with LVH (59 ± 13 y, p =
0.029). There was no significant age difference between HTN with LVH and HTN
without LVH (57 ± 12 y, p = 0.971) patients. Female gender comprised of 65% of the
patient population in the control group with 67% and 50% respectively for the HTN with
LVH and HTN without LVH groups.
The mean metabolic measurements (ki) for the three groups were significantly
different (Figure 6-1 A). It was higher in HTN without LVH patients (0.104 ± 0.012
mL/min/g) compared to HTN with LVH (0.029 ± 0.004 mL/min/g) (p < 0.001) and
control (0.069 ± 0.003 mL/min/g) (p = 0.003) patients. The mean Ki for the controls
differed significantly from the HTN with LVH group (p<0.001).

Figure 6-1 Myocardial metabolism and left ventricle structure in hypertension induced LVH
patients. (A) Measured rate of myocardial FDG uptake, Ki. *p < 0.05 vs control and HTN &LVH; #p <
0.05 vs HTN & LVH. (B) Measured septal wall thickness, *p < 0.05 vs control and HTN &LVH; (C) Heart
weight measured from LV mass, *p < 0.05 vs control and HTN &LVH.

The mean septal wall thickness (Figure 6-1 B) differed significantly between the
groups (p = 0.009); it was higher in HTN with LVH (11.5 ± 2.9 mm) than in control (7.9
± 2.3 mm, p = 0.006) patients. The mean wall thickness for the HTN without LVH
patients did not differ significantly from the control patients (p = 0.523). The mean
HW/BW (Figure 6-1 C) differed significantly between the groups (p = 0.013); it was
higher in HTN with LVH (0.96 ± 0.2 g/lb) than in HTN without LVH (0.6 ± 0.3 g/lb, p =
0.021) and control (0.67 ± 0.3 g/lb, p = 0.034) patient populations. There was no
significant difference in HW/BW ratios between HTN without LVH and control (p =
0.809) patients.
6.4 Discussion
First, our results indicated that metabolic changes (Figure 6-1 A) precede structural
remodeling (Figure 6-1 B) in patients with hypertension. Figure 6-1 (B) (C) indicates
heart weight to body weight ratios and septal wall thickness measurements in control
patients and patients with hypertension, and the data show no significant changes in heart
structure with hypertension alone. Thus significant metabolic changes in the form of
increased rate of myocardial FDG uptake Ki, precedes any changes in heart weight to
body weight ratios and wall thickening in hypertensive patients as compared to controls.
Successful observation of this trend in a larger patient population may provide a window
for early intervention using aggressive therapeutic strategies to prevent structural
remodeling, progression to LVH, and heart failure.
Secondly, in patients with hypertension and LVH, we observe a reduction in the rate
of myocardial FDG uptake with preserved function. The lower myocardial FDG uptake
in the HTN with LVH patient group may be due to impaired glucose tolerance. We
hypothesize that insulin resistance (IR) may be a protective mechanism for the pressure
overloaded hearts. The hypertrophied and failing heart exhibits defective insulin
stimulated glucose transport, or IR. Since IR is one of the earliest detectable changes in
the development of cardiovascular disease (CVD) [137], it is often branded as a
perpetrator of cellular and physiologic damage and most therapeutic interventions are
aimed at overcoming this condition. However, more recent evidence indicates a
seemingly paradoxical finding that insulin sensitizers such as Rosiglitazone, which
improve glucose transport into the insulin resistant heart [138], are linked to
cardiovascular events in type II diabetic patients [139][140]. These data have led to the
speculation that IR in the pressure overload heart may be a protective mechanism. IR
reduces glucose transport into cardiac tissue. On the one hand, this could be viewed as a
maladaptation which limits the heart’s ability to function normally, while on the other
hand IR might be a mechanism for cellular preservation by reducing glucose toxicity.
This hypothesis can be tested by imaging a larger patient population, along with the
measurement of other metabolic parameters such as blood glucose levels and glycated
hemoglobin (HbA1c).
The significance of this study lies in the early detection strategy of metabolic changes
in the pressure overload heart, using improved PET acquisition and analysis techniques,
before any structural remodeling happens. The unique advantage of this multi-parameter
approach is that no prior knowledge of the cardiac dimensions is needed. From a clinical
perspective, measurement of absolute metabolic activity is very important when using
one single measurement to identify which hypertensive patients are going to develop
LVH or heart failure.
6.5 Conclusions
Metabolic remodeling preceded the development of LVH [2]. The LVH population
exhibited higher septal wall thickness and heart weight to body weight ratios compared to
HTN without LVH and control patients with preserved function. Noninvasive detection
of early metabolic changes may allow early aggressive therapy to prevent disease
progression in hypertension induced LVH [3][4].
7 Myocardial Blood Flow Measured by 13
N-Ammonia
Dynamic PET Imaging
7.1 Introduction
Myocardial metabolism, blood flow and contractile function of the heart are closely
coupled. The heart under pressure overload exhibits impaired myocardial blood flow
(MBF), with an increase in the rate of myocardial glucose uptake due to reactivation of
the fetal gene program [96][97] and down regulation of contractile function and oxygen
consumption [109] as an adaptive response. The myocardium can regain normal
contractility once the pressure is relieved. This reversible response of myocardial tissue
has been described as hibernating myocardium. However, it is not clear whether
metabolic derangements in myocardial glucose metabolism is a cause or an effect of the
impairment in MBF observed in the pressure overload heart [141]. The flow-metabolism
mismatch during the adaptive phase is used as a diagnostic tool in clinical practice,
wherein patients with a mismatch are sent for revascularization, as opposed to patients
with a flow-metabolism match indicating scar tissue formation. Accurate assessment of
dysfunctional but viable myocardium is important in patients with left ventricle
dysfunction, especially myocardial infarction. Identification of hibernating myocardium
is most valuable in those patients with the greatest impairment of left ventricle function
and areas of myocardial asynergy, where revascularization improves contractility to the
greatest degree and improves survival. Therefore, simultaneous assessment of
impairments in myocardial metabolism and blood flow is important for earlier diagnosis
and subsequent therapy to prevent cardiac dysfunction.
PET imaging provides an effective tool for assessing both absolute MBF and
metabolic processes in myocardial cells from small animal models to clinical practice.
Radioactive tracers such as 11
C-acetate [142], 82-Rubidium [143][144], 13
N-ammonia
[145] and more recently 18
F-Flurpiridaz [146] are widely used for measuring myocardial
perfusion in small and large animals, and also in humans. Previous measurements of
MBF in rat hearts [147][148] has accounted for SP contamination from the blood to the
tissue with PV correction. Some measurements in mouse hearts have performed standard
uptake rate (SUV) calculations [149], which are only semi-quantitative [150]. In chapters
4 and 5 we evaluated myocardial glucose metabolism in mouse heart using FDG PET
[2][84] in a 3-compartment tracer kinetic model. Quantitative measurement of MBF in
mouse heart using 13N-ammonia is more challenging than measuring glucose
metabolism using FDG due to the larger range of positrons emitted by 13
N (see table 3-1).
Degradation in the system spatial resolution and the small size of mouse heart thereby
results in poor quality images. Rapid heart rate results in further image blur confounding
the effects of SP in the quantitative estimation of the image derived blood input function
(IDBIF) [69][72][73] in a dynamic PET scan. In this chapter we measure absolute MBF
in mouse heart for the first time in vivo using 13
N-ammonia dynamic PET imaging at rest
and under vasodilator stress. Myocardial flow reserve (MFR) defined as the ratio of the
flow under stress to that at rest was also computed. Dynamic PET data was analyzed in
the modified tracer kinetic model correcting for SP and PV effects of both the blood and
the tissue in a dynamic 13N-ammonia PET scan. The in vivo measurements were
validated with the magnetic resonance imaging (MRI) measurements [151] in literature.
7.2 Measuring Absolute Myocardial Blood Flow (MBF) using a 3-
Compartment Tracer Kinetic Model in Mouse Heart
7.2.1 MicroPET Imaging Protocol
Rest Imaging: PET imaging for measuring MBF was carried out using 13
N-ammonia
in adult C57BL/6 male mice as follows: following the insertion of a tail-vein catheter,
ECG surface electrodes (Blue Sensor, Ambu Inc., Glen Burnie, MD) were placed on both
forepaws and the left hindpaw and a pneumatic respiratory pillow was placed on the
animal's chest. 10 minute dynamic PET scan was performed under 1-1.5 % isofluorane
anesthesia in oxygen [82], where data acquisition was initiated a few seconds before the
slow administration of about 800 µCi 13
N-amonia over 30 seconds via the catheter. Small
Animal Instruments, Inc., model 1025L for PET was used for continuously monitoring
heart rate, respiration, and core body temperature. Transmission scan using 57
Co point
source was done for attenuation correction prior to 13
N-amonia dynamic PET scan.
During Vasodilator Stress: Ten minutes after the rest scan, allowing for tracer decay
time, an intravenous (i.v) bolus of Lexiscan (regadenoson, an adenosine A2a receptor
agonist) was administered into the tail-vein catheter (2.5 ug/ kg in 50 uL), without
disturbing the position of the mouse in the scanner. Two minutes after adenosine
administration, allowing for the heart rate to increase to at least 600 bpm, a second 10
minute PET scan was initiated before the administration of 800 µCi 13
N-ammonia via the
intravenous catheter.
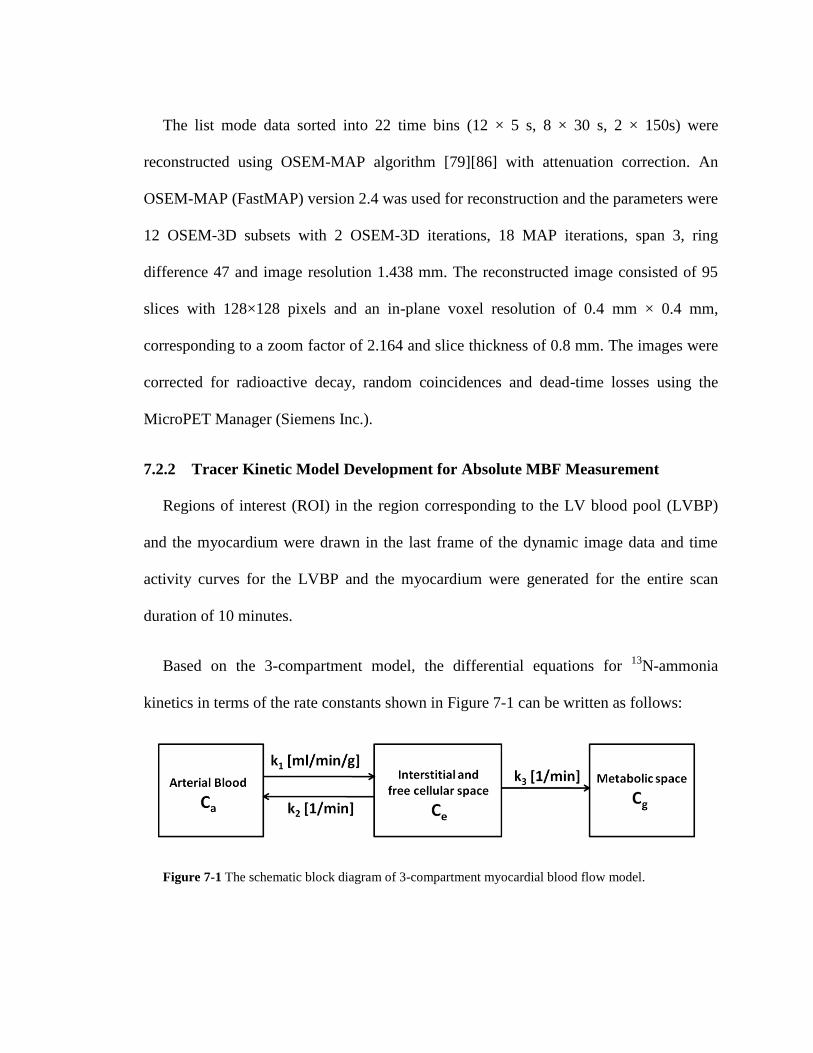
The list mode data sorted into 22 time bins (12 × 5 s, 8 × 30 s, 2 × 150s) were
reconstructed using OSEM-MAP algorithm [79][86] with attenuation correction. An
OSEM-MAP (FastMAP) version 2.4 was used for reconstruction and the parameters were
12 OSEM-3D subsets with 2 OSEM-3D iterations, 18 MAP iterations, span 3, ring
difference 47 and image resolution 1.438 mm. The reconstructed image consisted of 95
slices with 128×128 pixels and an in-plane voxel resolution of 0.4 mm × 0.4 mm,
corresponding to a zoom factor of 2.164 and slice thickness of 0.8 mm. The images were
corrected for radioactive decay, random coincidences and dead-time losses using the
MicroPET Manager (Siemens Inc.).
7.2.2 Tracer Kinetic Model Development for Absolute MBF Measurement
Regions of interest (ROI) in the region corresponding to the LV blood pool (LVBP)
and the myocardium were drawn in the last frame of the dynamic image data and time
activity curves for the LVBP and the myocardium were generated for the entire scan
duration of 10 minutes.
Based on the 3-compartment model, the differential equations for 13
N-ammonia
kinetics in terms of the rate constants shown in Figure 7-1 can be written as follows:
Figure 7-1 The schematic block diagram of 3-compartment myocardial blood flow model.

)()(
)()()()(
3
321
tCkdt
tdC
tCkktCkdt
tdC
e
g
ea
e
7-1
)(][ 32
23
32
1 tCekkkk
kCCC a
tkk
get
7-2
where, k1 (ml/ min/ g) is absolute MBF, ρ=1.04 g/ ml is the myocardial tissue density.
The model equation for the blood input function can be written as [89]:
otherwiseeAeAtA
tifC
tLtLa ,)(
,0
)(
2
)(
2121
7-3
However, due to SP and PV effects, the model equations for an image-derived time
activity curve from the blood pool and the myocardium can be written in terms of
fraction of the tissue concentration in the blood compartment and partial recovery of
radioactivity concentration from the blood and vice-versa as:
i
b
i
e
t
t
abmgem
imyo
i
b
i
e
t
t
abgemb
iIDBIF
tt
dtCStCtCr
Model
tt
dtCrtCtCS
Model
ie
ib
ie
ib
]))()(([
]))()(([
,
,
7-4
where, rm, rb, are the recovery coefficients (accounting for PV effect) for the
myocardium and blood pool respectively. Sbm, Smb are the SP coefficients from the blood
pool to the myocardium and vice versa respectively. tbi and te
i are the beginning and end

times for a single frame in a dynamic PET scan. Optimization of the model equations to
the time activity curves obtained from the dynamic PET image was performed by
minimizing the objective function in MATLAB using “fmincon”, which is based on an
interior-reflective Newton method [1][80]:
n
i
imyoimyoiIDBIFiIDBIF PETModelPETModelpO1
2
,,
2
,, ])()[()( 7-5
where, PETIDBIF is image derived blood input function (blood pool time-activity
concentration), PETmyo is myocardium time-activity concentration obtained from PET
image and p is the parameter vector including the SP and PV coefficients. MFR was
computed as the ratio of the flow under vasodilator stress to the flow at rest as follows:
rest
stress
MBF
MBFMFR 7-6
Myocardial blood flow with 13
N-ammonia PET imaging in vivo in mouse heart at rest
was obtained using the methodology described in the methods section. Figure 7-2(A-D)
exhibits the dynamic PET images at various time points in a dynamic PET scan of mouse
heart in vivo. Figure 7-2 E shows the model fits obtained using the formalism discussed
in the methods section.
Absolute MBF at rest was measured to be 4.8 mL/ min/g. This compares well with the
existing literature for measuring MBF in mouse heart at rest with quantitative first-pass
[152] and arterial spin-labeling MRI [151]. Absolute MBF under vasodilator stress
obtained from the second PET was 8.9 mL/ min/ g. The MFR in mouse heart was hence
computed to be 1.9 (Flow at stress/Flow at rest).

Figure 7-2 Dynamic 13
N-ammonia PET imaging in vivo in mouse heart and model fits at rest. (A-D)
Example fused dynamic PET images at pre, at early and late time points post 13
N-NH3 injection over a scan
time of 10 minutes. (E) Model fits of the tissue and blood time activity curves obtained from PET images.
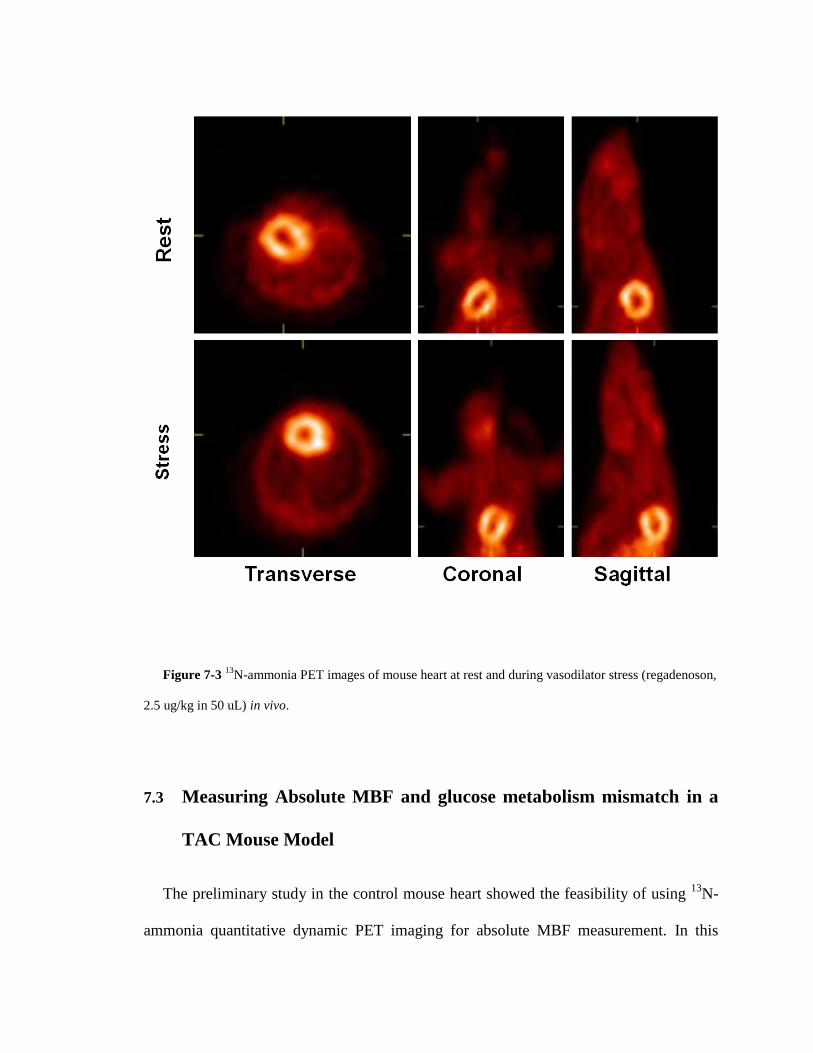
Figure 7-3 13
N-ammonia PET images of mouse heart at rest and during vasodilator stress (regadenoson,
2.5 ug/kg in 50 uL) in vivo.
7.3 Measuring Absolute MBF and glucose metabolism mismatch in a
TAC Mouse Model
The preliminary study in the control mouse heart showed the feasibility of using 13
N-
ammonia quantitative dynamic PET imaging for absolute MBF measurement. In this

section, we established a correlation between absolute MBF and glucose metabolism in a
stressed mouse heart for the first time in vivo. Stress in the mouse heart was created
following the same surgical protocol described in section 5.2. Dynamic 13N-ammonia
PET imaging followed by FDG PET imaging was performed 1 day after the surgery.
7.3.1 MicroPET Imaging Protocol
A 10 minutes transmission scan using 57
Co point source was done for attenuation
correction prior to 13
N-amonia dynamic PET scan. PET imaging for measuring MBF was
carried out using 13
N-ammonia on adult C57BL/6 male mice as follows: following the
insertion of a tail-vein catheter, ECG surface electrodes (Blue Sensor, Ambu Inc., Glen
Burnie, MD) were placed on both forepaws and the left hindpaw and a pneumatic
respiratory pillow was placed on the animal's chest. 10 minutes dynamic PET scan was
performed under 1-1.5 % isofluorane anesthesia in oxygen [82], where data acquisition
was initiated a few seconds before the slow administration of about 800 µCi 13
N-amonia
over 30 seconds via the catheter. 10 minutes after the rest scan, allowing for 13
N-
ammonia tracer decay time, 60 minutes dynamic PET imaging for glucose metabolism
was carried out using 18
F-FDG on the same mouse without disturbing mouse position in
the MircroPET scanner. Data acquisition was initiated few seconds before the slow
administration of 800 µCi 18
F-FDG via the same tail-vein catheter. Small Animal
Instruments, Inc., model 1025L for PET was used for continuously monitoring heart rate,
respiration, and core body temperature. Cardiac gate signals generated at the end-
expiration phase of the respiratory cycle, using the small animal gating system, were used
to trigger the PET scanner only in dynamic FDG PET imaging. The time stamped list

mode PET data was then retrospectively arranged into 23 time bins and 3 cardiac phases
per time bin [83]. The list mode data of 13
N-ammonia scan sorted into 22 time bins (12 ×
5 s, 8 × 30 s, 2 × 150s), and the list mode data of 18
F-FDG PET scan sorted into 23 time
bins (11 × 8 s, 1 × 12 s, 2 × 60 s, 1 × 180 s, and 8 × 400 s) [1][79][84]. An OSEM-MAP
(FastMAP) version 2.4 was used for reconstruction and the parameters were 12 OSEM-
3D subsets with 2 OSEM-3D iterations, 18 MAP iterations, span 3, ring difference 47
and image resolution 1.438 mm. The reconstructed image consisted of 95 slices with
128×128 pixels and an in-plane voxel resolution of 0.4 mm × 0.4 mm, corresponding to a
zoom factor of 2.164 and slice thickness of 0.8 mm.
7.3.2 Left Ventricle Segmentation Analysis
Figure 7-4 Left ventricle segmentation analysis for metabolism and perfusion

For the identification of blood flow and metabolism mismatch, regions of interest were
determined by following the standardized left ventricle segmentation described by
Manuel D. Cerqueira et al [153]. Tracer kinetic models developed for MBF (section 7.2.2)
and glucose metabolism (section 3.3) were used for processing total 17 left ventricle
segmentations from basal to apex. Absolute MBF K1 and myocardial glucose uptake rate
ki were calculated for each segment, then normalized by average number over the entire
left ventricle myocardium. Figure 7-4 indicates blood flow and glucose metabolism
mismatch in segments 5, 6, 9, 10, 12 and 15, and match in the remaining segments.
This is the first time that using dynamic PET imaging we have established a
correlation between absolute MBF and myocardial glucose metabolism in mouse heart in
vivo. The preliminary results showed an increase in glucose uptake rate (global average ki
=0.18 mL/ g/ min) and impaired blood flow (global average k1 = 3.2 mL/ min/ g) in the
heart, as an adaptive response to acute pressure overload surgery on day 1.
7.4 Discussion
The correction for 13
N-ammonia metabolites in blood would further improve the
quantitative accuracy of MBF estimate in mouse heart at rest and under stress [5]. It is
expected that with improved tracer kinetic modeling techniques, we can characterize the
alteration of flow and metabolism with function in the mouse heart subject to pressure
overload LVH serially over a time course in vivo.
The one mouse heart, subjected to TAC induced LVH, 17 segmentation analysis
showed the feasibility to monitor MBF and myocardial glucose metabolism by applying

advanced tracer kinetic models following serial dynamic 13
N-ammonia and 18
F-FDG PET
imaging in vivo. Further studies of interventions at early and late time points will test the
hypothesis in vivo that derangements in myocardial glucose metabolism possibly triggers
impairment in MBF and contractile dysfunction in the pressure overload mouse heart.
In summary, the results from these preliminary studies are of interest because they will
advance the field of dynamic cardiac PET imaging of MBF in the mouse heart. A
translation of the PET imaging and quantification methods, developed and optimized in
mice, to the clinical scenario may lead to the development of fundamental knowledge in
myocardial perfusion and better understanding in its correlation with metabolic
alterations on subsequent cardiac function in human heart, which may help reduce
cardiovascular morbidity and mortality in patients with hypertension.
7.5 Conclusions
In this chapter we developed a 3-compartment tracer kinetic model to quantitatively
assess blood flow and flow reserve in mouse heart using 13
N-ammonia dynamic PET
imaging in vivo. Preliminary data indicated a correlation between blood flow and glucose
metabolism in the stressed mouse heart in vivo.
8 Conclusion and Future Work
8.1 Research Summary
The objective of this dissertation is to develop and validate tracer kinetic models for
evaluation of metabolism and perfusion in the heart in vivo, with correction for
incomplete radioactivity recovery and spillover contamination. Using this advanced
quantitative model in conjunction with optimized PET imaging technique, efforts were
also made to explore the model as a tool for early detection and therapy planning.
Quantification of dynamic FDG PET imaging of the heart was extensively studied
from mouse to man. MCBIF applied to OSEM-MAP gated images correctly accounts for
the shape, wash-in and wash-out dynamics of FDG from mouse blood without the need
of any invasive blood sampling. Lower SP of radioactivity from the myocardium to the
BP and higher PV recovery from OSEM-MAP gated images lead to improved MCBIF
estimate as compared to that obtained from un-gated FBP images in a dynamic PET scan
of the mouse heart. We demonstrated that MCBIF applied to an IDIF obtained from high
resolution gated images with less severe SP and PV effects is quantitative and also
repeatable as compared to that obtained from low resolution un-gated images [80].
In the mouse heart of left ventricle hypertrophy, quantification of metabolism was
studied in an acute mouse model. Non-invasive serial dynamic FDG imaging of the
mouse heart subjected to TAC surgery induced hypertrophy supports the hypothesis that
changes in glucose analogue FDG metabolism in the form of enhanced uptake of FDG by
the myocardium in mice precedes and triggers the onset of severe cardiac dysfunction in
LVH. Early intervention with a standard of care treatment prevented maladaptive
response and rescued cardiac function. We speculate that early detection of metabolic
remodeling may offer a metabolic target for modulation of hypertrophy.
Although clinically relevant, the acute nature of the model may be a limitation in
evaluating the hypothesis of metabolic remodeling preceding and triggering cardiac
dysfunction in LVH, which makes it difficult to distinguish the maladaptive from the
adaptive metabolic response and thereby to identify the window for aggressive
therapeutic strategies that improve outcome which then could be readily translated to
clinical practice. In the first-in-human clinical study, adapting the dynamic FDG PET
imaging and quantitative techniques developed in mouse heart, it was observed that
metabolic remodeling precedes any structural and functional remodeling in hypertension
induced LVH patients. The LVH population exhibited higher septal wall thickness and
heart weight to body weight ratios compared to HTN without LVH and control patients
with preserved function. Noninvasive detection of early metabolic changes may allow
early aggressive therapy to prevent disease progression in hypertension induced LVH.
Simultaneous assessment of impairments in myocardial metabolism and blood flow is
important for earlier diagnosis and subsequent therapy to prevent cardiac dysfunction.
Preliminary efforts were made into exploring quantitative assessment of absolute blood
flow in mouse heart using dynamic 13
N-ammonia imaging in a 3-compartment tracer
kinetic model. The modified 3-compartment tracer kinetic model for myocardial blood
flow can quantitatively measure absolute MBF and MFR in mouse heart using 13N-
ammonia dynamic PET imaging in vivo.
8.2 Future Work
The simultaneous assessments of metabolism and perfusion play an important role in
diagnosis and treatment planning. The preliminary study showed feasibility of using
optimized tracer kinetic model in dynamic 13
N-ammonia imaging for absolute myocardial
blood flow measurement. To validate the parametric model, future work including
collecting at least n = 5 control mice 13
N-ammonia imaging data, and comparing with
gold standard microsphere measurements ex vivo are necessary. However, the surgery for
microsphere measurement preparation in mouse may be very difficult. As an alternative
method, cross-validation between dynamic PET imaging and a different modality such as
arterial spin labeling (ASL) MRI also can help address this issue.
Following validation of measuring absolute blood flow in mouse heart, non-invasive
serial imaging can be performed on n = 5 stressed mice (using a similar surgical protocol
described in chapter 5) over a period of 7 days using dynamic 13
N-ammonia and FDG
PET in a 3-compartment kinetic model for identification of hibernating myocardium and
to establish a correlation between flow and metabolism in vivo. These imaging data can
then be compared to control data by imaging n=5 sham mice.
In summary, the 3-compartment tracer kinetic model showed good adaptability when
translating from mouse to humans, and also when switching from measuring glucose
metabolism to absolute blood flow in the heart. The kinetic models developed in this

dissertation can also be adapted to different PET tracers such as acetate for measuring
oxygen consumption in vivo [154]. The kinetic rate constants and compartments can be
adjusted to adapt to different metabolic processes for different tracers, while the form of
the equations of model corrected image-derived heart ventricle and image-derived tissue
time activity would have a similar form. Also, the initial values and optimization bounds
should be modified when switching to other tracers or animal models. In addition, blood
samples from a number of experimental subjects may be necessary to validate model
output estimates. Nevertheless, application of this technique to other scanners and
isotopes would require careful validation since positron range and depth of interaction
will be different for other isotopes and scanners.
Reference
[1] Zhong M, Kundu B K. Optimization of a model corrected blood input function
from dynamic FDG-PET images of small animal heart in vivo, IEEE Trans Nucl
Sci., Oct 2013;160(5): 3417-3422.
[2] Zhong M, Alonso C E, Taegtmeyer H, Kundu BK. Quantitative PET imaging
detects early metabolic remodeling in a mouse model of pressure-overload left
ventricular hypertrophy in vivo. Journal of Nuclear Medicine, 2013, 54(4): 609-
615.
[3] Zhong M, Hamirani Y, Bourque J, Kundu BK. Non-invasive detection of early
metabolic remodeling in left ventricular hypertrophy. Late Breaking Abstract,
World Molecular Imaging Congress, Savannah, Georgia, 2013.
[4] Hamirani Y*, Zhong M*, McBride A, Bourque J, Kundu BK. Myocardial
Metabolic Remodeling in Hypertension Induced Left Ventricular Hypertrophy.
Abstract, Best poster, American College of Cardiology (ACC) Meeting,
Washington DC, April 2014. *equal contribution.
[5] Zhong M, Mistry M, Dimastromatteo J, Taegtmeyer H, Glover D, Kundu B. PET
imaging of myocardial blood flow in the stressed mouse heart in vivo. J NUCL
MED MEETING ABSTRACTS 2013 54: 1635.
[6] Freudenrich C, How Nuclear Medicine Works, HowStuffWorks.com, 2000.
[7] National Research Council (US) and Institute of Medicine (US) Committee on
State of the Science of Nuclear Medicine. Advancing Nuclear Medicine Through

Innovation. Washington (DC): National Academies Press (US); 2007. 3, Nuclear
Medicine Imaging in Diagnosis and Treatment.
[8] Moon D H, Maddahi J, Silverman D H, et al. Accuracy of whole-body fluorine-18-
FDG PET for the detection of recurrent or metastatic breast carcinoma. Journal of
nuclear medicine, 1998, 39(3): 431-435.
[9] Ntziachristos V, Ripoll J, Wang L V, et al. Looking and listening to light: the
evolution of whole-body photonic imaging. Nature biotechnology, 2005, 23(3):
313-320.
[10] Huh W K, Falvo J V, Gerke L C, et al. Global analysis of protein localization in
budding yeast. Nature, 2003, 425(6959): 686-691.
[11] Hoh C K, Hawkins R A, Glaspy J A, et al. Cancer detection with whole-body PET
using 2-[18F] fluoro-2-deoxy-D-glucose. Journal of computer assisted tomography,
1993, 17(4): 582-589.
[12] Martí‐Bonmatí L, Sopena R, Bartumeus P, et al. Multimodality imaging techniques.
Contrast media & molecular imaging, 2010, 5(4): 180-189.
[13] Massoud T F, Gambhir S S. Molecular imaging in living subjects: seeing
fundamental biological processes in a new light. Genes & development, 2003, 17(5):
545-580.
[14] Prescher J A, Bertozzi C R. Chemistry in living systems. Nature chemical biology,
2005, 1(1): 13-21.
[15] Rahmim A, Zaidi H. PET versus SPECT: strengths, limitations and challenges.
Nuclear medicine communications, 2008, 29(3): 193-207.

[16] Boellaard R. Standards for PET image acquisition and quantitative data analysis.
Journal of nuclear medicine, 2009, 50(Suppl 1): 11S-20S.
[17] Levin C S, Hoffman E J. Calculation of positron range and its effect on the
fundamental limit of positron emission tomography system spatial resolution.
Physics in Medicine and Biology, 1999, 44(3): 781.
[18] Evans R D, Noyau A. The atomic nucleus. New York: McGraw-Hill, 1955.
[19] Ter-Pogossian M M, Phelps M E, Hoffman E J, et al. A Positron-Emission
Transaxial Tomograph for Nuclear Imaging (PETT) 1. Radiology, 1975, 114(1):
89-98.
[20] Ter-Pogossian M M. Positron emission tomography (PET). Diagnostic Imaging in
Medicine, 1983: 273-277.
[21] Griffiths D J. Introduction to Elementary Particles. Wiley, 1987.
[22] Berends F A, Kleiss R. Distributions for Electron-Positron Annihilation into two
and three Photons. Nuclear Physics B, 1981, 186(1): 22-34.
[23] Phelps M E. PET: molecular imaging and its biological applications. Springer,
2004.
[24] Phelps M E, Hoffman E J, Mullani N A, et al. Application of annihilation
coincidence detection to transaxial reconstruction tomography. Journal of nuclear
medicine, 1975, 16(3): 210-224.
[25] Derenzo S E. Precision measurement of annihilation point spread distributions for
medically important positron emitters. Proceeding of the 5th International
Conference on Positron Annihilation, Lake Yamanaka, Japan, April 8-11, 1979.
[26] Phelps M E. PET: physics, instrumentation, and scanners. Springer, 2006.

[27] Frackowiak R. Positron Emission Tomography and Autoradiography: principles
and applications for the brain and heart. Journal of neurology, neurosurgery, and
psychiatry, 1986, 49(7): 848.
[28] Bell R E, Graham R L, Petch H E. Design and use of a coincidence circuit of short
resolving time. Canadian Journal of Physics, 1952, 30(1): 35-52.
[29] Sorenson J A, Phelps M E, Cherry S R. Physics in nuclear medicine. Saunders,
1987.
[30] Ter-Pogossian M M, Mullani N A, Ficke D C, et al. Photon time-of-flight-assisted
positron emission tomography. Journal of computer assisted tomography, 1981,
5(2): 227-239.
[31] Birks, J B. The theory and practice of scintillation counting. Pergamon Press, 1964.
[32] Knoll G F. Radiation detection and measurement. John Wiley & Sons, 2010.
[33] Steén M, Uhlén P. Development of a Time-of-Flight and 3D Demonstration Set-up
for Positron Emission Tomography. PhD thesis, The Royal Institute of Technology
Stockholm, 1998.
[34] Badawi R D, Marsden P K, Cronin B F, et al. Optimization of noise-equivalent
count rates in 3D PET. Physics in medicine and biology, 1996, 41(9): 1755.
[35] L'Annunziata M F. Handbook of radioactivity analysis. Academic press, 1998.
[36] Dahlbom M, MacDonald L R, Eriksson L, et al. Performance of a YSO/LSO
phoswich detector for use in a PET/SPECT system. Nuclear Science, IEEE
Transactions on, 1997, 44(3): 1114-1119.
[37] Ficke D C, Hood J T, Ter-Pogossian M M. A spheroid positron emission
tomograph for brain imaging: a feasibility study. Journal of Nuclear Medicine,
1996, 37(7): 1219-1225.
[38] Bailey D L. Quantification in 3D positron emission tomography. PhD thesis,
University of Surrey, 1996.
[39] Jadvar H, Parker J A. Clinical PET and PET/CT. Springer, 2005.
[40] Casey M E, Nutt R. A multicrystal two dimensional BGO detector system for
positron emission tomography. Nuclear Science, IEEE Transactions on, 33(1),460-
463, 1986.
[41] Casey ME, An Analysis of Counting Losses in Positron Emission Tomography
PhD Thesis, University of Tennessee, 1992.
[42] Anger H O. Scintillation Camera. Review of Scientific Instruments, 1958, 29(1): 27-
33.
[43] Fahey F H. Data acquisition in PET imaging. Journal of nuclear medicine
technology, 2002, 30(2): 39-49.
[44] Liow J-S, Strother SC. Normalisation using rotating rods for 3D PET, Proceedings
of the 3rd International Meeting on Fully Three-Dimensional Image
Reconstruction in Radiology and Nuclear Medicine, Aix-les-Bains, France, 1995.
[45] Hoffman E J, Guerrero T M, Germano G, et al. PET system calibrations and
corrections for quantitative and spatially accurate images. Nuclear Science, IEEE
Transactions on, 1989, 36(1): 1108-1112.
[46] Casey M E, Gadagkar H, Newport D. A component based method for
normalization in volume PET. Proceedings of the 3rd International Meeting on
Fully Three-Dimensional Image Reconstruction in Radiology and Nuclear
Medicine, Aix-les-Bains, France, 1996.
[47] Badawi R D, Lodge M A, Marsden P K. Algorithms for calculating detector
efficiency normalization coefficients for true coincidences in 3D PET. Physics in
medicine and biology, 1998, 43(1): 189.
[48] Thompson C J, Dagher A, Lunney D N, et al. A technique to reject scattered
radiation in PET transmission scans, Physics and Engineering of Computerized
Multidimensional Imaging and Processing. International Society for Optics and
Photonics, 1986: 244-253.
[49] Xu M, Cutler P D, Luk W K. Adaptive, segmented attenuation correction for
whole-body PET imaging. Nuclear Science, IEEE Transactions on, 1996, 43(1):
331-336.
[50] Tarantola G, Zito F, Gerundini P. PET instrumentation and reconstruction
algorithms in whole-body applications. Journal of Nuclear Medicine, 2003, 44(5):
756-769.
[51] Ollinger J M. Model-based scatter correction for fully 3D PET. Physics in medicine
and biology, 1996, 41(1): 153.
[52] Watson C C, Newport D, Casey M E. A single scatter simulation technique for
scatter correction in 3D PET, Three-dimensional image reconstruction in radiology
and nuclear medicine. Springer, 1996: 255-268.
[53] Weinberg S. The quantum theory of fields. Cambridge university press, 1996.
[54] Stearns CW. Scatter correction method for 3D PET using 2D fitted Gaussian
functions. Journal of Nuclear Medicine. 36 105P, 1995.

[55] Cherry S R, Huang S C. Effects of scatter on model parameter estimates in 3D PET
studies of the human brain. Nuclear Science, IEEE Transactions on, 1995, 42(4):
1174-1179.
[56] Cooke B E, Evans A C, Fanthome E O, et al. Performance figures and images from
the Therascan 3128 positron emission tomograph. Nuclear Science, IEEE
Transactions on, 1984, 31(1): 640-644.
[57] Leo W R. Techniques for nuclear and particle physics experiments: a how-to
approach. Springer, pp. 122–127. 1994.
[58] Sharma A, Walker J G. Paralyzable and nonparalyzable deadtime analysis in spatial
photon counting. Review of scientific instruments, 1992, 63(12): 5784-5793.
[59] Phelps M E, Hoffman E J, Huang S C, et al. Effect of positron range on spatial
resolution. Journal of nuclear medicine. 1975, 16(7): 649-652.
[60] Raylman R R, Hammer B E, Christensen N L. Combined MRI-PET scanner: a
Monte Carlo evaluation of the improvements in PET resolution due to the effects of
a static homogeneous magnetic field. Nuclear Science, IEEE Transactions on, 1996,
43(4): 2406-2412.
[61] Harrison R L, Kaplan M S, Vannoy S D, et al. Positron range and coincidence non-
collinearity in SimSET, Nuclear Science Symposium, 1999. Conference Record.
1999 IEEE. IEEE, 1999, 3: 1265-1268.
[62] Hoffman E J, Huang S C, Phelps M E. Quantitation in positron emission computed
tomography: 1. Effect of object size. Journal of computer assisted tomography,
1979, 3(3): 299-308.

[63] Soret M, Bacharach S L, Buvat I. Partial-volume effect in PET tumor imaging.
Journal of Nuclear Medicine, 2007, 48(6): 932-945.
[64] Morris E D, Endres C J, Schmidt K C, et al. Kinetic modeling in positron emission
tomography. Emission Tomography: The Fundamentals of PET and SPECT.
Academic, San Diego, 2004.
[65] Carson R E. Tracer kinetic modeling in PET. Positron Emission Tomography:
Basic Sciences, 2005: 127-159.
[66] Watabe H, Ikoma Y, Kimura Y, et al. PET kinetic analysis—compartmental model.
Annals of nuclear medicine, 2006, 20(9): 583-588.
[67] Phelps M E, Huang S C, Hoffman E J, et al. Tomographic measurement of local
cerebral glucose metabolic rate in humans with (F‐18) 2‐fluoro‐2‐deoxy‐D
‐glucose: validation of method. Annals of neurology, 1979, 6(5): 371-388.
[68] Sadato N, Tsuchida T, Nakaumra S, et al. Non-invasive estimation of the net influx
constant using the standardized uptake value for quantification of FDG uptake of
tumours. European journal of nuclear medicine, 1998, 25(6): 559-564.
[69] Pain F, Lanièce P, Mastrippolito R, et al. Arterial input function measurement
without blood sampling using a beta-microprobe in rats. Journal of Nuclear
Medicine, 2004;45(9):1577-82.
[70] Tai YC, Chatziioannou AF, Yang Y, et al. MicroPET II: design, development and
initial performance of an improved microPET scanner for small-animal imaging,
Physics in Medicine and Biology 2003;48:1519-1537.

[71] Laforest R, Longford D, Siegel S, et al. Performance evaluation of the
microPET®—FOCUS-F120, Nuclear Science, IEEE Transactions on,. 2007;54:42-
49.
[72] Laforest R, Sharp TL, Engelbach JA, et al. Measurement of input functions in
rodents: challenges and solutions, Nuclear Medicine and Biology. 2005;32:679-685.
[73] Wu HM, Sui G, Lee CC, Prins ML, Ladno W, et al. In vivo quantitation of glucose
metabolism in mice using small-animal PET and a microfluidic device, Journal of
Nuclear Medicine. 2007 May;48(5):837-45.
[74] Shoghi KI, Welch MJ, Hybrid image and blood sampling input function for
quantification of small animal dynamic PET data, Nuclear Medicine and Biology.
2007 Nov;34(8):989-94.
[75] Kim J, Herrero P, Sharp T, et al, Minimally invasive method of determining blood
input function from PET images in rodents, Journal of Nuclear Medicine. 2006
Feb;47(2):330-6.
[76] El Fakhri G, Sitek A, Guérin B, Kijewski MF, Di Carli MF, Moore SC.
Quantitative dynamic cardiac 82Rb PET using generalized factor and compartment
analyses, Journal of Nuclear Medicine. 2005 Aug;46(8):1264-71.
[77] Stout D, Kreissl MC, Wu HM, Schelbert HR, Huang SC, Left ventricular blood
TAC quantitation with microPET imaging in mice using MAP, FBP and blood
sampling, Nuclear Science Symposium Conference Record, 2005 IEEE, Volume: 5,
Page(s): 2529-2531.
[78] Cheng JC, Shoghi K, Laforest R, Quantitative accuracy of MAP reconstruction for
dynamic PET imaging in small animals, Medical Physics. 2012; 39:1029-41.

[79] Locke LW, Berr SS, Kundu BK, Image-derived input function from cardiac gated
maximum a posteriori reconstructed PET images in mice, Molecular Imaging and
Biology. 2011;13:342-347.
[80] Fang Y H D, Muzic R F. Spillover and partial-volume correction for image-derived
input functions for small-animal 18F-FDG PET studies. Journal of Nuclear
Medicine, 2008, 49(4): 606-614.
[81] Lee KH, Ko BH, Paik JY, et al. Effects of anesthetic agents and fasting duration
on F-18-FDG biodistribution and insulin levels in tumor-bearing mice, Journal of
Nuclear Medicine. 2005;46:1531-1536.
[82] Flores JE, McFarland LM, Vanderbilt A, et al. The effects of anesthetic agent and
carrier gas on blood glucose and tissue uptake in mice undergoing dynamic FDG-
PET imaging: sevoflurane and isoflurane compared in air and in oxygen, Molecular
Imaging and Biology. 2008;10:192-200.
[83] Yang Y, Rendig S, Siegel S, et al, Cardiac PET imaging in mice with simultaneous
cardiac and respiratory gating, Physics in Medicine and Biology 2005;50:2979-
2989.
[84] Locke LW, Williams MB, Fairchild KD, Zhong M, Kundu BK, Berr SS. FDG-PET
Quantification of Lung Inflammation with Image-Derived Blood Input Function in
Mice, International Journal of Molecular Imaging. 2011;2011:356730.
[85] Zhou Z, Kozlowski J, Goodrich A L, et al, Molecular imaging of lung glucose
uptake after endotoxin in mice, American Journal of Physiology, vol. 289, no. 5, pp.
L760–L768, 2005.

[86] Qi JY, Leahy RM, Cherry SR, et al, High-resolution 3D Bayesian image
reconstruction using the microPET small-animal scanner, Physics in Medicine and
Biology 1998;43:1001-1013.
[87] Sen S, Kundu B K, Wu H C J, et al. Glucose regulation of load‐induced mTOR
signaling and ER stress in mammalian heart. Journal of the American Heart
Association, 2013, 2(3): e004796.
[88] Krivokapich J, Huang SC, Phelps ME, et al., Estimation of rabbit myocardial
metabolic rate for glucose using fluorodeoxyglucose. American Journal of
Physiology, 243(6):H884-H895.. Dec. 1982.
[89] Feng D, Huang SC, Wang X., Models for computer simulation studies of input
functions for tracer kinetic modeling with positron emission tomography,
International Journal of Bio-Medical Computing. 1993; 32, 95-110.
[90] Sharp TL, Dence CS, Engelbach JA, et al., Techniques necessary for multi-tracer
quantitative small-animal imaging studies, Nuclear Medicine and Biology.
2005;32:875-884.
[91] Tantawy MN, Peterson TE, Simplified [18F]FDG image-derived input function
using the left ventricle, liver, and one venous blood sample, Molecular Imaging.
2010;9:76-86.
[92] Chen BB, Metzler SD, Lemaire A et al. Left ventricular functional assessment in
mice: feasibility of high spatial and temporal resolution ECG-gated blood pool
SPECT, Radiology. 2007; 245:440-448

[93] Convert L, Morin-Brassard G, Cadorette J, et al., A new tool for molecular imaging:
the microvolumetric beta blood counter, Journal of Nuclear Medicine.
2007;48:1197–1206.
[94] Bishop SP, Altschuld RA. Increased glycolytic metabolism in cardiac hypertrophy
and congestive failure. Am J Physiol. 1970;218:153-159.
[95] Taegtmeyer H, Overturf ML. Effects of moderate hypertension on cardiac function
and metabolism in the rabbit. Hypertension. 1988;11:416-426.
[96] Taegtmeyer H, Golfman L, Sharma S, et al. Linking gene expression to function:
Metabolic flexibility in the normal and diseased heart. Ann N Y Acad Sci.
2004;1015:202-213.
[97] Taegtmeyer H, Sen S, Vela D. Return to the fetal gene program: a suggested
metabolic link to gene expression in the heart. Ann N Y Acad Sci. 2010;1188:191-
198.
[98] Liao YL, Ishikura F, Beppu S, et al. Echocardiographic assessment of LV
hypertrophy and function in aortic-banded mice: necropsy validation. Am J Physiol.
Heart Circ Physiol. 2002;282:H1703-H1708.
[99] Hariharan R, Bray M, Ganim R, et al. Fundamental limitations of [18F]2-deoxy-2-
fluoro-D-glucose for assessing myocardial glucose uptake. Circulation.
1995;91:2435-2444.
[100] Botker HE, Bottcher M, Schmitz O, et al. Glucose uptake and lumped constant
variability in normal human hearts determined with [F-18]fluorodeoxyglucose. J
Nucl Cardiol. 1997;4:125-132.

[101] Ng CK, Holden JE, Degrado TR, et al. Sensitivity of myocardial
fluorodeoxyglucose lumped constant to glucose and insulin. Am J Physiol.
1991;260:H593-H603.
[102] Katsuji Hashimoto. Lumped constant for deoxyglucose is decreased when
myocardial glucose uptake is enhanced. Am J Physiol. Heart Circ Physiol. 1999;
276, 129-133.
[103] Shoghi KI, Gropler RJ, Sharp T, et al. Time course of alterations in myocardial
glucose utilization in the Zucker diabetic fatty rat with correlation to gene
expression of glucose transporters: a small-animal PET investigation. J Nucl Med.
2008;49:1320-1327.
[104] Shoghi KI, Finck BN, Schechtman KB, et al. In vivo metabolic phenotyping of
myocardial substrate metabolism in rodents: differential efficacy of metformin and
rosiglitazone monotherapy. Circ Cardiovasc Imaging. 2009;2:373-381.
[105] Wallhaus TR, Taylor M, Degrado TR, et al. Myocardial free fatty acid and glucose
use after carvedilol treatment in patients with congestive heart failure. Circulation.
2001;103:2441-2446.
[106] Taegtmeyer H, Hems R, Krebs HA. Utilization of energy-providing substrates in
the isolated working rat heart. Biochem J. 1980;186:701-711.
[107] Sharma S, Guthrie PH, Chan SS, et al. Glucose phosphorylation is required for
insulin-dependent mTOR signalling in the heart. Cardiovasc Res. 2007;76:71-80.
[108] Taegtmeyer H. Glucose for the heart: too much of a good thing? J Am Coll Cardiol.
2005;46(1):49-50.
[109] Taegtmeyer H, Dilsizian V. Imaging myocardial metabolism and ischemic memory.
Nat Clin Pract Cardiovasc Med. 2008;5 Suppl 2:S42-S48.
[110] Goodwin GW, Taylor CS, Taegtmeyer H. Regulation of energy metabolism of the
heart during acute increase in heart work. J Biol Chem. 1998;273:29530-29539.
[111] Mochizuki T, Tsukamoto E, Ono T, et al. Sequential change of BMIPP uptake with
age in spontaneously hypertensive rat model. Ann Nucl Med. 1997;11:299-306.
[112] de las FuentesL, Herrero P, Peterson LR, et al. Myocardial fatty acid metabolism:
independent predictor of left ventricular mass in hypertensive heart disease.
Hypertension. 2003;41:83-87.
[113] Wong KP, Sha W, Zhang X, Huang SC. Effects of administration route, dietary
condition, and blood glucose level on kinetics and uptake of 18F-FDG in mice. J
Nucl Med. 2011;52:800-807.
[114] Yokoyama I, Inoue Y, Moritan T, et al. Myocardial glucose utilisation in type II
diabetes mellitus patients treated with sulphonylurea drugs. Eur J Nucl Med Mol
Imaging. 2006;33:703-708.
[115] Botker HE, Goodwin GW, Holden JE, et al. Myocardial glucose uptake measured
with fluorodeoxyglucose: a proposed method to account for variable lumped
constants. J Nucl Med. 1999;40:1186-1196.
[116] Wiggers H, Bottcher M, Nielsen TT, et al. Measurement of myocardial glucose
uptake in patients with ischemic cardiomyopathy: application of a new quantitative
method using regional tracer kinetic information. J Nucl Med. 1999;40:1292-1300.

[117] Herrero P, Sharp TL, Dence C, et al. Comparison of 1-(11)C-glucose and (18)F-
FDG for quantifying myocardial glucose use with PET. J Nucl Med. 2002;43:1530-
1541.
[118] Nakamoto M, Ohya Y, Shinzato T et al. Pioglitazone, a thiazolidinedione
derivative, attenuates left ventricular hypertrophy and fibrosis in salt-sensitive
hypertension. Hypertension Res. 2008;31:353-361.
[119] Go A S, Mozaffarian D, Roger V L, et al. Heart disease and stroke statistics--2013
update: a report from the American Heart Association. Circulation, 2013, 127(1):
e6.
[120] Dunn F G, Pringle S D. Left ventricular hypertrophy and myocardial ischemia in
systemic hypertension. The American journal of cardiology, 1987, 60(17): 19-22.
[121] van Bilsen M, Smeets P J H, Gilde A J, et al. Metabolic remodelling of the failing
heart: the cardiac burn-out syndrome? Cardiovascular research, 2004, 61(2): 218-
226.
[122] Christe M E, Rodgers R L. Altered glucose and fatty acid oxidation in hearts of the
spontaneously hypertensive rat. Journal of molecular and cellular cardiology, 1994,
26(10): 1371-1375.
[123] Allard M F, Schonekess B O, Henning S L, et al. Contribution of oxidative
metabolism and glycolysis to ATP production in hypertrophied hearts. American
Journal of Physiology-Heart and Circulatory Physiology, 1994, 267(2): H742-
H750.

[124] Rajabi M, Kassiotis C, Razeghi P, et al. Return to the fetal gene program protects
the stressed heart: a strong hypothesis. Heart failure reviews, 2007, 12(3-4): 331-
343.
[125] Abel E D, Kaulbach H C, Tian R, et al. Cardiac hypertrophy with preserved
contractile function after selective deletion of GLUT4 from the heart. Journal of
Clinical Investigation, 1999, 104(12): 1703-1714.
[126] Ashrafian H, Frenneaux M P, Opie L H. Metabolic mechanisms in heart failure.
Circulation, 2007, 116(4): 434-448.
[127] Ashrafian H, Neubauer S. Metabolic modulation in heart failure: high time for a
definitive clinical trial. Heart, 2011, 97(4): 267-268.
[128] Ashrafian H, McKenna W J, Watkins H. Disease pathways and novel therapeutic
targets in hypertrophic cardiomyopathy. Circulation research, 2011, 109(1): 86-96.
[129] Lopaschuk G D. Optimizing cardiac fatty acid and glucose metabolism as an
approach to treating heart failure. Seminars in cardiothoracic and vascular
anesthesia. SAGE Publications, 2006, 10(3): 228-230.
[130] Taegtmeyer H. Cardiac metabolism as a target for the treatment of heart failure.
Circulation, 2004, 110(8): 894-896.
[131] Timmer S A J, Knaapen P. Coronary microvascular function, myocardial
metabolism, and energetics in hypertrophic cardiomyopathy: insights from positron
emission tomography. European Heart Journal–Cardiovascular Imaging, 2013,
14(2): 95-101.
[132] Gropler R J, Beanlands R S B, Dilsizian V, et al. Imaging myocardial metabolic
remodeling. Journal of Nuclear Medicine, 2010, 51(Supplement 1): 88S-101S.

[133] Gropler R J. Recent advances in metabolic imaging. Journal of Nuclear Cardiology,
2013, 20(6): 1147-1172.
[134] Osterholt M, Sen S, Dilsizian V, et al. Targeted metabolic imaging to improve the
management of heart disease. JACC: Cardiovascular Imaging, 2012, 5(2): 214-226.
[135] Devereux R B, Reichek N. Echocardiographic determination of left ventricular
mass in man. Anatomic validation of the method. Circulation, 1977, 55(4): 613-
618.
[136] Rockman H A, Ross R S, Harris A N, et al. Segregation of atrial-specific and
inducible expression of an atrial natriuretic factor transgene in an in vivo murine
model of cardiac hypertrophy. Proceedings of the National Academy of Sciences,
1991, 88(18): 8277-8281.
[137] Ingelsson E, Sundström J, Ärnlöv J, et al. Insulin resistance and risk of congestive
heart failure. Jama, 2005, 294(3): 334-341.
[138] Kao D P, Witteles R M, Quon A, et al. Rosiglitazone increases myocardial glucose
metabolism in insulin-resistant cardiomyopathy. Journal of the American College
of Cardiology, 2010, 55(9): 926-927.
[139] Rubin J, Matsushita K, Ballantyne C M, et al. Chronic hyperglycemia and
subclinical myocardial injury. Journal of the American College of Cardiology,
2012, 59(5): 484-489.
[140] Nissen S E, Wolski K. Effect of rosiglitazone on the risk of myocardial infarction
and death from cardiovascular causes. New England Journal of Medicine, 2007,
356(24): 2457-2471.

[141] Di Carli M F, Charytan D, McMahon G T, et al. Coronary circulatory function in
patients with the metabolic syndrome. Journal of Nuclear Medicine, 2011, 52(9):
1369-1377.
[142] Croteau E, Gascon S, Langlois R, et al. [11
C] Acetate rest–stress protocol to assess
myocardial perfusion and oxygen consumption reserve in a model of congestive
heart failure in rats. Nuclear medicine and biology, 2012, 39(2): 287-294.
[143] Ziadi M C, Williams K A, Guo A, et al. Impaired myocardial flow reserve on
rubidium-82 positron emission tomography imaging predicts adverse outcomes in
patients assessed for myocardial ischemia. Journal of the American College of
Cardiology, 2011, 58(7): 740-748.
[144] Ziadi M C, Williams K, Guo A, et al. Does quantification of myocardial flow
reserve using rubidium-82 positron emission tomography facilitate detection of
multivessel coronary artery disease? Journal of Nuclear Cardiology, 2012, 19(4):
670-680.
[145] Fiechter M, Gebhard C, Ghadri J R, et al. Myocardial perfusion imaging with 13
N-
Ammonia PET is a strong predictor for outcome. International journal of
cardiology, 2013, 167(3): 1023-1026.
[146] Berman D S, Germano G, Slomka P J. Improvement in PET myocardial perfusion
image quality and quantification with flurpiridaz F-18. Journal of Nuclear
Cardiology, 2012, 19(1): 38-45.
[147] Lamoureux M, Thorn S, Dumouchel T, et al. Uniformity and repeatability of
normal resting myocardial blood flow in rats using [13N]-ammonia and small
animal PET. Nuclear medicine communications, 2012, 33(9): 917-925.

[148] Croteau E, Bénard F, Bentourkia M, et al. Quantitative myocardial perfusion and
coronary reserve in rats with 13N-ammonia and small animal PET: impact of
anesthesia and pharmacologic stress agents. Journal of Nuclear Medicine, 2004,
45(11): 1924-1930.
[149] Inubushi M, Jordan M C, Roos K P, et al. Nitrogen-13 ammonia cardiac positron
emission tomography in mice: effects of clonidine-induced changes in cardiac work
on myocardial perfusion. European journal of nuclear medicine and molecular
imaging, 2004, 31(1): 110-116.
[150] Vaquero J J, Gao D W, García-Villaba C, et al. Approach to assessing myocardial
perfusion in rats using static [13N]-ammonia images and a small-animal PET.
Molecular Imaging and Biology, 2012, 14(5): 541-545.
[151] Vandsburger M H, Janiczek R L, Xu Y, et al. Improved arterial spin labeling after
myocardial infarction in mice using cardiac and respiratory gated look‐locker
imaging with fuzzy C‐means clustering. Magnetic Resonance in Medicine, 2010,
63(3): 648-657.
[152] Makowski M, Jansen C, Webb I, et al. First‐pass contrast‐enhanced myocardial
perfusion MRI in mice on a 3‐T clinical MR scanner. Magnetic Resonance in
Medicine, 2010, 64(6): 1592-1598.
[153] Cerqueira M D, Weissman N J, Dilsizian V, et al. Standardized myocardial
segmentation and nomenclature for tomographic imaging of the heart a statement
for healthcare professionals from the cardiac imaging committee of the Council on

Clinical Cardiology of the American Heart Association. Circulation, 2002, 105(4):
539-542.
[154] Bentourkia M, Croteau T, Langlois R, et al. Cardiac studies in rats with 11 C-
acetate and PET: a comparison with 13 N-ammonia. Nuclear Science, IEEE
Transactions on, 2002, 49(5): 2322-2327.