Quantitative comparison of five current protocols in gait ... · (Table 2), confining MAV to 21...
10
Quantitative comparison of five current protocols in gait analysis Alberto Ferrari a,b, * , Maria Grazia Benedetti a , Esteban Pavan c , Carlo Frigo c , Dario Bettinelli d , Marco Rabuffetti e , Paolo Crenna f , Alberto Leardini a a Movement Analysis Laboratory, Istituti Ortopedici Rizzoli, Bologna, Italy b Department of Electronics, Computer Science and Systems, University of Bologna, Italy c Movement Biomechanics and Motor Control Laboratory, Polytechnic of Milan, Italy d Aurion s.r.l., Milan, Italy e Centro di Bioingegneria, Fondazione Don Carlo Gnocchi IRCCS, Milan, Italy f Laboratorio per l’Analisi del Movimento nel Bambino (LAMB) P. & L. Mariani, Institute of Human Physiology I, University of Milan, Italy Received 23 May 2007; received in revised form 29 September 2007; accepted 27 November 2007 Abstract Data collection and reduction procedures, coherently structured in protocols, are necessary in gait analysis to make kinematic and kinetic measurements clinically comprehensible. The current protocols differ considerably for the marker-set and for the biomechanical model implemented. Nevertheless, conventional gait variables are compared without full awareness of these differences. A comparison was made of five worldwide representative protocols by analysing kinematics and kinetics of the trunk, pelvis and lower limbs exactly over the same gait cycles. A single comprehensive arrangement of markers was defined by merging the corresponding five marker-sets. This resulted in 60 markers to be positioned either on the skin or on wands, and in 16 anatomical landmark calibrations to be performed with an instrumented pointer. Two healthy subjects and one patient who had a special two degrees of freedom knee prosthesis implanted were analysed. Data from up-right posture and at least three gait repetitions were collected. Five corresponding experts participated in the data collection and analysed independently the data according to their own procedures. All five protocols showed good intra-protocol repeatability. Joint flexion/extension showed good correlations and a small bias among protocols. Out-of-sagittal plane rotations revealed worse correlations, and in particular knee abduction/adduction had opposite trends. Joint moments compared well, despite the very different methods implemented. The abduction/adduction at the prosthetic knee, which was fully restrained, revealed an erroneous rotation as large as 308 in one protocol. Higher correlations were observed between the protocols with similar biomechanical models, whereas little influence seems to be ascribed to the marker-set. # 2007 Elsevier B.V. All rights reserved. Keywords: Gait analysis; Inter-protocol repeatability; Kinematics; Kinetics; Data reduction 1. Introduction Protocols of gait analysis are intended to make kinematics and kinetics of pelvis and lower limbs clinically interpretable [1–4]. A protocol defines a biomechanical model and the procedures for data collection, processing, analysis and reporting of the results. Historically, probably because of the constraints implied in the pioneering technology, only few laboratories have developed their own protocol independently according to specific clinical requirements [5]. In addition to the different marker-sets and collection procedures, many important differences exist between the current protocols also in the biomechanical model, which includes the measured variables, degrees of freedom assigned to the joints, anatomical and technical references, joint rotation conventions and terminology. In spite of these differences, gait analysis data are shared, exchanged and interpreted irrespectively of the protocol adopted. Recent international initiatives in clinical gait analysis, such as web-accessible services for data repository www.elsevier.com/locate/gaitpost Available online at www.sciencedirect.com Gait & Posture 28 (2008) 207–216 * Corresponding author at: DEIS, University of Bologna, Viale Risorgi- mento 2, 40136 Bologna, Italy. Tel.: +39 0512093067; fax: +39 0512093540. E-mail address: [email protected] (A. Ferrari). 0966-6362/$ – see front matter # 2007 Elsevier B.V. All rights reserved. doi:10.1016/j.gaitpost.2007.11.009
Transcript of Quantitative comparison of five current protocols in gait ... · (Table 2), confining MAV to 21...

Quantitative comparison of five current protocols in gait analysis
Alberto Ferrari a,b,*, Maria Grazia Benedetti a, Esteban Pavan c, Carlo Frigo c, Dario Bettinelli d,Marco Rabuffetti e, Paolo Crenna f, Alberto Leardini a
a Movement Analysis Laboratory, Istituti Ortopedici Rizzoli, Bologna, Italyb Department of Electronics, Computer Science and Systems, University of Bologna, Italy
c Movement Biomechanics and Motor Control Laboratory, Polytechnic of Milan, Italyd Aurion s.r.l., Milan, Italy
e Centro di Bioingegneria, Fondazione Don Carlo Gnocchi IRCCS, Milan, Italyf Laboratorio per l’Analisi del Movimento nel Bambino (LAMB) P. & L. Mariani, Institute of Human Physiology I, University of Milan, Italy
Received 23 May 2007; received in revised form 29 September 2007; accepted 27 November 2007
www.elsevier.com/locate/gaitpost
Available online at www.sciencedirect.com
Gait & Posture 28 (2008) 207–216
Abstract
Data collection and reduction procedures, coherently structured in protocols, are necessary in gait analysis to make kinematic and kinetic
measurements clinically comprehensible. The current protocols differ considerably for the marker-set and for the biomechanical model
implemented. Nevertheless, conventional gait variables are compared without full awareness of these differences.
A comparison was made of five worldwide representative protocols by analysing kinematics and kinetics of the trunk, pelvis and lower
limbs exactly over the same gait cycles. A single comprehensive arrangement of markers was defined by merging the corresponding five
marker-sets. This resulted in 60 markers to be positioned either on the skin or on wands, and in 16 anatomical landmark calibrations to be
performed with an instrumented pointer. Two healthy subjects and one patient who had a special two degrees of freedom knee prosthesis
implanted were analysed. Data from up-right posture and at least three gait repetitions were collected. Five corresponding experts participated
in the data collection and analysed independently the data according to their own procedures.
All five protocols showed good intra-protocol repeatability. Joint flexion/extension showed good correlations and a small bias among
protocols. Out-of-sagittal plane rotations revealed worse correlations, and in particular knee abduction/adduction had opposite trends. Joint
moments compared well, despite the very different methods implemented. The abduction/adduction at the prosthetic knee, which was fully
restrained, revealed an erroneous rotation as large as 308 in one protocol. Higher correlations were observed between the protocols with
similar biomechanical models, whereas little influence seems to be ascribed to the marker-set.
# 2007 Elsevier B.V. All rights reserved.
Keywords: Gait analysis; Inter-protocol repeatability; Kinematics; Kinetics; Data reduction
1. Introduction
Protocols of gait analysis are intended to make
kinematics and kinetics of pelvis and lower limbs clinically
interpretable [1–4]. A protocol defines a biomechanical
model and the procedures for data collection, processing,
analysis and reporting of the results. Historically, probably
because of the constraints implied in the pioneering
* Corresponding author at: DEIS, University of Bologna, Viale Risorgi-
mento 2, 40136 Bologna, Italy. Tel.: +39 0512093067; fax: +39 0512093540.
E-mail address: [email protected] (A. Ferrari).
0966-6362/$ – see front matter # 2007 Elsevier B.V. All rights reserved.
doi:10.1016/j.gaitpost.2007.11.009
technology, only few laboratories have developed their
own protocol independently according to specific clinical
requirements [5]. In addition to the different marker-sets and
collection procedures, many important differences exist
between the current protocols also in the biomechanical
model, which includes the measured variables, degrees of
freedom assigned to the joints, anatomical and technical
references, joint rotation conventions and terminology. In
spite of these differences, gait analysis data are shared,
exchanged and interpreted irrespectively of the protocol
adopted. Recent international initiatives in clinical gait
analysis, such as web-accessible services for data repository

A. Ferrari et al. / Gait & Posture 28 (2008) 207–216208
[6] or data processing [7], do not impose strict rules about
the explicit indications of the protocol adopted. Although the
considerable methodological differences are expected to
produce inconsistent results, and therefore affect consider-
ably the clinical interpretation, it is still unknown to what
extent the different protocols used worldwide compare to
each other.
The original ‘Newington model’ [8,9] is the pioneer and
the most commonly used technique for gait data acquisition
and reduction. It has been also the basis of many commercial
software packages, the most recent being Plug-in Gait
(PiG—Vicon Motion Systems, Oxford, UK). The protocol
developed at the ‘Servizio di Analisi della Funzione
Locomotoria’ (SAFLo- [10]) implemented different seg-
mental anatomical references and external marker config-
urations. A little later, a distinction between internal
anatomical landmarks and external technical markers was
introduced [11]. This ‘Calibration Anatomical System
Technique’ (CAST) was followed by definitions of the
references [12] and a standard application [13]. Taking
advantage of recently published recommendations [14,15],
the protocols ‘Laboratorio per l’Analisi del Movimento nel
Bambino’ (LAMB) [16] and ‘Istituti Ortopedici Rizzoli
Gait’ [17] were also proposed. The latter was the basis of the
software ‘Total 3D Gait’ (T3Dg—Aurion s.r.l., Milan, Italy).
The precision and accuracy of gait analysis experiments
are certainly influenced by the instrumentation used [18] but
particularly by the interposition of soft tissues between
markers and bones, which have unpredictable effects [19,20].
In addition, there is natural intra-subject variability [21,22],
particularly associated to different walking speeds. Further-
more, large differences have been observed among subjects
[23–27], mainly associated to age, gender, body mass index
and probably to ethnic characteristics. Intra- [28] and inter-
examiner [29] gait data variability, resulting from inconsistent
bony landmark identification and marker positioning, has also
been underlined. Inter-laboratory variability has also been
analysed, before [5] and after [30] relevant instructions
provided to the examiners. However, all of these studies were
based on the ‘Newington model’ or its modifications, limiting
the figures of variability to that single protocol. A
quantification of inter-protocol variability is fundamental to
separate the variability associated to the protocol in itself from
that of all the other sources. Only a partial comparison
between two software versions of the ‘Newington model’ has
been reported [31]. Considerable differences were revealed in
many variable peaks although the mean difference over the
gait cycle was less than 18.The purpose of the present study was to assess the inter-
protocol variability of five different protocols and this was
achieved by analysing exactly the same gait acquisition. In
order to remove the variability associated to repeated gait
cycles and to focus on variability associated to more
conceptual differences, a single comprehensive marker-set
was devised from the union of the corresponding five. This
would contribute to giving a quantitative picture of all the
sources of variability, from the intra-subject to the inter-
protocol. By looking at several repetitions of the gait cycle,
we were aimed also at comparing intra- with inter-protocol
variability. Finally, the performance of these protocols was
compared also by analysing the errors implied in a special
condition where one joint degree of freedom was known a
priori.
2. Materials and methods
A single marker-set was designed to implement the five pro-
tocols under analysis, i.e. T3Dg [17], PiG [8,9], SAFLo [10], CAST
[13], LAMB [16], by limiting the total number of necessary
markers. This ultimately included 60 markers (Fig. 1): 22 on each
leg, 5 on the pelvis and 11 on the trunk. The lateral and medial
epicondyle markers were included in a special cluster of three
markers clamped to the femoral condyles as required by SAFLo
[10]. The two medial malleoli markers were removed after static
up-right posture acquisition. As for the CAST, four technical
markers were attached to each segment [13,19,32]. The great
trochanter, medial and lateral epicondyles, medial and lateral
malleoli, head of the fibula and tibial tuberosity were also cali-
brated in each leg by using a pointer on which two markers were
located at known distances from the tip [11–13]. All the other
landmarks necessary for this protocol were calibrated by using
corresponding markers in a single static up-right posture.
Two asymptomatic subjects (AF: 24 years, 188 cm, 74 kg; BM:
24 years, 181 cm, 89 kg) and one patient (SZM: 54 years, 177 cm,
95 kg) were analysed. The latter had a special knee prosthesis
(MRH Knee, Stryker Corporation) implanted, which allows rota-
tions about the medio-lateral axis of the femur (flexion/extension)
and about the longitudinal axis of the tibia (internal/external
rotation), while preventing fully abduction/adduction.
Marker trajectories and ground reaction forces were collected,
respectively by an eight-camera motion capture system (Vicon 612,
Vicon Motion Systems Ltd., Oxford, UK) and two force plates
(Kistler Instrument AG, Switzerland) at 100 samples per second.
Data acquisitions were carried out in the presence of experts for
each protocol, who performed all together landmark identification
and marker mounting. Each expert took the relevant anthropo-
metric measures required by his own protocol independently. The
subjects were asked to walk barefoot at their natural speed, and five
to six walking trials were recorded.
After each acquisition session, 3D marker trajectories were
reconstructed and the right and left stride phases were identified. At
least three gait cycles for each limb were selected on the basis of
good quality of the marker trajectories and ground reaction forces.
For each selected gait cycle, the marker trajectories of each marker-
set were extracted from the data file and provided to the expert of
each protocol together with relevant ground reaction forces. Dis-
tinct procedures for data filtering or smoothing, those characteristic
of each protocol, were applied independently by each expert.
Neither normalisation nor off-set subtraction was performed. Rele-
vant gait analysis results from the five elaborations and from the
repetitions were then superimposed in relevant plots, with a careful
comprehension of the variable correspondences, regardless of the
different terminology adopted. The variable units were unified, i.e.
segment and joint rotations were expressed in degrees and joint
moments in Newton metre (N*m).

A. Ferrari et al. / Gait & Posture 28 (2008) 207–216 209
Fig. 1. Diagram of the marker-set (antero-lateral—left and postero-lateral—right views) implemented for the experiments.
The mean absolute variability (MAV), i.e. maximum minus
minimum values along each frame averaged over all samples of the
gait cycle [5,17,29,30], was calculated for each variable. Once
normalised by the range of the variable, the mean relative varia-
bility (MRV%) was obtained. As for the joint moments, MAV and
MRV% applied only to the stance phase because CAST and T3Dg
assume a zero value in the swing phase. In order to identify
separately intra-subject variability, MAV and MRV% were also
calculated for some variables that are independent from protocol-
based processing, i.e. the vertical co-ordinate of markers and
ground reaction force. Coefficients of correlation (Pearson
moment) between any possible couple of protocols were calculated
by standard statistical analysis (Matlab, Mathworks, USA), as used
elsewhere [33]. The significance level of each correlation coeffi-
cient was obtained by computing the p-value. If the p-value was
small, say less than 0.001, the correlation was statistically sig-
nificant. The mean over trials of the correlation coefficients for each
gait variable was calculated after a ‘z-distribution’ transformation
[34].
3. Results
A very small intra-subject variability for both kinematic
and kinetic results was observed in each subject. In subject
AF, MRV% for the vertical co-ordinate of the sacrum, lateral
epicondyle and lateral malleolus was 9.0%, 9.2% and 4.9%,
respectively. MRV% of the vertical, medio-lateral and
antero-posterior components of the ground reaction force
was 4.7%, 11.3% and 5.6%, respectively. For these six
variables, the corresponding coefficients of correlations
A. Ferrari et al. / Gait & Posture 28 (2008) 207–216210
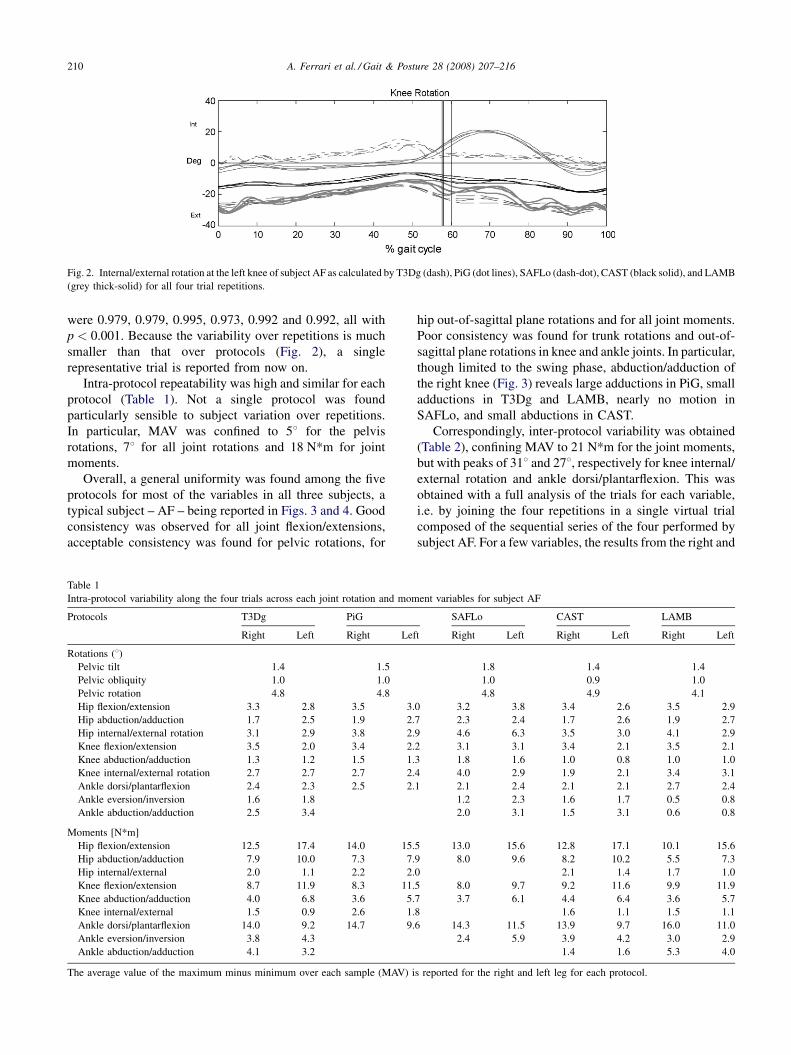
Fig. 2. Internal/external rotation at the left knee of subject AF as calculated by T3Dg (dash), PiG (dot lines), SAFLo (dash-dot), CAST (black solid), and LAMB
(grey thick-solid) for all four trial repetitions.
were 0.979, 0.979, 0.995, 0.973, 0.992 and 0.992, all with
p < 0.001. Because the variability over repetitions is much
smaller than that over protocols (Fig. 2), a single
representative trial is reported from now on.
Intra-protocol repeatability was high and similar for each
protocol (Table 1). Not a single protocol was found
particularly sensible to subject variation over repetitions.
In particular, MAV was confined to 58 for the pelvis
rotations, 78 for all joint rotations and 18 N*m for joint
moments.
Overall, a general uniformity was found among the five
protocols for most of the variables in all three subjects, a
typical subject – AF – being reported in Figs. 3 and 4. Good
consistency was observed for all joint flexion/extensions,
acceptable consistency was found for pelvic rotations, for
Table 1
Intra-protocol variability along the four trials across each joint rotation and mom
Protocols T3Dg PiG
Right Left Right Lef
Rotations (8)Pelvic tilt 1.4 1.5
Pelvic obliquity 1.0 1.0
Pelvic rotation 4.8 4.8
Hip flexion/extension 3.3 2.8 3.5 3.
Hip abduction/adduction 1.7 2.5 1.9 2.
Hip internal/external rotation 3.1 2.9 3.8 2.
Knee flexion/extension 3.5 2.0 3.4 2.
Knee abduction/adduction 1.3 1.2 1.5 1.
Knee internal/external rotation 2.7 2.7 2.7 2.
Ankle dorsi/plantarflexion 2.4 2.3 2.5 2.
Ankle eversion/inversion 1.6 1.8
Ankle abduction/adduction 2.5 3.4
Moments [N*m]
Hip flexion/extension 12.5 17.4 14.0 15.
Hip abduction/adduction 7.9 10.0 7.3 7.
Hip internal/external 2.0 1.1 2.2 2.
Knee flexion/extension 8.7 11.9 8.3 11.
Knee abduction/adduction 4.0 6.8 3.6 5.
Knee internal/external 1.5 0.9 2.6 1.
Ankle dorsi/plantarflexion 14.0 9.2 14.7 9.
Ankle eversion/inversion 3.8 4.3
Ankle abduction/adduction 4.1 3.2
The average value of the maximum minus minimum over each sample (MAV) i
hip out-of-sagittal plane rotations and for all joint moments.
Poor consistency was found for trunk rotations and out-of-
sagittal plane rotations in knee and ankle joints. In particular,
though limited to the swing phase, abduction/adduction of
the right knee (Fig. 3) reveals large adductions in PiG, small
adductions in T3Dg and LAMB, nearly no motion in
SAFLo, and small abductions in CAST.
Correspondingly, inter-protocol variability was obtained
(Table 2), confining MAV to 21 N*m for the joint moments,
but with peaks of 318 and 278, respectively for knee internal/
external rotation and ankle dorsi/plantarflexion. This was
obtained with a full analysis of the trials for each variable,
i.e. by joining the four repetitions in a single virtual trial
composed of the sequential series of the four performed by
subject AF. For a few variables, the results from the right and
ent variables for subject AF
SAFLo CAST LAMB
t Right Left Right Left Right Left
1.8 1.4 1.4
1.0 0.9 1.0
4.8 4.9 4.1
0 3.2 3.8 3.4 2.6 3.5 2.9
7 2.3 2.4 1.7 2.6 1.9 2.7
9 4.6 6.3 3.5 3.0 4.1 2.9
2 3.1 3.1 3.4 2.1 3.5 2.1
3 1.8 1.6 1.0 0.8 1.0 1.0
4 4.0 2.9 1.9 2.1 3.4 3.1
1 2.1 2.4 2.1 2.1 2.7 2.4
1.2 2.3 1.6 1.7 0.5 0.8
2.0 3.1 1.5 3.1 0.6 0.8
5 13.0 15.6 12.8 17.1 10.1 15.6
9 8.0 9.6 8.2 10.2 5.5 7.3
0 2.1 1.4 1.7 1.0
5 8.0 9.7 9.2 11.6 9.9 11.9
7 3.7 6.1 4.4 6.4 3.6 5.7
8 1.6 1.1 1.5 1.1
6 14.3 11.5 13.9 9.7 16.0 11.0
2.4 5.9 3.9 4.2 3.0 2.9
1.4 1.6 5.3 4.0
s reported for the right and left leg for each protocol.

A. Ferrari et al. / Gait & Posture 28 (2008) 207–216 211
Fig. 3. Kinematics variables as calculated by the five protocols (line styles as in Fig. 2) and relative to only one complete gait cycle of subject AF. Trunk, pelvis,
and right and left hips, knees, and ankles are reported over the rows; sagittal, frontal and transverse plane rotations over the columns. All five protocols reveal
abnormal motion at the left knee (see Section 4 for more details).

A. Ferrari et al. / Gait & Posture 28 (2008) 207–216212
Fig. 4. Kinetic variables of subject AF, line styles as in Fig. 2. The convention adopted was that of the external moment, i.e. the resultant moment of the external
forces.

A. Ferrari et al. / Gait & Posture 28 (2008) 207–216 213
Table 2
Inter-protocol variability across each joint rotation and moment obtained by
merging in a single virtual curve the four trials of subject AF
MAV MAV MRV% MRV%
Right Left Right Left
Rotations (8)Pelvic tilt 15.4 72.6
Pelvic obliquity 1.9 19.0
Pelvic rotation 3.6 16.6
Hip flexion/extension 20.4 18.2 29.9 25.8
Hip abduction/adduction 6.1 8.2 30.4 32.4
Hip internal/external rotation 17.0 21.0 38.1 47.2
Knee flexion/extension 5.8 7.7 8.4 10.8
Knee abduction/adduction 11.9 7.5 27.2 23.7
Knee internal/external rotation 25.6 30.9 56.3 56.9
Ankle dorsi/plantarflexion 25.5 26.8 44.3 48.0
Ankle eversion/inversion 18.5 18.2 57.9 56.7
Ankle abduction/adduction 12.0 20.8 38.7 55.3
Moments [N*m]
Hip flexion/extension 21.0 20.2 10.5 11.5
Hip abduction/adduction 18.1 16.9 13.5 13.2
Hip internal/external 4.2 2.5 17.3 23.7
Knee flexion/extension 15.0 15.0 13.2 18.2
Knee abduction/adduction 10.9 12.8 16.2 19.2
Knee internal/external 4.1 2.8 22.6 23.8
Ankle dorsi/plantarflexion 15.9 16.4 10.1 10.7
Ankle eversion/inversion 11.2 13.3 28.5 26.0
Ankle abduction/adduction 13.2 12.7 27.6 29.2
The maximum minus minimum value at each sample averaged over all
samples (MAV) and the same normalised by the range of excursion of the
relevant mean curve (MRV%) are reported for each variable.
Table 3
Mean and standard deviations of knee abduction/adduction along the three
trials for subject SZM
T3Dg PiG SAFLo CAST LAMB
Mean 2.2 8.1 0.7 1.3 2.5
Standard deviation 1.2 8.2 1.0 1.5 2.2
left legs were not fully consistent within this subject. Very
similar results were found for the other two subjects
analysed.
When analysing the kinematic results of the patient in
which abduction/adduction at the right knee was restrained
by the joint prosthesis (SZM, Fig. 5) the results from the PiG
protocol were the most critical, with a range of about 358.T3Dg, SAFLo, CAST and LAMB contained mean error
within 2.58 (Table 3).
Not a single couple of protocols emerged to be the most
correlated (Table 4 for subject AF) in no one of the two
subjects. Negative values, particularly in rotations out-of-
Fig. 5. Abduction/adduction at the right knee of subject SZM, as calculated by the
joint, this rotation is fully restrained, therefore the gold standard for this variabl
the-sagittal planes, reveal opposite trends. Good correlations
between protocols were found for the kinetics variables, the
largest being ankle dorsi/plantarflexion (r > 0.988,
p < 0.001). As for the kinematics variables, correlations
were found smaller for rotations out-of-sagittal planes than
for flexion/extensions. The correlation coefficient r for these
latter was never smaller than 0.993 ( p < 0.001) for the hip,
0.992 ( p < 0.001) for the knee and 0.957 ( p < 0.001) for
the ankle joints.
4. Discussion
Frequently, gait analysis results are interpreted and
compared with limited consciousness of the conceptual and
practical choices implied in the relevant protocol. In the
present study, single gait cycles were analysed simulta-
neously by using five different protocols, which represent
the large majority of those commonly used in gait analysis.
Conformity with the original protocol design, i.e. biome-
chanical interpretation and marker-set, was ensured by
direct participation of relevant experts, involved both in data
collection and reduction.
The overall procedures were repeated in only three
volunteers. However, the analyses of the right and left legs
imply distinguished experiments, involving independent
landmark identification, marker attachment, anthropometric
measurement and data processing. In addition, subject SZM
had a special knee prosthesis in only one leg. Finally, it
turned out that subject AF had congenital leg length
discrepancy (about 4 cm), which resulted in considerably
different patterns between legs. Therefore, the present study
should be regarded as composed by independent analyses of
three trunks and pelves and six legs.
five protocols over the three trial repetitions (line styles as in Fig. 2). In this
e is zero.
A.
Ferra
riet
al./G
ait
&P
ostu
re2
8(2
00
8)
20
7–
21
62
14
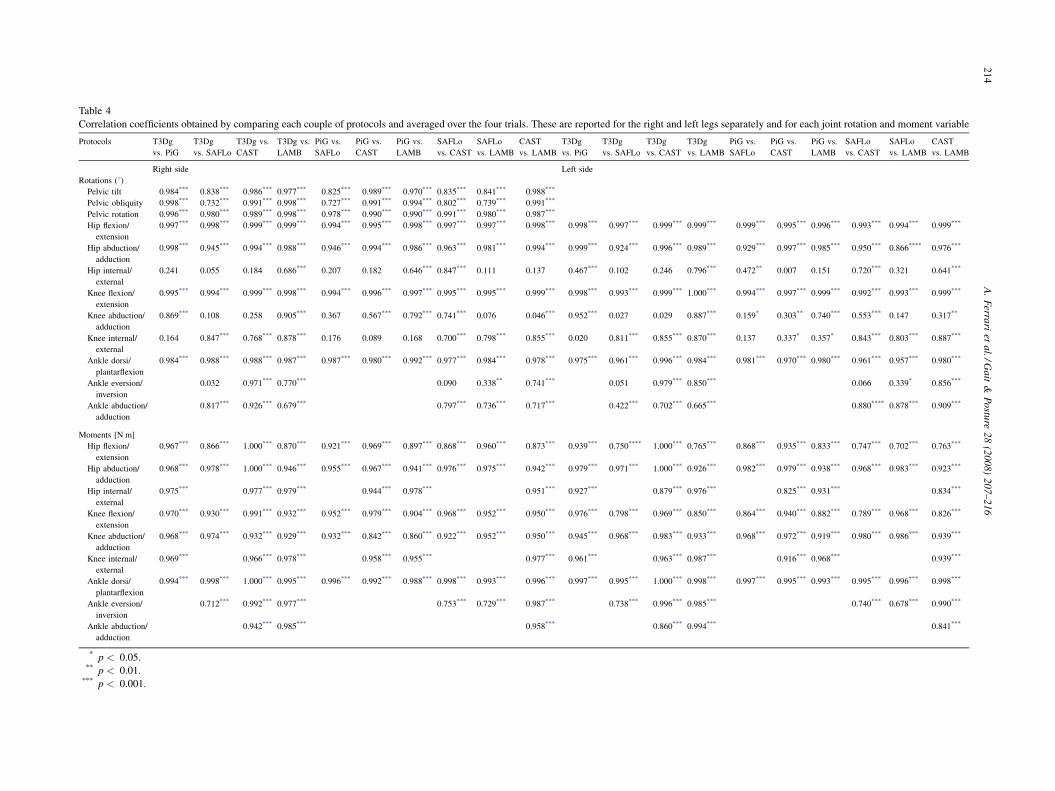
Table 4
Correlation coefficients obtained by comparing each couple of protocols and averaged over the four trials. These are reported for the right and left legs separately and for each joint rotation and moment variable
Protocols T3Dg
vs. PiG
T3Dg
vs. SAFLo
T3Dg vs.
CAST
T3Dg vs.
LAMB
PiG vs.
SAFLo
PiG vs.
CAST
PiG vs.
LAMB
SAFLo
vs. CAST
SAFLo
vs. LAMB
CAST
vs. LAMB
T3Dg
vs. PiG
T3Dg
vs. SAFLo
T3Dg
vs. CAST
T3Dg
vs. LAMB
PiG vs.
SAFLo
PiG vs.
CAST
PiG vs.
LAMB
SAFLo
vs. CAST
SAFLo
vs. LAMB
CAST
vs. LAMB
Right side Left side
Rotations (8)Pelvic tilt 0.984*** 0.838*** 0.986*** 0.977*** 0.825*** 0.989*** 0.970*** 0.835*** 0.841*** 0.988***
Pelvic obliquity 0.998*** 0.732*** 0.991*** 0.998*** 0.727*** 0.991*** 0.994*** 0.802*** 0.739*** 0.991***
Pelvic rotation 0.996*** 0.980*** 0.989*** 0.998*** 0.978*** 0.990*** 0.990*** 0.991*** 0.980*** 0.987***
Hip flexion/
extension
0.997*** 0.998*** 0.999*** 0.999*** 0.994*** 0.995*** 0.998*** 0.997*** 0.997*** 0.998*** 0.998*** 0.997*** 0.999*** 0.999*** 0.999*** 0.995*** 0.996*** 0.993*** 0.994*** 0.999***
Hip abduction/
adduction
0.998*** 0.945*** 0.994*** 0.988*** 0.946*** 0.994*** 0.986*** 0.963*** 0.981*** 0.994*** 0.999*** 0.924*** 0.996*** 0.989*** 0.929*** 0.997*** 0.985*** 0.950*** 0.866**** 0.976***
Hip internal/
external
0.241 �0.055 �0.184 0.686*** �0.207 �0.182 0.646*** 0.847*** 0.111 0.137 0.467*** 0.102 0.246 0.796*** 0.472** 0.007 0.151 0.720*** 0.321 0.641***
Knee flexion/
extension
0.995*** 0.994*** 0.999*** 0.998*** 0.994*** 0.996*** 0.997*** 0.995*** 0.995*** 0.999*** 0.998*** 0.993*** 0.999*** 1.000*** 0.994*** 0.997*** 0.999*** 0.992*** 0.993*** 0.999***
Knee abduction/
adduction
0.869*** �0.108 �0.258 0.905*** �0.367 �0.567*** 0.792*** 0.741*** 0.076 �0.046*** 0.952*** 0.027 �0.029 0.887*** �0.159* �0.303** 0.740*** 0.553*** 0.147 0.317**
Knee internal/
external
�0.164 0.847*** 0.768*** 0.878*** �0.176 �0.089 �0.168 0.700*** 0.798*** 0.855*** �0.020 0.811*** 0.855*** 0.870*** 0.137 0.337* 0.357* 0.843*** 0.803*** 0.887***
Ankle dorsi/
plantarflexion
0.984*** 0.988*** 0.988*** 0.987*** 0.987*** 0.980*** 0.992*** 0.977*** 0.984*** 0.978*** 0.975*** 0.961*** 0.996*** 0.984*** 0.981*** 0.970*** 0.980*** 0.961*** 0.957*** 0.980***
Ankle eversion/
inversion
�0.032 0.971*** 0.770*** 0.090 0.338** 0.741*** �0.051 0.979*** 0.850*** �0.066 0.339* 0.856***
Ankle abduction/
adduction
0.817*** 0.926*** 0.679*** 0.797*** 0.736*** 0.717*** 0.422*** 0.702*** 0.665*** 0.880**** 0.878*** 0.909***
Moments [N m]
Hip flexion/
extension
0.967*** 0.866*** 1.000*** 0.870*** 0.921*** 0.969*** 0.897*** 0.868*** 0.960*** 0.873*** 0.939*** 0.750**** 1.000*** 0.765*** 0.868*** 0.935*** 0.833*** 0.747*** 0.702*** 0.763***
Hip abduction/
adduction
0.968*** 0.978*** 1.000*** 0.946*** 0.955*** 0.967*** 0.941*** 0.976*** 0.975*** 0.942*** 0.979*** 0.971*** 1.000*** 0.926*** 0.982*** 0.979*** 0.938*** 0.968*** 0.983*** 0.923***
Hip internal/
external
0.975*** 0.977*** 0.979*** 0.944*** 0.978*** 0.951*** 0.927*** 0.879*** 0.976*** 0.825*** 0.931*** 0.834***
Knee flexion/
extension
0.970*** 0.930*** 0.991*** 0.932*** 0.952*** 0.979*** 0.904*** 0.968*** 0.952*** 0.950*** 0.976*** 0.798*** 0.969*** 0.850*** 0.864*** 0.940*** 0.882*** 0.789*** 0.968*** 0.826***
Knee abduction/
adduction
0.968*** 0.974*** 0.932*** 0.929*** 0.932*** 0.842*** 0.860*** 0.922*** 0.952*** 0.950*** 0.945*** 0.968*** 0.983*** 0.933*** 0.968*** 0.972*** 0.919*** 0.980*** 0.986*** 0.939***
Knee internal/
external
0.969*** 0.966*** 0.978*** 0.958*** 0.955*** 0.977*** 0.961*** 0.963*** 0.987*** 0.916*** 0.968*** 0.939***
Ankle dorsi/
plantarflexion
0.994*** 0.998*** 1.000*** 0.995*** 0.996*** 0.992*** 0.988*** 0.998*** 0.993*** 0.996*** 0.997*** 0.995*** 1.000*** 0.998*** 0.997*** 0.995*** 0.993*** 0.995*** 0.996*** 0.998***
Ankle eversion/
inversion
0.712*** 0.992*** 0.977*** 0.753*** 0.729*** 0.987*** 0.738*** 0.996*** 0.985*** 0.740*** 0.678*** 0.990***
Ankle abduction/
adduction
0.942*** 0.985*** 0.958*** 0.860*** 0.994*** 0.841***
* p < 0.05.** p < 0.01.
*** p < 0.001.
A. Ferrari et al. / Gait & Posture 28 (2008) 207–216 215
Intra-protocol variability was small for all five protocols.
This implies that intra-subject repeatability over the trials,
however small in the three subjects analysed, was reported
consistently over the protocols. In addition, the comparison
of values in Tables 1 and 2 shows that inter-protocol
variability is clearly larger than intra-protocol variability,
except for pelvis rotation.
Overall the gait variables are comparable among
protocols (Fig. 3), despite the large differences between
models and marker-sets. Joint kinematics showed larger
inter-protocol differences than joint kinetics. Flexion/
extension had good waveform correlations with small bias
differences in all joints except the ankle. On the contrary,
out-of-sagittal plane rotations, especially at the knee and
ankle joints, revealed poor waveform correlations and even
considerable bias differences. The largest variability was
observed at knee abduction/adduction where even opposite
trends were observed. The extent to which this is due to the
different models, marker-set or to relevant skin artefact is
not known. Because similar patterns were observed over the
six knees, it is hypothesized that a bias associated to the axis
of rotation and related cross-talk is more plausible than an
erroneous positioning of the markers.
The large consistency observed for the joint moments is
noteworthy because of the known substantial differences
between protocols about this calculation. LAMB, SAFLo and
PiG use standard inverse dynamics, whereas T3Dg and CAST
use only the external ground reaction force. Estimation of the
joint centres is also very critical, and each protocol uses
different techniques. This acceptable coherence on the results
may further support the role of the external force, which must
be predominant in gait at natural speed.
The PiG, based on the original Newington model, and
SAFLo are among the pioneering protocols for gait analysis.
When these were devised, basic instrumentation and limited
knowledge of the skin artefacts were available. Therefore, it is
remarkable that these protocols have obtained adequate
correlation with the more recent ones for most of the gait
variables. Bias and correlation differences of SAFLo are
straightforwardly accounted for the specific anatomical
references particularly for the pelvis and the ankle. T3Dg
is a recent development of the general CAST approach. The
very similar relevant results support further the fact that a
small deterioration of the results is expected when the location
of markers in the central area of the segments and calibration
of landmarks via an instrumented pointer are substituted with
direct skin marker placement. T3Dg and LAMB protocols
share most model definitions except the equations for hip joint
centre estimation (according to Refs. [35] and [8], res-
pectively). Slightly different choices are adopted also for the
marker-set, but all this did not result in considerable final
differences for the gait variables. Overall, the high correlation
obtained for the variables calculated by CAST, LAMB and
T3Dg (Table 4) suggests that a large uniformity of the results
is associated more to the consistency of the biomechanical
conventions than to the design of the relevant marker-sets.
The abduction/adduction of the right knee of subject SZM
(Fig. 5 and Table 3), i.e. the gold standard, revealed a
considerably different performance of PiG with respect to the
other protocols, though limited to the first half of the swing
phase. This might have been due to an incorrect marker
location resulting in incorrect alignment of the axis of rotation
and therefore in cross-talk from flexion/extension, relatively
large in that phase, to abduction/adduction. However, most of
these markers are shared by the other protocols. In addition, a
predisposition to larger abductions at the knee for this
protocol was reported for all six knees. A larger variability for
the joint rotations that require careful alignment of the wands
was reported for this protocol also elsewhere [5,30]. The best
performance in assessing this gold standard was obtained by
SAFLo. This protocol identifies the flexion axis of the knee
with a functional approach [36], which is expected to reduce
this cross-talk.
The above remarks are only preliminary accounts of the
observed differences. A thorough and rational comparison of
the five techniques is possible by looking at every single gait
variable and by inferring relevant justifications for these.
The task is however not easy because the time-history of
each variable results from an intrigued interplay of reference
definitions, kinematics conventions and artefactual motion.
In conclusion, the comparison of the results from the five
protocols on the same gait cycles revealed first of all good
intra-protocol repeatability. Despite the known large differ-
ences among the techniques, good correlations were observed
for most of the gait variables. As for the exact variable
patterns, good consistency was found for all joint flexion/
extensions and pelvic rotations. Acceptable consistency was
found for hip out-of-sagittal plane rotations and nearly all
joint moments, whereas it was poor in knee and ankle out-of-
sagittal plane rotations. For the latter therefore, it is
recommended that comparison of the results among protocols
be very careful. The variability associated to the protocol used
seems much larger than that associated to inter-observer and
even inter-laboratory comparisons [5,17,29,30] for most of
the gait variables. It might be also pointed out that, in general,
model conventions and definitions seem more crucial than the
design of the relevant marker-sets, and that therefore sharing
the former can be sufficient for worldwide clinical gait
analysis data comparison.
Conflict of interest statement
The author states that there is no conflict of interests for
the manuscript.
References
[1] Gage JR. Gait analysis. An essential tool in the treatment of cerebral
palsy. Clin Orthop 1993;288:126–34.
[2] Andriacchi TP, Alexander EJ. Studies of human locomotion: past,
present and future. J Biomech 2000;33(10):1217–24.

A. Ferrari et al. / Gait & Posture 28 (2008) 207–216216
[3] Sutherland DH. The evolution of clinical gait analysis. Part II. Kine-
matics. Gait Posture 2002;16:159–79.
[4] Sutherland DH. The evolution of clinical gait analysis. Part III.
Kinetics and energy assessment. Gait Posture 2005;21(4):447–61.
[5] Gorton G, Hebert D, Goode B. Assessment of the kinematic variability
between twelve Shriners Motion Analysis Laboratories. Gait Posture
2001;13:247.
[6] Tirosh O, Baker R. Gaitabase: new approach to clinical gait analysis.
Gait Posture 2006;24(Suppl. 2):S52–3.
[7] Della Croce U. Ahmica: analysis of human movement integrated with
calibrated anatomy. SIAMOC06, Methodological tutorial, internal
report; 2006. http://www.ahmica.org.
[8] Davis III RB, Ounpuu S, Tyburski D, Gage JR. A gait data collection
and reduction technique. Hum Mov Sci 1991;10:575–87.
[9] Kadaba MP, Ramakrishnan HK, Wootten ME. Measurement of lower
extremity kinematics during level walking. J Orthop Res 1989;8:383–
92.
[10] Frigo C, Rabuffetti M, Kerrigan DC, Deming LC, Pedotti A. Func-
tionally oriented and clinically feasible quantitative gait analysis
method. Med Biol Eng Comput 1998;36(2):179–85.
[11] Cappozzo A. Gait analysis methodology. Hum Mov Sci 1984;3:25–54.
[12] Cappozzo A, Catani F, Della Croce U, Leardini A. Position and
orientation in space of bones during movement: anatomical frame
definition and determination. Clin Biomech 1995;10(4):171–8.
[13] Benedetti MG, Catani F, Leardini A, Pignotti E, Giannini S. Data
management in gait analysis for clinical applications. Clin Biomech
1998;13(3):204–15.
[14] Wu G, Cavanagh PR. ISB recommendations for standardization in the
reporting of kinematic data. J Biomech 1995;28(10):1257–61.
[15] Wu G, Siegler S, Allard P, Kirtley C, Leardini A, Rosenbaum D, et al.
ISB recommendation on definitions of joint coordinate system of
various joints for the reporting of human joint motion. Part I. Ankle,
hip and spine. J Biomech 2002;35(4):543–8.
[16] Rabuffetti M, Crenna P. A modular protocol for the analysis of
movement in children. Gait Posture 2004;20:S77–8.
[17] Leardini A, Sawacha Z, Paolini G, Ingrosso S, Nativo R, Benedetti
MG. A new anatomically-based protocol for gait analysis in children.
Gait Posture 2007. February 7 [epub ahead of print].
[18] Chiari L, Della Croce U, Leardini A, Cappozzo A. Human movement
analysis using stereophotogrammetry. Part 2. Instrumental errors. Gait
Posture 2005;21(2):197–211.
[19] Leardini A, Chiari L, Della Croce U, Cappozzo A. Human movement
analysis using stereophotogrammetry. Part 3. Soft tissue artefact
assessment and compensation. Gait Posture 2005;21(2):212–25.
[20] Della Croce U, Leardini A, Chiari L, Cappozzo A. Human movement
analysis using stereophotogrammetry. Part 4. Assessment of anato-
mical landmark misplacement and its effects on joint kinematics. Gait
Posture 2005;21(2):226–37.
[21] Oeffinger DJ, Augsburger S, Cupp T. Pediatric kinetics. Age related
changes in able-bodied populations. Gait Posture 1997;5:155–6.
[22] Steinwender G, Saraph V, Scheiber S, Zwick EB, Uitz C, Hackl K.
Intrasubject repeatability of gait analysis data in normal and spastic
children. Clin Biomech 2000;15(2):134–9.
[23] Ounpuu S, Gage JR, Davis RB. Three-dimensional lower extremity
joint kinetics in normal pediatric gait. J Pediatr Orthop 1991;11:341–9.
[24] Sutherland DH, Olshen RA, Biden EN, Wyatt MP. The development of
mature walking. Philadelphia, USA: Mac Keith Press; 1988. pp. 66–
153.
[25] Stansfield BW, Hazlewood ME, Hillman SJ, Lawson AM, Loudon IR,
Mann AR, et al. Sagittal joint angles, moments and powers are
predominantly characterised by speed of progression, not age in 7–
12-year old normal children walking at self selected speeds. J Pediatr
Orthop 2001;21:403–11.
[26] Kadaba MP, Ramakrishnan HK, Wootten ME, Gainey J, Gorton G,
Cochran GVB. Repeatability of kinematic kinetic and electromyo-
graphic data in normal adult gait. J Orthop Res 1989;7(6):849–60.
[27] Yavuzer G, Oken O, Elhan A, Stam H. Repeatability of time–distance
parameters and lower limb 3D kinematics in patients with stroke. In:
Proceedings of 1st Joint ESMAC-GCMAS Meeting (JEGM06); 2006.
pp. 63.
[28] Della Croce U, Cappozzo A, Kerrigan DC. Pelvis and lower limb
anatomical landmark calibration precision and its propagation to
bone geometry and joint angles. Med Biol Eng Comput 1999;
36:155–61.
[29] Noonan KJ, Halliday S, Browne R, O’Brien S, Kayes K, Feinberg J.
Interobserver variability of gait analysis in patients with cerebral palsy.
J Pediatr Orthop 2003;23(3):279–87.
[30] Gorton G, Hebert D, Goode B. Assessment of the kinematic variability
between 12 Shriners Motion Analysis Laboratories. Part 2. Short term
follow up. Gait Posture 2002;16(Suppl. 1):S65–6.
[31] Dorociak RD. A comparison of normal kinematics for Vicon clinical
manager and plug in gait. Gait Posture 2002;16:S102–3.
[32] Stagni R, Fantozzi S, Cappello A, Leardini A. Quantification of soft
tissue artefact in motion analysis by combining 3D fluoroscopy and
stereophotogrammetry: a study on two subjects. Clin Biomech
2002;20(3):320–9.
[33] Lucchetti L, Cappozzo A, Cappello A, Della Croce U. Skin movement
artefact assessment and compensation in the estimation of knee-joint
kinematics. J Biomech 1998;31(11):977–84.
[34] Zar JH. Biostatistical analysis, 4th ed., Prentice Hall; 1999. pp. 390–4.
[35] Bell AL, Pedersen DR, Brand RA. A comparison of the accuracy of
several hip center location prediction methods. J Biomech
1990;23(6):617–21.
[36] Frigo C, Rabuffetti M. Multifactorial estimation of hip and knee joint
centres for clinical application of gait analysis. Gait Posture 1998;8:
91–102.