Quantitative Characterization of Peening Processes … · to the quantitative characterization and...
4
In the Spot Light! Why Use XRD Analysis? X-ray diffraction (XRD) based residual stress measurements have been applied to the quantitative characterization and evaluation of numerous peening pro- cesses in a wide variety of applications and industries. As such, XRD has been a very flexible and invaluable tool for process development and optimization where the best peening parameters for a given component must be characterized quantitatively. Components treated with conventional peening/blasting media such as cast shot, cut wire and glass bead (as well as those treated with more unconventional treatments such as laser shock peening) have been successfully characterized using XRD techniques. Peening is often used to in- troduce compressive surface and near surface residual stresses in components and if applied correctly, can provide a significant improvement in component performance and service life. The de- signed fatigue life and/or warranty period is achieved or exceeded with the aid of peening in many cases where unpeened components may fail prema- turely. Since peening is a value added process, its effects should be optimized using XRD analysis to obtain the most "bang for the buck". Characterization of residual stresses in peened components provides the information engineers and manufacturers need to properly man- age the peening process to optimize product quality, minimize the effects of fatigue and stress corrosion for the end user, help minimize development and production costs, potentially re- duce component weight and enhance component performance. How does XRD work? X-rays are diffracted by atoms arranged periodically in the grain structure of crystalline and polycrystalline materials such as metals and ceramics (see figure 1). The angle of a diffracted x-ray beam θ is related to the atomic lattice spacing d via Braggs law: n λ = 2 d sin θ where λ is the wavelength of the incident x-ray beam and n =1 for first order diffraction (see figure 2). By measuring the diffrac- tion angle θ for a given wavelength λ , the atomic d-spacing and thus the strain can be calculated for the sampled vol- ume. The stress is then calculated by applying elasticity theory. What can XRD tell that the Almen strip cannot? Peening effectiveness is normally characterized via the Almen intensity and the % coverage. It should be noted that many potentially different residual stress gradients can result from what may appear to be the same deflection of the Almen strip and observed % coverage. The % coverage is an optical assessment of the "as peened" surface, and is generally thought of as a mea- sure of the uniformity of peening on the component surface. However, uni- form coverage does not always result in a uniform stress state. Consider the following example of a weldment shot peened with CW-28 shot at 16-18A in- The residual stresses present in manufactured components, assemblies and structures can significantly improve or diminish their useful life. Proto Mfg. has been helping companies for over 20 years with the measurement of residual stresses in the laboratory, on the shop floor and in the field by providing both sales of standard and custom instrumentation as well as measurement services. Quantitative Characterization of Peening Processes Using X-ray Diffraction Residual Stress Analysis Fig. 3: View of shot peened and masked area of weldment Fig. 1: Diffraction peaks Fig. 2: Bragg's law X-RAY DIFFRACTION RESIDUAL STRESS MEASUREMENT AND SHOT PEENING Proto Manufacturing is a world leader in the measurement of residual stress using XRD. Some examples of applications include stress measurements on suspension bridges, ships and submarines, natural gas pipelines, as well as automotive and aerospace components.
-
Upload
hoangthien -
Category
Documents
-
view
213 -
download
0
Transcript of Quantitative Characterization of Peening Processes … · to the quantitative characterization and...

In the Spot Light!
Why Use XRD Analysis?
X-ray diffraction (XRD) based residual
stress measurements have been applied
to the quantitative characterization and
evaluation of numerous peening pro-
cesses in a wide variety of applications
and industries. As such, XRD has been
a very flexible and invaluable tool for
process development and optimization
where the best peening parameters for a
given component must be characterized
quantitatively. Components treated
with conventional peening/blasting
media such as cast shot, cut wire and
glass bead (as well as those treated
with more unconventional treatments
such as laser shock peening) have been
successfully characterized using XRD
techniques. Peening is often used to in-
troduce compressive surface and near
surface residual stresses in components
and if applied correctly, can provide a
significant improvement in component
performance and service life. The de-
signed fatigue life and/or warranty
period is achieved or exceeded with
the aid of peening in many cases where
unpeened components may fail prema-
turely. Since peening is a value added
process, its effects should be optimized
using XRD analysis to obtain the most
"bang for the buck". Characterization of
residual stresses in peened components
provides the information engineers and
manufacturers need to properly man-
age the peening process to optimize
product quality, minimize the effects
of fatigue and stress corrosion for the
end user, help minimize development
and production costs, potentially re-
duce component weight and enhance
component performance.
How does XRD work?
X-rays are diffracted by atoms arranged
periodically in the grain structure of
crystalline and polycrystalline materials
such as metals and ceramics (see figure
1). The angle of a diffracted x-ray beam
θ is related to the atomic lattice spacing
d via Braggs law: n λ = 2 d sin θ where λ
is the wavelength of the incident x-ray
beam and n =1 for first order diffraction
(see figure 2). By measuring the diffrac-
tion angle θ for a given wavelength λ ,
the atomic d-spacing and thus the strain
can be calculated for the sampled vol-
ume. The stress is then calculated by
applying elasticity theory.
What can XRD tell that the Almen
strip cannot?
Peening effectiveness is normally
characterized via the Almen intensity
and the % coverage. It should be noted
that many potentially different residual
stress gradients can result from what
may appear to be the same deflection
of the Almen strip and observed %
coverage. The % coverage is an optical
assessment of the "as peened" surface,
and is generally thought of as a mea-
sure of the uniformity of peening on
the component surface. However, uni-
form coverage does not always result
in a uniform stress state. Consider the
following example of a weldment shot
peened with CW-28 shot at 16-18A in-
The residual stresses present in manufactured components, assemblies and
structures can significantly improve or diminish their useful life. Proto Mfg.
has been helping companies for over 20 years with the measurement
of residual stresses in the laboratory, on the shop floor and in the field by
providing both sales of standard and custom instrumentation as well as
measurement services.
Quantitative Characterization
of Peening Processes Using
X-ray Diffraction Residual Stress
Analysis
Fig. 3: View of shot peened and masked
area of weldment
Fig. 1: Diffraction peaks
Fig. 2: Bragg's law
X-RAY DIFFRACTION RESIDUAL STRESS MEASUREMENT AND SHOT PEENING
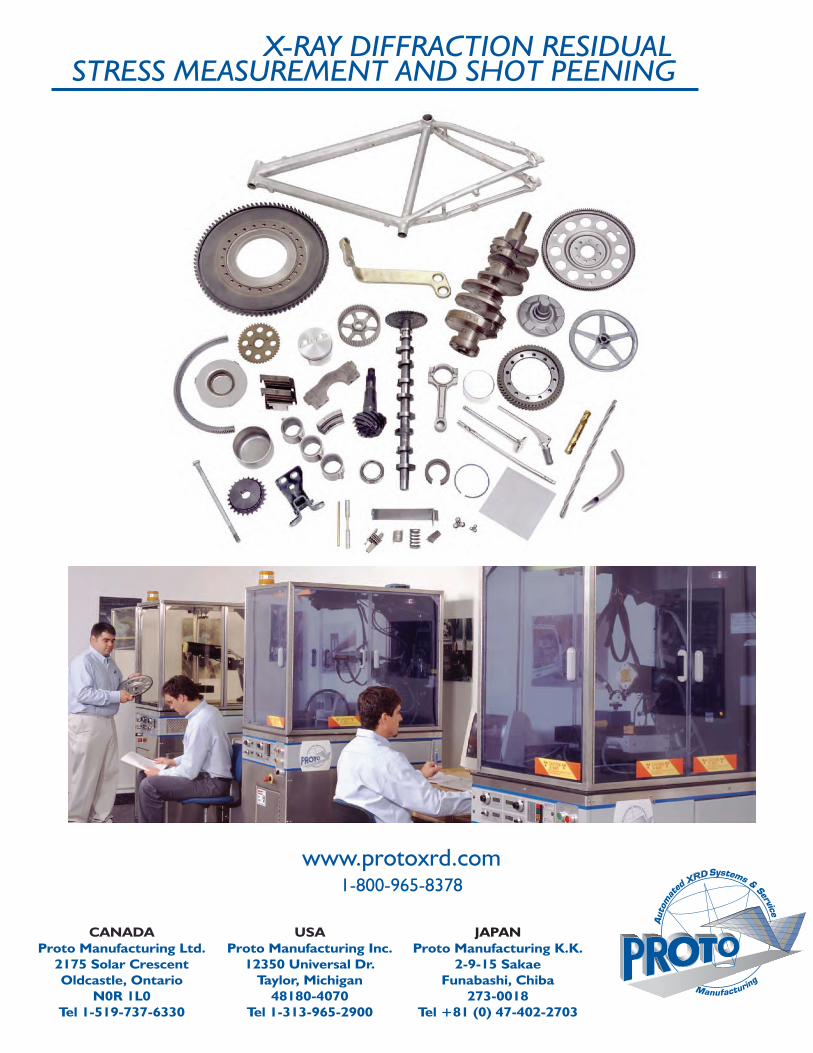
Proto Manufacturing is a world
leader in the measurement of
residual stress using XRD.
Some examples of applications
include stress measurements on
suspension bridges, ships and
submarines, natural gas
pipelines, as well as automotive
and aerospace components.

tensity with 125% coverage. To verify
the effectiveness of the peening process,
a section of the weld was masked off
and was not peened so as to compare
the "peened" and "as welded" condi-
tions (see figure 3). The residual stress
was mapped over an area encompass-
ing both the peened and unpeened
portions of the weld and parent mate-
rial. It can be seen in figure 4 that the
shot peening technique used had a
significant effect on the stress state of
the weld and parent material as seen
by the "step" or drop in residual stress
near the center of the map. On the left
hand side of the map the "as welded"
stress state has tensile residual stresses
in the weld and the weld heat affected
zone (HAZ) and neutral or slightly
compressive stresses on average in the
parent material. The right hand side of
this map shows the peened area where
the characteristic profile is much more
compressive (less tensile) and uniform
in the parent material but a reduced
tensile residual stress state remains in
the weld. This indicates that the peening
process had the effect of reducing the
tensile residual stresses in the weld and
HAZ while introducing compressive
residual stresses in the parent mate-
rial. The peening was not sufficient to
force the weld and HAZ entirely into
compression in the sampled volume.
This would suggest that the peening
parameters could be changed to in-
crease the compressive residual stress
imparted upon the weld and HAZ or
that a stress relief heat treat cycle could
be applied prior to peening. This kind
of information cannot be obtained using
the standard Almen strip test and the
assessment of the % coverage.
Can one use XRD in the lab?
Yes. XRD has been used extensively to
measure the residual stress in peened
components in a laboratory environ-
ment. Since varying peening param-
eters can result in different subsurface
residual stress gradients, the residual
stress in peened components must
initially be evaluated as a function
of depth. Figure 5 shows a lab based
XRD instrument characterizing residual
stresses in titanium alloy components.
The stress vs. depth profiles for various
peening parameters on the titanium al-
loy components can be seen in figure
6. In this case, the effect of varying the
peening intensity on the same compo-
nent resulted in quite different residual
stress gradients as a function of depth.
This information was used to select
the best peening parameters for the
intended application.
Can one use XRD in the field?
Yes. XRD has been used on large com-
ponents on the shop floor and in the
field. Residual stress measurements
were performed on a large pinion gear
at different locations where various shot
peening parameters were applied (see
figures 7 and 8). The resultant residual
stress vs. depth plot (see figure 9) dem-
onstrates how the effect of the peening
process varies with depth as a function
of peening intensity, shot size and shot
hardness. For an accurate assessment
of the peening process applied, the
actual residual stresses present in the
peened component(s) must be mea-
sured. This is because the apparent
Almen intensity is a result of the total
through thickness effect on the Almen
strip. Hence, steeper more intense com-
pressive stress gradients can potentially
result in the same apparent Almen strip
curvature as deeper reaching but less
intense compressive stress gradients.
Additionally, the width/breadth of
the x-ray diffraction peak is related to
the dislocation density in the sampled
volume thus an empirical measure of
the net work hardening present in the
sampled volume due to peening as a
function of depth can be obtained (see
figure 10).
Can one use XRD inline and in audit
stations?
Yes. Recent advances in detector
technology and computing power
have made XRD based residual stress
measurement data acquisition and
analysis possible in near real time.
Once the residual stress profile as a
function of depth has been established
for a given component and process, sur-
face measurements can be performed
completely nondestructively for 100%
inline inspection and quality assurance.
Since XRD can be used to measure sur-
face residual stresses nondestructively
it can be used to: a) track changes in the
residual stress on the exact same part at
the exact same location through vari-
ous production stages, b) quantitatively
monitor the resultant residual stresses
Fig. 4: Stress map on weldment
Fig. 5: Measuring residual stress on a shot
peened component in the lab
Fig. 6: Comparison of various peening
parameter for a component in the lab
Fig. 7: Measuring residual stress
on a component in the field
� � � � � � � � � � � � � � � � � � � � � � � � � � � � � � � � � � � � � � ��� �
� � � � � � � � � � � � � � � � � � � � � � � � � � � � � � � � � � � � � � � � � � � � �� � � � � � � ��� � ! ��"#$% & ' ( ) ) ' ) *+ ,- . ,/ 01 0
X-RAY DIFFRACTION RESIDUAL STRESS ME
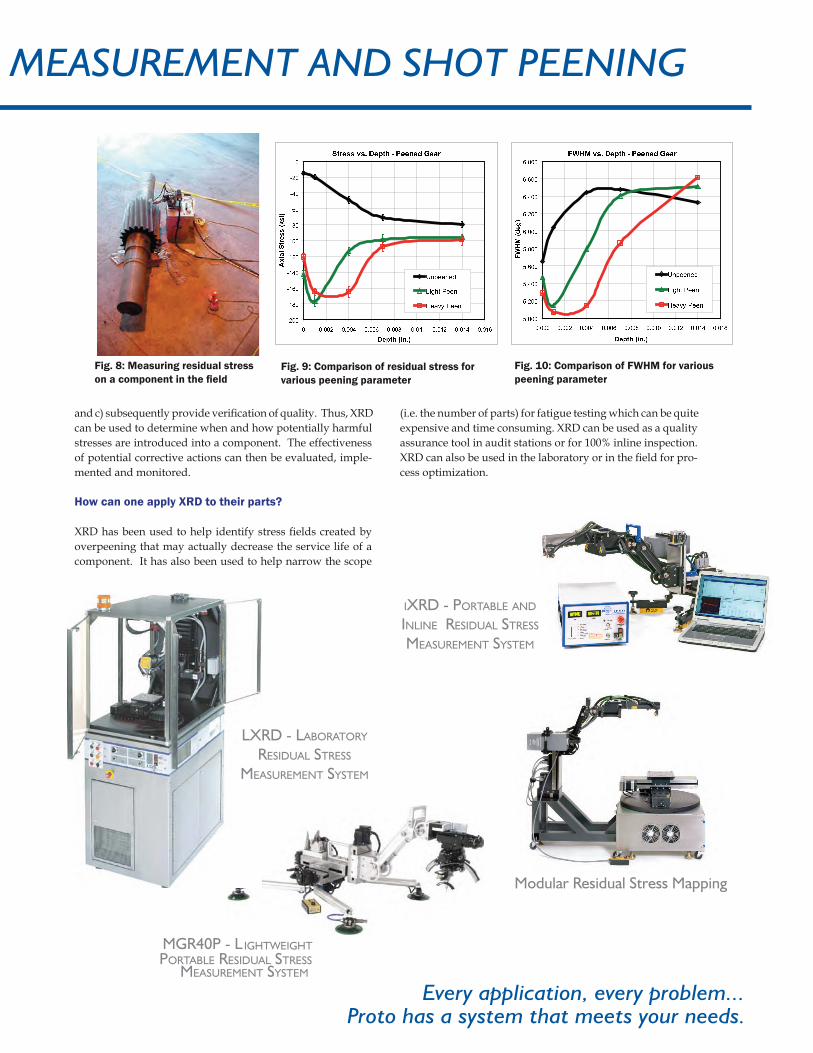
IXRD - PORTABLE AND
INLINE RESIDUAL STRESS
MEASUREMENT SYSTEM
Fig. 10: Comparison of FWHM for various
peening parameter Fig. 9: Comparison of residual stress for
various peening parameter
Fig. 8: Measuring residual stress
on a component in the field
and c) subsequently provide verification of quality. Thus, XRD
can be used to determine when and how potentially harmful
stresses are introduced into a component. The effectiveness
of potential corrective actions can then be evaluated, imple-
mented and monitored.
How can one apply XRD to their parts?
XRD has been used to help identify stress fields created by
overpeening that may actually decrease the service life of a
component. It has also been used to help narrow the scope
(i.e. the number of parts) for fatigue testing which can be quite
expensive and time consuming. XRD can be used as a quality
assurance tool in audit stations or for 100% inline inspection.
XRD can also be used in the laboratory or in the field for pro-
cess optimization.
Every application, every problem... Proto has a system that meets your needs.
2 3 4 5 6 6 7 6 8 9 5 : 3 ; < = 5 5 > 5 ? @ 5 A 4B C D DB E F DB E G DB E H DB E C DB E D DB F DB G DB H DB C DD
D D I D D C D I D D H D I D D G D I D D F D I D E D I D E C D I D E H D I D E GJ K L M N O P Q R STU VWX VVYZ[\] ^U _` a b c d d b d ef g h i j k d d bl d m n o k d d b
p q r s t u v w x y z { | } x x ~ x � � x � �� � � � �� � � � �� � � � �� � � � �� � � � �� � � � �� � � � �� � � � �� � � � �� � � � �
� � � � � � � � � � � � � � � � � � � � � � � � � � � � � � � � � � � � � � � � � � � � �� � � � � � � � � �� �������� � � ¡ ¡ � ¡ ¢£ ¤ ¥ ¦ § ¨ ¡ ¡ �© ¡ ª « ¬ ¨ ¡ ¡ �
Modular Residual Stress Mapping
AL STRESS MEASUREMENT AND SHOT PEENING
MGR40P - L IGHTWEIGHT
P ORTABLE R ESIDUAL S TRESS M EASUREMENT S YSTEM
LXRD - L ABORATORY
R ESIDUAL S TRESS
M EASUREMENT S YSTEM
X-RAY DIFFRACTION RESIDUAL STRESS MEASUREMENT AND SHOT PEENING
www.protoxrd.com1-800-965-8378
USA
Proto Manufacturing Inc.
12350 Universal Dr.
Taylor, Michigan
48180-4070
Tel 1-313-965-2900
CANADA
Proto Manufacturing Ltd.
2175 Solar Crescent
Oldcastle, Ontario
N0R 1L0
Tel 1-519-737-6330
JAPAN
Proto Manufacturing K.K.
2-9-15 Sakae
Funabashi, Chiba
273-0018
Tel +81 (0) 47-402-2703