
Quantitative analysis of mid-gestation mouse aggregation chimaeras: non-random composition of the...
10
Roux's Arch Dev Biol (1993) 202:296 305 Roux'sArchivesof _.D elopmental Biology © Springer-Verlag 1993 Quantitative analysis of mid-gestation mouse aggregation chimaeras: non-random composition of the placenta Roberta James, Jean H. Flockhart, Margaret Keighren, and John D. West Department of Obstetrics and Gynaecology,University of Edinburgh, Centre for Reproductive Biology, 37 Chalmers Street, Edinburgh, EH3 9EW, UK Received: November 11, 1992/Accepted in revised form February 4, 1993 Abstract. Mouse chimaeras were produced by aggregat- ing eight-cell embryos from two different 172matings, ab- breviated to AF 2 and BF 2 respectively: (C57BL/ Ola.AKR-Gpi-ls a, c/Ws female x BALB/c male)F 2 and (C57BL/Ws female x CBA/Ca male)F2. Quantitative electrophoresis of glucose phosphate isomerase (GPI-1) was used to estimate the proportions of the two cell pop- ulations in different tissues of the 121/2 day chim'aeric conceptuses, with the % GPI-1A indicating the percent- age of cells derived from the AF2 embryos. The % GPI- 1A was found to be highly positively correlated within the primitive ectoderm lineage (between the fetus, am- nion and yolk sac mesoderm) and within the primitive endoderm lineage (between the yolk sac endoderm and the parietal endoderm) but no correlation (either positive or negative) was seen between the two lineages. This con- firms the results of a previous, study of chimaeras made between partially congenic strains and suggests the origi- nal conclusions have general validity. The % GPI-1A in the placenta was corrected for the expected contribution of maternal GPI-1, based on control experiments involv- ing transfer of homozygous Gpi-lsb/Gpi-ls b embryos to the uteri of Gpi-ls~/Gpi-ls a pseudopregnant females. The corrected % GPI-1A in the placenta was positively corre- lated with that in each of the three primitive ectoderm derivatives. This suggests either (1) exchange of cells be- tween the polar trophectoderm and the underlying part of the inner cell mass that forms the primitive ectoderm or (2) cells are incompletely mixed in the chimaeric blas- tocyst and patches of AF 2 and BF2 cells straddle the boundary between the polar trophectoderm and the un- derlying primitive ectoderm. The second explanation does not imply the existence of shared developmental lineages between trophectoderm and primitive ectoderm in non-chimaeric embryos. Unlike that of any other tis- sue, the distribution of placental GPI-1A was U-shaped; in 17/28 placenta samples the proportion of the minor component was 10% or less. This suggests that the pla- cental trophoblast is derived from a small number of co- Correspondence to: J.D. West herenct clones of polar trophectoderm cells (either a small number of polar trophectoderm cells or a larger number if the two cell populations are not finely inter- mingled). Thus, although as a population the placentas of chimaeric conceptuses are balanced with respect to the % GPI-1A (mean close to 50%), individually most pla- centas are extremely unbalanced in their chimaeric com- position (< 10% or >90% GPI-1A). This non-random composition of the chimaeric placentas is in contrast to the widely held assumption that the distribution of cells in chimaeric conceptuses is normally random. Key words: Chimaera - Mosaic Mouse - Fetus - Pla- centa Introduction Mouse embryos with various types of developmental de- fects have been incorporated into aggregation chimaeras or injection chimaeras in order to investigate their devel- opmental potential. Those incorporated into aggrega- tion chimaeras include androgenetic, parthenogenetic and gynogenetic embryos (Nagy et al. 1987, 1989; Sur- aniet al. 1987, 1988; Thomson and Solter 1988, 1989; Fundele et al. 1989, 1990, 1991), embryos with various chromosome anomalies (Epstein et al. 1982, 1984; Cox et al. 1984; Fundele 1985) as well as embryos with lethal single gene defects, such as various t-haplotypes (Mintz 1964; Bennett 1978) and lethal yellow (Barsh et al. 1990). One advantage of using aggregation chimaeras is that both cell populations may contribute to the fetus and all of the extraembryonic tissues. Although, in many cases investigations have been limited to fetal or adult tissues, in some cases the placenta (Cox et al. 1984; Ep- stein et al. 1984) and other extraembryonic tissues (Nagy et al. 1987; Surani et al. 1987, 1988; Thomson and Solter 1988, 1989) have also been considered. This has provided additional valuable information about the developmen- tal potential of the abnormal cell type, particularly in
-
Upload
roberta-james -
Category
Documents
-
view
212 -
download
0
Transcript of Quantitative analysis of mid-gestation mouse aggregation chimaeras: non-random composition of the...
Roux's Arch Dev Biol (1993) 202:296 305 Roux's Archives of
_.D elopmental Biology © Springer-Verlag 1993
Quantitative analysis of mid-gestation mouse aggregation chimaeras: non-random composition of the placenta Roberta James, Jean H. Flockhart, Margaret Keighren, and John D. West
Department of Obstetrics and Gynaecology, University of Edinburgh, Centre for Reproductive Biology, 37 Chalmers Street, Edinburgh, EH3 9EW, UK
Received: November 11, 1992/Accepted in revised form February 4, 1993
Abstract. Mouse chimaeras were produced by aggregat- ing eight-cell embryos from two different 172 matings, ab- breviated to AF 2 and BF 2 respectively: (C57BL/ Ola.AKR-Gpi-ls a, c/Ws female x BALB/c male)F 2 and (C57BL/Ws female x CBA/Ca male)F2. Quantitative electrophoresis of glucose phosphate isomerase (GPI-1) was used to estimate the proportions of the two cell pop- ulations in different tissues of the 121/2 day chim'aeric conceptuses, with the % GPI-1A indicating the percent- age of cells derived from the AF2 embryos. The % GPI- 1A was found to be highly positively correlated within the primitive ectoderm lineage (between the fetus, am- nion and yolk sac mesoderm) and within the primitive endoderm lineage (between the yolk sac endoderm and the parietal endoderm) but no correlation (either positive or negative) was seen between the two lineages. This con- firms the results of a previous, study of chimaeras made between partially congenic strains and suggests the origi- nal conclusions have general validity. The % GPI-1A in the placenta was corrected for the expected contribution of maternal GPI-1, based on control experiments involv- ing transfer of homozygous Gpi-lsb/Gpi-ls b embryos to the uteri of Gpi-ls~/Gpi-ls a pseudopregnant females. The corrected % GPI-1A in the placenta was positively corre- lated with that in each of the three primitive ectoderm derivatives. This suggests either (1) exchange of cells be- tween the polar trophectoderm and the underlying part of the inner cell mass that forms the primitive ectoderm or (2) cells are incompletely mixed in the chimaeric blas- tocyst and patches of AF 2 and BF2 cells straddle the boundary between the polar trophectoderm and the un- derlying primitive ectoderm. The second explanation does not imply the existence of shared developmental lineages between trophectoderm and primitive ectoderm in non-chimaeric embryos. Unlike that of any other tis- sue, the distribution of placental GPI-1A was U-shaped; in 17/28 placenta samples the proportion of the minor component was 10% or less. This suggests that the pla- cental trophoblast is derived from a small number of co-
Correspondence to: J.D. West
herenct clones of polar trophectoderm cells (either a small number of polar trophectoderm cells or a larger number if the two cell populations are not finely inter- mingled). Thus, although as a population the placentas of chimaeric conceptuses are balanced with respect to the % GPI-1A (mean close to 50%), individually most pla- centas are extremely unbalanced in their chimaeric com- position (< 10% or >90% GPI-1A). This non-random composition of the chimaeric placentas is in contrast to the widely held assumption that the distribution of cells in chimaeric conceptuses is normally random.
Key words: Chimaera - Mosaic Mouse - Fetus - Pla- centa
Introduction
Mouse embryos with various types of developmental de- fects have been incorporated into aggregation chimaeras or injection chimaeras in order to investigate their devel- opmental potential. Those incorporated into aggrega- tion chimaeras include androgenetic, parthenogenetic and gynogenetic embryos (Nagy et al. 1987, 1989; Sur- anie t al. 1987, 1988; Thomson and Solter 1988, 1989; Fundele et al. 1989, 1990, 1991), embryos with various chromosome anomalies (Epstein et al. 1982, 1984; Cox et al. 1984; Fundele 1985) as well as embryos with lethal single gene defects, such as various t-haplotypes (Mintz 1964; Bennett 1978) and lethal yellow (Barsh et al. 1990). One advantage of using aggregation chimaeras is that both cell populations may contribute to the fetus and all of the extraembryonic tissues. Although, in many cases investigations have been limited to fetal or adult tissues, in some cases the placenta (Cox et al. 1984; Ep- stein et al. 1984) and other extraembryonic tissues (Nagy et al. 1987; Surani et al. 1987, 1988; Thomson and Solter 1988, 1989) have also been considered. This has provided additional valuable information about the developmen- tal potential of the abnormal cell type, particularly in
297
the case of cells f rom androgenetic, parthenogenetic and gynogenetic embryos.
A series of elegant experiments with injection chi- maeras by Gardner and his colleagues helped to establish the developmental fates of the three pr imary develop- mental lineages: the primitive ectoderm or epiblast, the primitive endoderm or hypoblast and the t rophectoderm (eg. Gardner and Papa ioannou 1975; Gardner 1978). In a subsequent study of 121/2 day chimaeric concep- tuses made by aggregating two normal embryos, that differed at the Pgk-1 locus, the proport ions of cells de- rived f rom each embryo were analysed in the fetus and various extraembryonic tissues (West et al. 1984). This study revealed positive correlations between three tissues derived f rom the primitive ectoderm (fetus, amnion and yolk sac mesoderm) and between the two primitive endo- derm derivatives (yolk sac endoderm and parietal endo- derm). There was, however, no correlation between the derivatives of primitive ectoderm and the primitive endo- derm. Thus, the proport ions of the two cell populat ions were positively correlated within each of the two devel- opmental lineages studied but no correlations were seen between developmental lineages.
These quantitative relationships established for con- trol aggregation chimaeras provide a valuable baseline for evaluating the developmental potential of cells, with various types of developmental defects, in the fetus and extraembryonic tissues. For example, if comparison of control and experimental chimaeras (involving a geneti- cally abnormal cell population) revealed a difference in correlation between tissues or a change in slope of a regression line, this might reveal which tissues were most affected by the genetic defect.
In the previous study by West et al. (1984), chimaeras were made by aggregating embryos of the inbred C3H/ He l l strain with embryos of the partially congenic strain C 3 H / H e H a - P k g - 1 ~ and the proport ions of cells derived f rom each embryo were estimated by quantitative eiec- trophoresis of phosphoglycerate kinase-1 (PGK-1; EC 2.7.2.3). In the present study we have made chimaer- as by aggregating two types of F2 embryos that differ at the Gpi- ls locus and the proport ions of cells derived f rom each embryo were estimated by quantitative elec- trophoresis of glucose phosphate isomerase (GPI-1; EC 5.3.1.9).
The aims of this study were twofold. First, we wanted to test whether the statistical correlations revealed by the earlier study could be confirmed using chimaeras of a different strain combinat ion that were analysed by a different method. (The level of genetic disparity, both within and between groups of F 2 embryos used in the present study, was higher than that in the earlier study, where partially congenic strains were used.) Second, we wanted to extend the analysis to include tissues derived f rom the third pr imary developmental lineage, the tro- phectoderm.
Materials and methods
Production of chimaeras. Two groups of F1 mice were produced. One Flstock (abbreviated to AF1) was produced by crossing
inbred, partially congenic C57BL/O1a.AKR-Gpi-ls",c/Ws strain fe- males (name abbreviated to BC) with inbred BALB/c males. The other F1 (abbreviated to BF1) was produced by crossing inbred C57BL/Ws strain females with inbred CBA/Ca males. The AF1 animals were homozygous for albino (c/c) and the Gpi-ls ~ allele of the glucose phosphate isomerase locus; the BFx animals were homozygous C/C (pigmented) and Gpi-lsb/Gpi-ls b. CBA/Ca males were obtained from the Institute of Cell, Animal and Population Biology, University of Edinburgh, BALB/c mice were purchased from the Department of Medical Microbiology, University of Edin- burgh; all other animals were bred and maintained, under conven- tional conditions in the Centre for Reproductive Biology.
AF1 and BF1 females were superovutated by injecting 5 IU pregnant mares' serum gonadotrophin (PMSG) at approximately 12 noon followed 48 hours later by 5 IU human chorionic gonado- trophin (hCG). Females were housed with males from the same F1 strain and mating verified the following morning by the presence of a vaginal plug; the day of the vaginal plug was designated 1/2 day post coitum (p.c.). Embryos produced in this way were (AF1 x AF1)Fz and (BF1 × BFOF2 ; abbreviated to AF2 and BF2 respectively. Unlike their F1 parents, the F2 embryos would be genetically heterogeneous; AF 2 embryos would be segregating at loci that differed between the inbred strains BC and BALB/c and BF2 embryos would be segregating at loci that differed between the inbred strains C57BL and CBA. On the day that the vaginal plugs were found, another group of AF~ females were examined and those in oestrous were mated to vasectomised males to provide pseudopregnant females.
Preimplantation embryos were flushed from the reproductive tract of pregnant AF1 and BF1 females at 2~/z days p.c. (usually between 8.30 am and 11.00 am) with HEPES-buffered M2 han- dling medium (Quinn et aI. 1982). Most were at the 8-celi stage; the zonae pellucidae were removed in acidic Tyrodes solution, pH 2.5 (Nicolson et al. 1975) and the denuded embryos were washed in M2 medium. Aggregation chimaeras were produced by standard procedures involving aggregation of pairs of zona-free 8-cell stage embryos (Tarkowski 1961; Mintz 1962; McLaren 1976). Embryos were transferred in pairs (one AF2 and one BF2 embryo) to drops of culture media under paraffin oil (Boots) in bacteriological grade petri dishes. Firstly, each pair was pushed together in a drop of M2+PHA [t part phytohaemagglutinin (M form, GIBCO 670-0576) plus 19 parts M2 medium] to aid adhesion (Mintz et al. 1973; Pratt 1987), incubated for 2 rain at 37°C in 5% CO2 in air, then rinsed in a drop of M2. The aggregated embryos were then rinsed in a drop of M 16 culture medium (Whitt- ingham 1971) and transferred to a second drop of M16 medium under paraffin oil in a dish that had been equilibrated overnight at 37 ° C in 5% CO2 in air. Any pairs of embryos that had drifted apart were pushed together again and the aggregated pairs were cultured overnight. (Some developmental asynchrony is likely be- tween the aggregated embryos because they were aggregated soon after collection, without checking the time of their previous cleav- age division.) The following day the aggregated embryos were rinsed in M2 handling medium and surgically transferred to the uterus of an AF~ pseudopregnant female, using a fine glass pipette (McLaren and Michie 1956). Pseudopregnant females were anaes- thetised with 0.25 ml per 30 g body weight of a 1 : 1 v/v mixture of Hypnorm (0.315 mg/ml fentanyl citrate and 10 mg/ml fluan- isone; Janssen pharmaceuticals) and Hypnovel (2 mg/ml midazlam hydrochloride; Roche). Pregnancies were timed according to the pseudopregnant female.
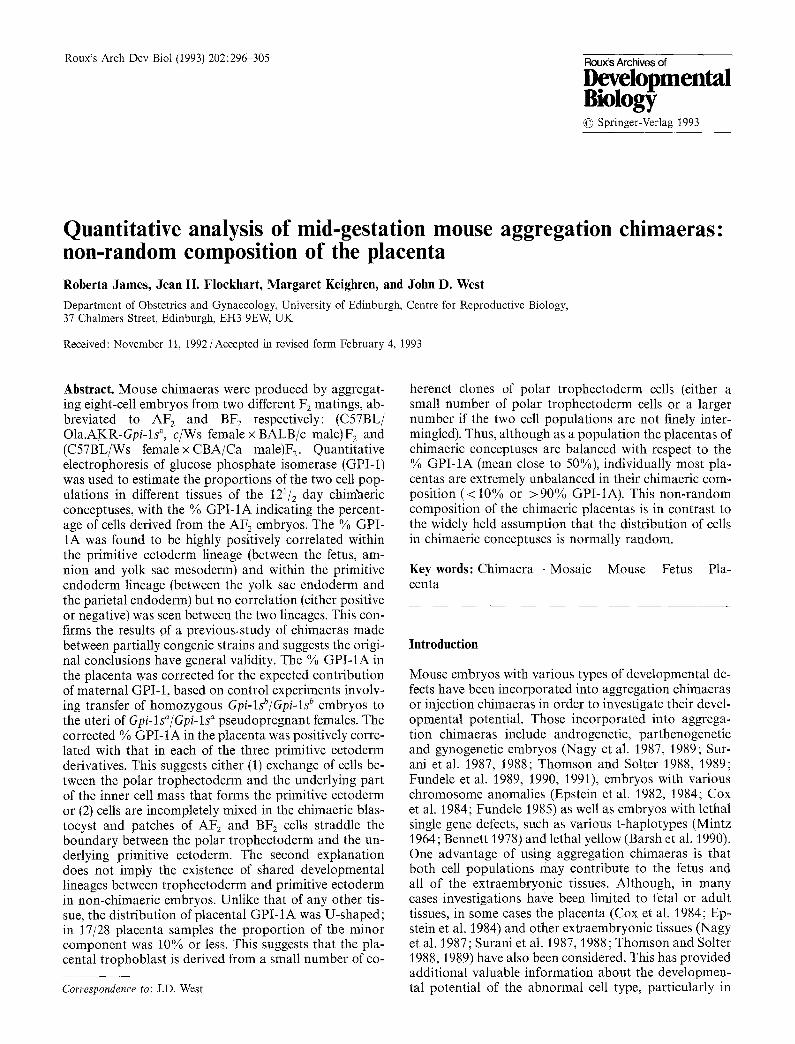
Analysis of chimaeras. Females were sacrificed at 121/2 days gesta- tion and the conceptuses were dissected as described by Papaioan- nou and ~West (1981) to provide fetus, amnion, visceral yolk sac, Reichert's membrane (parietal endoderm), umbilical cord and pla- centa (see Fig. 1 for diagram of conceptus). The mixture of decidua and trophoblast tissue was carefully removed from Reichert's mem- brane with watchmaker's forceps and the endoderm and mesoderm layers of the yolk sac were separated with watchmaker's forceps after incubating the whole yolk sac in trypsin/pancreatin at 4 ° C
298
Placenta
Umbilical cord
Ectoderm ] mn' Mesoderm J' A ion
Mesoderm ] . Endoderm ~ Visceral Yolk Sac
Reicherrs membrane (Parietal Endoderm)
Decidua & Trophoblast
Fig. 1. Diagram of 121/2 day mouse conceptus (re-drawn after Pa- paioannou and West 1981). The different tissues are shaded accord- ing to their developmental lineage. The fetus, amnion and yolk sac mesoderm (unshaded) are derived from the epiblast or primitive ectoderm lineage; the visceral yolk sac endoderm and parietal en- doderm of Reichert's membrane (shaded black) are derived from the primitive endoderm lineage; the placenta and band of tissue on the outer surface of Reichert's membrane (shaded grey) are mainly a mixture of trophoblast (trophectoderm lineage) and mater- nal decidua tissue, although the placenta has minor contributions from other lineages
for 21/2-3 h (Levak-Svajger et al. 1969) and rinsing in M2 handling medium. The weights of the total conceptus, the placenta and the fetus were recorded, along with the crown/rump length and mor- phological index based on hind limb development (McLaren and Buehr 1990; Palmer and Burgoyne 1991).
The fetus and placenta were stored at - 2 0 ° C, in 100 gl of 50% glycerol in water, in 1.5 ml microtubes and all other tissues were stored in 10 gl of 50% glycerol in microtest plates. Samples were lysed by three cycles of freeze/thawing with mechanical dis- ruption of the fetal and placental tissues. Electrophoresis, staining for glucose phosphate isomerase (GPI-1) activity and densitometry (with a Helena Process-24 gel scanner) were carried out as previous- ly described (West et al. 1986). The proportions of the two cell populations in the chimaeric tissues were estimated from the pro- portions of GP!-IA and GPI-1B atlozymes. The raw data (as % GPI-1A allozyme given to one decimal percentage point) was used for statistical analysis and plotting the figures but they were rounded to the nearest integer for presentation in Table 2. Non- parametric statistical tests were performed on an Apple Macintosh
computer using the '° MuttiStat" statistical package (Biosoft, Cam- bridge).
The accuracy of the quantification of the two GPI-I allozymes by cellulose acetate electrophoresis and scanning densitometry was tested using samples with known proportions of GPI-1A and GPI- lB. This was achieved by mixing kidney homogenates, from homo- zygous Gpi-lsa/Gpi-ls ° mice with those from homozygous Gpi-lsb/ Gpi-ls b mice, in different proportions, coding the samples and esti- mating the percentage GPI-1A by quantitative electrophoresis. As reported previously (eg. West and Green 1983) there was a slight tendency to overestimate the minor component but overall the results showed a very good concordance between the observed and expected percent GPI-1A.
Analysis of control conceptuses. Homozygous, Gpi-ls"/Gpi-ls a (AF1) pseudopregnant females were used as recipients for the chi- maeric embryos, so any maternal contamination would increase the proportion of GPI-1A in the tissue. In order to assess the extent of the maternal contribution to the different tissues analysed a control series of embryo transfers was undertaken. Homozygous, Gpi-lsb/Gpi-ls b (BF2) preimplantation embryos were flushed from the reproductive tract of BF1 females a t 31/2 days and surgically transferred to the uteri of pseudopregnant AF1 females. Females were sacrificed at 121/z days gestation and the conceptuses were dissected and analysed by GPI-1 electrophoresis as described above for the chimaeric group.
In situ hybrid±sat±on of placenta. The maternal and "fetal" parts of the placentas of male conceptuses were distinguished by in situ hybrid±sat±on with the Y chromosome-specific probe, pY353/B (kindly provided by Dr. Colin Bishop, Institut Pasteur, Paris, France). The probe was labelled with digoxygenin and detected, after in situ hybrid±sat±on, by alkaline phosphatase immunocyto- chemistry as described by Keighren and West (1993).
Results
Transfer control conceptuses
Table 1 shows the percentage of maternal ly-der ived GPI - I A activity in var ious parts of 34 conceptuses derived f rom the transfer of homozygous , Gpi-lsb/Gpi-is b preim- p lan ta t ion embryos t ransferred to homozygous Gpi-lsa/ Gpi-ls a females. This analysis revealed that while the fetus, amnion , yolk sac mesoderm, umbil ical cord and yolk sac endode rm showed no con tamina t ion , the parie-
Table 1. Proportion of GPI-1A (maternal- ly-derived enzyme) in various tissues of 34 121/2 day conceptuses produced by trans- ferring homozygous Gpi-isa/Gpi-ls b preim- plantation embryos into homozygous Gpi- ls"/Gpi-is a pseudopregnant recipient fe- males
Tissue Proportion of conceptuses with GPI- IA
% GPI-IA (maternal contamination)
Mean Coefficient of Range ± SEM variation (%)
Fetus Amnion Yolk sac mesoderm Umbilical cord Yolk sac endoderm Parietal endoderm Decidua and trophoblast Placenta Placenta a
0 '34 0 '34 0 34 0 '34 0 '34
14 33 34 34 34 '34 33 33
0 0 0 0 0 3.3±2.6
74.6±1.8 44.3±1.4 45.3±1.0
140.1 0-19 20.8 44-100 20.4 12-64 15.5 32-64
a Second row of placenta data excludes one placenta with only 11.5 % GPI-1A. This placenta was abnormally light and it is likely that most of the outer maternal layer was lost during dissection

299
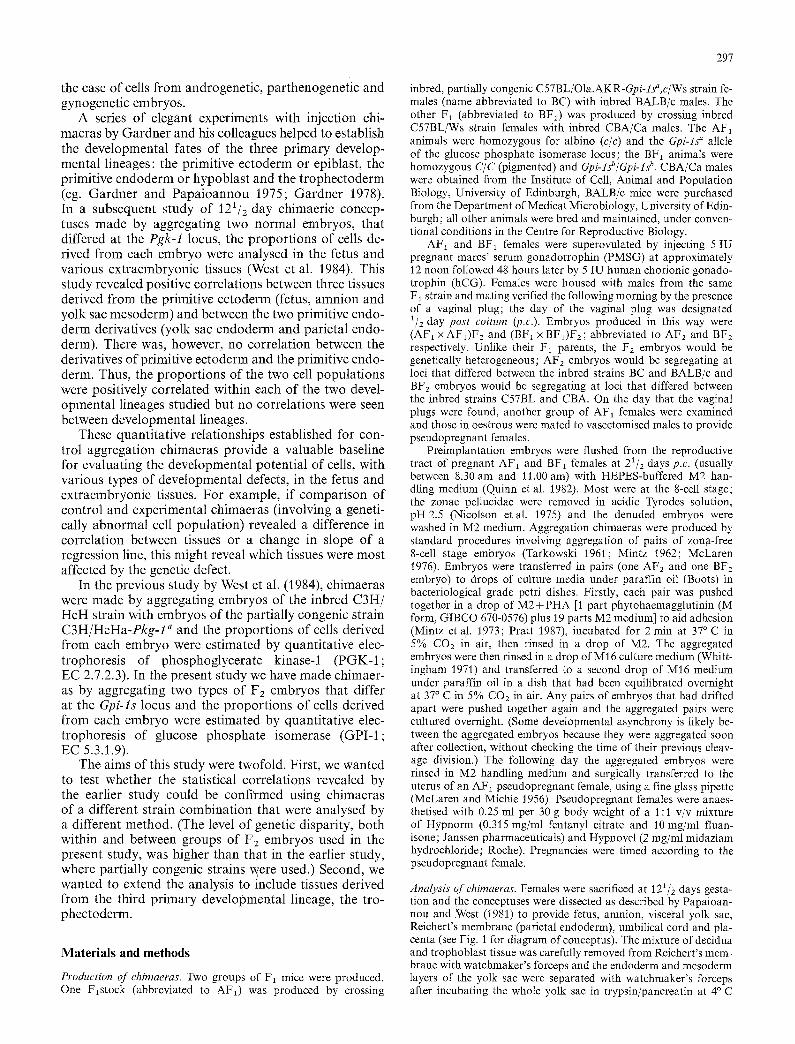
Fig. 2. A 5 gm histological section of the placenta and part of the embryo of a non-chimaeric, 111/2 day, male, mouse conceptus after in situ hybridisation to Y chromosome probe, pY353/B labelled with digoxygenin. The placenta appears as a crescent-shaped structure that fills most of the photograph and the pres- ence of the Y chromosome is detected by dark (blue) staining of alkaline phos- phatase (see Materials and methods). Since, maternal cells have no Y chromo- some, the maternal part of the placenta (m) is clearly identified as the pale outer region that fails to stain for alkaline phosphatase. Bar is 1 mm
tal endoderm, decidua/trophoblast and the placenta each had a significant proport ion of GPI-1A. Although none of the umbilical cord samples had any maternal contamination, this tissue was not analysed in the chi- maera series (below) because the blood content was vari- able. Fourteen of 33 parietal endoderm samples were contaminated with maternally-derived GPI-1A but since the overall mean was only 3.3% this was not taken into account when analysing the parietal endoderm samples of chimaeric conceptuses. The mixture of decidua and trophoblast tissue dissected from Reichert's membrane was predominantly GPI-1A and 5/34 samples were 100% GPI - IA (presumable entirely decidua). For this reason it was not feasible to correct for the proport ion of maternal tissue in the decidua/trophoblast of chimaer- ic conceptuses, so this sample was not analysed in the chimaeric series.
The placenta, on the other hand, had a high but less variable proport ion of maternal GPI-IA. This presum- ably reflects the contribution of the outer maternal layer of the placenta that is derived from the uterine decidua (Fig. 2) plus maternal blood. One placenta had a much lower proport ion of GPI-1A (11.5%) than all of the others (mean 44.3%; range 31.5-64.4%). This placenta was also the lightest (0.06 g compared to a mean of 0.09 g) and had the highest fetus/placenta weight ratio (2.00 compared to a mean of 1.29 and a range of 0.80 to 1.67 for the others). It seems likely that the outer, maternal part of the placenta was lost during the remov- al of this conceptus from the uterus, thereby accounting for its low weight and low proport ion of maternally- derived GPI-1A. Ignoring this placenta, the mean pro- port ion of GPI - IA in the remaining 33 placentas was approximately 45% (Table 1) and this figure was used to correct the proport ion of GPI - IA present in the chi- maeric placentas (below).
Chimaeric conceptuses
A series of 39 conceptuses was produced (Table 2), in- cluding five that were non-chimaeric in all the tissues studied, one set of twins within a single amnion and a pair of conceptuses with fused placentas. The two fused placentas were separated at dissection but, in case the separation was incomplete, these conceptuses were excluded from the statistical analysis. The results from the remaining 28 separate chimaeric conceptuses were analysed statistically.
Electrophoresis of GPI-1A from chimaeric samples is illustrated in Fig. 3. The observed placental % GPI-1A
Fig. 3a, b. GPI-1 electrophoresis plates, a Samples loaded with a 0.25 gl applicator: lane 1, fetus XE-I; 2, fetus XE-2; 3, fetus XE-5; 4, fetus XE-6; 5, fetus XE-7; 6, control blood sample from a G p i - l s " / G p i - l s b heterozygote producing GPI-IA, GPI-1AB and GPI-IB allozymes. 10 Samples from conceptus XE-38, loaded from a fine Pasteur pipette: lanes 7 & 8, yolk sac mesoderm; 9 & 10, parietal endoderm; 11 & 12, amnion; lane 13, control blood sample from a G p i - l s a / G p i - l s b heterozygote. Allozymes (A, AB and B) are inideated at the side. Migration was towards the cathode

300
Table 2, GPI-1A in tissues of 121/2 day chimaeric conceptuses, ranked by % GPI-1A in the fetus
Chimaera %GPI-1A ref.
Primitive ectoderm lineage Primitive endoderm Trophectodermlineage
Fetus Amnion Yolk Sac Yolk Sac Parietal Placenta Placenta Placenta mesoderm endoderm endoderm corr-1 a corr.2 a
XE-20 22 28 24 56 71 41 - 7 0 XE-2 26 43 22 43 93 45 0 0 XE-15 28 32 35 31 46 68 42 42 XE-5 30 25 29 17 36 44 - 2 0 XE-34 41 43 45 43 37 50 9 9 XE-37 43 50 53 16 65 50 9 9 XE-9 47 47 50 68 53 58 24 24 XE-26 51 48 45 43 61 22 - 4 2 0 XE-31 55 50 59 44 33 65 36 36 XE-29 63 61 49 21 58 48 5 5 XE-22 64 80 65 48 48 91 83 83 XE-12 68 77 78 59 42 56 19 19 XE-32 69 67 58 15 35 45 0 0 XE-28 71 85 64 54 79 81 66 66 XE-23 72 55 64 26 51 46 1 1 XE-8 72 78 72 37 39 99 98 98 XE-14 72 48 59 87 89 95 91 91 XE-13 73 81 72 23 85 98 96 96 XE-11 85 84 76 99 100 98 96 96 XE-19 85 85 94 47 100 54 16 16 XE-27 87 68 87 62 100 89 79 79 XE-33 88 81 71 52 46 90 82 82 XE-24 90 91 93 43 93 94 90 90 XE-16 91 88 94 92 100 100 100 100 XE-35 95 88 96 45 49 94 89 89 XE-6 100 100 100 52 77 100 100 100 XE-17 100 100 100 35 34 100 100 100 XE-21 100 100 100 41 16 46 2 2
Mean 67.41 67.24 66.18 46.36 61.96 70.18 45.77 47.61 S.E.M. 4.51 4.30 4.48 4.07 4.78 4.66 8,46 7.93 S.D. 23.89 22.74 23.72 21.52 25.31 24.63 44,79 41.97 N 28 28 28 28 28 28 28 28 Coeffvar. 35.44 33.82 35.84 46.42 40.85 35.11 97.85 88.15
Coneeptuseswithfused placentas
XE-38 67 56 67 78 91 87 77 77 XE-39 50 53 44 43 83 35 - 1 8 0
Twins within a single amnion
XE-18a 89 XE-18b 98
84 82 31 18 44 - 3 0
Non-chimaeric conceptuses
XE-30 0 0 0 0 0 44 - 2 0 XE-1 100 100 100 100 100 100 100 100 XE-7 100 100 100 100 100 100 100 100 XE-10 100 100 100 100 100 100 100 100 XE-36 100 100 100 100 100 100 100 100
The placental value was corrected to allow for 45% of maternal GPI-I in the placenta. Placenta corr-l: % GPI-iA=[(observed % GPI-1A-45) x 100]/(100-45). In placenta corr-2, the negative values are treated as 0
was correc ted to a l low for an average o f 45% placental GPI-1 act ivi ty tha t was o f ma te rna l origin. Since 45% is an average figure, this results in an over -cor rec t ion in some cases and resulted in three negat ive values a m o n g the 28 conceptuses included for statistical analy- sis. The negat ive values were used to calculate the corre-
la t ion coefficients but were counted as zero for p lo t t ing the figures. Concep tus XE-26 had a very low correc ted est imate for the % G P I - 1 A in the p lacenta ( - 4 1 . 8 % ) ; the uncor rec ted est imate was 22.0% G P I - I A . This pla- centa was also l ighter than mos t and was ranked jo in t second in terms o f fe tus /p lacenta weight rat io (2.00 corn-
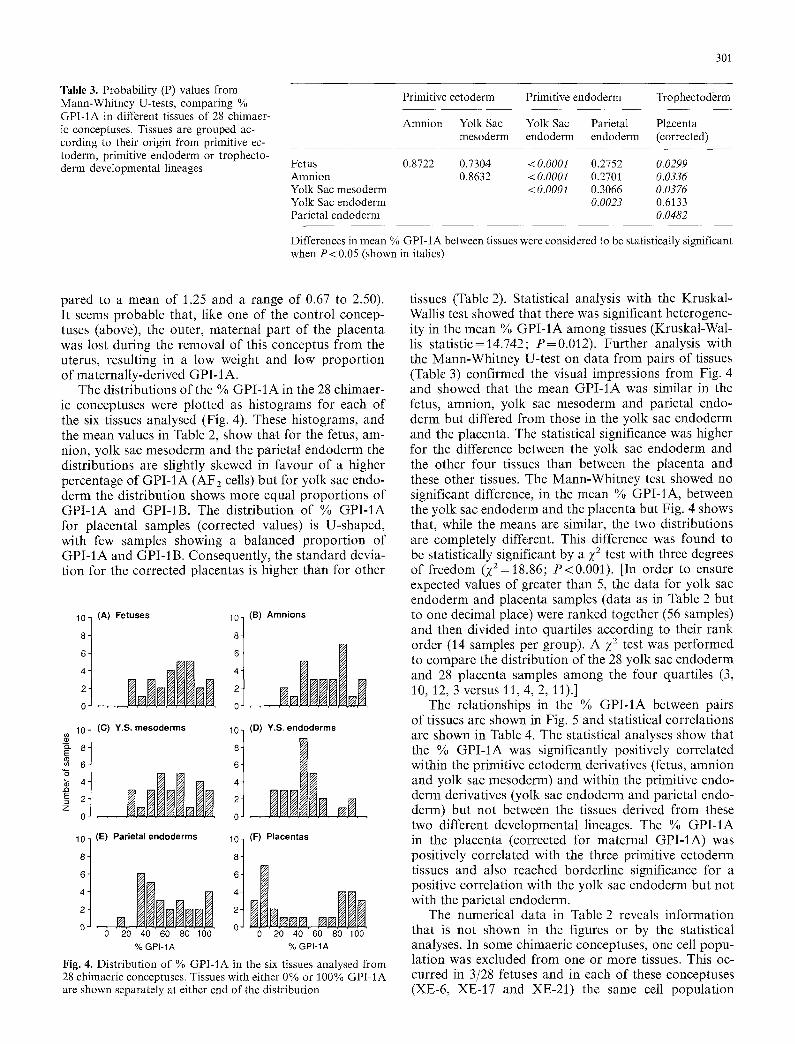
Table 3. Probability (P) values from Mann-Whitney U-tests, comparing % GPI-1A in different tissues of 28 chimaer- ic conceptuses. Tissues are grouped ac- cording to their origin from primitive ec- toderm, primitive endoderm or trophecto- derm developmental lineages
301
Primitive ectoderm Primitive endoderm Trophectoderm
Amnion Yolk Sac Yolk Sac Parietal Placenta mesoderm endoderm endoderm (corrected)
Fetus 0.8722 0.7304 <0.0001 0.2752 0.0299 Amnion 0.8632 <0.0001 0.2701 0.0336 Yolk Sac mesoderm < 0.0001 0.3066 0.0376 Yolk Sac endoderm 0.0023 0.6133 Parietal endoderm 0.0482
Differences in mean % GPI-1A between tissues were considered to be statistically significant when P < 0.05 (shown in italics)
pared to a mean of 1.25 and a range of 0.67 to 2.50). It seems probable that, like one of the control concep- tuses (above), the outer, maternal part of the placenta was lost during the removal of this conceptus from the uterus, resulting in a low weight and low proportion of maternally-derived GPI-1A.
The distributions of the % GPI-1A in the 28 chimaer- ic conceptuses were plotted as histograms for each of the six tissues analysed (Fig. 4). These histograms, and the mean values in Table 2, show that for the fetus, am- nion, yolk sac mesoderm and the parietal endoderm the distributions are slightly skewed in favour of a higher percentage of GPI- IA (AF2 cells) but for yolk sac endo- derm the distribution shows more equal proportions of GPI-1A and GPI-1B. The distribution of % GPI-1A for placental samples (corrected values) is U-shaped, with few samples showing a balanced proportion of GPI-1A and GPI-1B. Consequently, the standard devia- tion for the corrected placentas is higher than for other
10 (A) Fetuses
il . . . . "5
z N IN 0 J . . . . . . . . . . . . .
10 (E) Parietal endoderms
il .o. 1 00000 0 20 40 60 80 100 % GPI-1A
1! t (B) Amnions
. . . . . . . . . .
l i t (D) Y.S. endoderms
l i t (F) Placentas
. . . . N N N..N.N . . . . 0 20 40 60 80 100 % GPI-1A
Fig. 4. Distribution of % GPI-1A in the six tissues analysed from 28 chimaeric conceptuses. Tissues with either 0% or 100% GPI-1A are shown separately at either end of the distribution
tissues (Table 2). Statistical analysis with the Kruskal- Wallis test showed that there was significant heterogene- ity in the mean % GPI-1A among tissues (Kruskal-Wal- lis statistic=14.742; P=0.012). Further analysis with the Mann-Whitney U-test on data from pairs of tissues (Table 3) confirmed the visual impressions from Fig. 4 and showed that the mean GPI-1A was similar in the fetus, amnion, yolk sac mesoderm and parietal endo- derm but differed from those in the yolk sac endoderm and the placenta. The statistical significance was higher for the difference between the yolk sac endoderm and the other four tissues than between the placenta and these other tissues. The Mann-Whitney test showed no significant difference, in the mean % GPI-1A, between the yolk sac endoderm and the placenta but Fig. 4 shows that, while the means are similar, the two distributions are completely different. This difference was found to be statistically significant by a ;(2 test with three degrees of freedom (Z2=18.86; P<0.001). [In order to ensure expected values of greater than 5, the data for yolk sac endoderm and placenta samples (data as in Table 2 but to one decimal place) were ranked together (56 samples) and then divided into quartiles according to their rank order (14 samples per group). A ;(2 test was performed to compare the distribution of the 28 yolk sac endoderm and 28 placenta samples among the four quartiles (3, 10, 12, 3 versus 11, 4, 2, 11).]
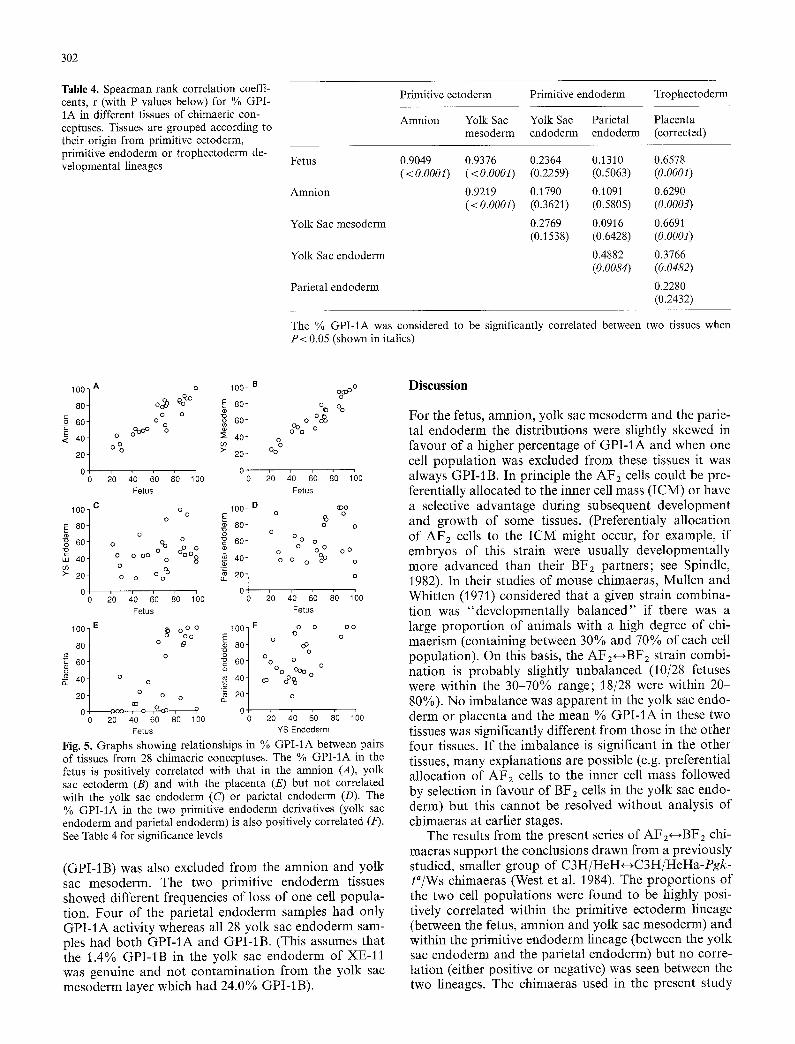
The relationships in the % GPI-IA between pairs of tissues are shown in Fig. 5 and statistical correlations are shown in Table 4. The statistical analyses show that the % GPI-1A was significantly positively correlated within the primitive ectoderm derivatives (fetus, amnion and yolk sac mesoderm) and within the primitive endo- derm derivatives (yolk sac endoderm and parietal endo- derm) but not between the tissues derived from these two different developmental lineages. The % GPI-IA in the placenta (corrected for maternal GPI-1A) was positively correlated with the three primitive ectoderm tissues and also reached borderline significance for a positive correlation with the yolk sac endoderm but not with the parietal endoderm.
The numerical data in Table 2 reveals information that is not shown in the figures or by the statistical analyses. In some chimaeric conceptuses, one cell popu- lation was excluded from one or more tissues. This oc- curred in 3/28 fetuses and in each of these conceptuses (XE-6, XE-17 and XE-21) the same cell population
302
Table 4. Spearman rank correlation coeffi- cents, r (with P values below) for % GPI- 1A in different tissues of chimaeric con- ceptuses. Tissues are grouped according to their origin from primitive ectoderm, primitive endoderm or trophectoderm de- velopmental lineages
Primitive ectoderm Primitive endoderm Trophectoderm
Amnion Yolk Sac Yolk Sac Parietal Placenta mesoderm endoderm endoderm (corrected)
Fetus 0.9049 0.9376 0.2364 0.1310 0.6578 (<0.0001) (<0.0001) (0.2259) (0.5063) (0.0001)
Amnion 0.9219 0.1790 0.1091 0.6290 (<0.0001) (0.3621) (0.5805) (0.0003)
Yolk Sac mesoderm 0.2769 0.0916 0.6691 (0.1538) (0.6428) (0.0001)
Yolk Sac endoderm 0.4882 0.3766 (0.0084) (0.0482)
Parietal endoderm 0.2280 (0.2432)
The % GPI-1A was considered to be significantly correlated between two tissues when P<0.05 (shown in italics)
l°°lA oo o o o 80 o b % ~ E 80
g o ° -~ .~ 6o o 6o
< = 40 0 .2 40
20 > 20
0 0 o ~o 4:0 do d0 lb0 o
Fetus
100 C o 100 D o ]
8 0 ~ 80 E o o 60 { 6 0 o
LU 40 o o oo o ~ 40 o s_
20 o o °o% c~ 20
0 0 0 ~0 ~0 do do 1;0 0
Fetus
100hE ~) o ° o t o o q F
1 o o E E 080I o o 60 60 g
o ~ 40 s- 40 o
o o ~ 20 (i3
0 o o o ~ , 9 0 0 20 40 60 80 1 O0 0
Fetus
s % ~ o o Discussion
% % o °o~
o°Oo o o
Oo °
~0 ~o do do l bo Fetus
o %o
O O O
OO O O OO
O O O
o o o ~o o
o
~o ~0 d0 d0 l b0 Fe tus
oo o o o
o o
% ° o o
o ° o Coo o
0°% o
~0 X0 d0 d0 lb0 YS Endoderm
Fig. g. Graphs showing relationships in % GPI-1A between pairs of tissues from 28 chimaeric conceptuses. The % GPI-1A in the fetus is positively correlated with that in the amnion (A), yolk sac ectoderm (B) and with the placenta (E) but not correlated with the yolk sac endoderm (C) or parietal endoderm (D). The % GPI-tA in the two primitive endoderm derivatives (yolk sac endoderm and parietal endoderm) is also positively correlated (F). See Table 4 for significance levels
(GPI-1B) was also excluded f rom the amnion and yolk sac mesoderm. The two primitive endoderm tissues showed different frequencies of loss of one cell popula- tion. Four of the parietal endoderm samples had only GPI-1A activity whereas all 28 yolk sac endoderm sam- ples had both G P I - I A and GPI-1B. (This assumes that the 1.4% GPI-1B in the yolk sac endoderm of XE-11 was genuine and not contaminat ion f rom the yolk sac mesoderm layer which had 24.0% GPI-1B).
For the fetus, amnion, yolk sac mesoderm and the parie- tal endoderm the distributions were slightly skewed in favour of a higher percentage of GPI-1A and when one cell populat ion was excluded f rom these tissues it was always GPI-1B. In principle the AF2 cells could be pre- ferentially allocated to the inner cell mass (ICM) or have a selective advantage during subsequent development and growth of some tissues. (Preferentialy allocation of AFz cells to the ICM might occur, for example, if embryos of this strain were usually developmentally more advanced than their BF2 partners; see Spindle, 1982). In their studies of mouse chimaeras, Mullen and Whitten (1971) considered that a given strain combina- tion was "developmental ly ba lanced" if there was a large proport ion of animals with a high degree of chi- maerism (containing between 30% and 70% of each cell population). On this basis, the AF2~--~BF2 strain combi- nation is probably slightly unbalanced (10/28 fetuses were within the 30-70% range; 18/28 were within 20- 80%). No imbalance was apparent in the yolk sac endo- derm or placenta and the mean % GPI-1A in these two tissues was significantly different from those in the other four tissues. I f the imbalance is significant in the other tissues, many explanations are possible (e.g. preferential allocation of AF2 cells to the inner cell mass followed by selection in favour of BF2 cells in the yolk sac endo- derm) but this cannot be resolved without analysis of chimaeras at earlier stages.
The results f rom the present series of AFi~--~BF2 chi- maeras support the conclusions drawn from a previously studied, smaller group of C3H/HeH~-+C3H/HeHa-Pgk- l"/Ws chimaeras (West et al. 1984). The proport ions of the two cell populations were found to be highly posi- tively correlated within the primitive ectoderm lineage (between the fetus, amnion and yolk sac mesoderm) and within the primitive endoderm lineage (between the yolk sac endoderm and the parietal endoderm) but no corre- lation (either positive or negative) was seen between the two lineages. The chimaeras used in the present study
were of a different strain combination (embryos from two different F2 stocks) from those in the previous study (embryos from partially congenic strains) and the pro- portions of the two cell populations were analysed with a different enzyme marker (GPI-1 rather than PGK-1). So, the complete agreement between the two studies, in the relationships found between the tissues of the primitive ectoderm and primitive endoderm lineages, suggests that these observations have general validity.
Other similarities exist between the two studies. In both studies some chimaeric conceptuses had non-chi- maeric tissues, where one of the two cell populations had been lost. Three consistent trends have emerged but the numbers of chimaeras involved are small and the trends do not reach statistical significance in either study (tested by Fisher's Exact Test). First, each study has more cases where one cell population is excluded from the fetus, amnion and yolk sac mesoderm rather than from one of these tissues alone (3/28 versus 0/28 in the present study, P = 0.118; 5/12 versus 1/12 in the previous study, P=0.078). The second trend involves the primi- tive endoderm lineage in chimaeric conceptuses. The proportion of non-chimaeric samples was higher for the parietal endoderm than the yolk sac endoderm in both studies (4/28 versus 0/28, P=0.056; 3/12 versus 1/12, P = 0.295) and the yolk sac endoderm retained both cell populations more frequently than any other tissue. A third trend to emerge from both studies was that one population was more commonly lost from the whole primitive ectoderm lineage than from the whole primi- tive endoderm lineage (3/28 versus 0/28, P = 0.118; 5/12 versus 1/12, P=0.078). More data are required to pro- perly test the biological significance of these three trends.
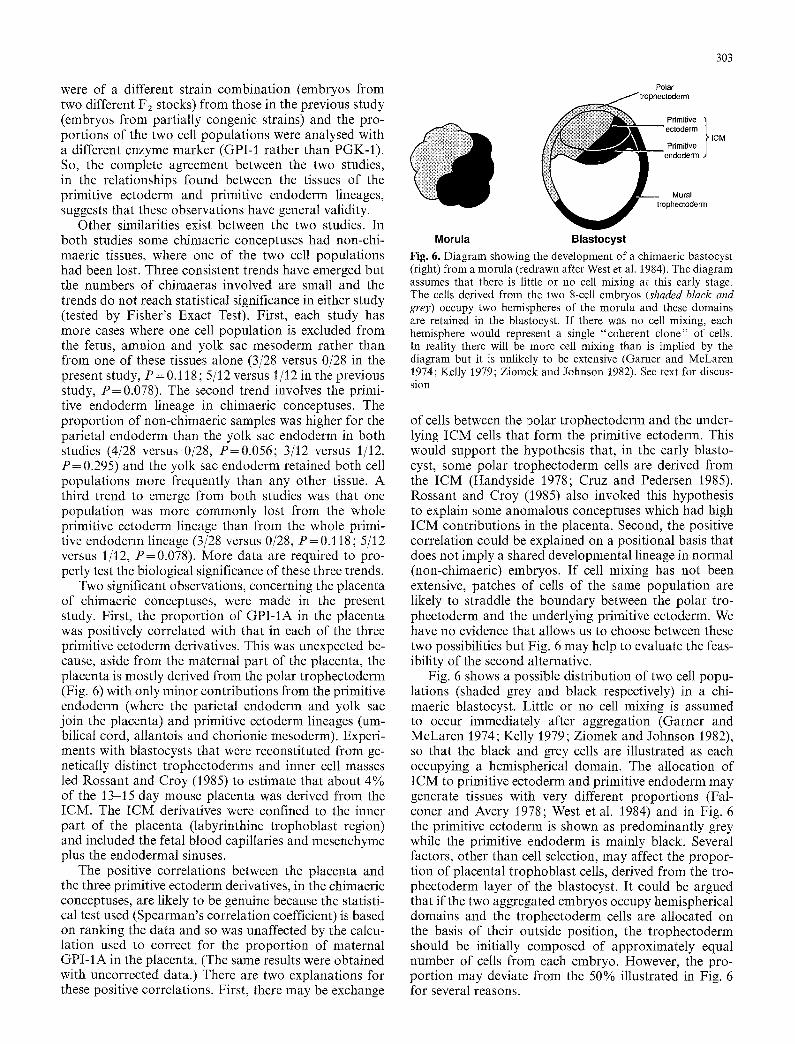
Two significant observations, concerning the placenta of chimaeric conceptuses, were made in the present study. First, the proportion of GPI-1A in the placenta was positively correlated with that in each of the three primitive ectoderm derivatives. This was unexpected be- cause, aside from the maternal part of the placenta, the placenta is mostly derived from the polar trophectoderm (Fig. 6) with only minor contributions from the primitive endoderm (where the parietal endoderm and yolk sac join the placenta) and primitive ectoderm lineages (um- bilical cord, allantois and chorionic mesoderm). Experi- ments with blastocysts that were reconstituted from ge- netically distinct trophectoderms and inner cell masses led Rossant and Croy (1985) to estimate that about 4% of the 13-15 day mouse placenta was derived from the ICM. The ICM derivatives were confined to the inner part of the placenta (labyrinthine trophoblast region) and included the fetal blood capillaries and mesenchyme plus the endodermal sinuses.
The positive correlations between the placenta and the three primitive ectoderm derivatives, in the chimaeric conceptuses, are likely to be genuine because the statisti- cal test used (Spearman's correlation coefficient) is based on ranking the data and so was unaffected by the calcu- lation used to correct for the proportion of maternal GPI-1A in the placenta. (The same results were obtained with uncorrected data.) There are two explanations for these positive correlations. First, there may be exchange
303
Polar
I ICM
Morula Blastocyst Fig. 6. Diagram showing the development of a chimaeric bastocyst (right) from a morula (redrawn after West et al. 1984). The diagram assumes that there is little or no cell mixing at this early stage. The cells derived from the two 8-cell embryos (shaded black and grey) occupy two hemispheres of the morula and these domains are retained in the blastocyst. If there was no cell mixing, each hemisphere would represent a single "coherent clone" of cells. In reality there will be more cell mixing than is implied by the diagram but it is unlikely to be extensive (Garner and McLaren 1974; Kelly 1979; Ziomek and Johnson 1982). See text for discus- sion
of cells between the polar trophectoderm and the under- lying ICM cells that form the primitive ectoderm. This would support the hypothesis that, in the early blasto- cyst, some polar trophectoderm cells are derived from the ICM (Handyside 1978; Cruz and Pedersen 1985). Rossant and Croy (1985) also invoked this hypothesis to explain some anomalous conceptuses which had high ICM contributions in the placenta. Second, the positive correlation could be explained on a positional basis that does not imply a shared developmental lineage in normal (non-chimaeric) embryos. If cell mixing has not been extensive, patches of cells of the same population are likely to straddle the boundary between the polar tro- phectoderm and the underlying primitive ectoderm. We have no evidence that allows us to choose between these two possibilities but Fig. 6 may help to evaluate the feas- ibility of the second alternative.
Fig. 6 shows a possible distribution of two cell popu- lations (shaded grey and black respectively) in a chi- maeric blastocyst. Little or no cell mixing is assumed to occur immediately after aggregation (Garner and McLaren 1974; Kelly 1979; Ziomek and Johnson 1982), so that the black and grey cells are illustrated as each occupying a hemispherical domain. The allocation of ICM to primitive ectoderm and primitive endoderm may generate tissues with very different proportions (Fal- coner and Avery 1978; West et al. 1984) and in Fig. 6 the primitive ectoderm is shown as predominantly grey while the primitive endoderm is mainly black. Several factors, other than cell selection, may affect the propor- tion of placental trophoblast cells, derived from the tro- phectoderm layer of the blastocyst. It could be argued that if the two aggregated embryos occupy hemispherical domains and the trophectoderm cells are allocated on the basis of their outside position, the trophectoderm should be initially composed of approximately equal number of cells from each embryo. However, the pro- portion may deviate from the 50% illustrated in Fig. 6 for several reasons.

304
First, one or both daughter cells of each 8-cell stage blastomere may subsequently become trophectoderm cells (Johnson and Maro 1986; Pickering etal . 1988) so one embryo may produce more trophectoderm cells. The mechanisms that control this choice are imperfectly understood and may operate differently in chimaeric ag- gregates that involve twice as many cells. Second, early dividing blastomeres tend to contribute to the ICM more frequently than later dividing cells, so if developmental asynchrony exists between the two aggregated embryos this may affect their contributions to the trophectoderm (Spindle 1982). Perhaps most significantly, most of the placental trophoblast cells are derived from a small number of polar trophectoderm cells. (The mural tro- phectoderm cells stop division soon after losing contact with the inner cell mass, so it contributes only a few terminally differentiated trophoblast giant cells to the 121/2 day conceptus; Copp 1978; 1979.) In Fig. 6 the patch of grey cells straddles the boundary between the polar trophectoderm and the primitive ectoderm so that a polar trophectoderm composed entirely of grey cells overlies a primitive ectoderm that is predominantly but not exclusively grey.
The second significant observation, concerning the placenta, was that the distribution of % GPI-1A in the placenta was U-shaped and unlike that of any other tissue (Fig. 4); in 17/28 placenta samples the proport ion of the minor component was 10% or less. It is unlikely that the procedure used to correct for the maternal con- tamination generated the U-shaped distribution because Epstein et al. (1984) commented on a similar observa- tion. In this case 21/26 of the placentas of aggregation chimaeras, made by aggregating normal diploid embryos with diploid embryos containing a Robertsonian translo- cation, had a minor component that contributed 10% or less. These two cases of U-shaped distributions of diploid+-~diploid chimaeric placentas suggest that the four trisomy-15~--~diploid chimaeras that had unbal- anced and widely differing placental contributions (0%, 0%, 90% and 100% respectively; Epstein et al. 1984) may not be as unusual as they first appear.
The U-shaped distribution suggests that the placental GPI-I activity is derived from a small number of coher- ent clones (either a small number of precursor cells or possibly a larger number of cells if the two cell poplua- tions are not intimately mixed so that the coherent clones are large; see West 1978). In a chimaeric blastocyst with two cell populations that are not finely intermingled the polar trophectoderm cells may often all be from the same cell population (grey cells in Fig. 6) and so the placental trophoblast will be derived from only one cell popula- tion. A minor contribution of placental tissue is derived from the other two primary developmental lineages (see above) and may have very different proportions of the two GPI-I allozymes.
Since the mural trophectoderm contributes few cells to the placenta, it will contribute a negligible proport ion to the total GPI-1 activity at 121/2 days. Thus, if one cell population of a chimaeric blastocyst was confined to the mural trophectoderm, it may not be detectable by GPI-I analysis of the 121/2 day conceptus. The five
non-chimaeric conceptuses shown in Table 2 (four AFz and one BF2) could have arisen either as a consequence of technical failure or confinement of one cell population to the mural trophectoderm lineage.
In conclusion, we have shown that, although as a population the placentas of chimaeric conceptuses are balanced with respect to the % GPI-1A (mean close to 50%), individually most placentas are extremely un- balanced in their chimaeric composition ( < 1 0 % or > 9 0 % GPI-1A). This non-random composition of the chimaeric placentas is in contrast to the widely held as- sumption that there is normally a random distribution of embryonic cells in chimaeras. A more detailed under- standing of the cellular distributions in control aggrega- tion chimaeras should provide a better basis for use of chimaeras to evaluate the developmental potential of cells, with various types of developmental defects. A more direct analysis of the distribution of two cell popu- lations in chimaeric blastocysts and egg cylinder stage embryos, using an in situ marker (e.g. Thomson and Solter 1988, 1989) may also provide useful information about cell allocation, although it may be necessary to reduce the cell numbers to make chimaeras a more realis- tic model of the normal embryo.
Acknowledgements. We thank Dr Colin Bishop for the Y chromo- some probe pY353/B, Pam Warner for statistical advice with the Z 2 test, Denis Doogan and Maureen Ross for expert mouse hus- bandry and Tom McFetters, Ted Pinner and Frank Johnstone for preparing the figures. This work was supported by a research grant from the Wellcome Trust (to JDW) and a PhD studentship from the Medical Research Council (RMJ).
References
Barsh GS, Lovett M, Epstein CJ (1990) Effects of the lethal yellow (A y) mutation in mouse aggregation chimeras. Development 109: 683-690
Bennett D (1978) Rescue of a lethal Tit locus genotype by chimaer- ism with normal embryos. Nature 272:539
Copp AJ (1978) Interaction between inner cell mass and trophecto- derm of the mouse blastocyst. I. A study of cellular prolifera- tion. J Embryol Exp Morphol 48:109 125
Copp AJ (1979) Interaction between inner cell mass and trophecto- derm of the mouse blastocyst. II. The fate of the polar trophec- toderm. J Embryo1 Exp Morphol 51 : 109-120
Cox DR, Smith SA, Epstein LB, Epstein CJ (1984) Mouse trisomy 16 as an animal model of human trisomy 21 (Down Syndrome): production of viable trisomy 16~--*diploid mouse embryos. Dev Biol 101:416424
Cruz YP, Pedersen RA (1985) Cell fate in the polar trophectoderm of mouse blastocysts as studied by microinjection of cell lineage tracers. Dev Biol 112 : 73-83
Epstein CJ, Smith SA, Cox DR (1984) Production and properties of mouse trisomy 15+-+diploid chimeras. Dev Genet 4:159-165
Epstein C J, Smith SA, Zamora T, Sawicki JA, Magnuson TR, Cox DR (1982) Production of viable adult trisomy 17+-+diploid mouse chimeras. Proc Nat Acad Sci USA 79:4376-4380
Falconer DS, Avery PJ (1978) Variability of chimaeras and mosaics. J Embryol Exp Morphol 43:195-219
Fundle R, Howlett SK, Kothary R, Norris ML, Mills WE, Surani MA (1991) Developmental potential of parthenogenetic cells: role of genotype-specific modifiers. Development 108:941-946
Fundele R, Jfigerbauer E-M, Kolbus U, Winking H, Gropp A (1985) Viability of trisomy 12 cells in mouse chimaeras. Roux's Arch Dev Biol 194:178-180
305
Fundele R, Norris ML, Barton SC, Fehlau M, Howlett SK, Mills WE, Surani MA (1990) Temporal and spatial selection against parthenogenetic cells during development of fetal chimeras. De- velopment 108:203-211
Fundele R, Norris ML, Barton SC, Reik W, Surani MA (1989) Systematic elimination of parthenogenetic cells in mouse chi- meras. Development 106:2%35
Gardner RL (1978) The relationship between cell lineage and dif- ferentiation in the early mouse embryo. In: Gehring WJ (ed) Results and problem in cell differentiation. Springer, Berlin Hei- delberg, pp 205-241
Gardner RL, Papaioannou VE (1975) Differentiation in the tro- phectoderm and inner cell mass. In: Balls M, Wild AE (eds) The early development of mammals. Cambridge University Press, Cambridge, pp 107 132
Garner W, McLaren A (1974) Cell distribution in chimaeric mouse embryos before implantation. J Embryol Exp Morphol 32:495 5O3
Handyside AH (1978) Time of commitment of inside cells isolated from preimplantation mouse embryos. J Embryol Exp Morphol 45 : 37-53
Johnson MH, Maro B (1986) Time and space in the mouse early embryo: a cell biological approach to cell diversification. In: Rossant J, Pedersen RA (eds) Experimental approaches to mammalian embryonic development. Cambridge University Press, Cambridge, pp 35 65
Keighren M, West JD (1993) Analysis of cell ploidy in histological sections of mouse tissues by DNA-DNA in situ hybridisation with digoxigenin labelled probes. Histochem J 25 : 30-44
Kelly SJ (1979) Investigation into the degree of cell mixing that occurs between the 8-cell stage and the blastocyst stage of mouse development. J Exp Zool 207:121-130
Levak-Svajger B, Svajger A, Skreb N (1969) Separation of germ layers in presomite rat embryos. Experientia 25:1311-1312
McLaren A (1976) Mammalian chimaeras, Cambridge University Press, Cambridge
McLaren A, Buehr M (1990) Development of mouse germ cells in cultures of fetal gonads. Cell Differ Dev 31:185-195
McLaren A, Michie D (1956) Studies on the transfer of fertilized mouse eggs to uterine foster mothers. I. Factors affecting the implantation and survival of native and transferred eggs. J Exp Biol 33 : 394416
Mintz B (i 962) Formation of genotypically mosaic mouse embryos. Am Zool 2:432 [Abstr. 310]
Mintz B (1964) Formation of genetically mosaic mouse embryos, and early development of "lethal (t12/t12)-normal '' mosaics. J Exp Zool 157:273-292
Mintz B, Gearhart JD, Guymont AG (1973) Phytohemagglutinin- mediated blastomere aggregation and development of allophen- ic mice. Dev Biol 31 : 195-199
Mullen RJ, Whitten WK (1971) Relationship of genotype and de- gree of chimerism in coat color to sex ratios and gametogenesis in chimeric mice. J Exp Zool 178:165-176
Nagy A, P/~ldi A, Dezso L, Varga L, Magyar A (1987) Prenatal fate of parthenogenetic cells in mouse aggregation chimaeras. Development 101:67-71
Nagy A, Sass M, Markkula M (1989) Systematic non-uniform dis- tribution of parthenogenetic cells in adult mouse chimaeras. Development 106:321 324
Nicolson GL, Yanagamachi R, Yanagamachi H (1975) Ultrastruc- tural localization of lectin binding sites of the zonae pellucidae and plasma membranes of mammalian eggs. J Cell Biol 66:263- 274
Palmer SJ, Burgoyne PS (1991) The Mus musculus domesticus Tdy allele acts later than the Mus musculus musculus Tdy allele: a basis for XY sex-reversal in C57BL/6-Y P°s mice. Develop- ment 113 : 709-714
Papaioannou VE, West JD (1981) Relationship between the paren- tal origin of the X-chromosomes, embryonic cell lineage and X-chromosome expression in mice. Genet Res Camb 37:183- 197
Pickering SJ, Maro B, Johnson MH, Skepper JN (1988) The influ- ence of cell contact on the division of mouse 8-cell blastomeres. Development 103:353-363
Pratt HPM (1987) Isolation, culture and manipulation of pre-im- plantation mouse embryos. In: Monk M (ed) Mammalian de- velopment: a practical approach. IRL Press, Oxford, pp 29-42
Quinn p, Barros C, Whittingham DG (1982) Preservation of ham- ster oocytes to assay the fertilizing capacity of human spermato- zoa. J Repr Fert 66:161-168
Rossant J, Croy BA (1985) Genetic identification of the tissue of origin of cellular populations within the mouse placenta. J Embryo1 Exp Morphol 86:177-189
Spindle A (1982) Cell allocation in preimplantation mouse chimaer- as. J Exp Zooi 219:361-367
Surani MA, Barton SC, Howlett SK, Norris ML (1988) Influence of chromosomal determinants on development of androgenetic and parthenogenetic cells. Development 103 : 171-178
Surani MAH, Barton SC, Norris ML (1987) Influence of parental chromosomes on spatial specificity in adrogenetic+-+partheno- genetic chimaeras in the mouse. Nature 326:395-397
Tarkowski AK (1961) Mouse chimaeras developed from fused eggs. Nature 190:857-860
Thomson JA, Solter D (1988) The developmental fate of androgen- etic, parthenogenetic and gynogenetic cells in chimeric gastru- lating mouse embryos. Gen Dev 2:1344-1351
Thomson JA, Solter D (1989) Chimeras between parthenogenetic or androgenetic blastomeres and normal embryos: allocation to the inner cell mass and trophectoderm. Dev Biol 131:580- 583
West JD (1978) Analysis of clonal growth using chimaeras and mosaics. In : Johnson MH (ed) Development in mammals, vol 3. Elsevier/North Holland, Amsterdam New York Oxford, pp 413-460
West JD, Bficher Th, Linke IM, Dfinnwald M (1984) Investigation of variability among mouse aggregation chimaeras and X-chro- mosome inactivation mosaics. J Embryol Exp Morphol 84:309-329
West JD, Green JF (1983) The transition from oocyte-coded to embryo-coded glucose phosphate isomerase in the early mouse embryo. J Embryol Exp Morphol 78 : 127-140
West JD, Leask R, Green JF (1986) Quantification of the transition from oocyte-coded to embryo-coded glucose phosphate isomer- ase in mouse embryos. J Embryol Exp Morphol 97:225 237
Whittingham DG (1971) Culture of mouse ova. J Reprod Fertil [Suppl] 14:7-21
Ziomek CA, Johnson MH (1982) The roles of phenotype and posi- tion in guiding the fate of 16-cell mouse blastomeres. Dev Biol 91 : 440M47


