Comparative Effects of Insulin-Like Growth Factor II (IGF ...

RESEARCH ARTICLE Open Access
Quantitative analysis of insulin-like growthfactor 2 receptor and insulin-like growthfactor binding proteins to identify controlmechanisms for insulin-like growth factor 1receptor phosphorylationDan Tian1, Isaiah Mitchell1 and Pamela K. Kreeger1,2*
Abstract
Background: The insulin-like growth factor (IGF) system impacts cellular development by regulating proliferation,differentiation, and apoptosis, and is an attractive therapeutic target in cancer. The IGF system is complex, with twoligands (IGF1, IGF2), two receptors (IGF1R, IGF2R), and at least six high affinity IGF-binding proteins (IGFBPs) thatregulate IGF ligand bioavailability. While the individual components of the IGF system are well studied, the questionof how these different components integrate as a system to regulate cell behavior is less clear.
Results: To analyze the relative importance of different mechanisms that control IGF network activity, wedeveloped a mass-action kinetic model incorporating cell surface binding, phosphorylation, and intracellulartrafficking events. The model was calibrated and validated using experimental data collected from OVCAR5, animmortalized ovarian cancer cell line. We then performed model analysis to examine the ability of IGF2R or IGFBPsto counteract phosphorylation of IGF1R, a critical step for IGF network activation. This analysis suggested that IGF2Rlevels would need to be 320-fold greater than IGF1R in order to decrease pIGF1R by 25 %, while IGFBP levels wouldneed to be 390-fold greater. Analysis of The Cancer Genome Atlas (TCGA) data set suggested that this level ofoverexpression is unlikely for IGF2R in ovarian, breast, and colon cancer. In contrast, IGFBPs can likely reach theselevels, suggesting that IGFBPs are the more critical regulator of IGF1R network activity. Levels of phosphorylatedIGF1R were insensitive to changes in parameters regulating the IGF2R arm of the network.
Conclusions: Using a mass-action kinetic model, we determined that IGF2R plays a minor role in regulating theactivity of IGF1R under a variety of conditions and that due to their high expression levels, IGFBPs are the dominantmechanism to regulating IGF network activation.
Keywords: Insulin-like growth factor (IGF), Mathematical modeling, Ovarian cancer
* Correspondence: [email protected] of Biomedical Engineering, 4553 WI Institute Medical Research,University of Wisconsin-Madison, 1111 Highland Ave, Madison, WI 53705,USA2University of Wisconsin Carbone Cancer Center, 600 Highland Ave, Madison,WI 53792, USA
© 2016 Tian et al. Open Access This article is distributed under the terms of the Creative Commons Attribution 4.0International License (http://creativecommons.org/licenses/by/4.0/), which permits unrestricted use, distribution, andreproduction in any medium, provided you give appropriate credit to the original author(s) and the source, provide a link tothe Creative Commons license, and indicate if changes were made. The Creative Commons Public Domain Dedication waiver(http://creativecommons.org/publicdomain/zero/1.0/) applies to the data made available in this article, unless otherwise stated.
Tian et al. BMC Systems Biology (2016) 10:15 DOI 10.1186/s12918-016-0263-6

BackgroundThe insulin-like growth factor (IGF) network plays im-portant roles in homeostasis and disease by mediatingcell proliferation, differentiation, and apoptosis [1].Elevated levels of IGF ligands have been observed inovarian, breast, and colon cancer, and are associatedwith poor prognosis and resistance to treatment [2–6].Therefore, the IGF network has been proposed as apotential therapeutic target that could benefit a broadgroup of patients. However, clinical trials with IGF-targeted inhibitors have had mixed results [7]. While theindividual elements of the network have been wellcharacterized, it is less clear how these componentsinteract, information that may provide new methods tobetter counteract IGF-mediated effects in cancer.The IGF network is composed of two ligands (IGF1,
IGF2), two receptors (IGF1R, IGF2R), and a family of sixhigh affinity binding proteins (IGFBPs) [8]. IGF1 andIGF2 are produced in the liver and other tissues, and actboth locally and following circulation through the blood-stream to reach target tissues. Igf1−/− and Igf2−/− micewere significantly smaller than their wildtype littermates,displayed severe muscle dystrophy and died perinatally[9, 10]. IGF1R is a receptor tyrosine kinase that bindsIGF1 and IGF2 to initiate a cascade of downstream sig-naling pathways such as the MAPK/ERK and PI3K/AKT. Similar to other receptor tyrosine kinases, IGF-IGF1R complexes are internalized by receptor-mediatedendocytosis and degraded by the lysosome or recycledback to the cell surface [11]. Igf1r−/− mice exhibitedsevere growth restriction and died shortly after birth ofrespiratory failure [12]. Additionally, IGF1R and theclosely related insulin receptor (IR) form signaling-competent heterodimers of IGF1R/IR hybrid receptorsin cells that express both receptors [13]. IGF2R specific-ally binds IGF2, but lacks an intracellular tyrosine kinasedomain [14]. While IGF2R cannot initiate downstreamsignaling cascades, IGF2-IGF2R complexes undergo cel-lular trafficking, potentially regulating extracellular IGF2levels and providing an indirect mechanism to influencecellular behavior [11]. Consistent with this, Igf2r−/−mice exhibited increased levels of IGF2 and diedperinatally due to abnormal growth [15, 16]. In additionto these interactions, circulating levels of IGF1 and IGF2are regulated by high-affinity interactions with IGFBPs[17]. These interactions increase ligand stability andutilize some of the same residues as the ligand-receptorinteraction, leading to competitive inhibition [18].The balance of these different IGF network components
(i.e., ligands, binding proteins, receptors) likely plays animportant role in maintaining healthy tissue. For example,elevated IGF1 and IGF2 expression were linked to diseaseprogression and poor survival in ovarian cancer [2, 3].Additionally, differences in receptor and binding protein
levels have been reported [19, 20], but in contrast to otherreceptor systems, dramatic overexpression or mutationsthat impact protein function appear to be rare [7]. There-fore, it will be important to better understand how themore subtle balances between these different componentsinfluence network activity. In particular, IGFBPs andIGF2R provide two separate mechanisms to regulate IGF2bioavailability and have each been suggested as a potentialtumor suppressor [21–23]; however, it remains unclearwhich plays the dominant role in regulating IGF2 activityin tumors. Computational modeling is a useful method toanalyze how changes in individual components impactnetwork activity, and has been valuable in understandingthe impact of other signaling networks on tumor develop-ment, progression, and treatment [24]. Most of the priormodels of the IGF network have focused exclusively onIGF1R and have not incorporated the impact of IGF2R orIGFBPs [25, 26]. We have previously developed a compu-tational model of the interactions between IGF1, IGF1R,and IGFBPs in ovarian cancer cells [27]. Analysis of thismodel suggested, and experimental results confirmed, thatIGFBPs were key regulators of IGF1-mediated IGF1Ractivation. In addition, a more complete model of the IGFsystem in cartilage has been developed, incorporatingextracellular and cell surface interactions of IGF1, IGF2,IGFBPs, IGF1R, and IGF2R [28]. Model analysis suggestedthat IGF2R levels could influence IGF1R activation;however, the impact of changes in the level of IGFBPs wasnot examined and this analysis was not experimentallyvalidated. Therefore, to analyze the relative role of IGFBPsand IGF2R in cancer, we developed a mass-action kineticsmodel of the IGF network that incorporated IGF1, IGF2,IGF1R, IGF2R, and IGFBPs. The model was calibratedand validated using an ovarian cancer cell line, OVCAR5,and then analyzed to determine the relative impact ofIGF2R and IGFBPs on IGF2-mediated IGF1R activation.
Results and discussionA calibrated mass-action kinetic model accurately capturespIGF1R dynamicsTo examine which factors regulate IGF1R phosphoryl-ation, and therefore IGF network activation, we devel-oped a mass-action kinetic model that incorporated cellsurface interactions and intracellular trafficking eventsfollowing treatment with IGF1 and/or IGF2 (Fig. 1a).Details about the model structure and parameters canbe found in Additional file 1. Where possible, parametervalues were obtained from literature or experimentalanalysis of OVCAR5 cells (Additional file 2); remainingparameters were fit to experimental timecourses ofphosphorylated IGF1R (pIGF1R) in OVCAR5 cells stim-ulated with 1 nM IGF1, 10 nM IGF1, 1 nM IGF2, or 10nM IGF2 (Fig. 1b, c).
Tian et al. BMC Systems Biology (2016) 10:15 Page 2 of 11

The experimental data demonstrated that after ligandtreatment, there was a rapid and transient peak inpIGF1R (Fig. 1b, c). For treatment with high doses (10nM IGF1 or IGF2), the level of pIGF1R remained above50 % of the peak level at 30 min; in contrast, treatmentswith lower doses (1 nM IGF1 or IGF2) did not result insustained activation. Additionally, IGF1 treatment wasobserved to elicit a stronger peak in pIGF1R than IGF2treatment for the same dose, consistent with previousreports [29]. The experimental data was well-describedby the model solution, with the timing and magnitude ofthe pIGF1R peak accurately captured, suggesting thatthe model framework adequately described the dynamicsof the IGF system in response to either stimuli. We nextexamined the model’s ability to predict the impact ofsimultaneous exposure to IGF1 and IGF2, as cells in vivoare frequently exposed to both stimuli. OVCAR5 weretreated with a mixture of 0.5 nM IGF1 and 0.5 nM IGF2and pIGF1R was measured as a function of time. Experi-mental results demonstrated that this mixture led to sig-naling that was intermediate in magnitude relative to 1
nM of the individual ligands, suggesting that the systembehaves in a linear fashion when below saturating levels.Comparison of model predictions and experimental datademonstrated good agreement (Fig. 1d), validating themodel’s predictive capability.
Changes in IGF2R levels do not affect pIGF1R magnitudeor dynamicsIGF2R has been postulated to act as a tumor suppressorby binding and clearing IGF2, thereby preventing activa-tion of IGF1R [22]. To better understand the influenceof IGF2R on the IGF network, we utilized the model toexamine the effect of changes in IGF2R levels on IGF2-induced phosphorylation of IGF1R. Simulations wereperformed for conditions corresponding to 1 nM IGF2and the level of IGF2R knockdown and overexpressionthat was achieved experimentally in OVCAR5 (Fig. 2,Additional file 3). To isolate the effects of IGF2R, simu-lations were conducted assuming no IGFBPs werepresent and experiments were performed in freshserum-free media to minimize cell-secreted IGFBPs [27].
Fig. 1 The IGF network model qualitatively and quantitatively captured pIGF1R experimental dynamics. a Diagram of molecular events includedin the model, double-sided arrows indicate reversible events. b, c Comparison of the best-fit model to experimental results for IGF1- (b) andIGF2- (c) treated OVCAR5. d The calibrated model was used to predict the effect of a mixture of 0.5 nM IGF1 and 0.5 nM IGF2 on pIGF1R inOVCAR5. In these experiments, IGF2 was added directly to the culture media, which contained OVCAR5-secreted IGFBPs. Model results arerepresented by solid lines and experimental data are represented by circles or squares indicating average ± SD, n = 3
Tian et al. BMC Systems Biology (2016) 10:15 Page 3 of 11

While IGF2R sequestration of IGF2 is expected to regu-late IGF1R activation [30], the validated model predictedthat IGF2R knockdown would have no discernable ef-fect. The experimental results confirmed this prediction,with no significant difference in pIGF1R at all timepoints for either knockdown (Fig. 2a) or overexpression(Fig. 2b). As our model only captured early timedynamics, we tested the impact of knockdown and over-expression of IGF2R on IGF2-induced proliferation anddetermined that this change to the IGF network had nosignificant long-term effects as well (Fig. 2c, d). Incontrast, prior studies in breast cancer cells showed thatdecreased IGF2R expression resulted in a higher growthrate [31] while increased IGF2R expression led todecreased invasiveness and motility [32]. However, theseprior studies did not measure either the absolute level ofIGF receptors or the ratio of IGF2R to IGF1R, whichmay significantly affect IGF network activation.Therefore, we next utilized the model to determine
what ratio of IGF2R:IGF1R was needed for IGF2R to bean effective suppressor of IGF2-mediated activation. Themodel was utilized to simulate the effects of overex-pressing IGF2R relative to IGF1R, with IGF2R:IGF1Rranging from 1:1 to 100:1. As shown in Fig. 3a, anIGF2R:IGF1R ratio of 100 would be necessary to reducethe peak activation of IGF1R by 11.2 %. In the
experimental validation, IGF2R was overexpressed by1.4-fold, resulting in an IGF2R:IGF1R ratio of approxi-mately 1:1. As the IGF2R:IGF1R ratio needed for substan-tial reduction in pIGF1R was dramatically higher thanwhat was achieved in OVCAR5, it was unsurprising thatthe IGF2R overexpression had minimal impact experi-mentally (Fig. 2). We next interrogated the TCGA data-base for measurements of IGF receptor expression todetermine if this level of IGF2R overexpression is possiblein tumor samples. A complete compendium of protein ex-pression of the different IGF system components is notavailable through The Cancer Proteome Atlas (TCPA,[33]); in particular, the reverse phase protein array usedfor most samples in this database included IGFBP2 butdid not measure IGF1R or IGF2R. Therefore, we utilizedgene expression levels from RNA sequencing (RNA-Seq).While transcription levels are not expected to correlateprecisely with protein levels, RNA-Seq data has beenshown to be qualitatively consistent with proteomic mea-surements [34]. The TCGA database was utilized to com-pare the relative expression of IGF2R to IGF1R in threedifferent carcinomas in which IGF activity has been re-ported to play a role (ovarian serous cystadenocarcinoma[35], breast invasive carcinoma [36], and colon adenocar-cinoma [37]; Additional file 4). For all three tumor types,IGF2R:IGF1R was generally less than 10, with only a few
Fig. 2 Alterations in IGF2R levels did not substantially impact phosphorylation of IGF1R or cell proliferation. a, b Model results predicted thata complete knockdown (a) or a 1.4-fold overexpression (b) of IGF2R in OVCAR5 would not affect pIGF1R. This prediction was consistent withexperimental data collected from these conditions. In these experiments, IGF2 was added to fresh serum-free media, and therefore did not containOVCAR5-secreted IGFBPs. c, d IGF2-induced proliferation was not impacted by knockdown of IGF2R (c) nor a 1.4-fold overexpression of IGF2R(d), p > 0.05
Tian et al. BMC Systems Biology (2016) 10:15 Page 4 of 11

tumors expressing as much as 25 times as much IGF2R.Thus, while it is possible for the IGF2R:IGF1R ratio toreach levels where the model would predict a substantialsuppression of pIGF1R, it is expected that this would berare in tumors. However, as a putative tumor suppressor,it is possible that IGF2R levels are decreased during tumordevelopment, such that the ratio of the two receptors is al-tered in the pathophysiological state. The level of IGF2Rwas significantly lower in both breast and colon cancerscompared to normal tissue (p < 0.01, data for normal tis-sue samples is not currently available in the TCGA data-base for ovarian cancer), consistent with prior reports ofreduced IGF2R expression in hepatocellular carcinomascompared to normal liver tissue [38]. However, IGF1R ex-pression was also significantly lower for breast tumors (p <0.01). Therefore, since both receptor levels may changewith tumor development, we also compared theIGF2R:IGF1R ratio between tumor and normal tissue(Additional file 4). Despite the decrease in IGF2R levels, thisratio was unchanged for colon cancers and was actually sig-nificantly higher for breast tumors relative to normal tissue,even though the ratio did not reach levels that our modelpredicts would impact signaling. Combined, the modelanalysis, experimental results, and TCGA data suggestthat IGF2R does not play a substantial role in sup-pressing IGF2 in the examined tumor types. Thisdoes not preclude a role for IGF2R in other tumortypes; for example, hepatocellular carcinomas havebeen found to have mutations in IGF2R [39].Our previous study indicated that the extracellular
level of IGF1 relative to the available IGF1R level was animportant metric that impacted the activation of thisnetwork [27]. Therefore, we hypothesized that a poten-tial factor accounting for the inefficacy of IGF2R sup-pression of IGF2 was the high amount of IGF2 relativeto IGF receptors in OVCAR5. The IGF2 treatment doseof 1 nM was on the order of 10−9 nmol/cell while theexperimentally determined concentration of IGF2R was
on the order of 10−11 nmol/cell; therefore, even if everyIGF2R sequestered an IGF2 ligand there would still be asubstantial amount of IGF2 available to activate IGF1R.To examine if the effectiveness of IGF2R in suppressingpIGF1R was dependent on IGF2 dose, model analysiswas performed for a range of IGF2 doses to determinethe IGF2R:IGF1R ratio necessary to cut the peak pIGF1Rlevel by 50 % (Fig. 3b). This model analysis suggests thatfor very low doses of IGF2, the amount of IGF2R that isneeded to impact the system does decrease; however,even at doses as low as 0.01 nM IGF2, IGF2R wouldneed to be 188.8 times as abundant as IGF1R in order todecrease pIGF1R activation to that extent. As physio-logical concentrations of free IGF2 range from 0.2 to 2nM [40, 41], this analysis provides further support thatIGF2R does not play a significant role in suppressingIGF network activity in most tumors.
IGFBP levels impact levels of phosphorylated IGF1ROur experimental results suggested that while IGF2R min-imally impacted IGF1R network activity, the presence ofIGFBPs substantially impacted pIGF1R levels, with peakactivation increased by 3-fold when cell-secreted IGFBPswere removed from the media (Fig. 1c vs. Fig. 2a,replotted in Fig. 4a). Therefore, we next examined the roleof IGFBPs in regulating IGF2-induced network activity.IGFBPs bind to circulating IGF1 or IGF2, sequestering theligand from proteases and controlling its presentation toIGF1R [42]. While the regulatory role of IGFBPs in theinteraction between IGF ligands and their receptors iswell-known, there has been limited quantitative analysis ofthe effect of this function. When simulations were run forthe baseline levels of IGF1R and IGF2R in OVCAR5,pIGF1R was found to decrease with increasing levels ofIGFBP (Fig. 4b). Interestingly, IGFBPs were less effectivein controlling phosphorylation of IGF1R than IGF2Rwhen examined at the same ratio (Fig. 3a), since IGF2Rcan target the ligand for degradation while IGFBPs only
Fig. 3 Model results suggest that IGF2R can suppress phosphorylation of IGF1R for specific quantitative combinations. a Model analysis demonstratedthat IGF2R would need to be 100 times more abundant than IGF1R in order to inhibit pIGF1R by 11.2 % in OVCAR5. b Increasing IGF2 treatment dosesincreased the magnitude of IGF2R:IGF1R ratio required for 50 % inhibition of pIGF1R
Tian et al. BMC Systems Biology (2016) 10:15 Page 5 of 11
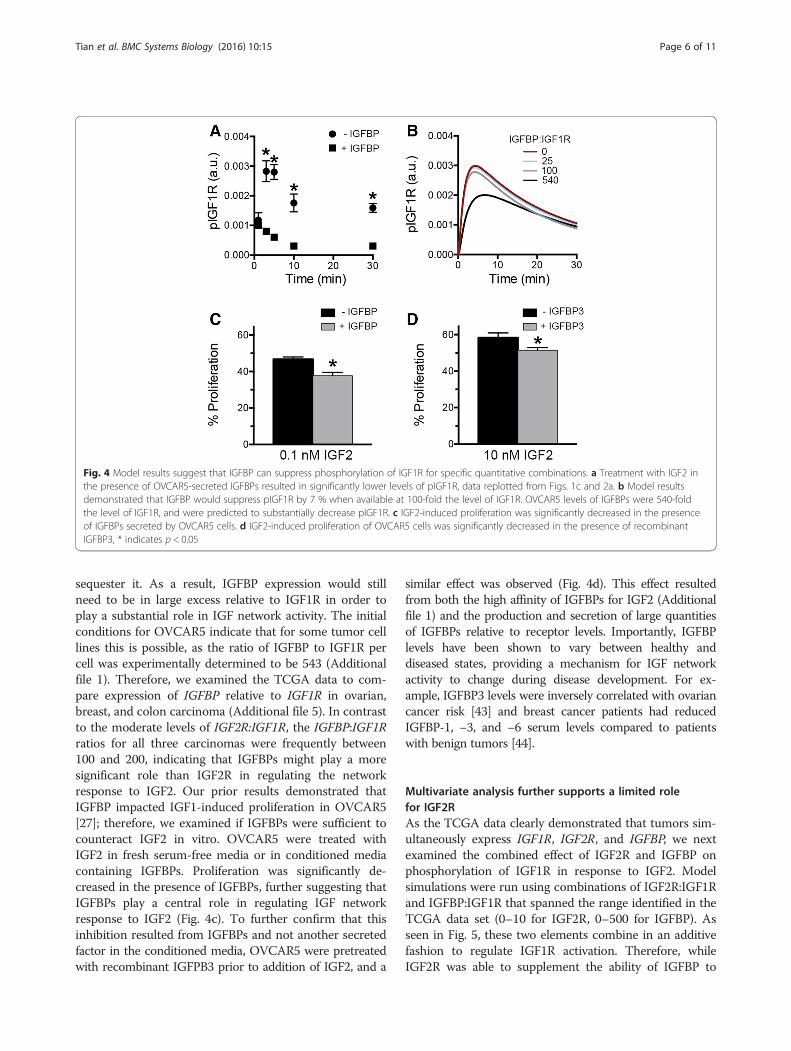
sequester it. As a result, IGFBP expression would stillneed to be in large excess relative to IGF1R in order toplay a substantial role in IGF network activity. The initialconditions for OVCAR5 indicate that for some tumor celllines this is possible, as the ratio of IGFBP to IGF1R percell was experimentally determined to be 543 (Additionalfile 1). Therefore, we examined the TCGA data to com-pare expression of IGFBP relative to IGF1R in ovarian,breast, and colon carcinoma (Additional file 5). In contrastto the moderate levels of IGF2R:IGF1R, the IGFBP:IGF1Rratios for all three carcinomas were frequently between100 and 200, indicating that IGFBPs might play a moresignificant role than IGF2R in regulating the networkresponse to IGF2. Our prior results demonstrated thatIGFBP impacted IGF1-induced proliferation in OVCAR5[27]; therefore, we examined if IGFBPs were sufficient tocounteract IGF2 in vitro. OVCAR5 were treated withIGF2 in fresh serum-free media or in conditioned mediacontaining IGFBPs. Proliferation was significantly de-creased in the presence of IGFBPs, further suggesting thatIGFBPs play a central role in regulating IGF networkresponse to IGF2 (Fig. 4c). To further confirm that thisinhibition resulted from IGFBPs and not another secretedfactor in the conditioned media, OVCAR5 were pretreatedwith recombinant IGFPB3 prior to addition of IGF2, and a
similar effect was observed (Fig. 4d). This effect resultedfrom both the high affinity of IGFBPs for IGF2 (Additionalfile 1) and the production and secretion of large quantitiesof IGFBPs relative to receptor levels. Importantly, IGFBPlevels have been shown to vary between healthy anddiseased states, providing a mechanism for IGF networkactivity to change during disease development. For ex-ample, IGFBP3 levels were inversely correlated with ovariancancer risk [43] and breast cancer patients had reducedIGFBP-1, −3, and −6 serum levels compared to patientswith benign tumors [44].
Multivariate analysis further supports a limited rolefor IGF2RAs the TCGA data clearly demonstrated that tumors sim-ultaneously express IGF1R, IGF2R, and IGFBP, we nextexamined the combined effect of IGF2R and IGFBP onphosphorylation of IGF1R in response to IGF2. Modelsimulations were run using combinations of IGF2R:IGF1Rand IGFBP:IGF1R that spanned the range identified in theTCGA data set (0–10 for IGF2R, 0–500 for IGFBP). Asseen in Fig. 5, these two elements combine in an additivefashion to regulate IGF1R activation. Therefore, whileIGF2R was able to supplement the ability of IGFBP to
Fig. 4 Model results suggest that IGFBP can suppress phosphorylation of IGF1R for specific quantitative combinations. a Treatment with IGF2 inthe presence of OVCAR5-secreted IGFBPs resulted in significantly lower levels of pIGF1R, data replotted from Figs. 1c and 2a. b Model resultsdemonstrated that IGFBP would suppress pIGF1R by 7 % when available at 100-fold the level of IGF1R. OVCAR5 levels of IGFBPs were 540-foldthe level of IGF1R, and were predicted to substantially decrease pIGF1R. c IGF2-induced proliferation was significantly decreased in the presenceof IGFBPs secreted by OVCAR5 cells. d IGF2-induced proliferation of OVCAR5 cells was significantly decreased in the presence of recombinantIGFBP3, * indicates p < 0.05
Tian et al. BMC Systems Biology (2016) 10:15 Page 6 of 11

prevent IGF1R activation, the dominant control mechan-ism at these levels is expected to remain extracellular lig-and sequestration by IGFBPs.It is possible that in other ovarian cancer cell lines or
tumors, a change in one of the rate parameters couldalter the network’s sensitivity to changes in the level ofIGF2R. To examine this possibility, a sensitivity analysiswas performed, examining first the effect of perturba-tions to the individual parameters (Fig. 6a) and then theeffect of changes in the parameters in combination witha 10-fold increase in IGF2R (Fig. 6b). The single-parameter analysis indicated that the level of pIGF1Rwas most sensitive to parameters that impacted the rateof IGF1R phosphorylation/dephosphorylation (k7/k−7) orIGF2-IGF1R association/dissociation (k5/k−5). This sensi-tivity is not surprising, as those events are the mostproximal to the activation of IGF1R. The next most sen-sitive parameters were k2 (IGF2-IGFBP association) andk8 (internalization of unbound IGF1R). Interestingly, thenetwork was insensitive to all parameters regulating theinteraction of IGF2 and IGF2R, as well as IGF2R traffick-ing. To determine if changes in these parameters impactedsensitivity to the level of IGF2R, a multivariate analysiswas performed with a 10-fold increase in IGF2R incombination with each rate. To prevent offsetting effects,parameters were altered such that both perturbationsresulted in a decrease in the level of pIGF1R (Fig. 6b). Theranking of the 10 most sensitive parameters did notchange from the initial analysis and the impact on pIGF1Rfrom a simultaneous change in parameters did not differsubstantially from the sum of the effects of changing eachrate and IGF2R individually. Combined, these analysessuggest there is no synergy between the rate parametersand sensitivity to IGF2R levels.
ConclusionsThe model presented here constitutes an importantexpansion of our foundational IGF model, which indi-cated that IGFBPs played an essential role in regulatingIGF1-IGF1R interactions [27]. This expanded model in-corporated the IGF2 axis of the IGF network (i.e., IGF2and IGF2R) and was used to assess the hypothesizedroles of IGF2R and IGFBPs as tumor suppressors. Ourmodel suggested, and experimental results confirmed,that IGF2R played only a minor role in counteractingIGF2 treatment. To significantly impact network activa-tion, model analysis further suggested that IGF2R wouldneed to be expressed at levels that are substantiallyhigher than IGF1R and which do not appear to be physio-logically relevant in several tumor types. In contrast to ouranalysis, a prior model of this system in cartilagesuggested the IGF2R might play a role in regulating IGF2interactions with IGF1R [28]; however, these findings werenot confirmed experimentally and were not seen in ourmodel utilizing data from cancer cells.The inability of IGF2R to impact IGF1R signaling
dynamics experimentally and under a variety of quanti-tative scenarios raises the question of why the Igf2r−/−mouse demonstrated a clear phenotype [15, 16] andwhat role IGF2R actually plays in the cellular network. Itis of course possible that under conditions that were notincluded in these simulations, IGF2R can impact theIGF1R network. For example, despite IGFBP1 being thedominant IGFBP in fetal development [45, 46], the levelsof IGF1BP in the fetal liver are only 4 % of the levelsfound in the maternal decidua [47]. Given the low levelsof IGFBPs in fetal circulation, IGF2R could play a largerrole in regulating circulating levels of IGF2 than is seenin the adult, explaining the effects seen in perinatal
Fig. 5 IGFBP and IGF2R demonstrated an additive effect when examined in combination. Model simulations of different combinations of IGF2R andIGFBP levels indicated that increases in IGFBP and IGF2R would act together, but would not synergize, to counteract IGF2-induced phosphorylationof IGF1R
Tian et al. BMC Systems Biology (2016) 10:15 Page 7 of 11

growth in the Igf2r−/− mouse. Additionally, the muchlonger timescale of fetal development may amplify thefairly modest effects seen in our simulations, resulting ina more important role for IGF2R. Finally, it is importantto note that IGF2R has been shown to play a role in thecellular network beyond the IGF axis, as mannose-6-phosphate tagged proteins can also bind to IGF2R andbe trafficked to the lysosome [48].Importantly, the combined effect of the multiple gen-
omic changes that lead to tumorigenesis could fundamen-tally change the parameter space and resulting behavior ofthe IGF network. For example, PTP1B, a phosphatase forIGF1R [49], is expressed at significantly lower levels inovarian cancer cells compared to normal ovarian surfaceepithelial cells [50]. While ovarian surface epithelia are nolonger considered to be the cell of origin for ovariancancer [51], changes in PTP1B levels in combination withchanges in the levels of other proteins could impact thekinetics of IGF1R activation. Likewise, a recent studydemonstrated that clathrin-mediated, caveolae-mediated,and clathrin-independent endocytosis were all lower innon-small cell lung cancer cells compared to their normalbronchial epithelial counterparts [52]. Further, the rates
for these processes also varied across a panel of non-smallcell lung cancer cell lines. This report, combined with ourfinding that the IGF network was moderately sensitive tointernalization rates suggests that analysis of cellulartrafficking could prove useful to develop new therapeuticapproaches.While the model suggested a limited role for IGF2R,
our analysis demonstrated that the high expression levelof IGFBPs makes them a key control mechanism inresponse to IGF2 treatment, consistent with our priorfindings that IGFBPs regulated IGF1-mediated networkactivation [27]. Additionally, due to their high expressionlevel, IGFBPs were able to interfere with IGF2 treatmentenough to slow cell proliferation. Our results demonstratethe potential for models of the IGF network to examinehow system components interact to regulate behavior,which may help to identify optimal ways to target the IGFnetwork for cancer therapy. In order to obtain a morecomplete understanding of the IGF system in carcinogen-esis, future model refinement should focus on the func-tion of individual IGFBPs, which can elicit differentresponses [17], and regulation of IGFBP-ligand inter-actions by cell-secreted proteases [53].
Fig. 6 Sensitivity analysis demonstrated that pIGF1R was insensitive to changes in the IGF2R network. a Sensitivity of the integrated level of pIGF1Rwhen individual rate parameters were changed. A positive value indicates an increase in the level of pIGF1R. b Sensitivity of the integrated level ofpIGF1R when rate parameters are changed in combination with a 10-fold increase in the level of IGF2R. Parameters were altered such that bothperturbations resulted in a decrease in the level of pIGF1R
Tian et al. BMC Systems Biology (2016) 10:15 Page 8 of 11

MethodsCell culture and reagentsOVCAR5 cells were originally isolated from a serousovarian carcinoma and were obtained from Dr. R. Bast(MD Anderson Cancer Center, Houston, TX). As anestablished member of the NCI-60 panel of cell lines, noadditional ethics approval was needed. Cells were main-tained at 37 °C in a humidified 5 % CO2 atmosphere in acomplete culture medium composed of 1:1 (v/v) ratio ofMCDB 105 and Medium 199 (Corning, Manassas, VA)supplemented with 10 % fetal bovine serum (LifeTechnologies, Carlsbad, CA) and 1 % penicillin/strepto-mycin. OVCAR5 cells were routinely tested and confirmedto be mycoplasma negative using the MycoAlert® Myco-plasma Detection Kit (Lonza, Rockland, ME). All reagentswere from Sigma-Aldrich (St. Louis, MO) or ThermoFisher Scientific (Waltham, MA) unless otherwise noted.
Measurement of phosphorylated IGF1R (pIGF1R)OVCAR5 were plated in 10 cm plates at 5700 cells/cm2,allowed to grow for 2 days, and then serum-starved for24 h prior to treatment with recombinant human IGF1or IGF2 (Peprotech, Rocky Hill, NJ). Cells were lysed attimes ranging from 0 to 30 min after treatment withBio-Plex lysis buffer (Bio-Rad Laboratories Inc.,Hercules, CA). Total protein was measured by BCAassay and the level of pIGF1R was determined by theBio-Plex pIGF1R (Tyr1131) assay on a Bio-Rad Bio-Plex 100 Suspension Array system (Bio-Rad Labora-tories Inc.).
siRNA knockdown of IGF1R and IGF2RTo knockdown IGF1R or IGF2R expression in OVCAR5,cells were plated in 35 mm plates at 5300 cells/cm2,allowed to attach for 6 h, and transfected for 24 h with12.5 nM ON-TARGETplus Human IGF1R or IGF2RSMARTpool siRNA using DharmaFECT 1 siRNA Trans-fection Reagent (Dharmacon, Lafayette, CO). Transfectedcells were changed to fresh complete media for 24 h,serum-starved for 24 h, and then treated with IGF ligands.Non-targeting siRNA was used as a negative control.
Overexpression of IGF2RpcDNA3.1(+)MPR-270, which expresses IGF2R under theCMV promoter, was kindly provided by Dr. William S. Sly(Saint Louis University, St. Louis, MO) [54]. OVCAR5were plated in 35 mm plates at 5300 cells/cm2, allowed togrow for 24 h, and transfected with 2.5 μg DNA per plateusing Lipofectamine® 3000 (Life Technologies) accordingto the manufacturer’s instructions. Transfection efficiencywas determined to be 64 % by flow cytometry analysis oftransfection with pEGFP. After 6 h of transfection, themedia was changed to fresh complete media for 24 h, andthen the cells were serum-starved for 24 h prior to IGF
treatment. Transfection with pcDNA3.1(+) was used as anegative control.
Quantification of cell proliferationOVCAR5 were seeded in 12-well plates at 5300 cells/cm2,allowed to grow for 2 days, and then serum-starved for24 h (resulting in a final density of 126,000 cells/well).IGF2 was then either spiked directly into conditionedmedia (which contains cell-secreted IGFBPs, [27]) orserum-free media was aspirated, cells were rinsed oncewith PBS, and the IGF2 treatment was added with freshserum-free media. For experiments with IGFBP3, 15 nMof recombinant human IGFBP3 (Peprotech) was added30 min prior to treatment with IGF2. All experimentswere done with 1 mL of media per well. Cell proliferationwas quantified after 24 h of IGF2 treatment using theClick-iT® EdU Alexa Fluor® 488 flow cytometry assay(Life Technologies) according to manufacturer’s in-structions. Cells were incubated with EdU for 6 hprior to sample collection and analyzed on an AccuriC6 flow cytometer (BD, Franklin Lakes, NJ). To in-vestigate the effects of IGF2R knockdown and overex-pression on IGF2-induced proliferation, transfectedcells were plated as described and treated with eithervehicle or 1 nM IGF2.
Mass-action kinetic model of IGF networkA mass-action kinetic model was developed to analyzethe surface binding interactions between IGF ligandswith IGFBPs, IGF1R, and IGF2R and the subsequentintracellular trafficking events (Fig. 1a). There were atotal of 31 model parameters, of which 14 were deter-mined experimentally or from published KD values forIGF ligands with IGFBPs and IGF receptors (Additionalfiles 1 and 2). The remaining 17 adjustable fittingparameters were determined by a least squares fit of thenumerical solution of Eqs. 1a-x (Additional file 1) toexperimental measurements of pIGF1R, using thelsqcurvefit fitting routine and ode45 solver in MATLABv7.14 (MathWorks; Natick, MA). The lsqcurvefit routineminimizes the sum of the squares of the residual errorbetween the model calculations and the experimentaldata, and the ode45 solver uses a variable step Runge-Kutta method. To ensure that the model found theglobal minimum, model fits were performed using 1000randomly chosen initial guesses for the fitted parame-ters. For each of these combinations, the fitting routinereturned to the same minimum within the fitting routinetolerance, suggesting this corresponds to a global mini-mum. Model analysis focused on the level of pIGF1R asIGF2-induced proliferation of OVCAR5 is dependent onIGF1R kinase activity (Additional file 6, [27]).
Tian et al. BMC Systems Biology (2016) 10:15 Page 9 of 11

Analysis of data from The Cancer Genome Atlas (TCGA)RNA sequencing (RNA-Seq) data for ovarian serous cysta-denocarcinoma, breast invasive carcinoma, and colonadenocarcinoma were obtained from TCGA (http://cancergenome.nih.gov/). To compare the individual andcombined effectiveness of IGFBPs and IGF2R at inhibitingpIGF1R, model calculations were performed over a rangeof IGF2R:IGF1R and IGFBP:IGF1R ratios determinedfrom the ovarian cancer data (one to the mean + one SD).This range encompasses greater than 80 % of the samplesin the TCGA database. RNA-Seq data for normal breastand colon tissue were also obtained from the TCGA data-base; however, normal ovarian tissue data was not available.
Sensitivity analysisSensitivity analysis was performed by increasing eachparameter value and determining the effect on the inte-grated level of pIGF1R relative to the baseline condition.To determine if changes in the parameter set would alterthe ability of IGF2R to regulate network activity, thesensitivity for each parameter altered in combinationwith a 10-fold increase in IGF2R was determined.
Statistical analysisAll data are represented as the mean ± standard deviationand all experiments were performed with n = 3. Statisticalsignificance was evaluated using student’s t-test analysis,with p < 0.05. All statistical calculations were performedusing the software package JMP 4.1 (SAS Institute,Cary, NC).
Availability of dataAll data is available in the additional files or throughthe TCGA data portal https://tcga-data.nci.nih.gov/tcga/tcgaHome2.jsp.
Additional files
Additional file 1: Detailed methods including the full set ofdifferential equations and assumptions used in the model,experimental methods for determination of several rates and initialconditions, experimental methods for validation of the IGF2Rknockdown and overexpression, and tables of both experimentally-determined and model-fitted rates and initial conditions.(DOCX 80 kb)
Additional file 2: Experimental results for the determination ofinternalization rates for IGF1-IGF1R, IGF2-IGF1R, IGF2-IGF2R.(PDF 162 kb)
Additional file 3: Experimental confirmation of IGF2R knockdownand overexpression. (PDF 181 kb)
Additional file 4: Analysis of the TCGA data for IGF2R. (PDF 184 kb)
Additional file 5: Analysis of the TCGA data for IGFBPs. (PDF 197 kb)
Additional file 6: Experimental validation of the impact of IGF1Rand IR inhibition on IGF2-induced cell proliferation, demonstratingthat IGF2-induced proliferation was dependent on IGF1R kinaseactivity and not IR kinase activity. (PDF 104 kb)
AbbreviationsIGF1: insulin-like growth factor 1; IGF2: insulin-like growth factor 2;IGFBPs: insulin-like growth factor binding proteins; IGF1R: type 1 insulin-likegrowth factor receptor; IGF2R: type 2 insulin-like growth factor receptor;IR: insulin receptor.
Competing interestsThe authors declare that they have no competing interests.
Authors’ contributionsDT participated in the design of the study, performed the experimental analysis,developed and analyzed the model, and drafted the manuscript, IM performedthe sensitivity analysis, PKK conceived of the study, participated in its designand coordination, and drafted the manuscript. All authors read and approvedthe final manuscript.
AcknowledgementsWe wish to acknowledge Dr. Matt Lazzara for providing protocols to determineendocytotic rates, Dr. William Sly for providing the IGF2R plasmid, Dr. SaraKnaack and Dr. Sushmita Roy for their help with accessing and analyzing theTCGA data, Dr. Megan McClean for helpful suggestions, Sarah Dicker for herassistance with total protein assays, and Karl Kabarowski for his assistance withtotal protein assays and endocytosis experiments. This work was supported bythe NSF (CBET-0951613, PKK), the American Cancer Society (RSG-13-026-01-CSM, PKK), and the NIH (1DP2CA195766-01, PKK). The authors acknowledge theinstrumentation support of the 3P lab and the University of Wisconsin CarboneCancer Center (UWCCC) Cancer Center Support Grant P30 CA014520. Thesefunding agencies did not participate in the design of the study, any aspect ofdata collection and analysis, or the preparation of this manuscript.
Received: 25 September 2015 Accepted: 29 January 2016
References1. Pollak M. Insulin and insulin-like growth factor signalling in neoplasia.
Nat Rev Cancer. 2008;8:915–28.2. Brokaw J, Katsaros D, Wiley A, Lu L, Su D, Sochirca O, et al. IGF-I in epithelial
ovarian cancer and its role in disease progression. Growth Factors.2007;25:346–54.
3. Sayer RA, Lancaster JM, Pittman J, Gray J, Whitaker R, Marks JR, et al. Highinsulin-like growth factor-2 (IGF-2) gene expression is an independentpredictor of poor survival for patients with advanced stage serous epithelialovarian cancer. Gynecol Oncol. 2005;96:355–61.
4. Endogenous H, Breast Cancer Collaborative G, Key TJ, Appleby PN, Reeves GK,Roddam AW. Insulin-like growth factor 1 (IGF1), IGF binding protein 3 (IGFBP3),and breast cancer risk: pooled individual data analysis of 17 prospectivestudies. Lancet Oncol. 2010;11:530–42.
5. Abir R, Roizman P, Fisch B, Nitke S, Okon E, Orvieto R, et al. Pilot study ofisolated early human follicles cultured in collagen gels for 24 hours.Hum Reprod. 1999;14:1299–301.
6. Denduluria SIO, Wang Z, Liao Z, Yan Z, Mohammed M, Ye J, et al. Insulin-like growth factor (IGF) signaling in tumorigenesis and the development ofcancer drug resistance. Genes Dis. 2015;2(1):13–25.
7. Pollak M. The insulin and insulin-like growth factor receptor family inneoplasia: an update. Nat Rev Cancer. 2012;12:159–69.
8. Bruchim I, Werner H. Targeting IGF-1 signaling pathways in gynecologicmalignancies. Expert Opin Ther Targets. 2013;17:307–20.
9. DeChiara TM, Efstratiadis A, Robertson EJ. A growth-deficiency phenotype inheterozygous mice carrying an insulin-like growth factor II gene disruptedby targeting. Nature. 1990;345:78–80.
10. Powell-Braxton L, Hollingshead P, Giltinan D, Pitts-Meek S, Stewart T.Inactivation of the IGF-I gene in mice results in perinatal lethality.Ann N Y Acad Sci. 1993;692:300–1.
11. Oka Y, Rozek LM, Czech MP. Direct demonstration of rapid insulin-likegrowth factor II Receptor internalization and recycling in rat adipocytes.Insulin stimulates 125I-insulin-like growth factor II degradation bymodulating the IGF-II receptor recycling process. J Biol Chem.1985;260:9435–42.
12. Liu JP, Baker J, Perkins AS, Robertson EJ, Efstratiadis A. Mice carrying nullmutations of the genes encoding insulin-like growth factor I (Igf-1) andtype 1 IGF receptor (Igf1r). Cell. 1993;75:59–72.
Tian et al. BMC Systems Biology (2016) 10:15 Page 10 of 11

13. Soos MA, Whittaker J, Lammers R, Ullrich A, Siddle K. Receptors for insulinand insulin-like growth factor-I can form hybrid dimers. Characterisation ofhybrid receptors in transfected cells. Biochem J. 1990;270:383–90.
14. Kornfeld S. Structure and function of the mannose 6-phosphate/insulinlikegrowth factor II receptors. Annu Rev Biochem. 1992;61:307–30.
15. Lau MM, Stewart CE, Liu Z, Bhatt H, Rotwein P, Stewart CL. Loss of theimprinted IGF2/cation-independent mannose 6-phosphate receptor resultsin fetal overgrowth and perinatal lethality. Genes Dev. 1994;8:2953–63.
16. Wang ZQ, Fung MR, Barlow DP, Wagner EF. Regulation of embryonicgrowth and lysosomal targeting by the imprinted Igf2/Mpr gene. Nature.1994;372:464–7.
17. Baxter RC. IGF binding proteins in cancer: mechanistic and clinical insights.Nat Rev Cancer. 2014;14:329–41.
18. Sitar T, Popowicz GM, Siwanowicz I, Huber R, Holak TA. Structural basis forthe inhibition of insulin-like growth factors by insulin-like growthfactor-binding proteins. Proc Natl Acad Sci U S A. 2006;103:13028–33.
19. An Y, Cai L, Wang Y, Zhu D, Guan Y, Zheng J. Local expression of insulin-likegrowth factor-I, insulin-like growth factor-I receptor, and estrogen receptoralpha in ovarian cancer. Onkologie. 2009;32:638–44.
20. Katsaros D, Yu H, Levesque MA, Danese S, Genta F, Richiardi G, et al. IGFBP-3 inepithelial ovarian carcinoma and its association with clinico-pathologicalfeatures and patient survival. Eur J Cancer. 2001;37:478–85.
21. Toretsky JA, Helman LJ. Involvement of IGF-II in human cancer. J Endocrinol.1996;149:367–72.
22. Yu H, Rohan T. Role of the insulin-like growth factor family in cancerdevelopment and progression. J Natl Cancer Inst. 2000;92:1472–89.
23. Devi GR, Sprenger CC, Plymate SR, Rosenfeld RG. Insulin-like growth factorbinding protein-3 induces early apoptosis in malignant prostate cancer cellsand inhibits tumor formation in vivo. Prostate. 2002;51:141–52.
24. Prasasya RD, Tian D, Kreeger PK. Analysis of cancer signaling networks bysystems biology to develop therapies. Semin Cancer Biol. 2011;21:200–6.
25. Romanelli RJ, LeBeau AP, Fulmer CG, Lazzarino DA, Hochberg A, Wood TL.Insulin-like growth factor type-I receptor internalization and recyclingmediate the sustained phosphorylation of Akt. J Biol Chem.2007;282:22513–24.
26. Iadevaia S, Lu Y, Morales FC, Mills GB, Ram PT. Identification of optimal drugcombinations targeting cellular networks: integrating phospho-proteomicsand computational network analysis. Cancer Res. 2010;70:6704–14.
27. Tian D, Kreeger PK. Analysis of the quantitative balance between insulin-likegrowth factor (IGF)-1 ligand, receptor, and binding protein levels to predictcell sensitivity and therapeutic efficacy. BMC Syst Biol. 2014;8:98.
28. Zhang L, Smith DW, Gardiner BS, Grodzinsky AJ. Modeling the insulin-likegrowth factor system in articular cartilage. PLoS One. 2013;8, e66870.
29. Chisalita SI, Johansson GS, Liefvendahl E, Back K, Arnqvist HJ. Human aorticsmooth muscle cells are insulin resistant at the receptor level but sensitiveto IGF1 and IGF2. J Mol Endocrinol. 2009;43:231–9.
30. Chao W, D’Amore PA. IGF2: epigenetic regulation and role in developmentand disease. Cytokine Growth Factor Rev. 2008;19:111–20.
31. Chen Z, Ge Y, Landman N, Kang JX. Decreased expression of the mannose6-phosphate/insulin-like growth factor-II receptor promotes growth ofhuman breast cancer cells. BMC Cancer. 2002;2:18.
32. Lee JS, Weiss J, Martin JL, Scott CD. Increased expression of the mannose 6-phosphate/insulin-like growth factor-II receptor in breast cancer cells alterstumorigenic properties in vitro and in vivo. Int J Cancer. 2003;107:564–70.
33. Li J, Lu Y, Akbani R, Ju Z, Roebuck PL, Liu W, et al. TCPA: a resource forcancer functional proteomics data. Nat Methods. 2013;10:1046–7.
34. Polo JM, Anderssen E, Walsh RM, Schwarz BA, Nefzger CM, Lim SM, et al. Amolecular roadmap of reprogramming somatic cells into iPS cells. Cell.2012;151:1617–32.
35. Peeters PH, Lukanova A, Allen N, Berrino F, Key T, Dossus L, et al. Serum IGF-I,its major binding protein (IGFBP-3) and epithelial ovarian cancer risk: theEuropean Prospective Investigation into Cancer and Nutrition (EPIC).Endocr Relat Cancer. 2007;14:81–90.
36. Dunn SE, Ehrlich M, Sharp NJ, Reiss K, Solomon G, Hawkins R, et al. Adominant negative mutant of the insulin-like growth factor-I receptorinhibits the adhesion, invasion, and metastasis of breast cancer. Cancer Res.1998;58:3353–61.
37. Singh P, Dai B, Yallampalli U, Lu X, Schroy PC. Proliferation and differentiation ofa human colon cancer cell line (CaCo2) is associated with significant changes inthe expression and secretion of insulin-like growth factor (IGF) IGF-II and IGFbinding protein-4: role of IGF-II. Endocrinology. 1996;137:1764–74.
38. Sue SR, Chari RS, Kong FM, Mills JJ, Fine RL, Jirtle RL, et al. Transforminggrowth factor-beta receptors and mannose 6-phosphate/insulin-like growthfactor-II receptor expression in human hepatocellular carcinoma. Ann Surg.1995;222:171–8.
39. De Souza AT, Hankins GR, Washington MK, Orton TC, Jirtle RL. M6P/IGF2Rgene is mutated in human hepatocellular carcinomas with loss ofheterozygosity. Nat Genet. 1995;11:447–9.
40. Singer CF, Mogg M, Koestler W, Pacher M, Marton E, Kubista E, et al. Insulin-like growth factor (IGF)-I and IGF-II serum concentrations in patients withbenign and malignant breast lesions: free IGF-II is correlated with breastcancer size. Clin Cancer Res. 2004;10:4003–9.
41. Espelund U, Cold S, Frystyk J, Orskov H, Flyvbjerg A. Elevated free IGF2levels in localized, early-stage breast cancer in women. Eur J Endocrinol.2008;159:595–601.
42. Jones JI, Clemmons DR. Insulin-like growth factors and their bindingproteins: biological actions. Endocr Rev. 1995;16:3–34.
43. Torng PL, Lee YC, Huang CY, Ye JH, Lin YS, Chu YW, et al. Insulin-like growthfactor binding protein-3 (IGFBP-3) acts as an invasion-metastasis suppressorin ovarian endometrioid carcinoma. Oncogene. 2008;27:2137–47.
44. Kaulsay KK, Ng EH, Ji CY, Ho GH, Aw TC, Lee KO. Serum IGF-binding protein-6and prostate specific antigen in breast cancer. Eur J Endocrinol. 1999;140:164–8.
45. Chard T. Insulin-like growth factors and their binding proteins in normaland abnormal human fetal growth. Growth Regul. 1994;4:91–100.
46. Pannier EM, Irwin JC, Giudice LC. Insulin-like growth factor-binding proteinsin the human fetus: tissue-specific protein secretion, immunologiccharacterization, and gene expression. Am J Obstet Gynecol. 1994;171:746–52.
47. Martina NA, Kim E, Chitkara U, Wathen NC, Chard T, Giudice LC. Gestationalage-dependent expression of insulin-like growth factor-binding protein-1(IGFBP-1) phosphoisoforms in human extraembryonic cavities, maternalserum, and decidua suggests decidua as the primary source of IGFBP-1 inthese fluids during early pregnancy. J Clin Endocrinol Metab. 1997;82:1894–8.
48. Byrd JC, MacDonald RG. Mechanisms for high affinity mannose 6-phosphateligand binding to the insulin-like growth factor II/mannose 6-phosphatereceptor. J Biol Chem. 2000;275:18638–46.
49. Buckley DA, Loughran G, Murphy G, Fennelly C, O’Connor R. Identification ofan IGF-1R kinase regulatory phosphatase using the fission yeastSchizosaccharomyces pombe and a GFP tagged IGF-1R in mammalian cells.Mol Pathol. 2002;55:46–54.
50. Fan G, Lin G, Lucito R, Tonks NK. Protein-tyrosine phosphatase 1Bantagonized signaling by insulin-like growth factor-1 receptor and kinaseBRK/PTK6 in ovarian cancer cells. J Biol Chem. 2013;288:24923–34.
51. Perets R, Drapkin R. It’s totally tubular…riding the New wave of ovariancancer research. Cancer Res. 2015.
52. Elkin SR, Bendris N, Reis CR, Zhou Y, Xie Y, Huffman KE, et al. A systematicanalysis reveals heterogeneous changes in the endocytic activities of cancercells. Cancer Res. 2015;75:4640–50.
53. Firth SM, Baxter RC. Cellular actions of the insulin-like growth factor bindingproteins. Endocr Rev. 2002;23:824–54.
54. Oshima A, Nolan CM, Kyle JW, Grubb JH, Sly WS. The human cation-independent mannose 6-phosphate receptor. Cloning and sequence of thefull-length cDNA and expression of functional receptor in COS cells. J BiolChem. 1988;263:2553–62.
• We accept pre-submission inquiries
• Our selector tool helps you to find the most relevant journal
• We provide round the clock customer support
• Convenient online submission
• Thorough peer review
• Inclusion in PubMed and all major indexing services
• Maximum visibility for your research
Submit your manuscript atwww.biomedcentral.com/submit
Submit your next manuscript to BioMed Central and we will help you at every step:
Tian et al. BMC Systems Biology (2016) 10:15 Page 11 of 11