Quantifying Visual Preferences Around the Worldkgajos/papers/2014/reinecke14visual.pdf ·...
10
Quantifying Visual Preferences Around the World Katharina Reinecke University of Michigan Ann Arbor, MI 48109 [email protected] Krzysztof Z. Gajos Harvard University 33 Oxford St., Cambridge, MA [email protected] ABSTRACT Website aesthetics have been recognized as an influential moderator of people’s behavior and perception. However, what users perceive as “good design” is subject to individ- ual preferences, questioning the feasibility of universal de- sign guidelines. To better understand how people’s visual preferences differ, we collected 2.4 million ratings of the visual appeal of websites from nearly 40 thousand partici- pants of diverse backgrounds. We address several gaps in the knowledge about design preferences of previously understud- ied groups. Among other findings, our results show that the level of colorfulness and visual complexity at which visual appeal is highest strongly varies: Females, for example, liked colorful websites more than males. A high education level generally lowers this preference for colorfulness. Russians preferred a lower visual complexity, and Macedonians liked highly colorful designs more than any other country in our dataset. We contribute a computational model and estimates of peak appeal that can be used to support rapid evaluations of website design prototypes for specific target groups. Author Keywords Website Aesthetics; Colorfulness; Complexity; Modeling; Adaptation; Personalization ACM Classification Keywords H.5.m. Information Interfaces and Presentation (e.g. HCI): User Interfaces INTRODUCTION While the field of human-computer interaction has tradition- ally been mostly concerned with functionality and usability, aesthetics are increasingly regarded as an additional dimen- sion that “augments other aspects of the design and the overall interactive experience" [27, p. 4]. Aesthetics have been rec- ognized as important because of their positive influence on people’s behavior, such as on performance under conditions of poor usability [18], or on purchase intentions [4]. Even before elaborate considerations about purchases can possibly take place, the first impression of appeal determines how we Permission to make digital or hard copies of all or part of this work for personal or classroom use is granted without fee provided that copies are not made or distributed for profit or commercial advantage and that copies bear this notice and the full cita- tion on the first page. Copyrights for components of this work owned by others than ACM must be honored. Abstracting with credit is permitted. To copy otherwise, or re- publish, to post on servers or to redistribute to lists, requires prior specific permission and/or a fee. Request permissions from [email protected]. CHI’14, April 26–May 1, 2014, Toronto, Canada. Copyright c 2014 ACM ISBN/14/04...$15.00. http://dx.doi.org/10.1145/2556288.2557052 perceive other attributes of a product, such as its usability and trustworthiness [15, 14]. With these potentially long-lasting consequences of people’s first impressions in mind, it would be desirable to specify what constitutes “good design". However, it has been argued that universal design guidelines are useful only to a certain ex- tent, because aesthetic impressions vary substantially across individuals [16, 15]. What someone finds appealing seems to depend on individual and demographic differences, such as personality, gender, or age [20, 6, 24, 12]. To maximize web- site appeal for a given user, it would therefore be best to offer designs personalized to their individual visual preferences. In this paper, we address one of the main challenges for achieving such personalized website designs: Knowing what a user likes. Our goal is to establish a better understanding of how people’s individual visual preferences differ and how we can best predict them. To achieve this goal, we conducted an online study on our ex- perimental platform LabintheWild.org and collected approx- imately 2.4 million subjective ratings of visual appeal from almost 40 thousand participants of diverse backgrounds ap- plied to a set of 430 websites. Building on the work of [25], we used a set of computational image metrics and percep- tual models to estimate each website’s colorfulness and vi- sual complexity. We then used the collected subjective rat- ings to characterize how colorfulness and visual complex- ity impact subjective perceptions of visual appeal based on age, gender, geography, and education. For each subgroup, we additionally calculated the most highly preferred levels of colorfulness and visual complexity. The analyses of the differences in the estimates of peak appeal demonstrate that there are substantial differences in people’s first impressions of aesthetics, and that geographic location, age, gender, and education level all play a significant role in determining their preferences. Measuring the differences between these peaks of appeal for various subgroups, we found, for example, that females like websites with highly saturated colors more than males. Education level negatively correlates with preferences for colorful and complex sites. Finland and Russia are among the countries whose members are most negatively affected by a high visual complexity, and Macedonians prefer the most colorful websites of all countries in our dataset. We make three main contributions: (1) We identify several demographic factors that impact peo- ple’s visual preferences, and characterize how they influence appeal by pointing out several between-group differences in
Transcript of Quantifying Visual Preferences Around the Worldkgajos/papers/2014/reinecke14visual.pdf ·...

Quantifying Visual Preferences Around the WorldKatharina Reinecke
University of MichiganAnn Arbor, MI [email protected]
Krzysztof Z. GajosHarvard University
33 Oxford St., Cambridge, [email protected]
ABSTRACTWebsite aesthetics have been recognized as an influentialmoderator of people’s behavior and perception. However,what users perceive as “good design” is subject to individ-ual preferences, questioning the feasibility of universal de-sign guidelines. To better understand how people’s visualpreferences differ, we collected 2.4 million ratings of thevisual appeal of websites from nearly 40 thousand partici-pants of diverse backgrounds. We address several gaps in theknowledge about design preferences of previously understud-ied groups. Among other findings, our results show that thelevel of colorfulness and visual complexity at which visualappeal is highest strongly varies: Females, for example, likedcolorful websites more than males. A high education levelgenerally lowers this preference for colorfulness. Russianspreferred a lower visual complexity, and Macedonians likedhighly colorful designs more than any other country in ourdataset. We contribute a computational model and estimatesof peak appeal that can be used to support rapid evaluationsof website design prototypes for specific target groups.
Author KeywordsWebsite Aesthetics; Colorfulness; Complexity; Modeling;Adaptation; Personalization
ACM Classification KeywordsH.5.m. Information Interfaces and Presentation (e.g. HCI):User Interfaces
INTRODUCTIONWhile the field of human-computer interaction has tradition-ally been mostly concerned with functionality and usability,aesthetics are increasingly regarded as an additional dimen-sion that “augments other aspects of the design and the overallinteractive experience" [27, p. 4]. Aesthetics have been rec-ognized as important because of their positive influence onpeople’s behavior, such as on performance under conditionsof poor usability [18], or on purchase intentions [4]. Evenbefore elaborate considerations about purchases can possiblytake place, the first impression of appeal determines how we
Permission to make digital or hard copies of all or part of this work for personal orclassroom use is granted without fee provided that copies are not made or distributedfor profit or commercial advantage and that copies bear this notice and the full cita-tion on the first page. Copyrights for components of this work owned by others thanACM must be honored. Abstracting with credit is permitted. To copy otherwise, or re-publish, to post on servers or to redistribute to lists, requires prior specific permissionand/or a fee. Request permissions from [email protected]’14, April 26–May 1, 2014, Toronto, Canada.Copyright c© 2014 ACM ISBN/14/04...$15.00.http://dx.doi.org/10.1145/2556288.2557052
perceive other attributes of a product, such as its usability andtrustworthiness [15, 14].
With these potentially long-lasting consequences of people’sfirst impressions in mind, it would be desirable to specifywhat constitutes “good design". However, it has been arguedthat universal design guidelines are useful only to a certain ex-tent, because aesthetic impressions vary substantially acrossindividuals [16, 15]. What someone finds appealing seems todepend on individual and demographic differences, such aspersonality, gender, or age [20, 6, 24, 12]. To maximize web-site appeal for a given user, it would therefore be best to offerdesigns personalized to their individual visual preferences.
In this paper, we address one of the main challenges forachieving such personalized website designs: Knowing whata user likes. Our goal is to establish a better understanding ofhow people’s individual visual preferences differ and how wecan best predict them.
To achieve this goal, we conducted an online study on our ex-perimental platform LabintheWild.org and collected approx-imately 2.4 million subjective ratings of visual appeal fromalmost 40 thousand participants of diverse backgrounds ap-plied to a set of 430 websites. Building on the work of [25],we used a set of computational image metrics and percep-tual models to estimate each website’s colorfulness and vi-sual complexity. We then used the collected subjective rat-ings to characterize how colorfulness and visual complex-ity impact subjective perceptions of visual appeal based onage, gender, geography, and education. For each subgroup,we additionally calculated the most highly preferred levelsof colorfulness and visual complexity. The analyses of thedifferences in the estimates of peak appeal demonstrate thatthere are substantial differences in people’s first impressionsof aesthetics, and that geographic location, age, gender, andeducation level all play a significant role in determining theirpreferences. Measuring the differences between these peaksof appeal for various subgroups, we found, for example, thatfemales like websites with highly saturated colors more thanmales. Education level negatively correlates with preferencesfor colorful and complex sites. Finland and Russia are amongthe countries whose members are most negatively affected bya high visual complexity, and Macedonians prefer the mostcolorful websites of all countries in our dataset.
We make three main contributions:
(1) We identify several demographic factors that impact peo-ple’s visual preferences, and characterize how they influenceappeal by pointing out several between-group differences in
visual preferences. This analysis is the first to report on alargely heterogeneous sample in terms of age, occupation, ed-ucation, geographic location, and web experience, contribut-ing new knowledge about previously understudied groups.
(2) We developed a computational model that combines auser’s demographic information with computational imagemetrics for assessing a website’s colorfulness and complexityin order to predict a user’s subjective perception of visual ap-peal. Our model improves upon a recently proposed universalmodel [25], which did not enable predictions for specific de-mographic groups due to a relatively small sample (242 par-ticipants). With this larger sample, we provide estimates ofthe level of colorfulness and visual complexity at which ap-peal peaks for specific demographic groups. The model andpeak estimates can support rapid evaluations of the suitabilityof website design prototypes for certain target groups.
(3) We contribute the first public dataset on visual appeal in-cluding the preference ratings of almost 40,000 participantsfor 430 website screenshots and self-reported demographicbackground information.
In the following two sections, we describe related work onaesthetics and the computational image metrics on which webase our analyses. The second half of the paper then de-scribes our data collection method, experiment design, andanalyses. We present our model results, highlight severalbetween-group differences in people’s visual preferences, andpoint out website designs that were found to appeal to certainsubgroups. The paper concludes with a discussion, future re-search, and directions for how to access the dataset.
RELATED WORKMost previous aesthetics-related research in HCI has focusedon finding universal design guidelines. In an effort to ob-jectively measure aesthetics, Zheng et al. [31] excluded par-ticipants’ ratings for website screenshots seen for 150ms ifthey were more than 2 standard deviations away from themean ratings of their 22 participants. Other work attempt-ing to quantify aesthetics assumed that websites that receiveda Webby Award (selected by expert judges) must constitutegood website design [13].
Contrasting the idea of universal designs, research has re-peatedly found large individual differences in aesthetic judge-ments [16, 15, 14]. These variabilities have been partiallyattributed to people’s sensitivity for aesthetics [11], and todifferences in demographic backgrounds [28]. In a first at-tempt to automatically predict users’ aesthetic preferences,Reinecke et al. [25] introduced a model of website aestheticsbased on a number of image metrics. While they found thatseveral demographic variables impacted appeal, a relativelysmall sample size of 242 participants prevented more in-depthanalyses of differences in people’s aesthetic taste. Difficul-ties in recruiting larger and more diverse samples might alsobe the reason why most other work in this direction has fo-cused on only one demographic difference at a time. Tuch etal. [29], for example, showed that males and females differ intheir aesthetic reaction towards asymmetrical websites whilereporting on a relatively homogeneous sample of 60 under-graduate psychology students in Switzerland. In a study with
UK university students, Moss and Gunn [20] further foundthat female participants preferred websites designed by fe-males over those designed by males, and vice versa for males.In addition, Hsiu-Feng [12] observed gender differences inTaiwanese children between 12 and 14 years of age. Girlspreferred a low to medium visual complexity in websites,whereas boys preferred medium to highly complex sites. In-vestigating the influence of education level, Chen et al. [5]found that website aesthetics differ between students in theirfirst and those in their final year. Furthermore, several re-searchers have investigated whether cultural background de-termines preferences (see, e.g., [1, 7, 6, 24]).
These previous studies suggest that gender, geographical lo-cation, and education level might play a role in people’s aes-thetic preferences. However, none of the studies on websiteaesthetics have compared several age groups, a variety of dif-ferent education levels, the impact of Internet usage, a largenumber of countries, or whether differences in preferencesbetween genders also hold across different age groups. Anadditional shortcoming of previous studies is that they are dif-ficult to compare: First, their relatively small sample sizesinhibit broader findings, such as how demographic factorsinteract with each other. In addition, low numbers of stim-uli hinder generalizability, or reproducibility of findings withother populations and/or stimuli. This work therefore extendsprior work with an analysis of a larger and more diverse sam-ple and set of website stimuli. We also contribute a compu-tational model of website aesthetics that is based on a set ofimage metrics described next.
QUANTIFYING APPEALWhile a method to quantify website appeal in all its facetshas yet to be developed, researchers have focused on two ofthe most prominent website characteristics: colorfulness andvisual complexity. The choice of colors has been shown toaffect a website’s perceived trustworthiness and users’ loy-alty [18, 6, 14]. The composition, number, and choice ofcolors (i.e., the overall colorfulness of a website) influencesappeal [25]. Visual complexity, however, is often thought tobe the greater predictor of appeal [17, 31, 30]. Sometimes de-scribed with the negatively connoted term “clutter" [26], re-cent research shows it does indeed negatively relate to appeal[30]. In contrast, Berlyne’s influential theory on visual com-plexity [3] suggests an inverted U-shape relationship, wheremoderately complex stimuli are found most appealing.
By computing low-level image statistics for website screen-shots, Zheng and colleagues [31] demonstrated that it is pos-sible to approximate participants’ perception of complex-ity. Reinecke and colleagues [25] extended Zheng et al’s setof image metrics and evaluated how this larger set predictspeople’s perceived colorfulness and complexity of websites.With ratings from several hundreds of participants, they de-veloped two computational models of perceived colorfulnessand complexity of websites.
Here we employ Reinecke et al.’s perceptual models to as-sess each website’s colorfulness and complexity. Their col-orfulness model was based on a computation of the averagesaturation of colors across all pixels of a website screenshot,
a calculation of colorfulness following [10], the number ofimage areas, the number of leaves resulting from a quadtreedecomposition algorithm (enabling an analyses of the spatialdistribution of colors), the number of areas identified to con-tain text or other objects as per a space-based decompositionof the webpage, as well as the percentage of pixels containingone of seven colors. The visual complexity model includedthe number of areas containing text or other objects, the num-ber of leaves resulting from a space-based decomposition, thenumber of text groups (e.g., a paragraph), the number of im-ages, a computation of colorfulness based on the average sat-uration, and hue.
The procedure to compute these image metrics is describedin [31] and [25]. The set of algorithms takes a 1024x768sized website screenshot as input and outputs the values foreach image metric. As a sanity test, after applying thesemetrics to our 430 website stimuli, we ranked a randomselection of website screenshots according to each of thesevalues separately in order to visually evaluate the correctnessof the image metrics and the two perceptual models. Whilethe model-generated ordering of websites according to thecolorfulness and complexity models was reasonable andperceptually intuitive, the values computed for symmetryand balance (following Zheng et al.’s description in [31]) didnot correspond to our perceptual judgments. These spatialmetrics were therefore left out in our analysis.
EXPERIMENTWe designed this experiment with two main goals in mind:First, to compare participants’ first impressions of websiteaesthetics across a variety of demographic backgrounds, andsecond, to develop predictive models that would account fordemographic differences in the perception of visual appeal.
MethodMaterialsOur stimuli consisted of a set of 430 website screenshots di-vided into 350 English language websites, 60 foreign web-sites (using a different writing system), and 20 websites thathad been nominated for the Webby Awards in recent years.Websites were selected to not have received wide public ex-posure, to represent a large variety of genres, and to include arange of colorfulness and visual complexity levels.
ProcedureThe study was designed as a 10-minute online test andlaunched on our experimental platform LabintheWild.org toachieve the diversity (in terms of geographic location, age,education, socio-economic status, and web experience) that isneeded to study aesthetic preferences for websites across di-verse demographic groups. Participants did not receive mone-tary compensation, but were instead incentivized with a com-parison of their visual preference results to others. Followingthe experimental procedure in [14] and [25], participants wereasked to rate screenshots of websites on perceived visual ap-peal on a scale from 1 to 9. Screenshots were displayed for500ms to capture participants’ first impression of the web-sites’ aesthetics and minimize the influence of their content.All stimuli were downsized from their original 1024x768
screenshot size to 600 pixels in width, and presented on awhite background.
After giving their informed consent, participants were askedto fill out a demographics questionnaire. They then receivedinstructions about the experiment, and were able to test thisby rating a fixed practice set of five website screenshots(shown in random order). We used the same five websitesto anchor all participants’ ratings. The ratings from this testphase were not included in the analysis. As a next step, par-ticipants rated a stratified random sample of 30 websites (22in English language, 4 foreign, and 4 Webby Award websites)presented in random order and drawn from the larger pool of430 websites. The second evaluation phase presented partic-ipants with the same 30 websites (again presented in randomorder) to control for consistency in participants’ ratings. In-structions were presented in English.
ParticipantsWe report on data collected between June 2012 and Au-gust 2013. During this time, 39,975 volunteers (54% fe-male) from 179 countries completed the experiment onLabintheWild.org. Forty percent had lived in another coun-try for at least 6 months, and/or had parents of a differentnationality. Participants were between 12 and 91 years old(mean = 32.4, sd=12.8 years) and 41% had at least some col-lege education. We additionally collected information aboutcountries of residency in the order from birth to present, theduration spent in each country, native and learned languages,as well as fluency levels, current residency in an urban, sub-urban, or rural setting, education level, web usage (number ofhours per day), and profession.
Data Preparation and AnalysesParticipants who reported that they did not have normal orcorrected-to-normal vision or that they had previously partic-ipated in the study were excluded from the analysis. We alsoomitted participants who did not fill in the demographics, orwho reported countries for their own or their parents back-grounds that suggested random picking from the top of the list(e.g., Antarctica, or combinations such as Angola, Antilles,Aruba), as well as participants whose sum of years spent indifferent countries was hugely different from their age. Fi-nally, we omitted the data of participants under 12 years ofage and over 91, where our sample size significantly dropped.
We then analyzed the consistency in participants’ ratingsacross phase 1 and 2 of the experiment, and omitted 47,510rating pairs (4.9% of all observations) that differed by morethan 2 points on the 9-point Likert scale. The resulting stan-dard deviation of the difference between participants’ ratingsin phase 1 and 2 is 0.7, indicating that their ratings are reli-able and representative of their preferences. The cleaned dataincludes 1,542,166 observations (771,083 paired ratings from32,222 participants).
In the analyses of country influences, we additionally omittedculturally ambiguous participants who had lived in multiplecountries in their lives (at least six months in another country)or whose parents were of a different nationality. We furtherexcluded all countries with fewer than 1000 paired ratings.
For these analyses, the dataset consists of 441,478 paired rat-ings and 43 countries (from 18,448 participants). The major-ity of participants in this data set were from the US (43%),followed by the UK (17%), Hungary (6%), Canada (5%), andRomania (3%, all others 6 3%) When referring to average vi-sual appeal scores, we therefore report the marginal means af-ter having controlled for gender, education, country, and ageto account for differences in the distribution of demographics.
To analyze the impact of demographic variables on aestheticpreferences for websites, we fitted a series of linear mixed-effects models representing the hierarchical structure of ourdata. All models were constructed using R and the pack-age lme4 [2]. First, a null model (intercept/empty) containingonly Website ID and Participant ID as random factors was fit-ted. We then fit a model adding colorfulness and visual com-plexity as fixed factors. Both of these website characteristicswere computed based on the models presented in [25], withscores ranging from 1 to 9 for colorfulness and 1 to 10 forvisual complexity. Colorfulness and visual complexity wereincluded with their linear and quadratic terms. Finally, wefitted a full model, which additionally included demographicvariables (selected if previous literature provided a basis forinclusion). Demographic variables were modeled as interac-tion terms with both colorfulness and visual complexity.
After this initial model construction, we repeated the re-gression excluding variables that were statistically non-significant. Demographic variables were included or omit-ted based on Akaike’s Information Criteria (AIC), which pro-vides an estimate of the relative fit of alternative models. Ac-cording to this procedure, age, gender, country, and educationsignificantly improved the model fit; all other demographicvariables were excluded from the model.
To quantify the absolute model fit and obtain informationabout the variance explained by the model, we calculated themarginal R2 (the variance explained by fixed factors), as wellas the conditional R2 (the variance explained by fixed and ran-dom factors combined) following a newly developed proce-dure [21]. The difference between conditional and marginalR2s explain how much variability is in the random effectsWebsite ID and Participant ID. When referring to the regres-sion results, we report on the F statistics from the Analysisof Variance table. The full list of model parameters and re-gression coefficients, as well as detailed information on howvariables were coded and entered into the regression can beaccessed at http://iis.seas.harvard.edu/resources/.
Finally, to estimate the mean values and standard errorsof peak appeal (e.g., the complexity or colorfulness lev-els at which appeal ratings were the highest), we used abootstrap procedure that has previously been identified as avalid approach to compute peak estimates [9]. The proce-dure randomly resampled the data 1000 times (with replace-ment). The resampling was done on a per-website basis. Foreach bootstrap iteration, we fit a Lowess (locally weightedscatterplot smoothing) curve with the smoothing parameterα = .25. For each bootstrap sample we computed thecomplexity/colorfulness score for which the Lowess functionpeaked. The mean of these estimates is the bootstrap estimate
of the optimal colorfulness/complexity (the peak appeal, cf.Figure 1). The standard deviation of those samples is the es-timate of the standard error of the estimate of the mean.
We additionally calculated Cohen’s d as a measure of ef-fect size for the comparisons between pairs of means, suchas to compute the standardized mean difference betweenmean appeal at low and high complexity, or the differencebetween mean appeal at low complexity and the peak, asexemplified in Figure 1. Low/high complexity/colorfulnesswebsites are the 5% of sites with the lowest/highest com-plexity/colorfulness scores. Peak websites are 0.5 complex-ity/colorfulness scores lower/higher than the score of peakappeal. While we intermittently refer to these values whereneeded, the complete list of Cohen’s d values can be accessedat http://iis.seas.harvard.edu/resources/.
General ResultsA comparison of our null model with the full model using thelikelihood ratio test showed that the full model fits the datasignificantly better (χ2
(294) = 7510.9, p < .0001). In addition,comparing the model without demographics (using only col-orfulness and visual complexity as fixed effects and partici-pant ID and website ID as random factors) to our full modelshowed that age, gender, geographic location, and educationlevel significantly improve the model fit (χ2
(290) = 7408.7,p < .0001). In other words, demographic variables play asignificant role in supporting the prediction of visual appeal.Visual inspection of residual plots showed that the data meetsthe assumptions of homoscedasticity and normality.
Our final model explains 47% of the variance in people’s firstimpressions of appeal based on a website’s visual complexityand colorfulness (conditional R2 = .47, marginal R2 = .07,see also http://iis.seas.harvard.edu/resources/ for details onthe model). The result is comparable to that of Reinecke etal. [25] despite the fact that we worked with a much moreheterogeneous sample.1
In the following, we first report on preferences for visualcomplexity and colorfulness in general before showing howthese results are influenced by demographic factors.
General Results for Visual ComplexityOur results show that the perceived visual complexity ofwebsites is a strong predictor of appeal (F(1) = 23.96,p < .001), which confirms previous findings about the role ofvisual complexity on users’ first impressions (e.g., [19, 30]).In line with the results of [25], visual complexity plays a moreimportant role as a predictor of appeal than colorfulness.
As suggested by Berlyne [3] and consistent with some of theprevious studies (e.g., [8, 25]), the relationship between vi-sual appeal and complexity in our data is best described by
1Note that our R2 cannot be directly compared to Reinecke et al.’sadj. R2 of .48 [25], because unlike most previous calculations thatuse the maximum likelihood estimates of the model parameters,Nakagawa et al.’s new method for calculating R2 [21] does not dis-regard the uncertainties around these estimates.
complexity-smoothed-All: Graph Builder Page 1 of 2
Mean(mean_response)Mean(mean_response) vs. Mean(complexitymodel)
Mean(complexitymodel)1 2 3 4 5 6 7 8 9 10
Mean(mean_response)
1
2
3
4
5
6
7
Graph Builder
(a)
(b)
(c)
(d) (e)
(f)
(h)
(g)
visu
al a
ppea
l
visual complexity
complexity-smoothed-All: Graph Builder Page 1 of 2
Mean(mean_response)Mean(mean_response) vs. Mean(complexitymodel)
Mean(complexitymodel)1 2 3 4 5 6 7 8 9 10
Mean(mean_response)
1
2
3
4
5
6
7
Graph Builder
Coh
en’s d
= 1.
4
peak appeal
Coh
en’s
d =
0.4
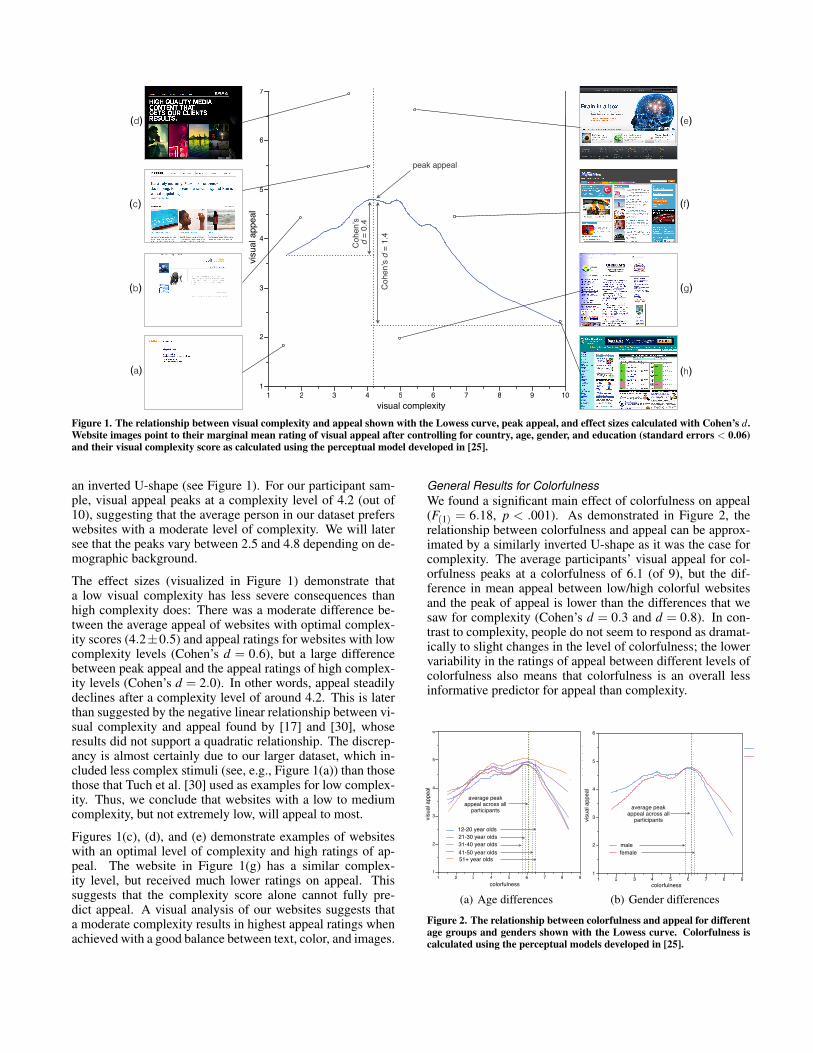
Figure 1. The relationship between visual complexity and appeal shown with the Lowess curve, peak appeal, and effect sizes calculated with Cohen’s d.Website images point to their marginal mean rating of visual appeal after controlling for country, age, gender, and education (standard errors < 0.06)and their visual complexity score as calculated using the perceptual model developed in [25].
an inverted U-shape (see Figure 1). For our participant sam-ple, visual appeal peaks at a complexity level of 4.2 (out of10), suggesting that the average person in our dataset preferswebsites with a moderate level of complexity. We will latersee that the peaks vary between 2.5 and 4.8 depending on de-mographic background.
The effect sizes (visualized in Figure 1) demonstrate thata low visual complexity has less severe consequences thanhigh complexity does: There was a moderate difference be-tween the average appeal of websites with optimal complex-ity scores (4.2±0.5) and appeal ratings for websites with lowcomplexity levels (Cohen’s d = 0.6), but a large differencebetween peak appeal and the appeal ratings of high complex-ity levels (Cohen’s d = 2.0). In other words, appeal steadilydeclines after a complexity level of around 4.2. This is laterthan suggested by the negative linear relationship between vi-sual complexity and appeal found by [17] and [30], whoseresults did not support a quadratic relationship. The discrep-ancy is almost certainly due to our larger dataset, which in-cluded less complex stimuli (see, e.g., Figure 1(a)) than thosethose that Tuch et al. [30] used as examples for low complex-ity. Thus, we conclude that websites with a low to mediumcomplexity, but not extremely low, will appeal to most.
Figures 1(c), (d), and (e) demonstrate examples of websiteswith an optimal level of complexity and high ratings of ap-peal. The website in Figure 1(g) has a similar complex-ity level, but received much lower ratings on appeal. Thissuggests that the complexity score alone cannot fully pre-dict appeal. A visual analysis of our websites suggests thata moderate complexity results in highest appeal ratings whenachieved with a good balance between text, color, and images.
General Results for ColorfulnessWe found a significant main effect of colorfulness on appeal(F(1) = 6.18, p < .001). As demonstrated in Figure 2, therelationship between colorfulness and appeal can be approx-imated by a similarly inverted U-shape as it was the case forcomplexity. The average participants’ visual appeal for col-orfulness peaks at a colorfulness of 6.1 (of 9), but the dif-ference in mean appeal between low/high colorful websitesand the peak of appeal is lower than the differences that wesaw for complexity (Cohen’s d = 0.3 and d = 0.8). In con-trast to complexity, people do not seem to respond as dramat-ically to slight changes in the level of colorfulness; the lowervariability in the ratings of appeal between different levels ofcolorfulness also means that colorfulness is an overall lessinformative predictor for appeal than complexity.!colorfulness-smoothed-Age.jmp: Graph Builder Page 1 of 2
Factorbootstrapping-byWebsite-Age1.csvbootstrapping-byWebsite-Age2.csvbootstrapping-byWebsite-Age3.csvbootstrapping-byWebsite-Age4.csvbootstrapping-byWebsite-Age5.csv
Mean(mean_response) vs. Mean(colorfulnessmodelnew)
Mean(colorfulnessmodelnew)1 2 3 4 5 6 7 8 9
Mean(mean_response)
1
2
3
4
5
6
Graph Builder
colorfulness
visu
al a
ppea
l
visu
al a
ppea
l
colorfulness
colorfulness-smoothed-Gender.jmp: Graph Builder Page 1 of 2
Factorbootstrapping-byWebsite-Gender0.csvbootstrapping-byWebsite-Gender1.csv
Mean(mean_response) vs. Mean(colorfulnessmodelnew)
Mean(colorfulnessmodelnew)1 2 3 4 5 6 7 8 9
Mean(mean_response)
1
2
3
4
5
6
Graph Buildercolorfulness-smoothed-Age.jmp: Graph Builder Page 1 of 2
Factorbootstrapping-byWebsite-Age1.csv
bootstrapping-byWebsite-Age2.csv
bootstrapping-byWebsite-Age3.csv
bootstrapping-byWebsite-Age4.csv
bootstrapping-byWebsite-Age5.csv
Mean(mean_response) vs. Mean(colorfulnessmodelnew)
Mean(colorfulnessmodelnew)1 2 3 4 5 6 7 8 9
Mean(mean_response)
1
2
3
4
5
6
Graph Builder
colorfulness-smoothed-Age.jmp: Graph Builder Page 1 of 2
Factorbootstrapping-byWebsite-Age1.csvbootstrapping-byWebsite-Age2.csvbootstrapping-byWebsite-Age3.csvbootstrapping-byWebsite-Age4.csvbootstrapping-byWebsite-Age5.csv
Mean(mean_response) vs. Mean(colorfulnessmodelnew)
Mean(colorfulnessmodelnew)1 2 3 4 5 6 7 8 9
Mean(mean_response)
1
2
3
4
5
6
Graph Builder
12-20 year olds21-30 year olds31-40 year olds41-50 year olds51+ year olds
average peak appeal across all
participants
colorfulness-smoothed-Gender.jmp: Graph Builder Page 1 of 2
Factorbootstrapping-byWebsite-Gender0.csv
bootstrapping-byWebsite-Gender1.csv
Mean(mean_response) vs. Mean(colorfulnessmodelnew)
Mean(colorfulnessmodelnew)1 2 3 4 5 6 7 8 9
Mean(mean_response)
1
2
3
4
5
6
Graph Builder
average peak appeal across all
participants
colorfulness-smoothed-Gender.jmp: Graph Builder Page 1 of 2
Factorbootstrapping-byWebsite-Gender0.csvbootstrapping-byWebsite-Gender1.csv
Mean(mean_response) vs. Mean(colorfulnessmodelnew)
Mean(colorfulnessmodelnew)1 2 3 4 5 6 7 8 9
Mean(mean_response)
1
2
3
4
5
6
Graph Builder
malefemale
(a) Age differences
!colorfulness-smoothed-Age.jmp: Graph Builder Page 1 of 2
Factorbootstrapping-byWebsite-Age1.csvbootstrapping-byWebsite-Age2.csvbootstrapping-byWebsite-Age3.csvbootstrapping-byWebsite-Age4.csvbootstrapping-byWebsite-Age5.csv
Mean(mean_response) vs. Mean(colorfulnessmodelnew)
Mean(colorfulnessmodelnew)1 2 3 4 5 6 7 8 9
Mean(mean_response)
1
2
3
4
5
6
Graph Builder
colorfulness
visu
al a
ppea
l
visu
al a
ppea
l
colorfulness
colorfulness-smoothed-Gender.jmp: Graph Builder Page 1 of 2
Factorbootstrapping-byWebsite-Gender0.csvbootstrapping-byWebsite-Gender1.csv
Mean(mean_response) vs. Mean(colorfulnessmodelnew)
Mean(colorfulnessmodelnew)1 2 3 4 5 6 7 8 9
Mean(mean_response)
1
2
3
4
5
6
Graph Buildercolorfulness-smoothed-Age.jmp: Graph Builder Page 1 of 2
Factorbootstrapping-byWebsite-Age1.csv
bootstrapping-byWebsite-Age2.csv
bootstrapping-byWebsite-Age3.csv
bootstrapping-byWebsite-Age4.csv
bootstrapping-byWebsite-Age5.csv
Mean(mean_response) vs. Mean(colorfulnessmodelnew)
Mean(colorfulnessmodelnew)1 2 3 4 5 6 7 8 9
Mean(mean_response)
1
2
3
4
5
6
Graph Builder
colorfulness-smoothed-Age.jmp: Graph Builder Page 1 of 2
Factorbootstrapping-byWebsite-Age1.csvbootstrapping-byWebsite-Age2.csvbootstrapping-byWebsite-Age3.csvbootstrapping-byWebsite-Age4.csvbootstrapping-byWebsite-Age5.csv
Mean(mean_response) vs. Mean(colorfulnessmodelnew)
Mean(colorfulnessmodelnew)1 2 3 4 5 6 7 8 9
Mean(mean_response)
1
2
3
4
5
6
Graph Builder
12-20 year olds21-30 year olds31-40 year olds41-50 year olds51+ year olds
average peak appeal across all
participants
colorfulness-smoothed-Gender.jmp: Graph Builder Page 1 of 2
Factorbootstrapping-byWebsite-Gender0.csv
bootstrapping-byWebsite-Gender1.csv
Mean(mean_response) vs. Mean(colorfulnessmodelnew)
Mean(colorfulnessmodelnew)1 2 3 4 5 6 7 8 9
Mean(mean_response)
1
2
3
4
5
6
Graph Builder
average peak appeal across all
participants
colorfulness-smoothed-Gender.jmp: Graph Builder Page 1 of 2
Factorbootstrapping-byWebsite-Gender0.csvbootstrapping-byWebsite-Gender1.csv
Mean(mean_response) vs. Mean(colorfulnessmodelnew)
Mean(colorfulnessmodelnew)1 2 3 4 5 6 7 8 9
Mean(mean_response)
1
2
3
4
5
6
Graph Builder
malefemale
(b) Gender differences
Figure 2. The relationship between colorfulness and appeal for differentage groups and genders shown with the Lowess curve. Colorfulness iscalculated using the perceptual models developed in [25].
Preferred by under-20s Preferred by over-51s
(a) under 20=7.2, over 51=5.4 (b) under 20=3.0, over 51=4.8
(c) under 20=7.1, over 51=5.7 (d) under 20=3.5, over 51=5.0
(e) under 20=5.6, over 51=4.1 (f) under 20=3.4, over 51=4.6
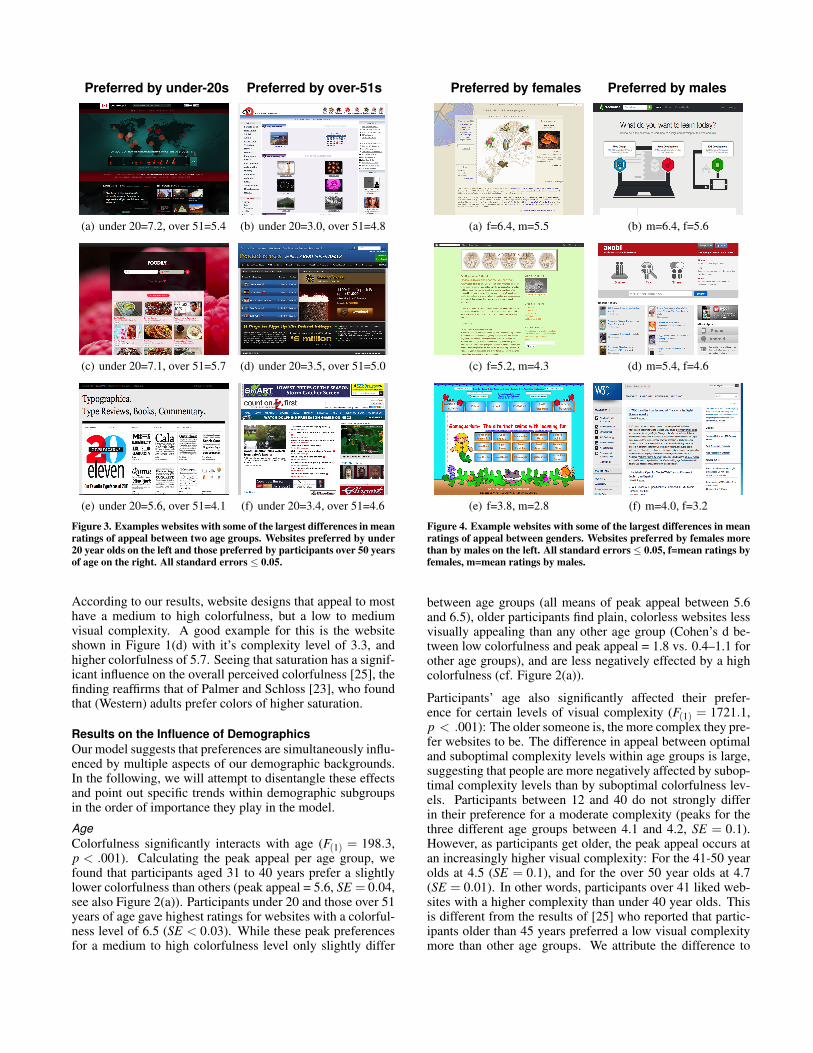
Figure 3. Examples websites with some of the largest differences in meanratings of appeal between two age groups. Websites preferred by under20 year olds on the left and those preferred by participants over 50 yearsof age on the right. All standard errors ≤ 0.05.
According to our results, website designs that appeal to mosthave a medium to high colorfulness, but a low to mediumvisual complexity. A good example for this is the websiteshown in Figure 1(d) with it’s complexity level of 3.3, andhigher colorfulness of 5.7. Seeing that saturation has a signif-icant influence on the overall perceived colorfulness [25], thefinding reaffirms that of Palmer and Schloss [23], who foundthat (Western) adults prefer colors of higher saturation.
Results on the Influence of DemographicsOur model suggests that preferences are simultaneously influ-enced by multiple aspects of our demographic backgrounds.In the following, we will attempt to disentangle these effectsand point out specific trends within demographic subgroupsin the order of importance they play in the model.
AgeColorfulness significantly interacts with age (F(1) = 198.3,p < .001). Calculating the peak appeal per age group, wefound that participants aged 31 to 40 years prefer a slightlylower colorfulness than others (peak appeal = 5.6, SE = 0.04,see also Figure 2(a)). Participants under 20 and those over 51years of age gave highest ratings for websites with a colorful-ness level of 6.5 (SE < 0.03). While these peak preferencesfor a medium to high colorfulness level only slightly differ
Preferred by females Preferred by males
(a) f=6.4, m=5.5 (b) m=6.4, f=5.6
(c) f=5.2, m=4.3 (d) m=5.4, f=4.6
(e) f=3.8, m=2.8 (f) m=4.0, f=3.2
Figure 4. Example websites with some of the largest differences in meanratings of appeal between genders. Websites preferred by females morethan by males on the left. All standard errors ≤ 0.05, f=mean ratings byfemales, m=mean ratings by males.
between age groups (all means of peak appeal between 5.6and 6.5), older participants find plain, colorless websites lessvisually appealing than any other age group (Cohen’s d be-tween low colorfulness and peak appeal = 1.8 vs. 0.4–1.1 forother age groups), and are less negatively effected by a highcolorfulness (cf. Figure 2(a)).
Participants’ age also significantly affected their prefer-ence for certain levels of visual complexity (F(1) = 1721.1,p < .001): The older someone is, the more complex they pre-fer websites to be. The difference in appeal between optimaland suboptimal complexity levels within age groups is large,suggesting that people are more negatively affected by subop-timal complexity levels than by suboptimal colorfulness lev-els. Participants between 12 and 40 do not strongly differin their preference for a moderate complexity (peaks for thethree different age groups between 4.1 and 4.2, SE = 0.1).However, as participants get older, the peak appeal occurs atan increasingly higher visual complexity: For the 41-50 yearolds at 4.5 (SE = 0.1), and for the over 50 year olds at 4.7(SE = 0.01). In other words, participants over 41 liked web-sites with a higher complexity than under 40 year olds. Thisis different from the results of [25] who reported that partic-ipants older than 45 years preferred a low visual complexitymore than other age groups. We attribute the difference to
our more heterogeneous, and, in particular, on average lesseducated sample.
Figure 3 visualizes the differences between age groups andtheir preferences with example websites from our dataset.Websites on the left were rated significantly higher by theyoungest age group, and websites on the right significantlyhigher by the oldest age group (differences in preference areall statistically significant at p < .001 when analyzed withindependent-sample t-tests and using marginal means con-trolling for country, education level, and gender). An obviousdifference is that websites preferred by under 20 year olds(on the left) make use of saturated colors and larger images.Those websites preferred by older participants are more text-heavy and complex, but use less saturated colors. The com-plexity model captures this difference by basing its scores onthe number of areas containing text or other objects, and onthe use of colors.
GenderThe effect of colorfulness on appeal is also moderated by gen-der (F(1) = 658.9, p < .001), such that females rate color-ful websites higher on visual appeal than males. Figure 2(b)shows the different colorfulness preferences between femalesand males. Appeal was estimated to peak at a colorfulnessvalue of 5.8 for males (SE = 0.04) and at 6.3 for females(SE = 0.03).
We also found a significant interaction between visual com-plexity and gender (F(1) = 17.8, p< .001), albeit not as strongas for colorfulness. In fact, visual appeal peaks at a similarcomplexity level of 4.2 for males (SE = 0.01) and 4.3 for fe-males (SE = 0.01). Where the variation is most pronouncedis in the acceptance of websites with a low visual complexity,which females dislike more than males.
Figure 4 shows how this difference between males’ and fe-males’ preferences manifests itself in some of the most con-troversial websites between genders. With a high colorfulnessscore of 8.4 and a complexity score of 4.4, the website in Fig-ure 4(e) is mostly disliked by our participants independent oftheir gender. Females, however, seem to be more acceptingof this design as shown by their average rating of 3.8 (ver-sus 2.8 by males). In contrast, Figure 4(f) shows a websitewith lower than ideal levels of colorfulness (score of 3.7).The average male likes such simpler look more than females(marginal mean ratings: males = 4.0, females = 3.2).
Anecdotally, what appears to differentiate male-preferredwebsites from those that females prefer is that male-preferredsites predominantly use saturated primary colors on gray orwhite background to contrast different regions or items onthe webpage. This can be seen in Figure 4(b), 4(d), and (lessso) 4(f), and is consistent with other male-preferred websitesin our dataset. Websites preferred by females use more ho-mogeneous color schemes and rarely employ stark contrastsbetween colors to structure content and differentiate elements(see Figure 4(a) and 4(c)).
What we did not expect is that some websites that are meantto appeal to both genders use such “gender-biased" designsand thereby lower the appeal for one of the genders. The web-
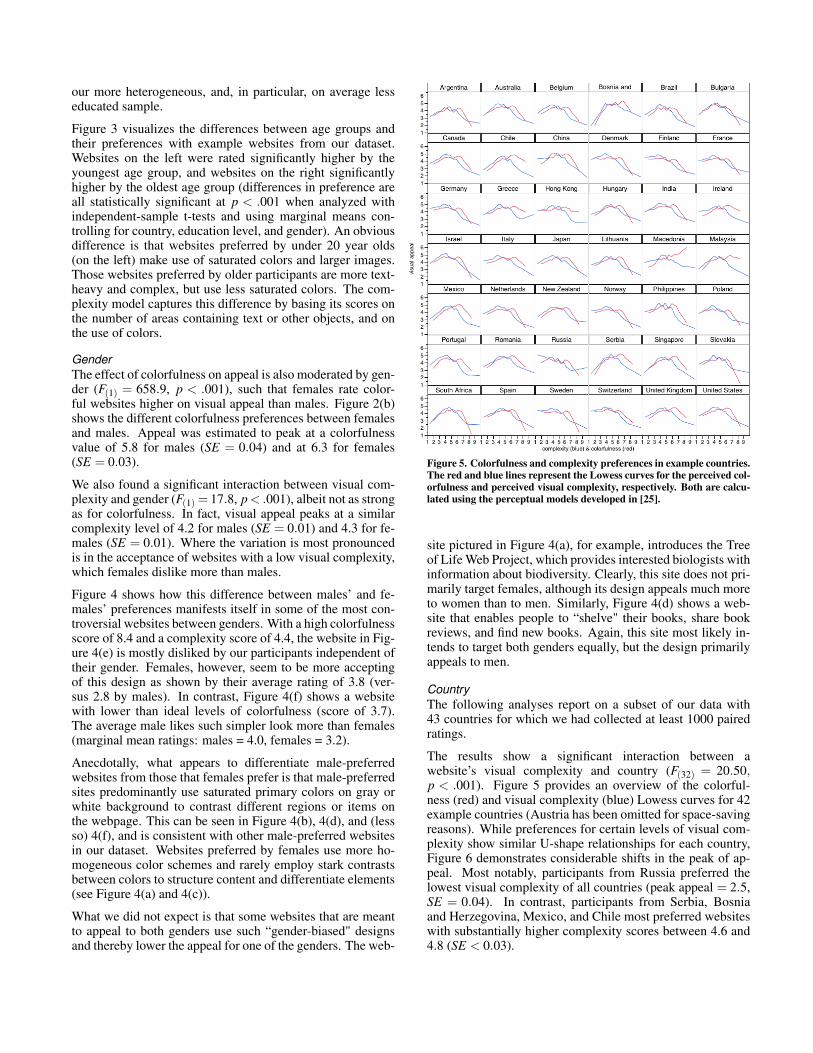
Figure 5. Colorfulness and complexity preferences in example countries.The red and blue lines represent the Lowess curves for the perceived col-orfulness and perceived visual complexity, respectively. Both are calcu-lated using the perceptual models developed in [25].
site pictured in Figure 4(a), for example, introduces the Treeof Life Web Project, which provides interested biologists withinformation about biodiversity. Clearly, this site does not pri-marily target females, although its design appeals much moreto women than to men. Similarly, Figure 4(d) shows a web-site that enables people to “shelve" their books, share bookreviews, and find new books. Again, this site most likely in-tends to target both genders equally, but the design primarilyappeals to men.
CountryThe following analyses report on a subset of our data with43 countries for which we had collected at least 1000 pairedratings.
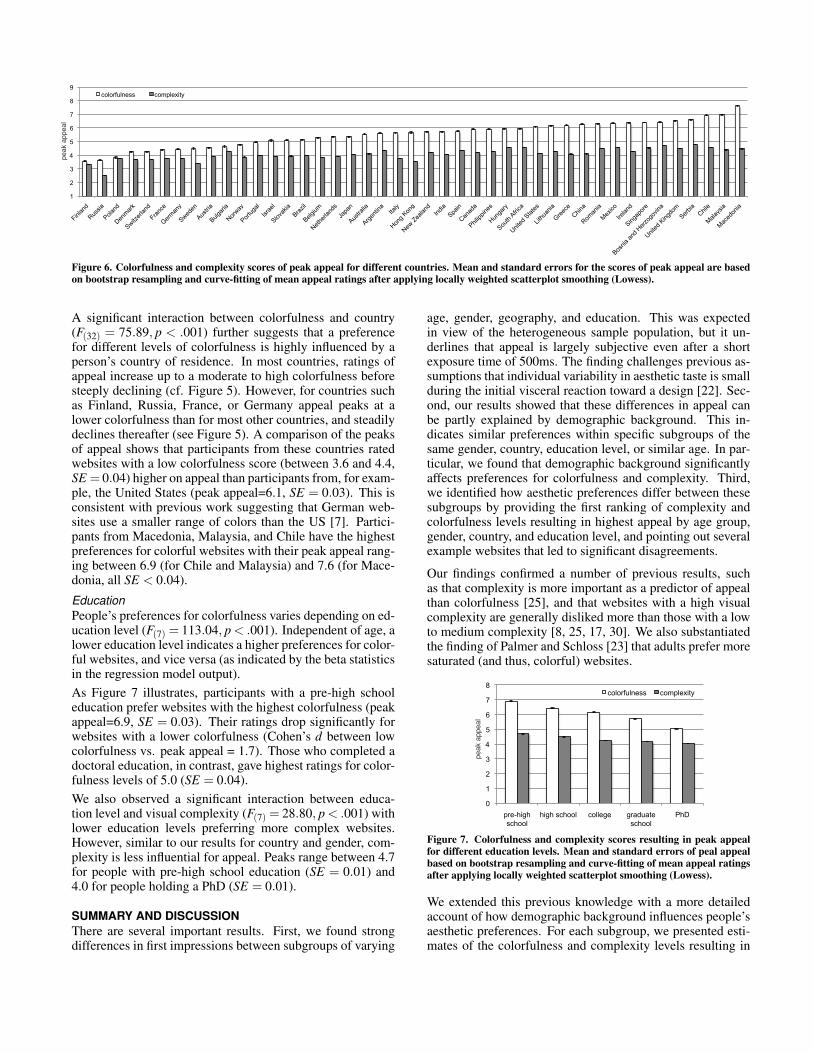
The results show a significant interaction between awebsite’s visual complexity and country (F(32) = 20.50,p < .001). Figure 5 provides an overview of the colorful-ness (red) and visual complexity (blue) Lowess curves for 42example countries (Austria has been omitted for space-savingreasons). While preferences for certain levels of visual com-plexity show similar U-shape relationships for each country,Figure 6 demonstrates considerable shifts in the peak of ap-peal. Most notably, participants from Russia preferred thelowest visual complexity of all countries (peak appeal = 2.5,SE = 0.04). In contrast, participants from Serbia, Bosniaand Herzegovina, Mexico, and Chile most preferred websiteswith substantially higher complexity scores between 4.6 and4.8 (SE < 0.03).
1
2
3
4
5
6
7
8
9
Finlan
d
Russia
Poland
Denmark
Switzerl
and
France
German
y
Sweden
Austria
Bulgari
a
Norway
Portug
al
Israe
l
Slovak
ia
Brazil
Belgium
Netherl
ands
Japa
n
Austra
lia
Argenti
na
Italy
Hong K
ong
New Zea
land
India
Spain
Canad
a
Philipp
ines
Hunga
ry
South
Africa
United
Stat
es
Lithu
ania
Greece
China
Roman
ia
Mexico
Irelan
d
Singap
ore
Bosnia
and H
erzog
ovina
United
King
dom
Serbia
Chile
Malays
ia
Maced
onia
colorfulness complexity
peak
app
eal
Figure 6. Colorfulness and complexity scores of peak appeal for different countries. Mean and standard errors for the scores of peak appeal are basedon bootstrap resampling and curve-fitting of mean appeal ratings after applying locally weighted scatterplot smoothing (Lowess).
A significant interaction between colorfulness and country(F(32) = 75.89, p < .001) further suggests that a preferencefor different levels of colorfulness is highly influenced by aperson’s country of residence. In most countries, ratings ofappeal increase up to a moderate to high colorfulness beforesteeply declining (cf. Figure 5). However, for countries suchas Finland, Russia, France, or Germany appeal peaks at alower colorfulness than for most other countries, and steadilydeclines thereafter (see Figure 5). A comparison of the peaksof appeal shows that participants from these countries ratedwebsites with a low colorfulness score (between 3.6 and 4.4,SE = 0.04) higher on appeal than participants from, for exam-ple, the United States (peak appeal=6.1, SE = 0.03). This isconsistent with previous work suggesting that German web-sites use a smaller range of colors than the US [7]. Partici-pants from Macedonia, Malaysia, and Chile have the highestpreferences for colorful websites with their peak appeal rang-ing between 6.9 (for Chile and Malaysia) and 7.6 (for Mace-donia, all SE < 0.04).
EducationPeople’s preferences for colorfulness varies depending on ed-ucation level (F(7) = 113.04, p < .001). Independent of age, alower education level indicates a higher preferences for color-ful websites, and vice versa (as indicated by the beta statisticsin the regression model output).As Figure 7 illustrates, participants with a pre-high schooleducation prefer websites with the highest colorfulness (peakappeal=6.9, SE = 0.03). Their ratings drop significantly forwebsites with a lower colorfulness (Cohen’s d between lowcolorfulness vs. peak appeal = 1.7). Those who completed adoctoral education, in contrast, gave highest ratings for color-fulness levels of 5.0 (SE = 0.04).We also observed a significant interaction between educa-tion level and visual complexity (F(7) = 28.80, p < .001) withlower education levels preferring more complex websites.However, similar to our results for country and gender, com-plexity is less influential for appeal. Peaks range between 4.7for people with pre-high school education (SE = 0.01) and4.0 for people holding a PhD (SE = 0.01).
SUMMARY AND DISCUSSIONThere are several important results. First, we found strongdifferences in first impressions between subgroups of varying
age, gender, geography, and education. This was expectedin view of the heterogeneous sample population, but it un-derlines that appeal is largely subjective even after a shortexposure time of 500ms. The finding challenges previous as-sumptions that individual variability in aesthetic taste is smallduring the initial visceral reaction toward a design [22]. Sec-ond, our results showed that these differences in appeal canbe partly explained by demographic background. This in-dicates similar preferences within specific subgroups of thesame gender, country, education level, or similar age. In par-ticular, we found that demographic background significantlyaffects preferences for colorfulness and complexity. Third,we identified how aesthetic preferences differ between thesesubgroups by providing the first ranking of complexity andcolorfulness levels resulting in highest appeal by age group,gender, country, and education level, and pointing out severalexample websites that led to significant disagreements.
Our findings confirmed a number of previous results, suchas that complexity is more important as a predictor of appealthan colorfulness [25], and that websites with a high visualcomplexity are generally disliked more than those with a lowto medium complexity [8, 25, 17, 30]. We also substantiatedthe finding of Palmer and Schloss [23] that adults prefer moresaturated (and thus, colorful) websites.
peak
app
eal
peak
app
eal
0
1
2
3
4
5
6
7
8
pre-high school
high school college graduate school
PhD
colorfulness complexity
peak
app
eal
Figure 7. Colorfulness and complexity scores resulting in peak appealfor different education levels. Mean and standard errors of peal appealbased on bootstrap resampling and curve-fitting of mean appeal ratingsafter applying locally weighted scatterplot smoothing (Lowess).
We extended this previous knowledge with a more detailedaccount of how demographic background influences people’saesthetic preferences. For each subgroup, we presented esti-mates of the colorfulness and complexity levels resulting in
highest appeal. These peak estimates provide measurable ev-idence of differences in visual appeal. For example, while theaverage peak of appeal across all participants was found tobe at a colorfulness score of 6.1 (on a scale from 1 to 9), wecalculated that the peak appeal can range between 3.6 and 7.6depending on a person’s demographic background. The com-plexity levels of peak appeal differed less (peaks for differentsubgroups ranged between 2.5 and 4.8), but there are strongvariations in people’s tolerance for a low and a high visualcomplexity.
Analyzing the preferences of various subgroups, we foundthat females liked colorful websites more, and colorless web-sites less, than males. For complexity, both genders reachedtheir peak appeal at a similar low to moderate complexitylevel, but females disliked simple websites more. Adults aged41 years and above liked websites with a higher colorful-ness and complexity than younger age groups. We also founda negative correlation between education level and colorful-ness, as well as between education level and complexity. In-dependent of age, highly educated users prefer less complexand less colorful websites than others.
A user’s geographical location is an additional factor influ-encing appeal. Many of our results on the varying preferencesamong people from different countries were unprecedented,but were nevertheless intuitive. In particular, we observedthat countries in close proximity seem to share similar pref-erences. For example, the neighboring countries Finland andRussia preferred the lowest visual complexity and colorful-ness of all countries. Participants from Macedonia, Serbia,and Bosnia and Herzegovina—all countries that were part offormer Yugoslavia—had very similar preferences for highlycolorful websites. In addition, the Northern European coun-tries in our dataset (e.g., Denmark, Switzerland, France, Ger-many, Sweden, Austria) preferred a lower colorfulness thanSouthern European countries, such as Italy, Spain, Greece,or Romania. Northern European countries also preferred alower colorfulness than Asian countries, such as China, Sin-gapore, and Malaysia. Interestingly, Hong Kong and Japanpreferred a lower colorfulness than other Asian countries (buthigher than Northern European countries). All of the English-speaking countries Australia, New Zealand, Canada, UnitedStates, Ireland, and United Kingdom also preferred a highercolorfulness than Northern European countries. The resultssuggest that countries with a regular exchange of (cultural)values, e.g., due to migration, share similar website prefer-ences.
With these results, we have demonstrated that people’s aes-thetic preferences for the design of websites can substan-tially differ. If the goal is to maximize website appeal, usersshould therefore receive designs personalized to their visualpreferences. Our work takes a step towards this goal bycontributing a list of objectively measured colorfulness andcomplexity levels of peak appeal for diverse demographicgroups. In combination with the computational models in-troduced in [25], web designers can use these findings to es-timate whether a website corresponds to what specific targetgroups will find most appealing.
LIMITATIONS AND FUTURE DIRECTIONSMany of our results left us wondering about the underlyingreasons for people’s aesthetic preferences. For example, whydid older participants prefer more complex websites? Herewe can only speculate about possible causes, such as that thehigher ratings for more complex sites are a generational ef-fect; older users might simply be more used to text-heavy“web 1.0" designs. Determining causal relationships will bean important piece of future work.
A limitation of this paper is that it does not report on interac-tions between demographic variables. For example, our anal-ysis showed that females liked colorful websites more thanmales, but that >40 year old females and those with a higheducation level (independent of age) prefer a similar colorful-ness to the average male. While our model adequately incor-porates these interactions, we leave a comprehensive reporton these effects for future work.
In addition, any work on aesthetics risks loss of external va-lidity due to the highly subjective nature of visual appeal. Al-though we analyzed a larger and more diverse sample thanothers, our work is no exception. To achieve our long-termgoal of knowing what any user likes, we are therefore contin-uing to collect data online and are in the process of translatingthe study into a number of languages. We would be particu-larly enthusiastic to see our work replicated or extended withpopulations that are not online and have not yet been influ-enced by “global" websites.
Lastly, we are only beginning to understand how the exposureto, and identification with, certain demographic and culturalsubgroups influences our visual preferences. Our hope is thatour dataset will contribute to this knowledge by enabling anumber of future analyses. For example, we collected addi-tional demographic information based on plausible assump-tions that migration, native language, the uptake of foreignlanguages, or a person’s occupation influences appeal. Theavailable data therefore opens opportunities for tackling ques-tions, such as “How does migration impact visual appeal?";“To what extent does a shared language result in more ho-mogeneous preferences between countries?"; or “What is theinfluence of a mostly artistic occupation on design prefer-ences?". We look forward to seeing these questions answered.
DATA SETTo enable replication and extension of our results,we make available the dataset and website stimuli:http://iis.seas.harvard.edu/resources/. We additionally pro-vide an R-script detailing how variables were coded and en-tered into the regression, as well as the results of our finalmodel and peak calculations.
ACKNOWLEDGMENTSThis work was funded in part by a HarvardMind/Brain/Behavior Faculty Award and by a SloanResearch Fellowship. Katharina Reinecke was supportedby the Swiss National Science Foundation under fellowshipnumber PBZHP2-135922.
REFERENCES1. Barber, W., and Badre, A. Culturability: The Merging of
Culture and Usability. In Conference on Human Factors& the Web (1998).
2. Bates, D., Maechler, M., and Bolker, B. lme4: Linearmixed-effects models using S4 classes, 2013. R packageversion 0.999999-2.
3. Berlyne, D. Studies in the New Experimental Aesthetics.Washington, DC: Hemisphere Pub. Corp., 1974.
4. Bloch, P. Seeking the Ideal Form: Product Design andConsumer Response. The Journal of Marketing 59, 3(1995), 16–29.
5. Chen, J. Y., Whitfield, T. W. A., Robertson, K., andChen, Y. The Effect of Cultural and EducationalBackground in the Aesthetic Responses of WebsiteUsers. Tech. rep., National Institute for DesignResearch, Swinburne University of Technology, 2010.
6. Cyr, D., Head, M., and Larios, H. Colour Appeal inWebsite Design Within and Across Cultures: AMulti-method Evaluation. Int. Journal ofHuman-Computer Studies 68, 1-2 (2010), 1–21.
7. Cyr, D., and Trevor-Smith, H. Localization of WebDesign: An Empirical Comparison of German,Japanese, and U.S. Website Characteristics. Journal ofthe American Society for Information Science andTechnology 55(13) (2004), 1–10.
8. Geissler, G., Zinkhan, G., and Watson, R. The Influenceof Home Page Complexity on Consumer Attention,Attitudes, and Purchase Intent. Journal of Advertising35, 2 (2006), 69–80.
9. Gelman, A. Boot, 2013.http://andrewgelman.com/2013/06/03/boot/, lastaccessed September 16, 2013.
10. Hasler, D., and Suesstrunk, S. Measuring Colourfulnessin Natural Images. In Proc. SPIE/IS&T Human Visionand Electronic Imaging, vol. 5007 (2003), 87–95.
11. Hoyer, W. D., and Stokburger-Sauer, N. E. The Role ofAesthetic Taste in Consumer Behavior. Journal of theAcademy of Marketing Science 40, 1 (2011), 167–180.
12. Hsiu-Feng, W. Picture Perfect: Girls’ and Boys’Preferences Towards Visual Complexity in Children’sWebsites. Computers in Human Behavior (2013).
13. Ivory, M., Sinha, R., and Hearst, M. EmpiricallyValidated Web Page Design Metrics. In Proc. CHI’01(2001), 53–60.
14. Lindgaard, G., Dudek, C., Sen, D., Sumegi, L., andNoonan, P. An Exploration of Relations Between VisualAppeal, Trustworthiness and Perceived Usability ofHomepages. ACM ToCHI 18, 1 (2011).
15. Lindgaard, G., Fernandes, G., Dudek, C., and Brown, J.Attention Web Designers: You Have 50 Milliseconds toMake a Good First Impression! Behaviour &Information Technology 25, 2 (2006), 115–126.
16. Martindale, C., Moore, K., and Borkum, J. AestheticPreference: Anomalous Findings for Berlyne’sPsychobiological Theory. The American Journal ofPsychology (1990), 53–80.
17. Michailidou, E., Harper, S., and Bechhofer, S. VisualComplexity and Aesthetic Perception of Web Pages.Proc. Design of Communication (2008), 215–224.
18. Moshagen, M., Musch, J., and Göritz, A. S. A Blessing,not a Curse: Experimental Evidence for BeneficialEffects of Visual Aesthetics on Performance.Ergonomics 52, 10 (2009), 1311–1320.
19. Moshagen, M., and Thielsch, M. T. Facets of visualaesthetics. Int. Journal of Human-Computer Studies 68,10 (2010), 689–709.
20. Moss, G., and Gunn, R. Gender Differences in WebsiteProduction and Preference Aesthetics: PreliminaryImplications for ICT Education and Beyond. Behaviour& Information Technology 28, 5 (2000), 447–460.
21. Nakagawa, S., and Schielzeth, H. A general and simplemethod for obtaining R2 from generalized linearmixed-effects models. Methods in Ecology andEvolution 4 (2013), 133–142.
22. Ortony, A., Norman, D. A., and Revelle, W. The role ofaffect and proto-affect in effective functioning. OxfordUniversity Press, 2005.
23. Palmer, S., and Schloss, K. Ecological Valence andHuman Color Preferences. Proc. National Academy ofScience 107 (2010), 8877–8882.
24. Reinecke, K., and Bernstein, A. Improving Performance,Perceived Usability, and Aesthetics with CulturallyAdaptive User Interfaces. ACM ToCHI 18, 2 (2011).
25. Reinecke, K., Yeh, T., Miratrix, L., Mardiko, R., Zhao,Y., Liu, J., and Gajos, K. Predicting Users’ FirstImpressions of Website Aesthetics With a Quantificationof Perceived Visual Complexity and Colorfulness. InProc. CHI’13 (2013).
26. Rosenholtz, R., Li, Y., and Nakano, L. Measuring VisualClutter. Journal of Vision 7, 2 (2007).
27. Tractinsky, N. Visual Aesthetics. The Interaction DesignFoundation, 2013.
28. Tractinsky, N., Cokhavi, A., Kirschenbaum, M., andSharfi, T. Evaluating the Consistency of ImmediateAesthetic Perceptions of Web Pages. Int. Journal ofHuman-Computer Studies 64 (2006).
29. Tuch, A. N., Bargas-Avila, J. A., and Opwis, K.Symmetry and Aesthetics in Website Design: It’s aMan’s Business. Computers in Human Behavior 26, 6(2010), 1831–1837.
30. Tuch, A. N., Presslaber, E., Stoecklin, M., Opwis, K.,and Bargas-Avila, J. The Role of Visual Complexity andPrototypicality Regarding First Impression of Websites:Working Towards Understanding Aesthetic Judgments.Int. Journal of Human-Computer Studies 70(11) (2012).
31. Zheng, X., Chakraborty, I., Lin, J., and Rauschenberger,R. Correlating Low-level Image Statistics with Users’Rapid Aesthetic and Affective Judgments of Web Pages.In Proc. CHI’09 (2009).