Quantifying Transfer Credits from a Revenue Perspective · ess Quantifying Transfer Credits from a...
34
Office of Institutional Effectiveness Quantifying Transfer Credits from a Revenue Perspective One Institutions Approach to Achieving Zen Presented by Michael Cogan & Sushant Khullar Office of Institutional Effectiveness October 27, 2011
Transcript of Quantifying Transfer Credits from a Revenue Perspective · ess Quantifying Transfer Credits from a...

O
ffic
e o
f In
stit
uti
on
al E
ffec
tive
nes
s
Quantifying Transfer Credits from a Revenue Perspective
One Institutions Approach to Achieving Zen
Presented by
Michael Cogan & Sushant Khullar
Office of Institutional Effectiveness
October 27, 2011

O
ffic
e o
f In
stit
uti
on
al E
ffec
tive
nes
s
Agenda
• Introduction to UST
• Definitions
• Freshman Student Outcomes
• Transfer Credit
– Pre-Matriculation
– Post-Matriculation
– Impact on Departments
• Implications

O
ffic
e o
f In
stit
uti
on
al E
ffec
tive
nes
s
University of St. Thomas
• Catholic…..Diocesan…..Doctoral/Research
• Teaching University
• Enrollment – 10,534
– Undergraduate – 6,176
– Incoming Freshman – 1,324
• Campuses in St. Paul, Minneapolis, Rome, and Owatonna
• Gender - ~50/50
• Minnesota Residence – 80%

O
ffic
e o
f In
stit
uti
on
al E
ffec
tive
nes
s
Definitions
• Freshman – First-time, First-Year students entering UST in fall of 2004-2007
• Pre-Matriculation Transfer Credit – All transfer credit earned by the student prior to matriculation and transferred to UST (e.g., PSEO, AP, and CLEP)
• Post-Matriculation Transfer Credit – All credits earned by a student outside of UST after initial enrollment at the institution (e.g., Two and Four-Year Colleges)
• Academic Departments – Institutional entities separated into fields of study using Classification of Instructional Program codes

O
ffic
e o
f In
stit
uti
on
al E
ffec
tive
nes
s
Data Development
• Transfer Credit
• Cohort assignment
• Descriptive analysis (chi-square & t-test)
• Isolate pre- and post matriculation credits
• Core and non-core curriculum
• Class recognition
O
ffic
e o
f In
stit
uti
on
al E
ffec
tive
nes
s
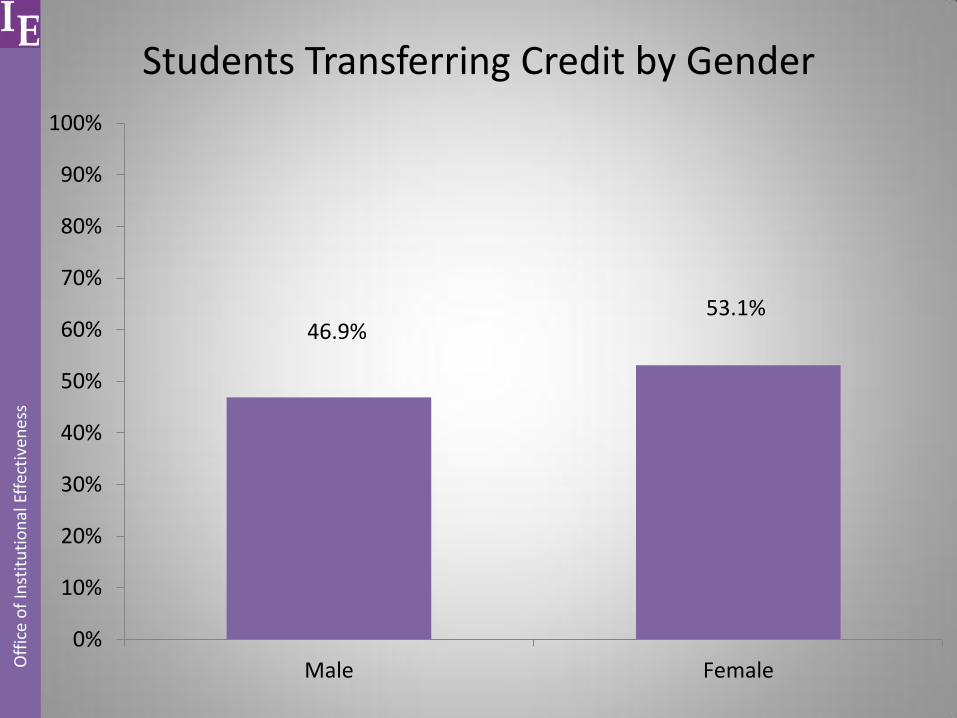
Students Transferring Credit by Gender
46.9% 53.1%
0%
10%
20%
30%
40%
50%
60%
70%
80%
90%
100%
Male Female
O
ffic
e o
f In
stit
uti
on
al E
ffec
tive
nes
s
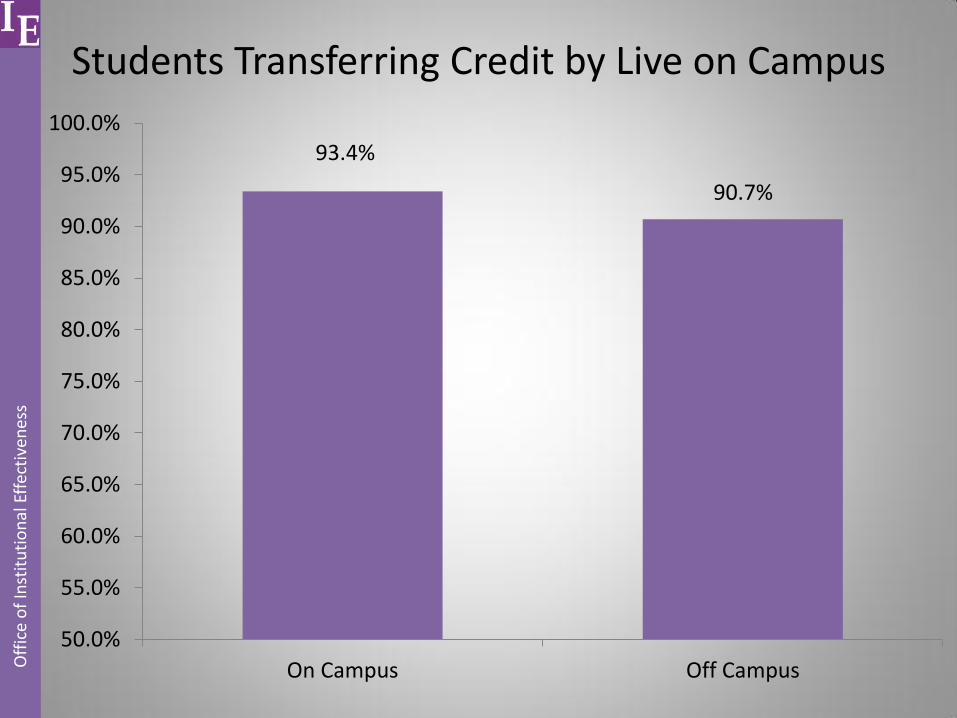
Students Transferring Credit by Live on Campus
93.4%
90.7%
50.0%
55.0%
60.0%
65.0%
70.0%
75.0%
80.0%
85.0%
90.0%
95.0%
100.0%
On Campus Off Campus
O
ffic
e o
f In
stit
uti
on
al E
ffec
tive
nes
s
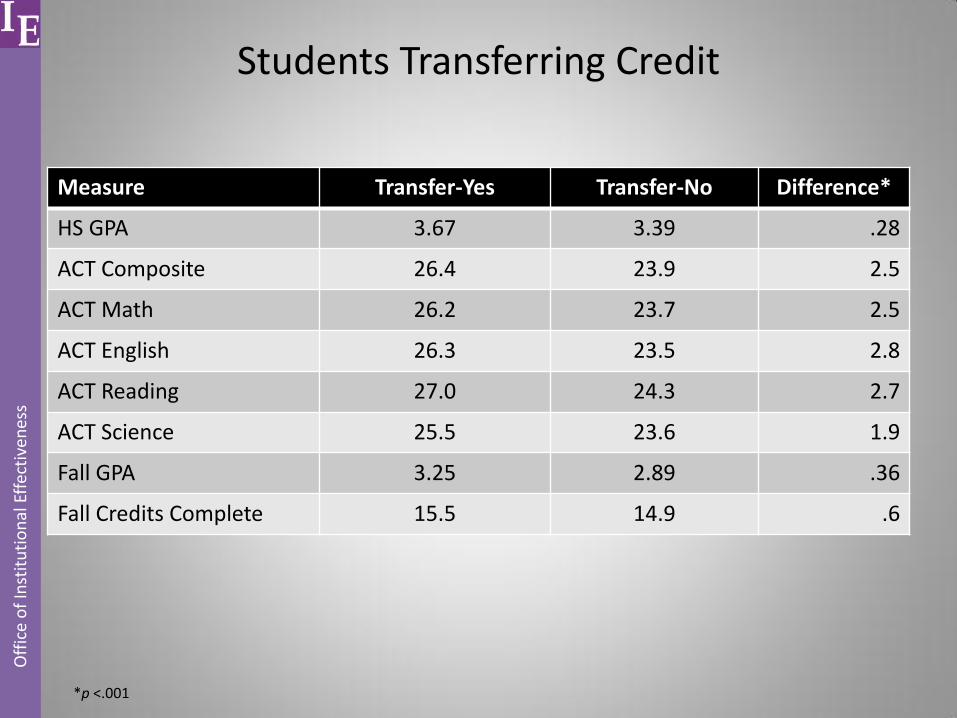
Students Transferring Credit
Measure Transfer-Yes Transfer-No Difference*
HS GPA 3.67 3.39 .28
ACT Composite 26.4 23.9 2.5
ACT Math 26.2 23.7 2.5
ACT English 26.3 23.5 2.8
ACT Reading 27.0 24.3 2.7
ACT Science 25.5 23.6 1.9
Fall GPA 3.25 2.89 .36
Fall Credits Complete 15.5 14.9 .6
*p <.001

O
ffic
e o
f In
stit
uti
on
al E
ffec
tive
nes
s
Students Transferring Credit by F-to-F Retention
89.9% 85.1%
Return-Yes Return-No
0%
10%
20%
30%
40%
50%
60%
70%
80%
90%
100%
O
ffic
e o
f In
stit
uti
on
al E
ffec
tive
nes
s
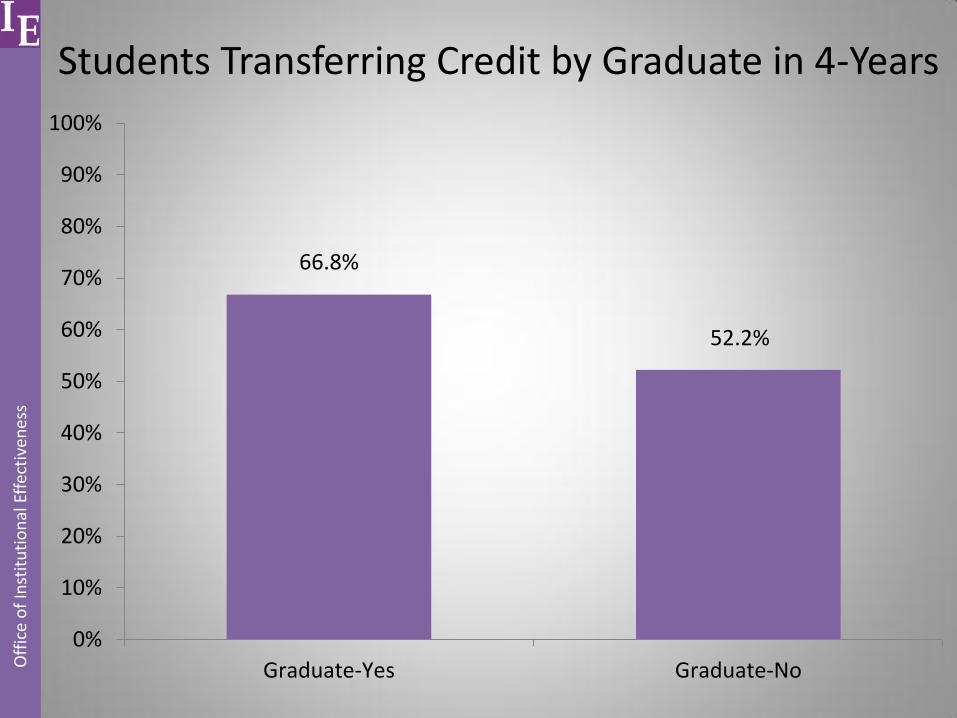
Students Transferring Credit by Graduate in 4-Years
66.8%
52.2%
Graduate-Yes Graduate-No
0%
10%
20%
30%
40%
50%
60%
70%
80%
90%
100%
O
ffic
e o
f In
stit
uti
on
al E
ffec
tive
nes
s
Questions
• What impact does transfer credit prior to freshman matriculation have on institutional revenue?
• What impact does transfer credit earned after matriculation have on institutional revenue
• Are there academic departments disproportionately affected by the acceptance of transfer credits?
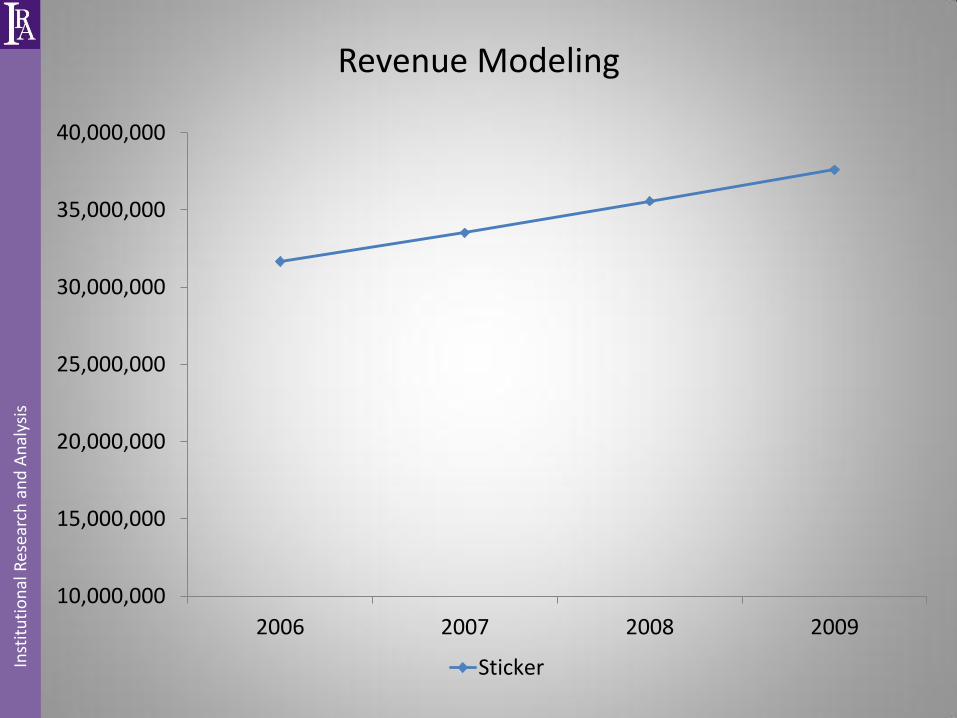
10,000,000
15,000,000
20,000,000
25,000,000
30,000,000
35,000,000
40,000,000
2006 2007 2008 2009
Sticker
Revenue Modeling
In
stit
uti
on
al R
esea
rch
an
d A
nal
ysis

10,000,000
15,000,000
20,000,000
25,000,000
30,000,000
35,000,000
40,000,000
2006 2007 2008 2009
Sticker Attrition
Revenue Modeling
In
stit
uti
on
al R
esea
rch
an
d A
nal
ysis

10,000,000
15,000,000
20,000,000
25,000,000
30,000,000
35,000,000
40,000,000
2006 2007 2008 2009
Sticker Attrition Attrition & Credits
Revenue Modeling
In
stit
uti
on
al R
esea
rch
an
d A
nal
ysis

10,000,000
15,000,000
20,000,000
25,000,000
30,000,000
35,000,000
40,000,000
2006 2007 2008 2009
Sticker Attrition Attrition & Credits Attrition, Credits, Discount
Revenue Modeling
In
stit
uti
on
al R
esea
rch
an
d A
nal
ysis

10,000,000
15,000,000
20,000,000
25,000,000
30,000,000
35,000,000
40,000,000
2006 2007 2008 2009
Sticker Attrition
Attrition & Credits Attrition, Credits, Discount
Attrition, Credits, Discount, FA
Revenue Modeling
In
stit
uti
on
al R
esea
rch
an
d A
nal
ysis

10,000,000
15,000,000
20,000,000
25,000,000
30,000,000
35,000,000
40,000,000
2006 2007 2008 2009
Sticker Attrition
Attrition & Credits Attrition, Credits, Discount
Attrition, Credits, Discount, FA
Revenue Modeling
In
stit
uti
on
al R
esea
rch
an
d A
nal
ysis

$62,913
$145,522
$254,083
$675,873
0
200,000
400,000
600,000
800,000
1,000,000
1,200,000
1,400,000
2006 2007 2008 2009
Unrealized Revenue Based Model
In
stit
uti
on
al R
esea
rch
an
d A
nal
ysis
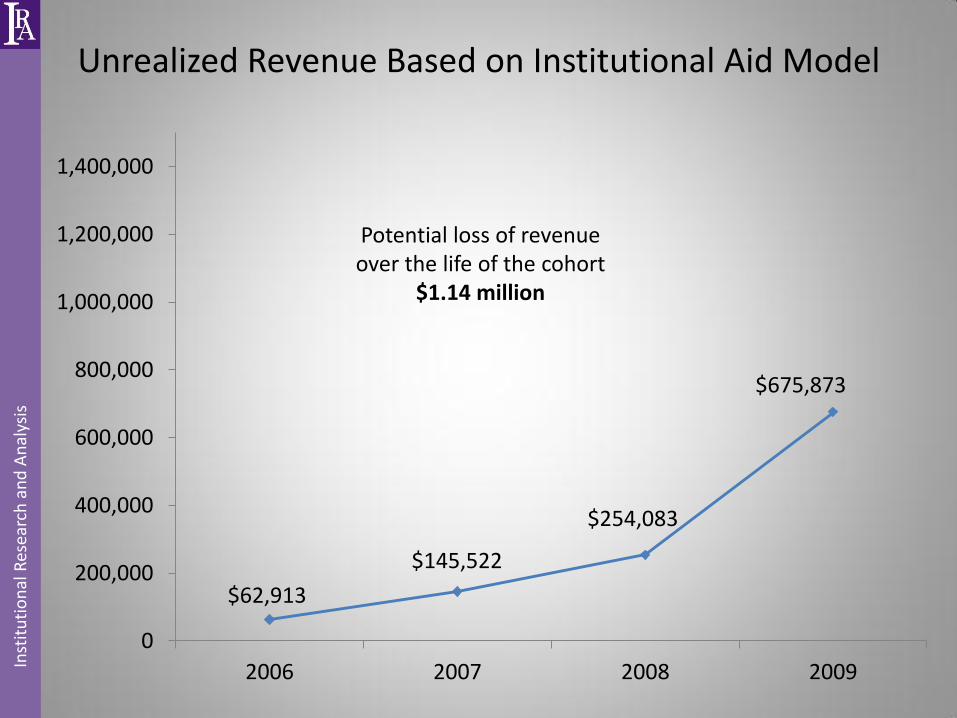
$62,913
$145,522
$254,083
$675,873
0
200,000
400,000
600,000
800,000
1,000,000
1,200,000
1,400,000
2006 2007 2008 2009
Unrealized Revenue Based on Institutional Aid Model
In
stit
uti
on
al R
esea
rch
an
d A
nal
ysis
Potential loss of revenue over the life of the cohort
$1.14 million

O
ffic
e o
f In
stit
uti
on
al E
ffec
tive
nes
s
Projected Revenue Loss Pre-Matriculation

O
ffic
e o
f In
stit
uti
on
al E
ffec
tive
nes
s
Freshman Student Outcomes 2006-10
• 3,470 freshman transferred credit pre-matriculation (51%)
• The average number of credits transferred per student: – Mean – 13.1
– Median – 10.0
– Mode – 4.0
– Interquartile range – 13
– Range – 79.0
• Total credits transferred – 45,599
• The average number of ‘entities’ transferring credit from – 1.31
O
ffic
e o
f In
stit
uti
on
al E
ffec
tive
nes
s
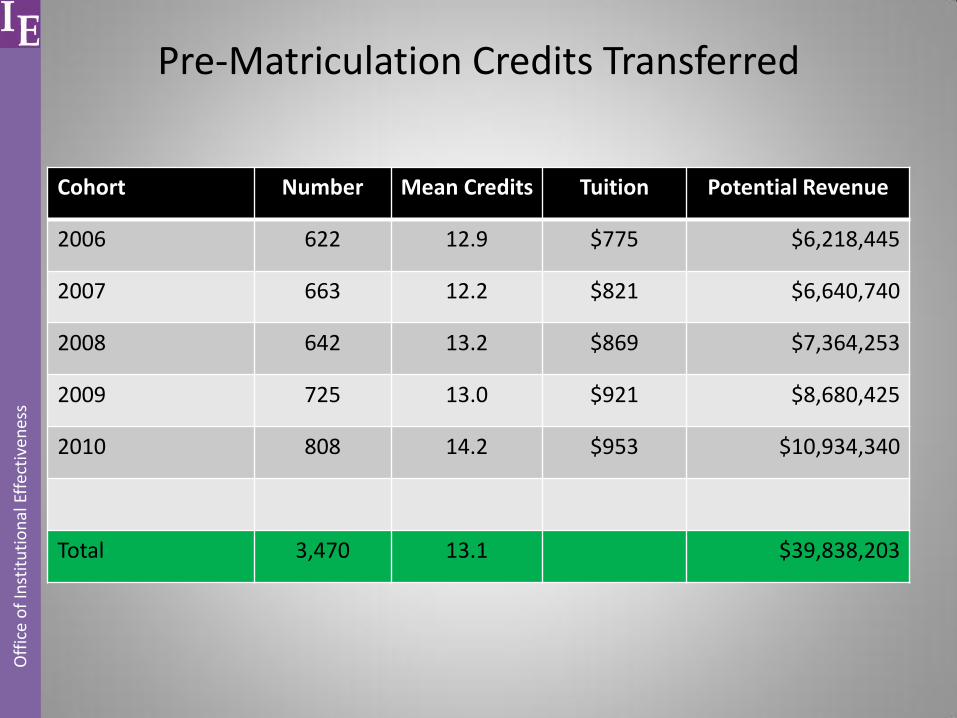
Pre-Matriculation Credits Transferred
Cohort Number Mean Credits Tuition Potential Revenue
2006 622 12.9 $775 $6,218,445
2007 663 12.2 $821 $6,640,740
2008 642 13.2 $869 $7,364,253
2009 725 13.0 $921 $8,680,425
2010 808 14.2 $953 $10,934,340
Total 3,470 13.1 $39,838,203
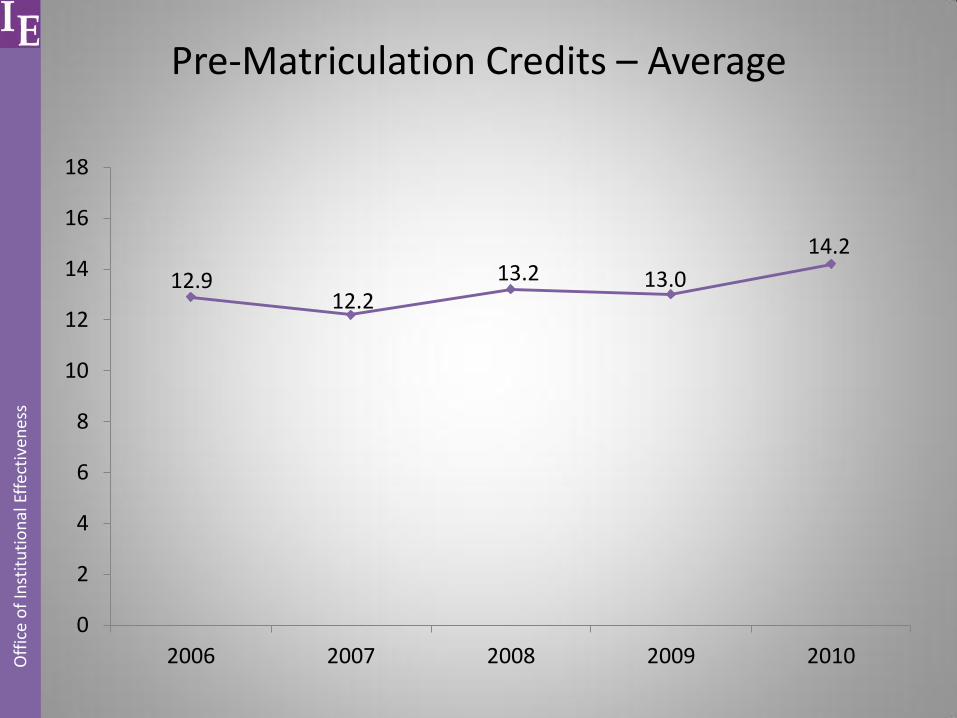
12.9 12.2
13.2 13.0
14.2
0
2
4
6
8
10
12
14
16
18
2006 2007 2008 2009 2010
Pre-Matriculation Credits – Average
Off
ice
of
Inst
itu
tio
nal
Eff
ecti
ven
ess

622 663 642
725
808
0
100
200
300
400
500
600
700
800
900
1,000
2006 2007 2008 2009 2010
Pre-Matriculation Credits – Headcount
Off
ice
of
Inst
itu
tio
nal
Eff
ecti
ven
ess
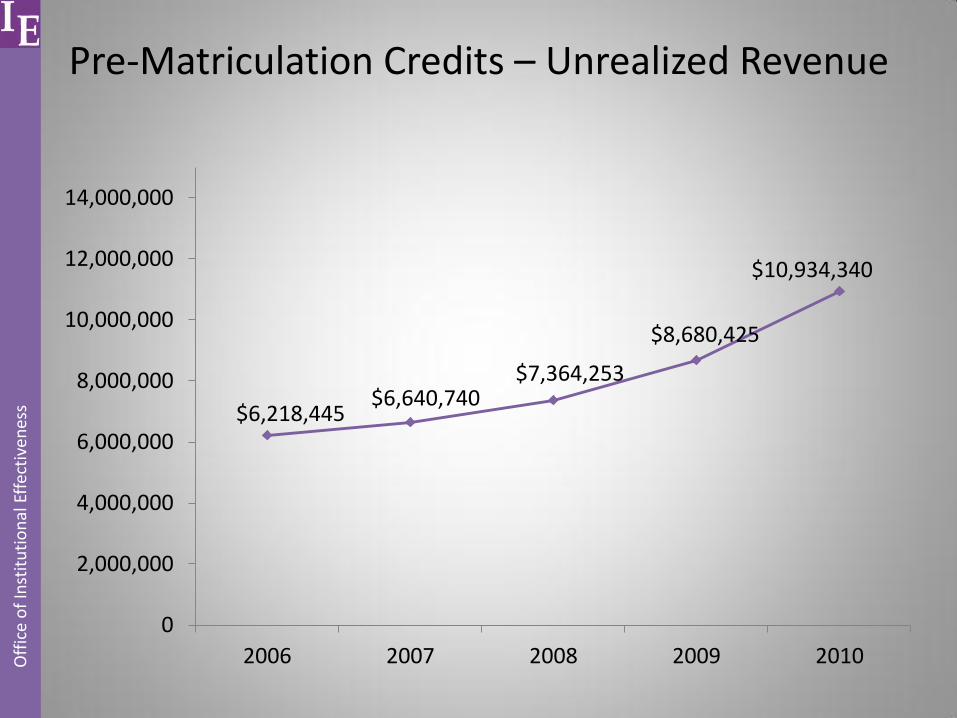
$6,218,445 $6,640,740
$7,364,253
$8,680,425
$10,934,340
0
2,000,000
4,000,000
6,000,000
8,000,000
10,000,000
12,000,000
14,000,000
2006 2007 2008 2009 2010
Pre-Matriculation Credits – Unrealized Revenue
Off
ice
of
Inst
itu
tio
nal
Eff
ecti
ven
ess

O
ffic
e o
f In
stit
uti
on
al E
ffec
tive
nes
s
Projected Revenue Loss Post-Matriculation

O
ffic
e o
f In
stit
uti
on
al E
ffec
tive
nes
s
Post-Matriculation Transfer Trends 2004-07
• 1,220 undergraduate students transferred credit post-matriculation
• The average number of credits transferred per student: – Mean – 7.5
– Median – 5.0
– Mode – 3.0
– Interquartile range – 6.0 (3.0 to 9.0)
– Range – 33.0
• Total credits transferred – 9,150
• Students transferring credit post-matriculation (24%)

O
ffic
e o
f In
stit
uti
on
al E
ffec
tive
nes
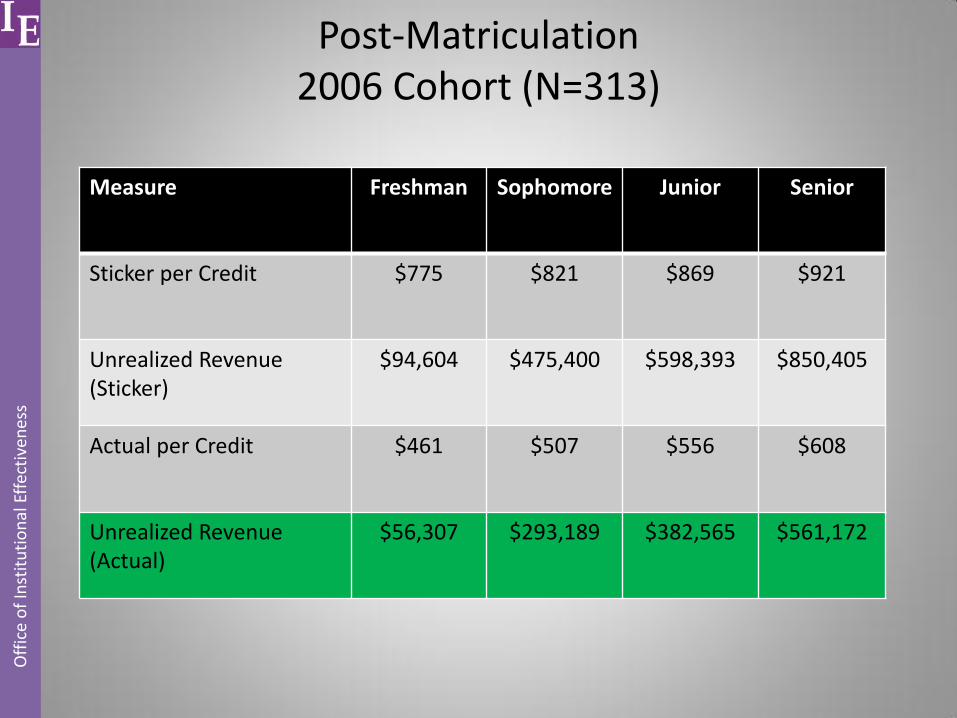
s Post-Matriculation
2006 Cohort (N=313)
Measure Freshman Sophomore Junior Senior
Sticker per Credit $775 $821 $869 $921
Actual by Percentage .595 .618 .639 .660
Actual per Credit $461 $507 $556 $608
Credits Transferred (Avg) .39 1.85 2.20 2.95
O
ffic
e o
f In
stit
uti
on
al E
ffec
tive
nes
s Post-Matriculation
2006 Cohort (N=313)
Measure Freshman Sophomore Junior Senior
Sticker per Credit $775 $821 $869 $921
Unrealized Revenue (Sticker)
$94,604 $475,400 $598,393 $850,405
Actual per Credit $461 $507 $556 $608
Unrealized Revenue (Actual)
$56,307 $293,189 $382,565 $561,172

O
ffic
e o
f In
stit
uti
on
al E
ffec
tive
nes
s
Projected Revenue Loss Academic Departments

O
ffic
e o
f In
stit
uti
on
al E
ffec
tive
nes
s
Core Curriculum
• Three Overarching Objectives
– Liberal learning
– Moral and ethical development
– Career preparation

O
ffic
e o
f In
stit
uti
on
al E
ffec
tive
nes
s Academic Department Transfer Activity
2007-10
Core Requirement Headcount Credits Average
Social Analysis 936 4,235 4.5
Natural Sciences 777 4,010 5.2
Literature and Writing 772 3,434 4.4
Mathematics 703 3,611 5.1
Human Diversity 421 1,614 3.8
Historical Studies 407 1,624 4.0
Language and Culture 350 1,969 5.6
Quantitative Reasoning 321 1,247 3.9
Implications
• Student outcomes
• Dollars and ‘sense’
• Curriculum ‘should’ trump finances
• Entrepreneurial spirit

Discussion