
Quantifying Dublin City Enterprise Board’s carbon footprint & Developing a footprint reduction...
14
Quantifying Dublin City Enterprise Board’s carbon footprint & Developing a footprint reduction plan CarbonDecisio ns Update January 16, 2009
-
Upload
christopher-floyd -
Category
Documents
-
view
214 -
download
0
Transcript of Quantifying Dublin City Enterprise Board’s carbon footprint & Developing a footprint reduction...
Quantifying Dublin City Enterprise Board’s carbon footprint
&Developing a footprint reduction plan
CarbonDecisions
Update January 16, 2009

Contents
• Scope of the study– Emission sources
• Analysis and benchmarking– Carbon footprint– Energy efficency
• What’s working well• Opportunities for improvement• Key findings• Next steps

Scope: emission sources
1.Direct combustion and process
2. Electricity
3. Employee commuting
3. Purchases
3. Waste
3. Business travel
Standards• WSCBD Greenhouse Gas Protocol• Global Footprint Network
Challenges• Data has not been easily available for
some sources. eg electricity• Assumptions have been conservative
3. Water
Emission sources
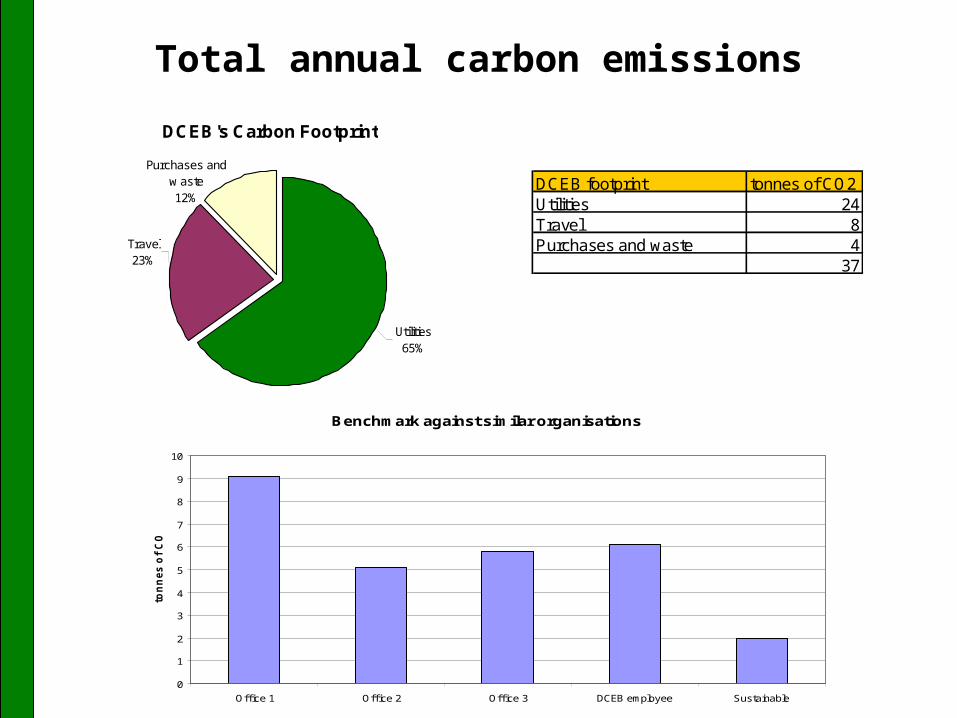
Total annual carbon emissions
DCEB footprint tonnes of CO2Utilities 24Travel 8Purchases and waste 4
37
Benchmark against similar organisations
0
1
2
3
4
5
6
7
8
9
10
Office 1 Office 2 Office 3 DCEB employee Sustainable
ton
nes o
f C
O2
DCEB's Carbon Footprint
Utilities65%
Travel23%
Purchases and w aste12%
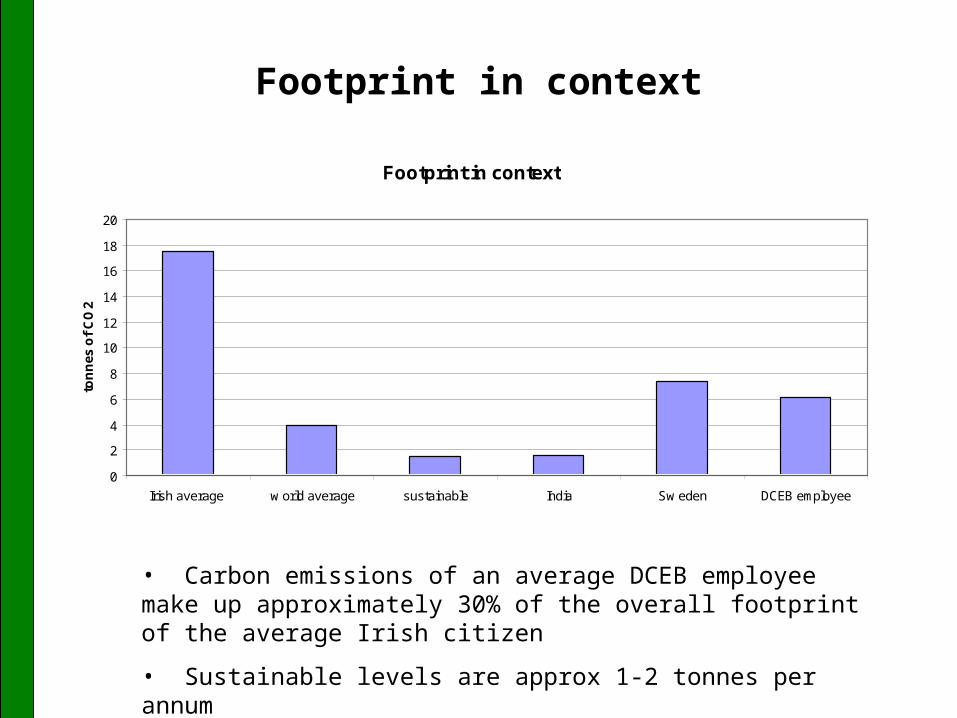
• Carbon emissions of an average DCEB employee make up approximately 30% of the overall footprint of the average Irish citizen
• Sustainable levels are approx 1-2 tonnes per annum*source EPA, WWF
Footprint in context
Footprint in context
0
2
4
6
8
10
12
14
16
18
20
Irish average w orld average sustainable India Sw eden DCEB employee
ton
nes
of
CO
2

Carbon emissions from utilities
Electricity makes up the vast majority of the carbon emission sources
DCEB's utility footprint
Water0%
Gas20%
Electricity80%
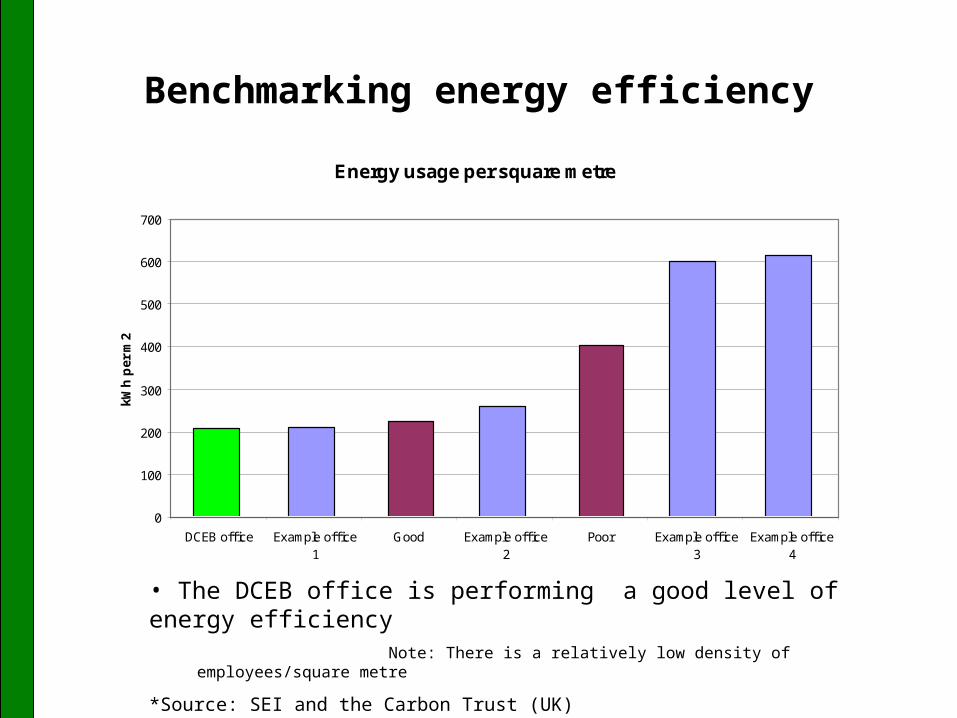
Benchmarking energy efficiency
• The DCEB office is performing a good level of energy efficiencyNote: There is a relatively low density of employees/square
metre
*Source: SEI and the Carbon Trust (UK)
Energy usage per square metre
0
100
200
300
400
500
600
700
DCEB off ice Example off ice1
Good Example off ice2
Poor Example off ice3
Example off ice4
kWh
per
m2
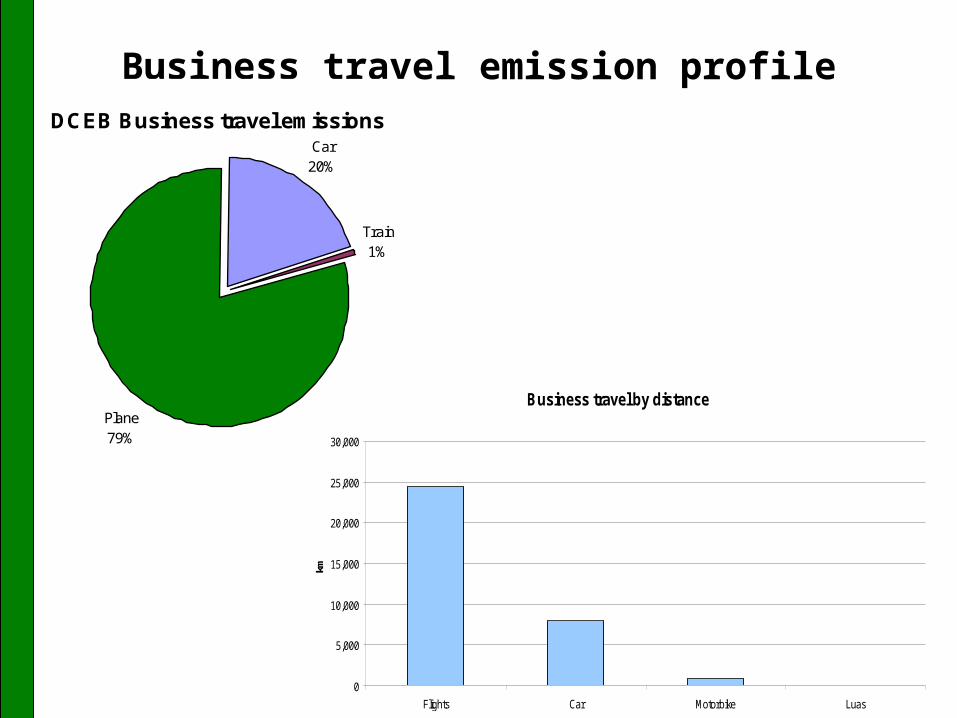
Business travel emission profileDCEB Business travel emissions
Car20%
Train1%
Plane79%
Business travel by distance
0
5,000
10,000
15,000
20,000
25,000
30,000
Flights Car Motorbike Luas
km
What’s working well
• Commuting profile – The majority of the team use public transport
• Energy usage within the office is relatively low

Cost effective opportunities for improvement
• Utilities– Switch electricity provider
• Work with the building owner to switch to a renewable energy provider (eg Airtricity)
– Increase the office’s energy efficiency • Develop an energy awareness programme for staff to further reduce
emissions– Eg. Refit the rooms to use CFLs and motion sensors
• Travel– Use bicycle couriers instead of motorbike couriers for shorter trips– Reduce international airtravel by 20% (reduce by one trip / year)
• Purchases and Waste– Implement a green procurement policy
• Switch to post consumer recycled paper• Reuse toner cartridges
– Recycling plan for brown waste

Quantification of reductions
• There are cost effective actions offer an opportunity to reduce DCEB’s emissions by approximately 50%
Carbon foortprint Reduction opportunities
0
5
10
15
20
25
30
Utilities Travel Purchases and w aste
ton
nes
of
CO
2
pre reduction
post reduction

Key findings
• The carbon emissions from the DCEB are relatively consistent with other companies in the services industry.
• The energy efficiency is relatively high on a square metre basis but about average on a per person basis.
• There are several quick-win cost effective opportunities for reduction in CO2 emissions
Suggested next steps
1. Publicise results amongst staff2. Agree a reduction target for 2009
1. Nominate a champion2. Publicise DCEB’s environmental policy and plan
3. Implement a carbon emissions reduction plan1. Meet the building landlord
• Switch electricity provider to a renewable one• Start bringing in low energy technology
2. Develop energy awareness program3. Implement a green procurement policy
4. Review progress in Q4 of 2009

Questions?
CarbonDecisions