Quantified Evaluations of IT-Tools
88
DEGREE PROJECT IN THE FIELD OF TECHNOLOGY VEHICLE ENGINEERING AND THE MAIN FIELD OF STUDY MECHANICAL ENGINEERING, SECOND CYCLE, 30 CREDITS STOCKHOLM, SWEDEN 2019 Quantified Evaluations of IT-Tools ERIC TILLYBS KTH ROYAL INSTITUTE OF TECHNOLOGY SCHOOL OF INDUSTRIAL ENGINEERING AND MANAGEMENT
Transcript of Quantified Evaluations of IT-Tools

DEGREE PROJECT IN THE FIELD OF TECHNOLOGY VEHICLE ENGINEERING AND THE MAIN FIELD OF STUDY MECHANICAL ENGINEERING, SECOND CYCLE, 30 CREDITS STOCKHOLM, SWEDEN 2019
Quantified Evaluations of IT-Tools
ERIC TILLYBS
KTH ROYAL INSTITUTE OF TECHNOLOGY
SCHOOL OF INDUSTRIAL ENGINEERING AND MANAGEMENT


Quantified Evaluations of IT-Tools
Eric Tillybs
Master of Science Thesis TRITA-ITM-EX 2019:535 KTH Industrial Engineering and Management
Machine Design SE-100 44 STOCKHOLM


Examensarbete TRITA-ITM-EX 2019:535
Kvantifierade Utvärderingar av IT-Verktyg
Eric Tillybs
Godkänt
2020-05-12
Examinator
Sofia Ritzén
Handledare
Jenny Janhager Stier
Uppdragsgivare
Scania CV
Kontaktperson
Thomas Lidström
Sammanfattning
Scania CV är en premiumtillverkare av lastbilar, bussar och motorer. På Scania finns en
forsknings och utvecklingsavdelning, i det här examensarbetet refererad till som R&D-
avdelningen, som hanterar IT-verktygslösningar för interna kunder på Scania. Efter att ett nytt
IT-verktyg har implementerats vill R&D-avdelningen kunna utvärdera vilka fördelar som
möjliggjorts genom det nya IT-verktyget. Idag ser R&D-avdelningen huvudsakligen till
påtagliga fördelar så som förbättrad kvalité, sparad tid och sparade pengar som resultat av ett
nytt IT-verktyg. R&D-avdelningen har uttryckt att de ser förbättringspotential både i deras
förmåga att prioritera mellan IT-verktygsprojekt och utvärdering av IT-verktygen som följer.
Idag prioriterar Scania ofta produktutvecklingsprojekt för externa kunder före
utvecklingsprojekt av IT-verktyg för interna kunder. R&D-avdelningen är av uppfattning att
detta kunde förändras om det fanns ett bättre sätt att hantera påtagliga och opåtagliga fördelar
som möjliggörs genom IT-verktyg. På detta vis skulle resultaten ifrån IT-verktygsprojekt bättre
kunna jämföras med fördelarna som genereras med produktutvecklingsprojekt för externa
kunder. Syftet med masteruppsaten är att skapa ett verktyg som hanterar fördelar och nackdelar
av IT-verktyg för att göra R&D-avdelningen bättre på att identifiera, kategorisera, ranka och
utvärdera fördelar och nackdelar som möjliggörs genom IT-verktyg. Resultatet av uppsatsen
har tagits fram med hjälp av litteraturstudie, flertalet workshops och semistrukturerade
intervjuer med Scania-anställda med kopplingar till två olika IT-verktyg samt en validering i
en förbättringsgrupp kopplad till ett tredje IT-verktyg. Resultatet som döpts till IT-
verktygsutvärderaren består av en lista med 22 olika aspekter av potentiella nackdelar och
fördelar med IT-verktyg som kategoriserats in i fyra huvudkategorier där varje aspekt har en
tillhörande viktning. Två enkäter och en beräkningsmall har tagits fram med syfte att kvantifiera
hur IT-verktyget uppfyller dessa aspekter. En enkät fokuserar på användaren av IT-verktyget
och den andra enkäten har ett mer övergripande företagsperspektiv. De 22 oviktade aspekterna
i kategorierna visualiseras med hjälp av spindeldiagram, en summa poäng räknas fram för varje
kategori och en totalpoäng för IT-verktyget tas fram. Skillnaden i poäng i de 22 aspekterna
mellan det nya IT-verktyget och det ersatta IT-verktyget bestämmer om det nya IT-verktyget
medför en positiv förändring (fördel) eller negativ förändring (nackdel) i den givna aspekten.
Sökord: Informationsteknik, IT-verktyg, utvärdering, fördelar, nackdelar


Master of Science Thesis TRITA-ITM-EX 2019:535
Quantified Evaluations of IT-Tools
Eric Tillybs
Approved
2020-05-12
Examiner
Sofia Ritzén
Supervisor
Jenny Janhager Stier
Commissioner
Scania CV
Contact person
Thomas Lidström
Abstract
Scania CV is a premium truck, bus and engine manufacturer. At Scania there is a research and
development department, in the thesis referred to as the R&D department, which delivers IT-
tool solutions for internal customers at Scania. After a new IT-tool has been implemented The
R&D department want to be able to evaluate the benefits enabled by the IT-tool. Today the
R&D department mainly identifies tangible benefits such as improved quality, saved time and
saved money due to the use of a new IT-tool. The R&D department have expressed that they
see room for improvement both in the phase of prioritizing between what IT-tool projects to
start and in the evaluation of IT-tools. Scania often prioritize product development projects for
external customers before IT-tool development projects for internal customers. The R&D
department believes that the position of IT-tool projects for internal customer could be
strengthen if a more comprehensive IT-tool evaluation could be implemented. This way a better
case could be made to emphasize the importance of prioritizing new IT-tool projects for internal
customers. The purpose of this master thesis is to create a tool to manage benefits and
disbenefits of IT-tools by making the R&D department able to identify, categorize, rank and
evaluate benefits and disbenefits enabled by IT-tools. The result of the thesis has been found
through a literature study, multiple workshops, and semi structured interviews with employees
linked to two different IT-tools A and –B together with validation in an improvement group
linked to another IT-tool C. The result of the thesis is known as the IT-Tool Evaluator and
consists of a list of benefit aspects with corresponding weights. Two surveys and a calculation
template has been developed with the purpose to quantify how a new IT-tool fulfils these benefit
aspects. One survey focus on the IT-tool user and one survey has a focus of a company
perspective. The benefit aspects are visualised using radar diagrams, a score for each aspect is
calculated and a total score for the IT-tool is generated. The difference in score in each of the
22 benefit aspects in the new IT-tool and the IT-tool that is being replaced decides if the new
IT-tool brings a positive change (benefit) or negative change (disbenefit) in the given aspect.
Search words: Information technology, IT-tools, evaluation, benefits, disbenefits


NOMENCLATURE
Abbreviations
R&D Research and development
PPM Product portfolio management
IT Information technology
IS Information system
BMP Benefits management process
BSC Balanced scorecard
KPI Key performance indicators

TABLE OF CONTENTS
1. INTRODUCTION ....................................................................................... 1
1.1 Background ............................................................................................... 1
1.2 Problem and purpose ................................................................................ 3
2. METHODOLOGY ...................................................................................... 5
2.1 Overview of steps conducted in thesis ..................................................... 5
2.2 Background study and brainstorming by author ...................................... 6
2.3 Brainwriting workshop ............................................................................. 6
2.4 Ranking workshops .................................................................................. 7
2.5 Literature study ......................................................................................... 8
2.6 Interviews .................................................................................................. 9
2.7 Creating two surveys to evaluate IT-tools .............................................. 11
2.8 Ranking ................................................................................................... 11
2.9 Validation in improvement groups ......................................................... 11
2.10 Analysis .................................................................................................. 12
3. LITERATURE STUDY ............................................................................ 13
3.1 Strategic context of IT ............................................................................ 13
3.2 Project portfolio management ................................................................ 15
3.3 Benefits management history ................................................................. 16
3.4 The benefits management process model ............................................... 17
3.5 Models for benefit categorization ........................................................... 19
3.6 Other performance measurements .......................................................... 24
4. RESULTS .................................................................................................. 25
4.1 Results background study and brainstorming ......................................... 25
4.2 Result brainwriting ................................................................................. 25
4.3 Result ranking workshops....................................................................... 26
4.4 Result literature study ............................................................................. 27
4.5 Result from interviews ............................................................................ 29
5. THE FINAL RESULT ............................................................................... 37
5.1 The final benefit aspect list ..................................................................... 37
5.2 The final ranking of benefit aspects ....................................................... 39
5.3 Two surveys ............................................................................................ 39

5.4 Survey validation and feedback .............................................................. 40
5.5 The IT-Tool Evaluator ............................................................................ 41
5.6 Evaluation of the IT-Tool Evaluator ...................................................... 42
6. DISCUSSION AND ANALYSIS ............................................................. 43
6.1 The evolution of the IT-Tool Evaluator ................................................. 43
6.2 Levels of the IT-Tool Evaluator ............................................................. 46
6.3 Translation issues .................................................................................... 47
6.4 Limitations of the methods used in the thesis ........................................ 49
6.5 Limitations of the IT-Tool Evaluator ..................................................... 50
6.6 Future work ............................................................................................. 51
7. CONCLUSION .......................................................................................... 53
8. LIST OF REFERENCES ........................................................................... 55
9. APPENDIX ................................................................................................ 57

1
1. INTRODUCTION
This chapter describes the background, problem and purpose of the master thesis.
1.1 Background Scania CV is a premium truck, bus and engine manufacturer based in Södertälje, Sweden. At
Scania there is a particular research and development department (in the thesis referred to as
the R&D department). The R&D department creates and improves processes, methods and
information technology tools (IT-tools) to assist employees within the company (in the thesis
referred to as internal customers). Internal customers contact the R&D department with a
request for a new solution to handle an identified problem of which the solution is often a new
or improved IT-tool, often in a combination with an improved process or method. The first
thing that the R&D department starts with is to identify if other internal customers within other
areas of the company have the same needs. Resources are finite, therefore the most important
and wide spread needs in the organization are prioritized in order of optimizing the amount of
benefits obtained by internal customers out of the budget provided to the R&D department.
The R&D department acknowledge that it is important to evaluate benefits enabled by newly
implemented IT-tools. Today the R&D department mainly look at tangible benefits such as
improved quality, saved time and saved money as a result of the implementation of their
solutions. Different groups within the R&D department handles the use of benefits differently,
all IT-tools are not evaluated and there is no standardized IT-tool evaluation process. IT-tools
are either developed internally or bought from an external developer and is then sometimes
customised for Scania depending on the internal customer needs. The R&D department have
expressed that they see room for improvement both in the phase of prioritizing between what
IT-tool needs to prioritize and in phase of evaluation of IT-tools.
Eight years ago, a master thesis was conducted at the R&D department namely “Expected
Benefits in Business Development Projects – How to Formulate and Evaluate” by Josefsson
(2011). Expected benefits are the main drivers in projects, programs and portfolios in general
which is becoming a well-known fact among project managers (Mossalam & Arafa, 2016).
Benefits can also be seen as strategic improvements in the business, a measurement of how
valuable a project is (Serra & Kunc, 2015). Benefits are the result whose nature and value can
assume various forms but is the end something that brings advantages to an organization
(Andrade, et al., 2016). A business benefit has also be described as “an advantage on behalf of
a particular stakeholder or group of stakeholders” Ward & Daniel (2012). Most business
benefits are the result of both technology and business changes (Ward, et al., 2007).
It is important to list clear measurable expected benefits before an IT-project is started to make
it easier to evaluate the benefits when the IT-project is finished (Josefsson, 2011). At Scania
this means that for a project to receive resources and founding the internal customer must be
able to point at some expected benefits (Josefsson, 2011). IT-tool projects with the highest
amount of expected benefits compared to risks will be prioritized, the question is then if and
when the expected benefits are met? However, it is important to note that information systems
(IS) and IT does not create benefits on its own but rather enables benefit opportunities (Ward,
et al., 1996). But “many organizations believe that current methods are far from satisfactory in
ensuring that the benefits are properly identified and realized. Very few have a comprehensive
process for managing the delivery of benefits from IS/IT” Ward, et al. (1996).

2
This is a problem, as change can sometimes cause outcomes known as side effects that could
for example be the requirement of additional skills or increased costs (Serra & Kunc, 2015).
But a side effect can also be a positive but unexpected benefit. A negative side effect of a new
technology or business change is often referred to as a disbenefit (Ward & Daniel, 2012). The
word disbenefit has been chosen to describe a negative side effect in this thesis.
Project management success criteria has traditionally been limited to cost, time and quality
which sometimes is referred to as the iron triangle, but literature suggests that it is time to accept
other success criteria for IS and IT project management (Atkinson, 1999) as the iron triangle is
not a sufficient test of project management success (Zwikael & Smyrk, 2011). Existing methods
for justification of IT-project investments are inadequate as they exclude strategic integration
and intangible (non-financial) performance measurements (Gunasekaran, et al., 2001). Just as
the performance evaluation of a firm should not just be limited to a financial evaluation (Van
Grembergen & De Haes, 2005). The same applies to benefits management which should not be
downgraded to only economic indicators, it is crucial to pay attention to all factors, especially
intangible benefits that are not always expressed but often implied and recognized by many
stakeholders (Andrade, et al., 2016). Many intangible benefits could be obtained through IT-
projects and even though these benefits are not always quantifiable they can still be essential to
the endurance of a company, this makes current accountancy evaluation techniques insufficient
to generate investment decisions (Gunasekaran, et al., 2001).
Benefits management is complex (Andrade, et al., 2016) as is the topic of business benefits
enabled through IS/IT both complex and wide-ranging (Gammelgård, et al., 2006). Therefore,
managers find it difficult to quantify many IS/IT benefits (Irani & Love, 2001). Some IT-
companies has taken it as far as estimating the cost of not investing in IT (Gunasekaran, et al.,
2001). The “question is whether IT structures, processes, relational mechanism and IT decisions
are made in the interest of shareholders and other stakeholder, or primarily in the executives’
interests” Van Grembergen & De Haes (2005). In 2007 researchers used a web-survey to
evaluate benefits realization of IS/IT investments and the results showed that the most
mentioned area of improvement was the evaluation and review of benefits (Ward, et al., 2007).
The R&D department normally only starts IT-projects that has a return of investment of three
years or less or if the project is not mandatory. Josefsson (2011) states that her master thesis is
only the first step in the improvement of the evaluation phase at the R&D department. The
thesis has a focus on expected benefits and how to define what is expected by the internal
customer before and after the project. Less focus has been on how to measure or thoroughly
evaluate the benefits after the project has been conducted. Scania has expressed that they have
made some effort to improve on the evaluation phase of the projects after the thesis by Josefsson
(2011) was conducted but they still see room for improvement.
A post implementation evaluation at the R&D department is only conducted if the investment
into the project is large enough. There used to be a problem with the internal customer not
evaluating the benefits due to having low motivation and shortage of time and therefore not
prioritizing such an evaluation. This has since been addressed by having business
maintenance managers from the R&D department requesting an evaluation from the internal
customer when it is time to evaluate the project. A possible source of error that still exists
with the evaluation is that there could be a conflict of interest concerning the project success
as the internal customer orders the IT-tool project, states the expected benefits and then
evaluates the IT-tool post implementation. This means that there is a risk that it would be
convenient for the internal customer to exaggerate the benefits enabled by the IT-tools. It can
also be difficult, tiresome and time consuming to find, estimate and evaluate different types of

3
tangible and intangible benefits enabled by IT-tools especially if there is low interest or
limited benefits management knowledge to start with. Another risk is that the employee
ordering the IT-tool project might exaggerate the expected benefits from an IT-tool project in
order to get it approved knowing that it might not be evaluated at all (Josefsson, 2011). An
exaggeration could also be done unknowingly if the internal customer is very excited about
their IT-tool project (Josefsson, 2011). The R&D department has expressed that the measured
benefits enabled by their IT-tools, at least in theory, most often corresponds to the expected
benefits or above. However, when measuring in practice they cannot see that the affected
parts of the organization have become more efficient in terms of resources such as time and
money used after the implementation of a new IT-tool. As a result, product development
projects for external customers are often prioritized before IT-tool development projects for
internal customers meaning that the R&D department obtain less resources to conduct IT-tool
projects. It is believed this could be changed if there was a better way of managing all
benefits, both tangible and intangible, enabled through IT-tools, this way the results of the IT-
tool projects could better be compared with the benefits generated through more traditional
product development projects for external customers.
What determines the success for a firm is the speed of innovation and the amount of newly
created customer value which could be seen as the benefits per costs (Carlson & Wilmot, 2006).
Departments handling computer services needs to focus on providing a maximized value for
the internal customers of the company so the internal customers can provide a maximized value
to the enterprise’s external customers, this translates to cut costs and increase company
productivity (Carlson & Wilmot, 2006).
1.2 Problem and purpose
What types of benefits, both tangible and intangible, are enabled via IT-tools? Which benefits
are the most important and how can these benefits be evaluated after a new IT-tool has been
implemented? There is an obvious risk that all of the expected benefits may not be enabled
due to the implementation of a new IT-tool. Is there also a risk to obtain disbenefits? And if so
how can disbenefits be evaluated?
The purpose of this master thesis is to develop a tool to make the R&D department able to
identify, categorize, rank, and evaluate benefits and disbenefits enabled by IT-tools. If the
purpose is fulfilled this will help the R&D department to understand what and how benefits
and disbenefits are enabled and whom it affects. This would be helpful both for project
management and project portfolio management practitioners at the R&D department, their
internal customers meaning IT-tool users and Scania as a company. This thesis is limited to
IT-tools and does not consider processes and methods.

4

5
2. METHODOLOGY
A literature study, multiple workshops and semi structured qualitative interviews have been
conducted during the master thesis. The methodology is presented in this chapter.
2.1 Overview of steps conducted in thesis
The IT-Tool Evaluator which is the result of the thesis have been created using the method that
is visualized in fig 1. The method consists out of ten steps (counting the analysis steps as one),
all of which are described in this chapter.
Figure 1. An overview of the different stages of the master thesis.
The first step of the master thesis was a computer based background study revolving around
benefits of IT-tools and closely linked subjects. The second step consisted of brainstorming
sessions where different ideas of benefit aspects of IT-tools were generated by the author. The
analysis of the background study and the brainstorming sessions created the first iteration of
the benefit aspect list.
The next step consisted of a brainwriting workshop with multiple master thesis students at
Scania which together generated new ideas for IT-tool benefit aspects. By analysing the result
of the brainwriting workshop a second iteration of the benefit aspect list could be produced.
In the following stages of the master thesis two ranking workshops were held. Master thesis
students at Scania and Scania employees compared the different benefit aspects from the second
iteration of the benefit aspect list. The members of the workshops contributed by ranking the
benefits in terms of importance to Scania and by removing what was believed to be the least
important benefit from the list, this was summarized as the third iteration of the benefit aspect
list.
By taking the third iteration of the benefit aspect list and adding the results from the literature
study a fourth iteration could be created. At this stage an interview guide was developed.
Interviews were held with Scania employees linked to two different IT-tools: IT-tool A and

6
IT-tool B, the contribution added by the interviewees resulted in the fifth iteration of the
benefit aspect list. Two different survey were created to evaluate different types of potential
IT-tool benefits. The surveys were later validated with employees linked to a third IT-tool C
and the final analysis step resulted in the IT-Tool Evaluator which is the result of the thesis
and a way of conducting quantified evaluations of IT-tools.
2.2 Background study and brainstorming by author
A background study was initiated where literature was found through a systematic literature
study using a computer based search with relevant key words such as:
“information technology” and benefits and measure and projects
“IS/IT” and “benefits management”
After the background study a brainstorming session was performed by the author where the
author brainstormed new categories of potential benefits and disbenefits that had not been found
in literature within the background study. The resulting benefit aspects from the background
study and the brainstorming session were then grouped into different benefit categories using
post-it notes. The results of the first steps of the master thesis was the first iteration of the benefit
aspect list which included ten benefit aspects.
2.3 Brainwriting workshop
When the first benefit aspect list had been created a brainwriting workshop with four Scania
master thesis students, excluding the author, was held. The workshop participants used brain
writing technique to generate new ideas of benefits that could be obtained through IT-tools.
Brainwriting was selected over brainstorming as it is about silently sharing ideas that are written
down and compared to brainstorming it is often a more structured and constrained process
(Heslin, 2009). Brainwriting is suitable when there is a need of highly creative and qualitative
ideas (Heslin, 2009). The idea behind choosing brainwriting over brainstorming was to not limit
the students in terms of who is the most eager to talk. The goal of the workshop was to find as
many benefit aspects as possible. The aspects were written down on post-it notes with the
addition of a plus sign or a minus sign (or both) to indicate if the suggested aspects would
theoretically have a strictly positive or negative impact on the company and the IT-tool users if
an IT-tool whith such a trait was implemented. The post-it notes with the benefit aspects were
then rotated around the table with the purpose of giving all four participants a chance to come
up with examples to all of the aspects in order to understand if such a benefit was a feasible
outcome of an IT-tool. A second purpose behind this part of the workshop was to try and
identify if the original ideas were in fact benefit aspects or if they were practical examples of
benefits. In the end of the workshop there was a discussion of value of the different aspects and
it was made clear that it was hard to rank them in terms of value for the company. The workshop
ended and the post-it notes were obtained by the author and was later regrouped together with
the post-it notes of aspects created by the author during the brainstorming step and with post-it
notes describing types of benefit categories found in the background study. This resulted in 12
different aspects of expected benefits and potential disbenefits which resulted in the second
iteration of the benefit and disbenefit. An idea that was discussed during the workshop was that
all aspects could have the potential to affect the company in positive or negative way (this
addition was not implemented into the benefit aspect list until the fifth iteration then due to the
results of the interviews).

7
2.4 Ranking workshops
A new workshop was held with the master thesis students. The focus during this workshop was
to rank the 12 different benefit aspects from the second iteration of the benefit aspect list in
order of importance for Scania. The ranking was conducted using the evaluation matrix that can
be found in fig 2. The letters in the cells represents the different benefit aspects. Every aspect
was compared towards another in terms of importance for Scania/IT-tool user. Is A more
important than B? Is F more important than K? If the aspect on the vertical column was deemed
more important than the aspect in the horizontal row the cell would get the value 1. When the
workshop members disagreed between what aspect was the most important then a tie was
declared the value would in the cell would become 0,5. If the importance of the aspect in the
row was deemed higher than the aspect in the column then the cell would get the value 0. The
rows of values were then summed up and a result was then calculated and a weight of each
benefit was obtained on a scale from 1-10. The idea was that the most important aspects could
later be expanded into multiple more narrow aspects to ease the evaluation process and that the
least important aspect could potentially be removed from the list. After the ranking was
complete a short discussion was held about the results.
The purpose of doing this with the master thesis students, before repeating the process with
Scania employees with a workshop time limit of just 1h, was for the author to practice leading
such a workshop but also to get a reference point of which aspects that were seen as important.
It was also a good foundation for future discussion with the Scania employees to compare the
results from the two ranking workshops. The first ranking workshop with master thesis student
had taken almost two hours. To finish in just one hour, the cells to the left of the black diagonal
was preprogramed to have the value 1 minus the corresponding cell to the right of the diagonal.
In fig. 2. all the cells to the left of the black diagonal has the value 1 as no values have been
entered to the right of the diagonal.
Figure 2. Evaluation matrix used to rank benefit aspects. The black cells indicates the value not applicable as the
aspects are here is compared to themselves as “A vs A”, “B vs B” etc.
The second ranking workshop was held, and the ranking was now done by Scania employees
using the more automated evaluation matrix with the method previously mentioned. Three rows
and columns were left blank (M, N and O) so that if any participants could think of an aspect
they felt was missing this could easily be added to the matrix. The ranking workshop with
Scania employees resulted in a contribution to the third iteration of the benefit aspect list.

8
2.5 Literature study
Just like the background study the literature study was conducted using a systematic literature
search using a computer, search engines and databases. However, the literature study goes more
in depth compared to the background study. Articles and authors with a high number of citations
and articles that have frequently emerged in literature have been seen as extra relevant and has
therefore been prioritized. Some articles have been found through recommended articles
generated by databases (often articles from the same author or similar research field via an
article found by the keywords) which sometimes generated in new keywords. Articles have also
been found through the bibliographies of read articles by first looking at the titles of the
referenced articles, then by reading the abstracts to include and exclude articles for further
readings, this method is sometimes referred to as “snowballing” which can be seen as an
addition to a systematic literature study (Wohlin, 2014).
Two retail books were also used in the literature study. The book “Innovation : the five
disciplines for creating what customers want” by Carlson & Wilmot (2006) as it partly inspired
the subject of the master thesis. The book “Benefits Management: How to Increase the Business
Value of Your IT projects” by Ward and Daniel (2012) was heavily referenced and therefor
also included into the literature study.
The following databases and search engines have been used through the master thesis (with
great emphasis on the first two databases):
Google scholar
KTH online library
Scopus
Web of knowledge/science
Key words for the literature study include:
IT benefit categorization
"benefits realization management" measure and “balanced scorecard” and “information technology” key performance indicators and “information technology”
“information technology” and benefits and measure and projects “IS/IT” and “benefits management” “success criteria” and “IT projects”

9
2.6 Interviews
Semi structured interviews have been conducted with eight different Scania employees
regarding two different IT-tools that have been implemented at Scania. The purpose of the
interviews was to see if the results found through literature and workshops correlate with the
applied knowledge from employees that has worked within IT-tool projects and the users of the
IT-tools. For the master thesis this meant that the benefit aspects in the fourth iteration of the
list of benefits could either be validated or removed and new aspects could also be added.
Semi structured interviews are organized around a certain theme as is decided before the
interview and summarized in an interview guide that is not too specific or too long (Blomkvist
& Hallin, 2015). Qualitative interviews is a powerful tool used to capture opinions and
experiences (Rabionet, 2011). The semi structured interview is the most common type of
interview methodology when searching for empirical data via interviews (Blomkvist & Hallin,
2015). Semi structured interviews are also often used to collect data within software
engineering, but the quality of the data depends on how the interviews have been conducted
(Hove & Anda, 2005).
The interviews process followed in this master thesis was as following:
Find the right persons to interview
Establish ethical guidelines
Create interview guide
Do the interview and record it
Transcribe the recordings
Analyse the transcribes
To begin with two different implemented IT-tools were chosen, IT-tool A and B. The reason
for choosing these IT-tools was that they have seen different amount of benefits. IT-tool A is
thoroughly evaluated with a high amount of realized and unexpected benefits. For IT-tool B it
is uncertain how the evaluation should be made due to IT-tool B’s complex nature. The
interviews in this master thesis have been conducted with users and other employees linked to
the usage, development, evaluation and the post implementation improvement of IT-tool A and
B.
IT-tool A is an IT-tool concerned with information structures. Information is sent as input into
IT-tool A by a user. The data is structured can then be viewed in the IT-tool when needed as an
output. IT-tool A has been successfully evaluated using traditional measurements such as saved
time, saved money and improved quality. Expected benefits have been realized and unexpected
benefits were also obtained.
IT-tool B is complex, it gives Scania a technical capability enabled by a quantity of high-quality
information that is than integrated into a pre-existing user interface. Some of the users doesn’t
necessarily know that they are using a “new IT-tool”. This is an IT-tool which is hard to evaluate
using traditional measurements.

10
The interviewees were found through a discussion with the project manager that was
responsible for both IT-tool A and IT-tool B. The project manager recommended
knowledgeable employees to talk too which after initials meetings recommended employees to
interview. Five interviews were held for IT-tool A and three interviews were held for IT-tool
B.
Titles of interviewees and their link to the IT-tools:
Business Architect, responsible for evaluation of IT-tool A.
Two System Owners, users of IT-tool A.
Project coordinator, former user and current member of improvement group of IT-tool A
Solution architect, user of IT-tool A.
Business IT architect, part of the development of IT-tool B and former user of IT-tool B. Is
also taking part in the improvement work after the IT-tool implementation.
Business IT analyst, user and taking part of improvement after IT-tool B implementation.
Product owner, a former user that was part of the development of IT-tool B. Also taking
part in improvement work after the IT-tool implementation.
The interviews were recorded as it is preferable to avoid losing information (Hove & Anda,
2005). The ethical guidelines were to not name the interviewees by name in the report, that only
the author was allowed listen to the recorded interviews and that the transcriptions were also
only for the author to see.
It was also seen as important to have a well formulated interview guide with relevant, non-
leading questions for the interviewees. The same interview guide was used independent of the
role or work title of the interviewee. The idea behind this decision was to make it easier to
analyse the data from the interviews as there was a limited number of interviews. The interview
guide itself consisted of open questions which gave a variety of answers. The purpose of this
stage was to understand how different employees see and prioritize benefits and disbenefits.
But also, how Scania as a company works with benefits and disbenefits at the time of the
interviews.
Every interview was scheduled for one hour and if time remained when all the question in the
interview guide had been answered the interviewees was also asked about the different benefits
and disbenefits in the fourth iteration of the benefit aspect list. The respondents were asked if
they saw such a benefit or disbenefit with the IT-tool in question. The interviewees were also
asked if such a benefit or disbenefit could possibly be enabled through another type of IT-tool
or if they believed that the aspect was irrelevant for all types of IT-tools. There was time to
investigate the benefit aspect list in six out of the eight interviews, three interviews of each IT-
tool.

11
2.7 Creating two surveys to evaluate IT-tools
With the combined knowledge from literature, workshops and interviews two surveys were
created to evaluate IT-tools. A survey with a user perspective of the IT-tool and a survey with
a company perspective created mainly to assist employees responsible for the evaluation of
IT-tools. Two surveys had to be created as the needs and opinions differ of what a benefit is
(as was seen in the interviews) and that benefits come in many ways, shapes and forms. The
survey with a Scania perspective consists of the categories of financial and performance
benefit aspects (often tangible). And the survey with a user perspective consists of the
operational benefit category and the humanistic benefit category. The two surveys were
verified by receiving feedback in an improvement group at Scania as the surveys were tested
for a third IT-tool C.
2.8 Ranking
In order of ranking the different benefit aspects that had grown from 12 (second iteration) to 22
(fifth iteration) it was ruled too time consuming and difficult to conduct a new ranking
workshop by using the same evaluation matrix as the matrix had grown exponentially. Therefor
the old results from the ranking workshop was used and the new aspects were mapped into the
old in order of obtaining the ranking. The resulting ranking was rounded towards the closest
number without decimals as this process is not very precise. The new benefit aspect which was
most similar to (or had been expanded from) the old benefit aspect obtained the same rank and
weight as the old aspect.
2.9 Validation in improvement groups
The surveys were validated in an improvement group of another IT-tool, in this report referred
to as IT-tool C. Three members answered the surveys from a Scania perspective and three from
a user perspective. The member of the improvement group received the surveys in paper form
and had 20 minutes to answer the different questions and write comments linked to the different
questions. After this stage ten minutes of discussion followed of thoughts of further
improvements and ideas for how the surveys could be further improved as in easier to
understand and use. Feedback concerned if any question was missing, if questions were too
similar and if questions should be separated etc.

12
2.10 Analysis
The base of the analysis has been conducted by comparing the result of each step in the thesis
towards the theory, which can be found in the literature study, but also towards the result of the
other steps.
The results of the brainwriting workshops was analyzed by a reconfiguration the post-it notes
in order of finding which benefit and disbenefits that belonged together and if a main benefit or
disbenefit could be found. The results of the two ranking workshops were compared to each
other in terms of finding the similarities and the differences in terms of what was seen as the
most and least important from the perspectives of Scania employees and by Scania master thesis
students (which was a valuable contribution). But in the end the result from the ranking
workshop with Scania employees was used for the end result of the thesis.
The interviews were analyzed by categorizing the respondents’ answers into Scania’s current
way of working with benefits and disbenefits from IT-tools in a perspective of:
Identification and expectation
Categorization
Ranking
Evaluation
The interviews were also analysed in terms of categorizing the disbenefits and benefits that the
respondents mentioned in terms of:
Financial perspective
Performance perspective
Operational perspective
Humanistic perspective
As already mentioned, if time remained after the interview guide was finished then the
interviewees were questioned about the fourth iteration of the list of benefit aspects. The
respondents answered if aspects from the list was affected by IT-tool A or B, depending on
what IT-tool the interviewee was linked too. A matrix that can be seen on page 34, was created
where the symbol “+” in a cell indicates that most of the interviewees were under the impression
that the corresponding benefit aspect has been affected in a positive way (benefit). The symbol
“–“ in a cell indicates that most of the interviewees were under the impression that the
corresponding benefit aspect has been affected in a negative way (disbenefit). If multiple
interviewees responded that an aspect had been impacted but the majority were uncertain of
how it had been affected then this was marked with an “X” in the matrix.

13
3. LITERATURE STUDY
In this chapter the literature study is presented starting with strategic context of IT and project
portfolio management followed by benefit management, the benefit management process model
and models for benefit categorization.
3.1 Strategic context of IT
When firms create value, they depend on programs and projects to deliver expected benefits
using a successful business strategy (Serra & Kunc, 2015). Strategy in the context of
information systems and IT is the ability to identify and evaluate IT based opportunities and to
define the role of information systems and IT in the organization and in the overall business
strategy (Peppard & Ward, 2004). The information systems strategy is the translation of the
business strategy into processes, information and system investments and change plans
(Peppard & Ward, 2004). The IT strategy maps the business strategy into long term information
architectures, technology infrastructure and resourcing plans to support the implementation of
business strategy (Peppard & Ward, 2004). But there is a lack of methods covering the gap
concerning the difficult task of linking business goals and software related efforts in
organizations (Basili, et al., 2010).
When resources, competences and capabilities are valuable, rare, difficult to imitate and hard
to substitute they can be used to create a valuable strategy and a firm then has a chance to obtain
a competitive advantage (Ward & Daniel, 2012). Knowledge is the foundation on which
capabilities rest and to execute a successful business strategy an organization need to
understand their competitive advantage (Marr, et al., 2004). To maintain or further increase this
advantage the organizations must realise what capabilities that needs to be expanded (Marr, et
al., 2004).
3.1.1 Dimensions of competence
A framework for strategy development was created by Treacy and Wiersema (1993) which
suggests that any organization that want to establish industry leadership should strive to master
one, or even two, of the Dimensions of competence which are operational excellence, customer
intimacy and product leadership. Operational excellence is the discipline which has a specific
approach to production and delivery of products and services in order to lead the industry in
price and convenience (Treacy & Wiersema, 1993). Customer intimacy is the discipline that
always strive to make operations lean and efficient to continually tailor the products and
services to fit a very distinct definition of customers. Product leadership is the discipline that
always strive to produce the latest and greatest products and services, to always pursue new and
better solutions and to always raise the bar (Treacy & Wiersema, 1993).

14
3.1.2 Porter’s five forces A well-known analytical framework known as Porter’s five forces created by Porter (1979)
which is helpful when evaluating the nature of competition in an industry (Porter, 1979).
Porter’s five forces is a classical top-down approach where the business strategy is formulated
by understanding the external market conditions (Marr, et al., 2004). The five forces are threat
of new entrants, threat of substitutes, power of suppliers, power of buyers and industry rivalry
(Porter, 1979). If a strategist understands the forces that affects the competition in the industry
that his or her company exists in then the company’s strengths and weaknesses can be identified,
and an action plan can be created (Porter, 1979).
3.1.3 Resource based theory
Resource based theory is a bottom-up approach based upon the resources tied to the firm (Marr,
et al., 2004). Resource based theory concerns competences and capabilities but information,
systems, technology owned and available to an organization should be seen as increasingly
important resources (Peppard & Ward, 2004). Resources are in general tangible and intangible
assets that the organization can access in order of executing a strategy (Ward & Daniel, 2012).
Competences describes how resources are used via processes and structures. The capabilities
describe the organizations ability to meet opportunity and tackle threats from the external
environment. Benefits management could be considered a competence which gives the
company the capability to exploit IS/IT within their business strategy (Ward & Daniel, 2012).
Stakeholder resources and structural resources can be summarized as knowledge assets (Marr,
et al., 2004). The knowledge assets can be identified when a firm understands their competences
and core capabilities that enables the organization to execute their strategy. The core capabilities
can be found through a top-down approach such as porter’s five forces (Marr, et al., 2004). The
differences in bottom-up and top-down approaches are visualised in fig. 3.
Figure 3. Bottom-up approach (left) vs top-down approach (right) adopted after Marr, et al. (2004).
Porter’s five forces, Dimensions of competence and Resource based theory informs the user of
these strategy techniques what the external market looks like and identifies the company’s
strength, weaknesses, resources, competences, capabilities and eventually their competitive
advantage.

15
3.2 Project portfolio management
Project portfolio management (PPM) is a tool which allows the company to sort projects and
ideas (Josefsson, 2011) based upon the balance between desirability and feasibility while trying
to align and optimize collections of projects (Ward, et al., 2007). PPM is mainly developed
around: creating an overview of all projects, obtaining an economical and risk analysis of each
project, modelling independencies between families of projects, understanding of constraints
on resources shared between projects, creating accountability and governance at a portfolio
level (Calderini, et al., 2005). Which ultimately allows for the ability to prioritise between
projects and with the support of standardized processes and software tools the portfolio can then
be optimized (Calderini, et al., 2005). In fig. 4 the aspect importance to current and future
business has been taken into consideration where the most strategic investments are the ones
that are important to both current and future business (Ward & Daniel, 2012). By adopting the
portfolio approach the resources can be concentrated to the areas deemed most important to the
organization which allows projects to be finished more quickly and thereby deliver business
benefits earlier (Ward & Daniel, 2012). However, the prioritization of IS/IT investments is
challenging and often results in spreading finite resources too thinly to be effective (Ward &
Daniel, 2012). And a majority of organizations seem to fall short of using PPM techniques
effectively within information systems and IT investment projects (Ward, et al., 2007).
Figure 4. “The IS/IT investment portfolio” after Ward & Daniel (2012) digitalized and slightly
modified by author (now read left to right instead of vice versa).
According to Josefsson (2011) the R&D department makes use of an evaluation matrix to score
upcoming IT-projects in terms of benefits: increased customer value (e.g. expected internal
customer satisfaction level of an IT-tool), increased efficiency (e.g. expected time saving and
thereby lowered cost), response to mandatory change (e.g. new upcoming emission laws) and
other benefits (e.g. increased creativity). Where projects with benefits that has a better strategic
fit of the business obtain higher priority, these being long-term strategy (e.g. sustainable
transportation) and dependencies to other projects and programmes (i.e. positive synergy
effects). But the expected benefits are also seen in contrast to the involved project risks such as
risk with the expected benefits (risk of not realizing an expected benefit), risk with project
objectives (i.e. risk of not fulfilling the project objectives with the approved resources), risk
with surroundings (e.g. negative synergy effects) and risk of a technical nature (i.e. technical
feasibility) (Josefsson, 2011).

16
3.3 Benefits management history
A literature review looking through the 25-year history of benefits management was undertaken
by Breese et al. (2015). The authors report that the pioneering development was made in the
90’s, mainly in the UK, by consultancy firms and university departments specializing in
business. What was found is that the methods evolved around some sort of life cycle that guided
its users from identification of benefits to maximization in reality. The best-known example of
this is the benefits management method, sometimes referred to as “the Cranfield method”, that
was developed at the Cranfield School of Management (Breese, et al., 2015).
A key issue that has was discovered is the relationship between projects, benefits and value as
there is no common definition of the word benefit as a management idea and the difference
between value and benefit is unclear and therefor leaves room for interpretation, the word
benefit has earlier also been used in investment appraisal techniques such as cost/benefit
analysis (Breese, et al., 2015).
In the late 20th century the majority of projects that the benefits management pioneers worked
on concerned information systems or IS/IT business change and the clients were often large
companies and organizations both from the private and the public sectors (Breese, et al., 2015).
In the early 2000s various government agencies from the pioneering countries helped produce
further guidance within the subject with a high priority to create value in information
communication technology (ICT) initiatives. In the mid to late 2000s the appearance of social
media such as LinkedIn started to provide opportunities in the form of a forum for benefit
management beginners and experts to consult for support and advice (Breese et al., 2015).
In the 2010s the message is that there is a growing interest in benefit management and it is now
opportunity to obtain certificates in “Managing Benefits” for practitioners to demonstrate skill
and knowledge within the field of benefit management. However, no module existed, within
any master level course (accredited by the official project management organizations), that
included the word “benefit” in the UK in the summer of 2014 (Breese, et al., 2015). But many
courses exist where benefit management content may be included and this means that
practitioners who have the opportunity study benefit management and or taken the certificate
may obtain a specialist status within their organization and thereby be the specialist in benefit
management for this translation process of e.g. benefits vs. value (Breese, et al., 2015).
Benefit management has been showed to increase the probability of obtaining organizational
goals both in general (Serra & Kunc, 2015) and in IT investments (Ward & Daniel, 2012). Still
only a few organizations are utilizing a complete life-cycle benefit management model (Breese,
et al., 2015) such as the benefits management process model.

17
3.4 The benefits management process model
The definition of benefits management is “the process of organizing and managing such that
the potential benefits arising from the use of IS/IT are actually realized” Ward & Daniel (2012).
Benefits management relates to many other techniques and methodologies such as strategic
planning, programme and project portfolio, change management methods, systems
development methodology, project management methodology, risk management techniques
and investment appraisal (Ward, et al., 2007).
The benefits management process (BMP) was developed at the Cranfield School of
Management (Ward, et al., 1996) and is inspired by the model of managing strategic change
and on total quality management techniques (Ward, et al., 2007). BMP has a lifecycle
perspective and uses an iterative process to identify what investments to make according to
what benefits that could be obtained and how the benefits are realized, together with a post
project evaluation, see fig. 5 (Ward, et al., 2007).
Figure 5. Benefits management process model after Ward, et al. (1996).
The first stage is to identify the expected benefits for all the project stakeholders and the changes
that are needed to do realize the expected benefits (Ward, et al., 2007). More successful
organizations are better at identifying and structuring benefits while also including a broader
set of benefit types. It is important to define how each benefit will be measured and state an
expected level of improvement that would be the outcome of the change. This makes it possible
to create a well-defined and realistic business case and a good financial argument to justify an
investment (Ward, et al., 2007).
The second stage of the BMP puts focus on creating a benefits plan and a business case to
justify the investment (Ward & Daniel, 2012). Planning is done by estimating how benefits
will be realized by identifying the actions that are needed to time the new technology with the
organizations ability to utilize it successfully (Ward, et al., 2007). This is done by planning
for process changes, organizational changes and how the benefits are actually delivered while
addressing responsibility for both the benefits and the needed changes (Ward, et al., 2007).
Successful companies have a greater tendency to assign accountability to e.g. business
managers to realize specific benefits (Ward, et al., 2007).
18
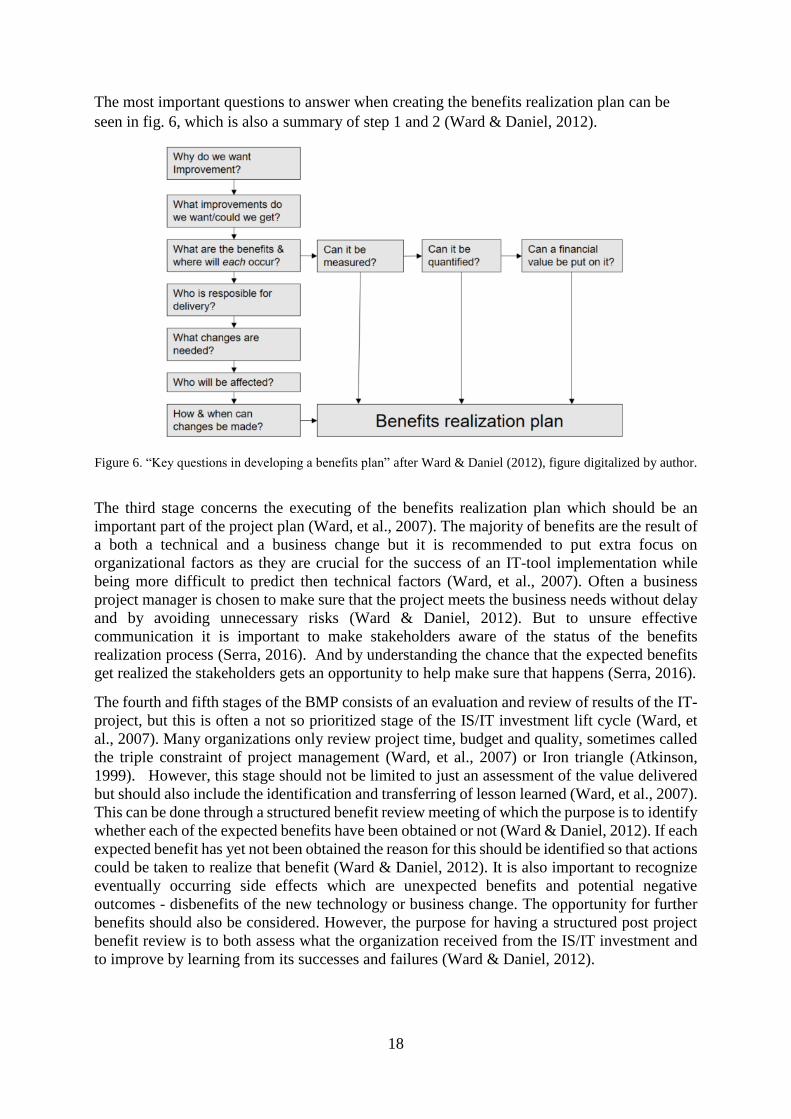
The most important questions to answer when creating the benefits realization plan can be
seen in fig. 6, which is also a summary of step 1 and 2 (Ward & Daniel, 2012).
Figure 6. “Key questions in developing a benefits plan” after Ward & Daniel (2012), figure digitalized by author.
The third stage concerns the executing of the benefits realization plan which should be an
important part of the project plan (Ward, et al., 2007). The majority of benefits are the result of
a both a technical and a business change but it is recommended to put extra focus on
organizational factors as they are crucial for the success of an IT-tool implementation while
being more difficult to predict then technical factors (Ward, et al., 2007). Often a business
project manager is chosen to make sure that the project meets the business needs without delay
and by avoiding unnecessary risks (Ward & Daniel, 2012). But to unsure effective
communication it is important to make stakeholders aware of the status of the benefits
realization process (Serra, 2016). And by understanding the chance that the expected benefits
get realized the stakeholders gets an opportunity to help make sure that happens (Serra, 2016).
The fourth and fifth stages of the BMP consists of an evaluation and review of results of the IT-
project, but this is often a not so prioritized stage of the IS/IT investment lift cycle (Ward, et
al., 2007). Many organizations only review project time, budget and quality, sometimes called
the triple constraint of project management (Ward, et al., 2007) or Iron triangle (Atkinson,
1999). However, this stage should not be limited to just an assessment of the value delivered
but should also include the identification and transferring of lesson learned (Ward, et al., 2007).
This can be done through a structured benefit review meeting of which the purpose is to identify
whether each of the expected benefits have been obtained or not (Ward & Daniel, 2012). If each
expected benefit has yet not been obtained the reason for this should be identified so that actions
could be taken to realize that benefit (Ward & Daniel, 2012). It is also important to recognize
eventually occurring side effects which are unexpected benefits and potential negative
outcomes - disbenefits of the new technology or business change. The opportunity for further
benefits should also be considered. However, the purpose for having a structured post project
benefit review is to both assess what the organization received from the IS/IT investment and
to improve by learning from its successes and failures (Ward & Daniel, 2012).

19
3.5 Models for benefit categorization
It is necessary to identify and categorize benefits in order to understand their purposes
(Andrade, et al., 2016) and benefit “categorization serves the purpose of trying to increase the
understanding between IT organization and business” Gammelgård, et al. (2006).
3.5.1 The Square Route
Atkinson (1999) expressed his view of the need for new success criteria for information systems
and IT project management by calling the traditional success criteria of cost, time and quality,
referred to as the “iron triangle”, for best guesses and a phenomenon. As the iron triangle may
not include all potential project benefits. A model was developed, “The Square Route”, to
include more aspects to accompany the iron triangle in order to understand and include other
success criteria’s such as organizational benefits and stakeholder community benefits, see table
1, however note that the table is not exhaustive (Atkinson, 1999).
Table 1. “The Square route” categorization of information system and IT project management success criteria
adopted from Atkinson (1999).
Iron Triangle
The information system
Benefits (organization)
Benefits (stakeholder community)
Cost Maintainability Improved efficiency Satisfied users Quality Reliability Improved
effectiveness Social and Environmental impact
Time Validity Increased profits Personal development Information quality use Strategic goals Professional learning,
contractors profit Organizational-
learning Capital suppliers, content project team, economic impact to surrounding community.
Reduced waste
Atkinson (1999) describes two types of errors, type 1 errors is when something is done wrong
and type 2 errors is when something is not done as well as it could be or when something is
missing. He then suggests that the single use of the “iron triangle” is a type 2 error that has
traditionally been conducted in project management and that the use of “the square route” could
reduce the type 2 error by providing some missing links. “The square route” introduces three
new areas of success parameters: technical strength of the new system, the direct organizational
benefits and the indirect benefits to the wider stakeholder community (Atkinson, 1999). This
could help managers get a more realistic and balanced idea of project success compared to the
traditional more unrealistic view of project success rate (Atkinson, 1999).

20
3.5.2 Planning and benefit levels Irani & Love (2001) means that there is three types of benefits of two different types of natures,
these being; strategic benefits that are often intangible and non-financial by nature, operational
benefits that are often tangible and financial in nature and tactical benefit could be both
tangible/intangible and financial/non-financial to its nature, see fig. 7.
Figure 7. “Planning and benefit levels” with corresponding natures of benefits after Irani & Love (2001).
Irani & Love (2001) has a specific view of IS benefit categorization and argues that different
types of benefits are linked to planning at different organizational levels and therefore introduce
“planning and benefits levels”. It is suggested that these three levels consist of strategic, tactical
and operational characteristics (Irani & Love, 2001).
Strategic characteristics revolves around the benefits that might need long term planning before
implementation and could for example be about improving future competitiveness and is often
planned by senior management. But managers may not only need to tailor systems to corporate
strategy buy could also be expected to participate in the development of the strategy as well as
the development of systems (Irani & Love, 2001).
Tactical characteristics often concerns resource allocation to meet the strategic goals and are
usually planned by middle management in order of deciding how the objectives are met.
Tactical plans also involve the ability to constantly evaluate the performance of organizational
sub-units to ensure that benefits are met within time and budget (Irani & Love, 2001).
Operational characteristics usually concerns supervising, controlling and variance reporting, it
is about what employee is doing what at a given time in a project and other on-going operations.
Monitoring of budgets and schedules for groups are also often decided upon by operational
employees and line managers but can sometimes even be done by computers due to its
structured nature (Irani & Love, 2001).

21
3.5.3 A model for investment justification in IT projects A conceptual “model for investment justification in IT projects” has been created by
Gunasekaran et al. (2001) in an attempt to address benefits and costs at all levels of the
organization. The method was created to include not only financial performance measures but
also include strategic integration and other intangibles. The model is supposedly offering a
practical, low cost method to determine if the investment in IT is viable from different
standpoints (Gunasekaran, et al., 2001), see table 2.
The Strategic considerations shows the strategic awareness and willingness which are important
for the company to be successful (Gunasekaran, et al., 2001). Resources are identified in the
category of Tactical considerations and project specific success factors are established to obtain
short or medium term tactical success. In the tactical category there is a combination of both
tangible and intangible performance measures. In Operational considerations an operational
evaluation is taking place where project specific operational success factors are identified.
These are small objectives that needs to be achieved every day. Intangibles considerations uses
a continuous evaluation process which cannot be done by a single evaluation procedure in order
not to miss any intangible benefits. Tangibles considerations has a focus of the important
financial and tangible evaluation which should answer the question if the company has the
capability to make the required investment at the given time (Gunasekaran, et al., 2001).
Table 2. “Justification of Investment in IT” by Gunasekaran, et al. (2001), table created by author.
Strategic Considerations
Tactical Considerations
Operational Considerations
Intangibles
Tangibles Considerations
Strategic Objectives of Investment in IT
Performance Indicators
Existing IT Systems
Competitive Advantage
Financial:
Support for Corporate Strategy
Generating Data Data Migration Service to Society Budgets
Top Management Support
Evaluation Methods
Software Job Enrichment Priority of Investment
Competitive Performance Objectives
Security User Perception Quality Improvement ROI
Long-term Costs and Benefits
Involvement of Senior Managers
Servers Improve Customer Relationship
Product Cost
System Integration
Enhance Confidence Market Research
Existing Operations System
Securing Future Business
Alternate Technology
Risk of Not Investing in IT
Profit Level
Revenue
Teamwork Non-Financial:
Good Image Lead-time
Inventory
Labour Absence
Defective rate of Products
Set-up time

22
3.5.4 Benefits categorization method in University - Industry R&D collaborative projects
Andrade, et al. (2016) has created a benefits categorization method that lists identified benefits
in a university-industry collaborative project setting. Through literature 34 benefits were found
of which 19% were categorized as economic benefits, 25% as strategic benefits, 25% as
operational and 31% as social benefits. The benefits were categorized in order of type, nature,
incidence, perpetuity, agent and benefit scope.
Andrade, et al. (2016) also conducted an elementary quantitative study by using statistical
analysis that classified the benefit types in the already stated terms. Fig. 8 shows how the
majority of the respondents in the study classified the different benefits, for operational benefits
it was almost even 44% vs. 56% in terms of benefit nature (Andrade, et al., 2016). For the last
stage that identified the benefit scope the three or four most mentioned scopes of action were
mapped in the figure.
The categorization method shows that all of the four benefit types operational, economic,
strategic and social benefit were identified as valuable for industrial purposes as all affect the
benefit agent of industry or the combination of university and industry. This seems to be
independent of the benefit being of a tangible or intangible nature. This means that both tangible
and intangible benefits prove valuable for the industry. However, it should be noted that
tangible benefits were seen to have a direct but short-term impact where intangible benefits are
indirect but tend to last long term (Andrade, et al., 2016).
Figure 8. How benefits in University - Industry R&D collaborative projects are linked according to “Benefits
categorization method” by Andrade, et al., (2016). The mapping shows how the majority of the respondents
defined the different benefits. The figure and mapping were created by the author of the master thesis through
the provided categorization and statistics of the respondent’s answers study by Andrade, et al., (2016).

23
3.5.5 A categorization of benefits from IS/IT investments A categorization of IS/IT-investments benefits was conducted, by professors at the Department
of Industrial information and control systems at KTH - Royal Institute of Technology in 2006,
based upon a literature review (Gammelgård, et al., 2006). In this benefit categorization the
benefit categories were grouped based upon different views of the business. The three different
views are the “business as a black box”, “resources of the business” and finally as a “structure
of the business organization” (Gammelgård, et al., 2006).
The black box viewpoint sees the company as an unknown system where the benefit categories
are linked to the input and an output of this black box. Input refers to products and services
from suppliers that are consumed by the company. Output refers to products and services that
leaves the company and are delivered to the customers. Note that this benefit group also
contains external relations to third parties that exists in both the input and output and therefore
forms an own type of category (Gammelgård, et al., 2006).
The second group of benefits are connected to the resources of the business existing within, as
a part of, the black box linking the benefit categories to the transformation from business input
to business output. In the second group there are two general types of benefits categories linked
to either human related resources or non-human related resources (Gammelgård, et al., 2006).
The third viewpoint groups benefit categories to the how they relate to the structure of
interrelated components/activities. This viewpoint opens up the black box and examines the
relation within the structure of components both organizational and process oriented. Examples
of benefits categories existing in this viewpoint are management of the structure and flexibility
of the structure (Gammelgård, et al., 2006).
A total of 25 different IS/IT benefit categories was the result that was categorized into the three
main benefit groups (Gammelgård, et al., 2006), see table 3.
Table 3. IS/IT benefit categorization after Gammelgård, et al. (2006) table created by author.

24
3.6 Other performance measurements
3.6.1 Balanced Scorecard
The Balanced Scorecard (BSC) is a measurement of a company’s performance and strategy
(Kaplan & Norton, 1993). The BSC is composed through a top-down reflection that looks
forward to obtaining present and future success. It is not backwards looking as traditional
economical measurements. It integrates both internal and external measurements and helps
companies focus on the measurements that are of key importance for the company strategy. In
practice this means that the business could be seen through four perspectives with a set of
questions that should be answered for each perspective in order of translating the strategy into
measurements see fig. 9 (Kaplan & Norton, 1993).
Figure 9. The Balanced Scorecard is created by linking measurement to strategy, after Kaplan & Norton (1993)
the “Statement of Vision” field has been slightly simplified by the author.
Van Grembergen & De Haes (2005) suggests that the IT governance process could be measured
and improved upon by utilizing an applied version of the BSC. In order to do this, it is suggested
that the perspectives should be changed into future orientation, operational excellence,
stakeholders and corporate contribution. Future orientations would lay the foundation for IT
governance and operational excellences aims to create effective and sustainable governance
over time in order to live up to the stakeholder’s expectations. This could allow for a corporate
contribution which would ensure maximization of profit, strategic alignment and value delivery
at reasonable IT-related risks (Van Grembergen & De Haes, 2005).
3.6.2 Key Performance Indicators
Key performance indicators (KPI) are a measurement of progress towards, or the achievement
of, organizational goals (Shahin & Mahbod, 2007). Each KPI should be based on a criteria’s
which could be further followed up upon. Literature most commonly refer to “SMART”
criteria’s which means that goals should be detailed and specific and thereby either
quantitatively or qualitatively measurable. With delicate balance between attainability and
challenge while being realistic in the work setting and have a set time frame for completion
(Shahin & Mahbod, 2007). However, managers need tools to help the firm define KPI’s to be
able to measure knowledge assets as it is the base for the key strategic organizational
capabilities (Marr, et al., 2004).

25
4. RESULTS
In this chapter the iterations of the benefit aspect list are described, the results from the
interviews, the ranking of benefit aspects and the IT-Tool Evaluator. The iterations are the sub
results of the different stages of the thesis as work progressed towards the final result which is
a tool named the IT-Tool Evaluator.
4.1 Results background study and brainstorming
The first iteration of the benefit aspect list was generated as a result of the background study
and the brainstorming session and can be found in table 4.
Table 4. Result from background study and brainstorming.
4.2 Result brainwriting
The second iteration of the benefit aspect list had the benefit aspects of connectivity and
creativity added as a result of the brainwriting workshop with master thesis students.
Connectivity benefit aspect was defined as a benefit where information is stored digitally and
Benefit aspect
Description Example
Financial benefits
Saved money or increased profit. Reducing cost or increasing earnings.
Efficiency and time benefits
Shorter time to market, shorter time to obtain the same result, free time to explore.
Fewer hours spent doing administrative work.
Quality benefits
Improved quality of the final product and quality of the IT-tool.
Truck that more seldom breaks down, IT-tool that more seldom crashes.
Organizational benefits
Improvements in the organization.
More fluid processes with clear sense of who is responsible.
Soft benefits
Intangible benefits appearing for employees.
Ability for employees to be more creative.
Strategic benefits
Benefit in line with corporate strategy and in line with current and upcoming trends and future challenges.
Supporting the change into electric trucks.
Operational benefits
Small, daily advantages in the daily administrative work.
Making it easier to learn a new IT-tool.
Societal benefit
Benefits for local area and people living in the surrounding area near Scania.
Improving socio economic status of local area.
Technical benefit
Being in line or ahead of competitors from a technical standpoint
Creating a smarter truck.
Environmental benefit
Reducing amount of emissions. Saving material resources such as electricity, CO2,NOX.

26
updated instantly. Creativity benefit aspect was defined as both the ability and the supported
conditions for employees to be creative. The additions that was made to the benefit aspect list
during the second iteration can be found in table 5.
Table 5. The change between the first and the second iteration of the benefit and disbenefit list consists of the
additions of connectivity and creativity benefit aspects.
Benefit aspect Description Example
Connectivity benefit
Information is stored digitally and updated instantly.
Avoiding having information in word and excel documents which needs to be updated manually.
Creativity benefit
The conditions and the ability to explore and generate new ideas that could lead to new solutions for new or old problems.
Time and preconditions to create new valuable ideas.
4.3 Result ranking workshops
In a second workshop with master thesis students the benefit aspects from the second iteration
of the benefit aspect list were ranked using an evaluation matrix, see fig.2. The same process
was repeated with Scania employees at a third workshop that ranked the same benefit aspects.
The results from the ranking workshops are shown in fig. 10.
Figure 10. Ranking by master thesis students at Scania to the left and Scania employees to the right.
The result of the ranking from the workshops are interesting, for example quality was the most
important benefit according to Scania employees and third to last according to the master thesis
students. The ranking by Scania employees was later used to find the weight of each benefit
aspect but it is still interesting to compare the results. Both the students and the employees have
the same four benefit aspects in the top five namely organizational, technical, tactical/strategic
and time/efficiency benefits with the main difference being that Scania values quality above
everything else whereas the students recognized organizational and connectivity benefits, that
information is shared digitally and updated automatically, as the most important benefits.
However, the order of the ranking in the top five most important aspects varied slightly between
the two groups. The groups agreed that societal and environmental benefit was the least

27
important. When the results became clear and the Scania employees could see how low
environmental benefits were ranked the unanimous thoughts were that it was a shame and that
something should be prioritized higher. One idea to why the rank was so low was that it was
hard to understand how an IT-tool could impact the environment.
The result of this stage was the third iteration of the benefit aspects which was identical to the
second iteration in every aspect except one, the third iteration saw societal benefit being taken
of the list due to the very weak result in the ranking workshops see fig. 10. No student or
employee wanted to remove environmental benefit aspect even though the rank was almost as
low as the social benefit aspect.
4.4 Result literature study The stage after the literature study resulted in the fourth iteration now containing 20 different
benefit aspects. All of the aspects were grouped into four main categories being the
performance category, the operational category, the disbenefit category and the humanistic
category. The following changes describes the difference between the third and the fourth
iteration of the benefit and disbenefit list.
Connectivity benefit was renamed into communication benefit. Operational benefit
transformed from a benefit aspects into a benefit category which included employability and
retaining staff benefit, easy to use and learn benefit, planning benefit, flexibility benefit,
decision making benefit, collaboration benefit and communication benefit.
A disbenifits category was created in order to understand the potential disbenifits of
implementing a new IT-tool. Organizational benefits transformed into skill procurement
benefit and employability and retaining staff benefit. Technical benefit was expanded to
technical benefit and security benefit which were placed under the performance category. Soft
benefit was transformed benefit into creating knowledge benefit which was placed under the
humanistic category.
The fourth iteration of the benefit aspect list can be seen in table 6 on the following page.
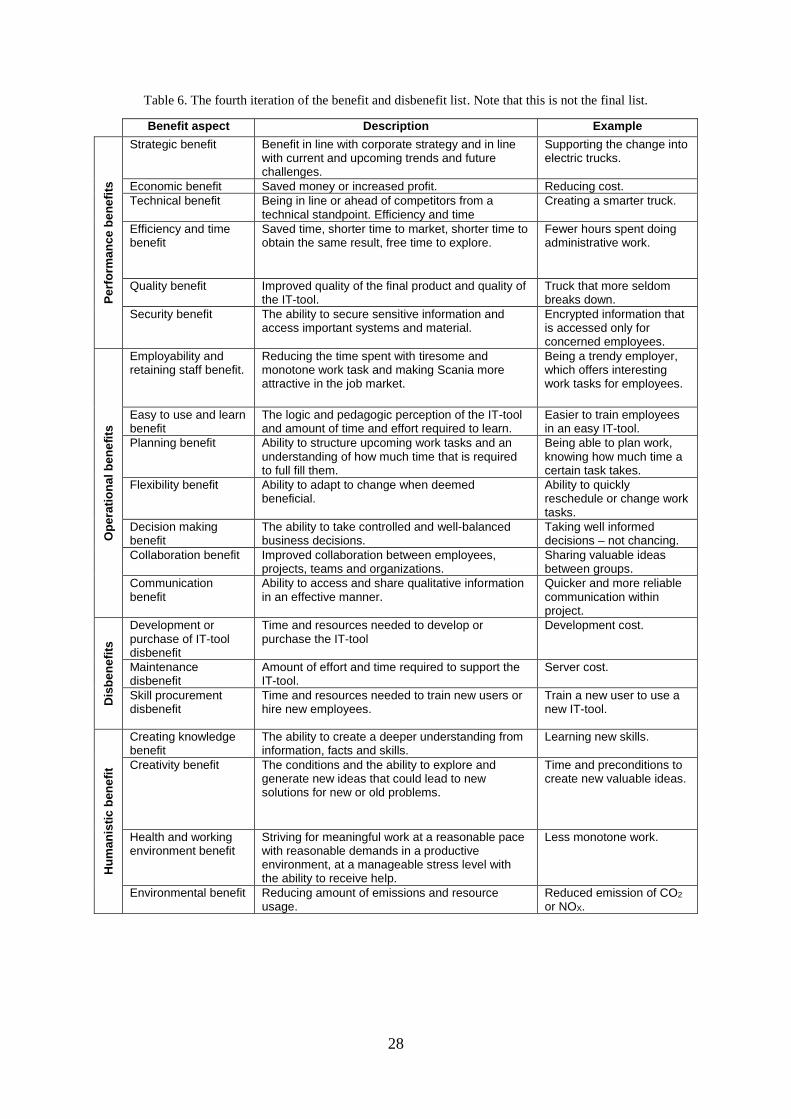
28
Table 6. The fourth iteration of the benefit and disbenefit list. Note that this is not the final list.
Benefit aspect Description Example
Pe
rfo
rma
nc
e b
en
efi
ts
Strategic benefit Benefit in line with corporate strategy and in line with current and upcoming trends and future challenges.
Supporting the change into electric trucks.
Economic benefit Saved money or increased profit. Reducing cost.
Technical benefit Being in line or ahead of competitors from a technical standpoint. Efficiency and time
Creating a smarter truck.
Efficiency and time benefit
Saved time, shorter time to market, shorter time to obtain the same result, free time to explore.
Fewer hours spent doing administrative work.
Quality benefit
Improved quality of the final product and quality of the IT-tool.
Truck that more seldom breaks down.
Security benefit
The ability to secure sensitive information and access important systems and material.
Encrypted information that is accessed only for concerned employees.
Op
era
tio
na
l b
en
efi
ts
Employability and retaining staff benefit.
Reducing the time spent with tiresome and monotone work task and making Scania more attractive in the job market.
Being a trendy employer, which offers interesting work tasks for employees.
Easy to use and learn benefit
The logic and pedagogic perception of the IT-tool and amount of time and effort required to learn.
Easier to train employees in an easy IT-tool.
Planning benefit Ability to structure upcoming work tasks and an understanding of how much time that is required to full fill them.
Being able to plan work, knowing how much time a certain task takes.
Flexibility benefit Ability to adapt to change when deemed beneficial.
Ability to quickly reschedule or change work tasks.
Decision making benefit
The ability to take controlled and well-balanced business decisions.
Taking well informed decisions – not chancing.
Collaboration benefit Improved collaboration between employees, projects, teams and organizations.
Sharing valuable ideas between groups.
Communication benefit
Ability to access and share qualitative information in an effective manner.
Quicker and more reliable communication within project.
Dis
be
ne
fits
Development or purchase of IT-tool disbenefit
Time and resources needed to develop or purchase the IT-tool
Development cost.
Maintenance disbenefit
Amount of effort and time required to support the IT-tool.
Server cost.
Skill procurement disbenefit
Time and resources needed to train new users or hire new employees.
Train a new user to use a new IT-tool.
Hu
ma
nis
tic
ben
efi
t
Creating knowledge benefit
The ability to create a deeper understanding from information, facts and skills.
Learning new skills.
Creativity benefit
The conditions and the ability to explore and generate new ideas that could lead to new solutions for new or old problems.
Time and preconditions to create new valuable ideas.
Health and working environment benefit
Striving for meaningful work at a reasonable pace with reasonable demands in a productive environment, at a manageable stress level with the ability to receive help.
Less monotone work.
Environmental benefit Reducing amount of emissions and resource usage.
Reduced emission of CO2 or NOX.

29
4.5 Result from interviews
Semi structured interviews have been conducted with eight Scania employees regarding two
different implemented IT-tools A and B in order of validating benefit aspects. The interviews
showed that there are different types of users of IT-tools. The author has categorized users as
either data provider or data consumer. The data provider is the user that inputs information into
the IT-tool and the data consumer is the user that retrieves information from the IT-tool, see
fig. 11.
Figure 11. Two main types of IT-tool users: data provider and data consumer.
The respondents were categorized in terms of their connection and work tasks related to IT-tool
A and B, see table 7, but it is very important to note that it is difficult to pinpoint a “binary user
role” for all of the respondents. The author has tried to categorize the different interviewees in
terms of type of usage and overall connection to the IT-tools but most IT-tool users are both
data providers and data consumers to a degree even though the relationship between the user
roles most often vary. It is also difficult to draw a clear line between an active user and a former
user as the users find it difficult to answer how often they use the IT-tools or how long it was
since they last used it (some are seldom users). Table 7 should be interpreted as a description
of the spectra of knowledge regarding the IT-tools that the interviewees represent. The content
of the interviews has been categorized in terms of different benefit aspect perspectives and in
terms of different stages of benefit management. However, the link between what interviewee
said what will not be described as it is too complex to pinpoint the user roles exactly and it
would likely cause more confusion then clarity as there would most likely be seven different
user type profiles (one of the interviewees have never been a user of either IT-tool A or B).
Table 7. An indication of how the different interviewees are connected to IT-tool A and B.
Data Provider
Data Consumer
Former User
Part in Development
Part in Evaluation
Part of Improvement after
Implementation
IT-Tool A
Interviewee 1 X X
Interviewee 2 X
Interviewee 3 X X
Interviewee 4 X X
Interviewee 5 X X
IT-Tool B
Interviewee 6 X X
Interviewee 7 X X X
Interviewee 8 X X X

30
4.5.1 Stages of Scania’s current process of handling benefits and disbenefits of IT-tools
Identification and expectation
One of the interviewees describes existing project processes at Scania where some decisive
documents needs to exist in order of establishing a project. That there are some expected
benefits that are usually described, that an estimation is made of what will be realised and that
there are expected benefits that are realized. Another interviewee proclaims that the expectation
phase is one of the biggest tasks before an initiative is started, that there must be a good business
case, that there are many good ideas, but the question is how much the ideas will pay back to
the company, or parts of the organization, for it to be worth doing. A respondent summed it up
as: “Scania does not do anything if there is no form of benefit, nothing is done because it is fun.
There must be an effect for the organization: process or cost or efficiency that is being improved
or reduced in any form”.
Categorization
A respondent describes that a typical benefit categorization at Scania is the triangle between
cost, time and quality. The respondent also states that he has never seen a clear ranking model
but that there are main benefits that are targeted but also other benefits that would be useful if
they are realized. There are also many different drivers that are identified in different project
models and other things that could be seen as a benefit e.g., is legal demands a benefit?
Another interviewee argues that there are many things that can be considered like customer
value, economical values but in the end, it comes down to creating a competitive company in
the global market that needs to work smart, efficient and earn money.
Ranking
One of the respondents, that is experienced working with benefits, expressed that he has never
seen a clear ranking model, but main benefits and other useful benefits are considered. There is
the main benefit and then comes the rest. Today there is no ranking as from 1, 2, and 3… with
some accomplishing weighting. However, an idea of a ranking can sometimes be found by
trying to understand the context, reading documents and talking to employees linked to the IT-
project in order to understand what is important to them, so one could say that there is a ranking
that is not expressed explicitly. Another interviewee suggests that many matrixes and templates
exist to handle this but it the end all comes down to the total sum of the benefits when
prioritizing between IT-projects.
Another respondent argues that the least important benefits are the benefits that only occur once
such as benefits linked to license agreements, platform related benefits or supplier related
benefits but could later become more important depending on the size. These benefits are small
benefits that add up to make a good business case in the end, but they are usually not the main
drivers for IT-projects.

31
Evaluation
A respondent describes that benefits shall in principle be evaluated but in practice this is not
prioritized very highly as there is low understanding of how Scania could benefit from doing
this. It is also difficult process, and the organization has often changed during the time of the
development of the IT-tool and new projects have already started. However, the same
respondent executed an evaluation of IT-tool A. The outcome of IT-tool A was mapped, and
users were found and interviewed in a group where the users got to answer if the questions were
relevant, if they could answer the questions and what they would then answer. But the
respondent means that evaluations are seldom started if the main driver is not realized. But that
also differs between different parts of the organization and for instance the R&D department
has a strict template and due date for when an evaluation should be completed.
Another interviewee argues that there are different levels of formalization when it comes to IT-
tool evaluations, concrete evaluations are done more seldom, and it is more common that they
are done informally by the organization. The interviewee described that if the company has put
money into an IT-project and it does not meet what has been promised then this will be noticed.
Project responsible attempts to present statistics regarding how the IT-tool delivers the expected
value or not.
One interviewee connected to IT-tool B expressed very high hopes of benefits and claimed that
even non-previously thought of benefits would probably also be realized when the IT-tool
would be evaluated. Another respondent described that more benefits enabled by IT-tool A had
been found when the IT-tool was evaluated.
However, one of the interviewees believes that the IT-tool evaluation method is very limited
today and that there is a lack of depth and a question of really achieving the strategic long-term
goals. The same respondent believes there is good reasons for creating a structured method and
or model to identify benefits in short and long term. Another employee states that it would be
interesting to evaluate at a given time after the implementation of a new IT-tool if the IT-tool
is delivering as promised. One of the interviewees argues that disbenefits are sometimes
considered but that it depends on the specific employee that is responsible for the development
of an IT-tool e.g. the project manager. Another respondent claims that he would personally like
to see a more formal evaluation model as and describes that the evaluation is, in many cases,
done quite arbitrary today and that he sees a lack of standardized evaluations models.
When asked about the possibility for further benefits after IT-tool A was implemented a
response was that there are also a couple of disbenefits (or at least not very good benefit aspects)
that could have been avoided if they had been expected. But that these are not always calculated
for in the current evaluation method e.g. increased maintenance of IT-tools that could
sometimes be avoided

32
4.5.2 Validation of benefit aspects
Financial perspective
Cost is very clearly recognized according to one of the respondents. A respondent also states
that Scania recognizes IT-tools that are cheap to maintain. And one of the important tasks
when starting a new project is to build a good business case as the question is how much
money that is payed back to the company or parts of the organization for it to be worth doing.
But the same respondent also states that it is difficult to measure everything in money even if
he and other employees knows how important something is. An interviewee proclaimed: “It is
not always possible to say how much money that can be charged for something in this way
because it lubricates the organization so much more”.
Performance perspective
The most important benefits obtained through IT-tool A and B is according to the respondent’s
time saved on system owners, improved data quality, structure and control. A benefit of average
importance that has been obtained through one of the IT-tools is that Scania has become more
competitive on the market. Other important benefit aspects of IT-tools are the reusability,
efficiency and time. One of the interviewees describes that an important tangible benefit that is
recognized by parts of the organizations is the ability to technically move the IT-tool within the
organization.
Another interviewee suggested that IT-tools have the potential for great environmental benefits
by reducing the amount of travels needed if meetings could be held using Skype for an example.
However, the same respondent also concluded that no IT-tool can compete with face to face
communication which was concluded by other respondents as well. When asked if any of the
benefit aspects are more important or if any aspect is non-relevant, a respondent expressed that
he believes that depending on where in the organization that question is asked the answer will
be different. The same interviewee than ads that the customers of a premium brand expects
quality and therefor quality as an outcome is the most important benefit aspect from his
perspective.

33
Operational perspective
One of the respondents describes that the ability to limit the time that users, which does not use
the IT-tool very often, spends in an IT-tool that is not easy to use could be seen as a benefit of
average importance. Another respondent has recognized something that is not a benefit but a
disbenefit that has appeared due to the implementation of IT-tool B which is that customers
might have to wait a little longer now due to the increased quality output and outcome compared
to the solution that existed before the IT-tool was implemented. The same respondent describes
that there is always disbenefits when something good is created, it might take a little longer
when done properly but the respondent cannot think of any other disbenefits in the case of IT–
tool B.
An interviewee proclaims that benefits that are generally recognized by Scania is that the
solution is easy to use, easy to learn, that simple is better, and the potential for scalability. The
respondent believes that Scania in general puts the customer first, that it is important to make
the customer free from damage, to create good conditions for the customer. No matter who the
customer is, if it is the driver of the product, the owner of the product or the person that does
the maintenance of the product. No matter where the customer exists in the value chain the
respondent states that he wants the customer to feel like he, or she, only wants to use and buy
products from Scania, therefore it is important for Scania to consider all of the value chain.
Humanistic perspective
One of the respondents means that there is less focus on intangible benefits and it is a question
of how the benefits should be categorized e.g. is usability a material or immaterial benefit? An
important benefit aspect according to the respondent is the transparency - how easy it is to
understand the concept and the whole solution and not only the usability which more concerns
the user interface.
Another respondent acknowledge that the customer should not have to wait to long for a
solution but at the same time the customer needs to have good conditions for their product
during the product life further down the road. For example, the external customer might be
happy with a quick and easy solution, but it might create problems after some time if the
solution is rushed, but if the external customer has to wait a long time for a high quality solution
he might get unhappy with having to wait for too long. There is a balance between doing
something that the external customer appreciations right now and deliver something that has
been done at a correct level.

34
Linking benefit aspects to IT-tool A and B
After the interview guide was finished the interviewees was also asked about the full list of
potential IT-tool benefit aspects as in the fourth benefit categorization model. The response of
the majority of interviewees can be seen is table 8. A “+” marks a benefit and a “–“ marks a
disbenefit in the table marks if the majority believed that the IT-tool in question had affected to
the given aspect.
Table 8. Benefit aspects that a majority of the interviewees claimed had been affected by the IT-tool are marked
by “+” while “–“ marks a benefit aspect that is seen as a disbenefit by the majority. An X marks that the benefit
aspect was seen as affected by the IT-tool it but could not be determined as strictly positive or negative.
Ben
efi
t asp
ect
Ben
efi
t asp
ect
Develo
pm
ent
or
purc
hase
Main
tenance
Skill
Pro
cure
ment
Econo
mic
Qualit
y o
utp
our
an
d o
utc
om
e
Eff
icie
ncy a
nd t
ime
Str
ate
gic
Technic
al
Enviro
nm
enta
l
Em
plo
ya
bili
ty a
nd r
educe
d s
taff turn
over
Man
dato
ry/
leg
al de
man
d
Easy to u
se a
nd learn
Pla
nn
ing
Fle
xib
ility
Securi
ty
Decis
ion m
akin
g
Colla
bora
tion
Com
mun
ication
Qualit
y o
f IT
-too
l
Cre
ating k
now
ledg
e
Cre
ativity
Hea
lth a
nd w
ork
ing e
nviro
nm
en
t
IT-t
oo
l A
-
-
+
+
+
+
IT-t
oo
l B
-
-
+
+
-
+
+
X
+
X
X
+
X
+
+
+
X
X
Two new benefit aspects were added as quality can be both quality of the IT-tool but also quality
that is the output of the IT-tool which is the information quality and the quality outcome to the
final product. The other added benefit aspect is the mandatory and legal demand aspect which
was to begin with not seen as a benefit but is now included. Scania can for example decide to
not fulfil all regulations in all markets but if they do not fulfil all the regulations they are not
able to sell their products on that particular market (Scania is of course following all the laws
and regulations in markets that they are selling their products).

35
Employability and reduced staff turnover, planning and security was not deemed to be impacted
by the IT-tools in question, but it was believed that the reason for this was that the IT-tools was
not naturally linked to any of these benefit aspects. None of the interviewees deemed any of the
aspects to be unimportant but it was questioned whether a single IT-tool could achieve benefits
in terms of all the aspects. All of the benefit aspects from the fourth disbenefit and benefit
categorization model was transferred to the final list of benefit aspects, but a slight re-
categorization was needed after the interviews. The disbenefit category was instead renamed
financial benefit category and the economic benefit aspect (that was previously found in the
performance benefit category) was transferred to this category. Behind this big change was two
reasons, the first was that the aspects categorized under the disbenefit category that existed in
the fourth categorization was seen to be of financial nature (mainly be linked to the investment
and maintenance of IT-tools).
The interviews resulted in the fifth benefit and disbenefit categorization which showed that all
of the 20 benefit aspects of the fourth iteration were relevant. However, the idea of benefits and
disbenefit had to become more general therefore the aspects were regrouped, and two more
benefit aspects added in the fifth and final benefit aspect list.
4.5.3 Benefits for data consumers and data providers
The benefit aspects that are valid for data consumers and data providers are mostly (but not
exclusively) found in the organizational and in the humanistic benefit categories. Examples of
what the data providers acknowledge as benefits are quality of IT-tool, efficiency and time,
easy to use and learn and less maintenance. Some data providers described that having to
provide data for them provides no personal benefits for them. It seen as delivery that is
required by them and sometimes even as a personal disbenefit.
Examples of what the data consumers acknowledge as benefits are the strategic benefits, easy
to use and learn for new employees, less maintenance, technology benefits, improved
information quality, and improved IT-tool quality by the ability to test code and having
sustainable code over time. The data consumers also ask for more transparency in terms of
product data information which is not always available and verifiable to the information owner.

36

37
5. THE FINAL RESULT
The final result of the master thesis is presented in this chapter.
5.1 The final benefit aspect list
The final result, after five iterations, of the benefit aspects list consists of 4 categories and a
total of 22 different benefit aspects which can be enabled by the implementation of new IT-
tools. The aspects have been divided into two tables where the first table describes the benefit
aspects that affects Scania as a company, see table 9, the second table describes the aspects that
affects the user of an IT-tool, see table 10.
Table 9. Scania as a company benefit aspects of IT-tool list.
Benefit aspect Description Example
Fin
an
cia
l cate
go
ry
Maintenance Amount of effort and time required to support the IT-tool.
Server cost.
Development or purchase of IT-tool
Time and resources needed to develop or purchase the IT-tool
Development cost.
Skill procurement Time and resources needed to train new users or hire new employees.
Train a new user to use a new IT-tool.
Economic Saved money or increased profit. Economic result of the IT-tool. Profit – cost.
Perf
orm
an
ce c
ate
go
ry
Strategic Benefit in line with corporate strategy and in line with current and upcoming trends and future challenges.
Supporting the change into electric trucks.
Technical Being in line or ahead of competitors from a technical standpoint. Efficiency and time
Creating a smarter truck.
Efficiency and time
Saved time, shorter time to market, shorter time to obtain the same result, free time to explore.
Fewer hours spent doing administrative work.
Quality output and outcome.
Quality on information in the IT-tool (output) and quality as an outcome of the IT-tool.
Truck that more seldom breaks down.
Mandatory and legal demand
Meeting laws, rules and regulations of different markets.
Following emissions legislation of different countries.
Employability and retaining staff.
Reducing the time spent with tiresome and monotone work task and making Scania more attractive in the job market.
Creating a trendy employer which offers interesting work tasks for employees.
Environmental Reducing amount of emissions and resource usage.
Reduced emission of CO2 or NOX.
The first 11 benefit aspects would be evaluated by someone responsible for a follow up or an
evaluation of a new IT-tool e.g. a project leader or a business IT architect.

38
Table 10. IT-tool user benefit aspect list. Benefit aspect Description Example
Op
era
tio
nal
cate
go
ry
Easy to use and learn
The logic and pedagogic perception of the IT-tool and amount of time and effort required to learn.
Easier to train employees in an IT-tool.
Planning Ability to structure upcoming work tasks and an understanding of how much time that is required to full fill them.
Being able to plan work, knowing how much time a certain task takes.
Flexibility
Ability to adapt to change when deemed beneficial.
Ability to quickly reschedule or change work tasks.
Decision making The ability to take controlled and well-balanced business decisions.
Taking well informed decisions – not chancing.
Collaboration Improved collaboration between employees, projects, teams and organizations.
Sharing valuable ideas between groups.
Communication Ability to access and share qualitative information in an effective manner.
Quicker and more reliable communication within project.
Quality of IT-tool Perceived positive product and service attribute or increased performance such as low amount of problems and high amount of customer satisfaction.
Few bugs in IT-tool or IT-tool that never crash.
Security
The ability to secure sensitive information and access important systems and material.
Encrypted information that is accessed only for concerned employees.
Hu
man
isti
c c
ate
go
ry
Creativity
The conditions and the ability to explore and generate new ideas that could lead to new solutions for new or old problems.
Time and preconditions to create new valuable ideas.
Creating knowledge
The ability to create a deeper understanding from information, facts and skills.
Learning new skills.
Health and working environment
Striving for meaningful work at a reasonable pace with reasonable demands in a productive environment, at a manageable stress level with the ability to receive help.
Less monotone work.
Benefit aspects 12 to 22 would be evaluated by the users of the IT-tool. The users consist of
data providers and data consumers that utilize the IT-tool. All 22 benefit aspects should be
evaluated one year after the IT-tool was first implemented.

39
5.2 The final ranking of benefit aspects
The final iteration of the benefit aspect list was mapped to the ranking of the 12 benefit aspects
that were obtained through the ranking of the early ranking workshop with Scania employees.
The new benefit aspects received the same weight as the closest aspect in the old ranking as can
be seen in fig. 12. The mapping process of the benefit aspects is further described in the method
chapter.
Figure 12. How the new list of benefit aspects was mapped to the old list of benefit aspects in order of getting a
ranking of each aspect. The final ranking results of the list of benefit aspects mapped through the early ranking
workshop with Scania employees can be seen to the right
5.3 Two surveys
Survey questions as a concept was chosen to efficiently gather information related to the
identified benefit aspects of IT-tools. In order to obtain quantitative results the questions were
formulated as e.g. “the IT-tool is efficient and time saving” where the respondent would answer
the questions on a scale from 1-10, from “I do not agree at all” to “I fully agree”. As the wide
array of benefit aspects differs in terms of nature, size and whom it benefits that a single survey
would become very lengthy and complex. It would also be near impossible to find candidates
that were able to fill in the survey both in terms of knowledge and experience, even so it would
also be very time consuming for each candidate. To make the survey more manageable it was
divided into two surveys. A survey for the employee(s) responsible for the official evaluation
of a specific IT-tool and a survey for the users of the specific IT-tool. The two surveys should
be answered one year after implementation of a specific IT-tool. One of the surveys should be
answered by the users of the IT-tool answering questions revolving benefit aspects from an
operational category view and a humanistic category angle. Such as if the IT-tool is easy to use
and learn. The other survey should be answered by the employee(s) responsible for the formal
evaluation of the IT-tool by answering questions related to financial and performance figures.
The two surveys can be found in appendix A3 and A4.

40
5.4 Survey validation and feedback
The surveys were validated in the improvement group for IT-tool C by having the members of
the improvement group fill out the surveys and give feedback. The improvement group
expressed that it would be easier to answer the surveys digitally instead of answering the
surveys on paper as was intended at the time. A few mistakes were made by the improvement
group members while filling out the surveys that supported this view, such as submitting
multiple contradicting answers on a single question or that a question was missed and no answer
was given. Mistakes that could have been avoided if the surveys would have been answered
digitally in e.g. Microsoft Forms.
The improvement group also explained that it would be useful to gather some information about
the survey respondents such as job description, education and age of respondent, amount of
specific IT-tool experience and in what context the respondent use the IT-tool. The
improvement group also expressed that it was difficult to evaluate a complex IT-tool such as
IT-tool C which has many different subsystems of varying quality. Another problem that
surfaced was that IT-tool C was not newly implemented which meant that some survey
questions became irrelevant, however this should not be a problem if the evaluation was carried
out one year after the implementation of a new IT-tool as suggested.
Other input from the improvement group was that the survey questions regarding trends and
challenges are closely linked. The opinion about the question regarding time and resources was
the opposite meaning that time and resources can be different things and therefor the question
should be separated. Another common view was that it is not easy to evaluate so many different
benefit aspects with a low amount of preparation even though the surveys were sent digitally
prior to the meeting. Some members also described that not all employees like changes which
could be a problem for the evaluation of a new IT-tool if old IT-tools in general are preferred
independent of the benefit aspects of a new IT-tool.
Other important feedback concerned the scalability of the surveys. That it would be extremely
time consuming to translate the results of the surveys into a corresponding excel document if
the surveys had many respondents. This was an important argument to import the surveys into
Microsoft forms surveys as it was deemed to be both easier to answer and easier to analyse due
to the ability to import the result into Microsoft Excel instantly. Some feedback also concerned
that some questions were hard to interpret. One of the members of the improvement group
explained that the IT-tool C is old and is going to be replaced. Another member of the
improvement group said that it would be interesting to use the surveys one year after the
implementation of the new IT-tool that is replacing IT-tool C and compare the results to identify
the benefits and disbenefits of the new IT-tool.
The conclusion from the survey validation stage was that the surveys were imported into
Microsoft Forms surveys and that a clear definition for every benefit aspect was needed.

41
5.5 The IT-Tool Evaluator
New IT-tools should be evaluated through the two surveys that can be found in appendix: A3,
A4. The benefit aspects are evaluated using one or multiple statements that is scored by the
respondents on a Likert scale 1 – 10, from “I don’t agree at all” to “I fully agree” referring to
the statement. A calculation template was created in MS Excel. The calculation template takes
the average of each benefit aspect score obtained from the two surveys. An unweighted
average score of each benefit aspect is then obtained which is multiplied with the weight of
the ranking of that particular benefit aspects to obtain the weighted average score of each
benefit aspects. The score of each benefit category is then obtained by summarizing the
weighted scores of each benefit aspect included in the benefit category. The total score of the
IT-tool is obtained by summarizing the weighted category scores. The unweighted scores of
each benefit aspect within each benefit category is visualised in radar diagrams at the end of
the excel document. When the calculation template has been filled out the template becomes a
scorecard. The scorecard for IT-tool C can be found in appendix: A2.
The IT-Tool Evaluator consists of multiple documents. It uses two surveys to gather
information concerning the benefit aspects of an IT-tool. The information is then analysed and
a result is calculated in the calculation template using the weights of the benefit aspects
obtained through mapping the result of a workshop.

42
5.6 Evaluation of the IT-Tool Evaluator
The IT-Tool Evaluator was tested on IT-tool C and a summary of result of IT-tool C can be
found here with included unweighted results in radar diagrams in fig. 13.IT-tool C scores a total
score of 717 points which is 53.5% of the maximum score:
104 points comes from the financial category (65% of max. financial score).
321 points comes from the performance category (64.2% of max. performance score).
55 points comes from the humanistic category (36.7% of max. humanistic score).
237 points comes from the operational category (44.7% of the max. operational score).
Figure 13. Radar diagrams out of the unweighted score of each benefit aspects for IT-tool C within each benefit
category.
The conclusion that can be drawn from this first test of the IT-Tool Evaluator is that IT-tool C
obtains good scores in terms of benefit aspects found in the survey that evaluates the IT-tool
from a company view but the IT-tools receives a low score in terms of the user benefit aspects.

43
6. DISCUSSION AND ANALYSIS
This chapter contains a discussion and an analysis of the result.
6.1 The evolution of the IT-Tool Evaluator
At the stage of the two ranking workshops both the participating students and employees
expressed that it was a shame that the environmental benefit aspects had not achieved a higher
rank. No one wanted it to be deleted from the list even though it had one of the lowest ranks
and corresponding weight. It is believed that the reason that environmental benefit aspect
obtained a low rank due to most workshop participants had a hard time of understanding how
an IT-tool could have a noticeable impact on the environment. At the time discussions were
held about lowering the environmental impact of IT-tools by electricity savings in e.g. a server
hall or potentially reducing the need for physical paper copies in the office. As work progressed
during the thesis work it became clear to the author that there are many situations where the
implementation of new IT-tools could enable environmental benefit opportunities. A good
example of such an opportunity came up during the interview stage as an interviewee suggested
that IT-tools could reduce the need of traveling. If such knowledge had been available and
shared at the workshop, then the environmental benefit aspect might have obtained a higher
rank and weight.
A conclusions from the workshop stages was that it was apparent that many benefit aspects
were too broad to be fully grasped and properly ranked. A lesson learned at the stages of ranking
workshops was that there was no clear separation between some of the benefit aspects and
therefore it was difficult to rank them. For example, organizational benefit aspect was about
improving the organization (organizational efficiency) while the benefit aspect of efficiency
and time was about obtaining benefits in terms of general efficiency. The operational benefit
aspect was about improving company operations (operational efficiency). All of the three
benefit aspect mentioned above are very much linked together without clear separation. The
idea of incorporating these three benefit aspects in the first and second iteration of the benefit
aspect list came by inspiration from the Iron Triangle that Scania has traditionally used (time
and efficiency) combined with the benefit aspect of organizational benefits from “the Square
route” by Atkinson (1999) with operational considerations added from the “Justification of
investment in IT project” by Gunasekaran, et al. (2001). However, the benefit aspects inflicted
on each other, which is the case to a certain degree no matter how a benefit aspect categorization
is made e.g. most benefit aspects tend to create opportunity for efficiency improvements, cost
savings or increased profit, either directly or indirectly. What is important is to categorize the
benefit aspects in terms of directly generated benefit opportunities. When benefit aspects
inflicts or overlaps each other to a high degree it is difficult to rank and evaluate the outcome
of a single benefit aspect as is the total outcome of a new IT-tool implementation as some
benefit opportunities might be counted multiple times.

44
The interviews played a key role of separating different benefit aspects such as the quality
benefit aspect that was separated into the benefit aspects of “quality of the IT-tool” and “quality
output and outcome”. The data from the interviews was categorized into the four benefit aspect
categories which are the financial, performance, operational and humanistic benefit categories
which was done by inspiration from the Benefits categorization method in University-Industry
R&D collaborative projects by Andrade, et al. (2016). This was done as it was seen to be a very
intuitive way of categorizing the benefit aspects but small changes were made. Social category
was widened into a humanistic category, strategic category was widened into a performance
category and economical category was renamed financial category (economical benefit aspect
is included within the financial category).
An area that was discussed during the workshops, that was also found in the literature study
was also discussed during the interviews – all benefit aspects can turn out to be positive or
negative. It comes down to the differences in benefit aspect scores between the replaced IT-tool
and the newly implemented IT-tool. A reduced disbenefit can also be seen as a benefit and a
reduced benefit should also be seen as a disbenefit. E.g. if an old IT-tool is scored 7 in terms of
flexibility and the new IT-tool is scored 5 on the same benefit aspect then this becomes a slight
disbenefit in this benefit aspect. This benefit aspect of the new IT-tool should be seen as a
benefit if there was no pre-existing IT-tool that handled the same work tasks. However, most
often there is some type of IT-tool that handles the tasks that is taken over by the new IT-tool,
very seldom paper and pen is used today, it could be as simple as an Excel-sheet that handled
the task prior to the new IT-tool and in such case Excel should be evaluated based upon how
well it solves these tasks and compared to the new IT-tool.
What was discovered in the interview phase is that the perception and ways of working with
benefits and disbenefits depends on the IT-project and the employees linked to the IT-project.
When it comes to recognized benefit aspects data providers often claim to see the benefit of not
having to learn a new IT-tool and the saved amount of time (usually on administrative work
tasks). The benefit aspect of easy to use and learn, and efficiency and time exists in the
operational level of benefits as seen through the “Planning and benefit levels” by Irani & Love
(2001). Some data providers expressed that they look upon some IT-tools as a personal
disbenefit as it is time consuming to provide the data and that they did not see much personal
benefit of the IT-tool themselves except to double check information at a later stage. The data
providers hoped that the data consumers obtained benefits due to the time that they put into the
IT-tool even though they did not receive any feedback from the data consumers. At least one
of the data consumers asked for more transparency in terms of data which is not always
available and verifiable to the information owner. It would also be beneficial for the data
providers to understand how the information is used and by whom. This would motivate data
providers by making them understand why the information is important. It would also educate
the data providers why certain information might have to be duplicated and provided in multiple
IT-tools. This would inform the data consumers about the source of which the information
comes from. This would open for two-way communication between the data provider and the
data consumer.

45
Business IT architects are often involved in the development and the evaluation of IT-tools at
Scania and were seen to have a strategic mind-set with a great overview of the business and the
product development processes with a good overview of the benefits and the disbenefits at the
strategic level as seen by Irani & Love (2001). The difference in mind-set, experience and work
tasks between different employees were a couple of the reasons to develop two different surveys
to gather data about the IT-tools within the IT-Tool Evaluator from the two different benefit
aspect lists.
As the amount of benefit aspects grew with every new iteration of the benefit aspect list, as was
the scope of each benefit aspect narrowed and the precision of the IT-tool evaluation increased
but so was the time and effort required to gather and analyse data using the two surveys. This
was another reason to make two different surveys to handle the increasing amount of benefit
aspects in the four benefit aspect categories. The surveys consists of statements relating to the
benefit categories and the respondents answers how much he or she agrees with the statements.
The evolution of the benefit aspect lists is visualized in fig. 14 as the amount of benefit aspects
grew, each aspect became narrower. The areas of which the circles overlap represents how
much the benefit aspects inflict upon other aspects. The overlapping areas should be reduced
as much while the coverage of the maximum potential benefits (big circle) should be maximized
while still keeping the number of benefit aspects down to a manageable level.
Figure 14. An illustration of the difference in how the different benefit aspects, represented by an arbitrary
amount of blue circles, inflict on each other (dark blue areas) between the first and the final iteration of the
benefit aspect lists. The large circle is a theoretical representation of the sum of all possible benefits that could be
enabled through a perfect IT-tool. Notice that the benefit aspects included within the final iteration of the benefit
aspect list still has some overlaps and still is not covering all areas of potential benefit aspects even though
overlapping has been decreased and the coverage of potential benefits have been increased.
The result of the thesis was created with the mindset of creating something that stands on a
strong theoretical foundation but can also be practically applied by Scania. For instance, the list
of benefit aspects could have been made even more extensive but this would have been a
problem as the surveys would become too extensive to use in practice. This was another reason
to make two surveys in order of not overwhelming the respondents. This was also practical as
it was seen that the disbenefits and benefits affect different employees in different ways and
therefore the aspects could be split into two different surveys naturally.

46
6.2 Levels of the IT-Tool Evaluator
The IT-Tool Evaluator also make use of the “Planning and benefit levels” by Irani & Love
(2001) to sort the different benefit aspects into the four benefit aspect categories. The traditional
benefit classification of the iron triangle of quality, time and money (Atkinson, 1999) could be
seen as the core of the IT-Tool Evaluator. The reason to use the iron triangle in the centre was
formulated well by an interviewee: ”everything ends up in monetary terms, thus in economy in
the end, it is just a question in how many steps is it before we can measure this in some form of
economic figures”.
The four categories are linked to the iron triangle but expanded with multiple levels to include
many more benefit aspects which are hard to distinguish using the iron triangle. A visualisation
of how elements from the different models that have influenced the IT-Tool Evaluator can be
found in fig. 15.
Figure 15. The link between the traditional iron triangle, “Planning and benefit levels” by Irani & Love (2001)
and the authors own categorization which was to a degree derived from Andrade, et al., (2016).

47
6.3 Translation issues
6.3.1 Various perspectives A lot of papers have been written in the field of benefits enabled by IT-tools in the last decades
and many different types of benefit categorization models have been created, yet there is no
clear standard adopted by the industry besides perhaps the traditional iron triangle of time and
cost saved and improved quality. As it turns out no benefit categorization model that has been
considered in this thesis work have been deemed to be false, it is a question of something that
that it could have been made better as suggested by Atkinson (1999). It is different viewpoints
of benefits and disbenefits where some models have a lesser or greater comprehensive view
than others. It seems that depending on who you ask about benefits you will get a different
response. Employees working close to technical systems will likely respond in highly technical
terms with clear details of an improved solution when asked about benefits enabled through a
certain IT-tool. Project managers will likely respond with an answer from a higher view point,
likely circling the problem. However, both answers contain valuable information regarding
what the IT-tool does well and how it could be improved. Both incremental and radical
improvements are valuable for an organization and size of linked investments will likely also
vary widely. One of the most important things about the IT-Tool Evaluator is that it combines
theory and different views and creates something practical that could be used in the industry –
a score card template with pre-identified and pre-ranked benefit aspects with two corresponding
surveys just to be sent out to gather data for the template from two different views. The surveys
that have been created in this master thesis is an attempt to pick up as many different types of
perspectives and is meant be as universal as possible to be used for many different types of IT-
tools.
6.3.2 Benefits, drivers, goals and value
Some employees speak in terms of drivers or main drivers behind IT-projects (reason to do the
project) where others speak of project goals. There is another saying for this which is creation
of business,, stakeholder-, and shareholder value. A third view is the idea of realizing expected
(and sometimes unexpected) benefits. And finally, there is no common definition of a benefit,
it seems that there is a translation issue as suggested by Breese, et al. (2015). Gammelgård, et
al. (2006) for example makes no distinct difference between business value and benefits. The
problem with expected benefits is that it implies that the new IT-tool is always better than or at
least as good as the IT-tool that it is replacing, in every aspect and this should be seen as
unlikely. Therefor the author chose to call expected benefits (and potential disbenefits) for
benefit aspects until an evaluation has been done and the difference in benefit aspect scores
between two IT-tools can be evaluated and benefits and disbenefits between the two IT-tools
can be declared. The benefit aspect could be seen as expectation/evaluation criteria’s of IT-
tools.

48
6.3.3 Clarification The author argues that a benefit could be seen as an increase of stakeholder value and a
disbenefit is the decrease of such value. The benefit aspect values are represented by the scores
of the surveys included within the IT-Tool Evaluator. To clarify and share the view of the author
an overview was created of how different pieces of the thesis relates to each other. This
overview can be found in fig. 16. The proton (+) and electron (-) shaped figures represent
negative and positive benefit aspects of the outcome of the IT-projects i.e. benefits and
disbenefits.
Figure 16. An overview of how disbenefits and benefits are linked to projects, programs and strategy and how
the IT-Tool Evaluator fits into the ecosystem of measurements. Note that the IT-Tool Evaluator can be used in
many different stages of IT-tool projects that are independent or included in a program of projects.
The core of the company is the strategy. A company performance and strategy evaluation can
be made by the use of the BSC (Kaplan & Norton, 1993). The strategy consists out of a vision
which is often quantified in certain organizational goals. The organizational goals are achieved
through projects or programs of IT-projects. The organizational goals can be measured using
KPI (Shahin & Mahbod, 2007). Business cases are created in the expectation phase where IT-
project outcomes are expected. The predicted positive IT-project outcomes are known as
expected benefits or drivers. The most important expected benefits are sometimes called main
drivers as was seen in the interview stage. When an IT-project driver or expected benefit have
been realized then value have been created and the benefit realized. Depending on who obtains
the value either shareholder or stakeholder value has been created. An example of shareholder
49
value could be extra profit for the company owners and an example of stakeholder value could
be a better working environment for an employee.
The IT-Tool Evaluator has a focus on evaluations of IT-tools but can also be used in the
expectation phase and in the development phase of IT-tools. In the expectation phase the
company focused survey (that is later used by the employee that is responsible for the formal
evaluation one year after IT-tool implementation) can be used to estimate how the new IT-tool
would perform in terms of the performance and the financial categories.
The IT-tool user survey should also be kept in mind to set up goals for the new IT-tool, but it
would be hard to estimate the benefit aspects in the operational and humanistic benefit aspect
categories before the users can test the IT-tool. During the development phase different
employees should be made responsible for different benefit aspects or categories and keep them
in mind during the development in order of obtaining a good result (benefits) in terms of those
particular benefit aspects, as recommended by Ward & Daniel (2012).
6.4 Limitations of the methods used in the thesis
The author of the thesis decided to use the same interview guide for all the respondents as it
was believed that it would be easier to analyze the data afterwards. This might have been the
case but some of the interviewees that were interviewed as IT-tool users had a hard time
answering many of the questions regarding project - and benefits management as they had little
to no knowledge about that area. The interviewees received the interview guide prior to the
interview and were told that they were allowed to skip questions if they were unable to present
a qualified answer. However, it was sometimes observed that some of the respondents tried to
guess how Scania usually handles those types of questions. The answers could be in line with
“I think this is how it is done, but I am not sure”. These types of answers were taken out of the
analysis as they were seen as best guesses. It would probably have been better to create two
different interview guides depending on the link between the interviewee and the IT-tool just
as two surveys were later created. This was an important insight from the interview stages of
the thesis and one of the reasons that two different surveys were created to avoid this problem
in the future for Scania when implementing the IT-Tool Evaluator. Another limitation in this
thesis is the fact that it was difficult to distinguish clear boundaries between former users, data
consumers and data providers.

50
6.5 Limitations of the IT-Tool Evaluator
In the long term it would be valuable for Scania to have every IT-tool evaluated with the IT-
Tool Evaluator in order for Scania to understand their IT/IS capabilities. With this knowledge
it would be much easier for Scania to understand what IT-tool that need to be replaced.
However, in reality it would be near impossible to score so many IT-tools especially as some
IT-tools are old and some used for many various tasks with a variety of subsystems and
integrations with other IT-tools. But it is important that as many as possible of the old IT-tool
are scored so that the new IT-tools can be compared to the old in order of evaluating what
benefit aspects that have become benefits and what benefit aspects that have become
disbenefits.
If an internal customer requests a new IT-tool solution for a growing need or problem that is
currently handled by a pre-existing IT-tool that is not evaluated than the R&D department
should request an evaluation of the old IT-tool. In many cases some tasks are handled via large
third-party IT-tools such as Excel and in such case the use of such an IT-tool should be
evaluated in terms of how well it fulfils the particular need and how it handles the given problem
that the internal customer is requesting a tailor-made IT-tool to solve. This means that some
large third-party IT-tools might have to be evaluated multiple times as they are used to handle
various different tasks. In the end the most widespread and important needs handled by the
lowest performing IT-tools should prioritized to be replaced.
The ranking of benefit aspects was affected by having to map the new benefit aspects lists into
the old benefit aspect list. It is also affected by the fact that many of the new aspects get a high
ranking as there are more aspects now than before and that the social benefit aspect that had the
lowest rank was removed from the benefit aspect lists. The ranking could be redone in order of
obtaining a higher precision, however using the same evaluation matrix would take a lot of time
and effort as the matrix grows exponentially divided by two.

51
6.6 Future work
Future work should prioritize to setup more workshops with more users of IT-tools and let them
rank the benefit aspect in order of obtaining more precise weights for the benefit aspects,
especially the ones connected to the IT-tool users.
Another idea for future work would be to further explore the differences between data
consumers and data providers as there was limited respondents in this thesis that was
categorized as either pure data consumers or pure data providers. The IT-tool user survey could
potentially be split into a data consumer survey and a data provider survey in order to make the
IT-Tool Evaluator even more precise and efficient. This of course depends on what types of
users that are linked to the IT-tool that is evaluated and if a clear distinction between data
consumer and data provider can be made.
The IT-Tool Evaluator needs to evaluate both a pre-existing and a new IT-tool where the result
is the difference in score between the two, this means that an assumption has been made that
all new IT-tools replace old IT-tools. This means that the internal customer need cannot change
too much over time in order to obtain a reliable score. It would for example be difficult to
evaluate the benefits enabled through different IT-tools if the IT-tools represents the solutions
for different needs or problems. Or if the solutions to these needs and problems have big
differences in IT capabilities and functions or if the IT-tools have different existing system
integrations to other IT-tools which would make the boundaries to other IT-tools fuzzy.
Using the IT-Tool Evaluator as intended in the current state means that the aspect scores are
seen as fixed over time which is a simplification. It is likely that the aspect scores change over
time even after one year after the implementation of a new IT-tool. Users will continue to
understand how to fully utilize the new IT-tool, new improvements or functions might be added,
some new users might appear, some old users might stop using the IT-tool (by many different
reasons) and it is hard to fully predict how the IT-tool will perform over a five-year term which
is the current length of time that Scania evaluates benefits of IT-tools. Let us assume that the
curves showed in fig. 17, represents the true scores of two different benefit aspects over the first
five years after the implementation of a new IT-tool. The benefits aspect represented by the red
curve has a higher value than the benefit aspect represented by the blue curve right after the
implementation (when time equals 0) and also at the evaluation point one year after
implementation.
Figure 17. The blue and red curves represent two theoretic benefit aspect scores over the first five years after the
implementation of a new IT-tool. For future work it would be interesting to monitor benefit aspect scores over
time as the time of evaluation could impact the scores, the internal customer need might change or IT-tool usage
could mature over time and thereby give different IT-tool scores.

52
However, the areas under both curves are of similar size which could be interpreted as the total
amount of benefit aspect value over the life of the IT-tool. The benefit aspect represented by
the blue curve gives Scania an increased benefit in the end of the five-year term and might be
reason for not exchanging the IT-tool for multiple years to come. To gain this information about
how the benefit aspect scores change overtime the surveys could potentially be revisited (more
certain and more time consuming) or a dynamic layer could be implemented into the surveys
where respondents could be asked about prior, current and future estimates of the benefit aspect
scores (less certain and less time consuming). These are some suggestions for future work. The
true challenge comes down to finding balance between accuracy, versatility and efficiency with
the IT-Tool Evaluator in order to create opportunities to generate stakeholder value.

53
7. CONCLUSION
The purpose of this master thesis was to develop a tool to make the R&D department at Scania
able to identify, categorize, rank, and evaluate benefit aspects enabled by IT-tools. Literature
studies, workshops and interviews were performed in order to develop a tool that came to be
known as the “IT-Tool Evaluator”. The difference in benefit aspect scores between a new and
a replaced IT-tool declares if the new IT-tool has enabled benefits or disbenefits for the IT-tool
users and the company. The IT-Tool Evaluator fulfils the four criteria of the purpose of the
master thesis by giving its user the ability to identify, categorize, rank and evaluate benefit
aspects enabled by IT-tools.
IT-tool evaluations by the use of the IT-Tool Evaluator are composed by data collection by two
different surveys, a survey for IT-tool users and a survey with a general Scania company
perspective. The data from the surveys are forwarded into an Excel template which generates
an evaluation in the form of a scorecard which includes radar diagrams of the unweighted
benefit aspect scores of each benefit category. These are the operational benefit category, the
humanistic benefit category, the performance benefit category and the financial benefit
category.
Scania and the R&D department would potentially enable more benefit opportunities and less
disbenefits by implementing the IT-Tool Evaluator as a standardized evaluation of IT-tools.
Evaluations should be requested by the R&D-department one year after the implementation of
a new IT-tool.

54

55
8. LIST OF REFERENCES
Andrade, R., Fernandes, G. & Tereso, A., 2016. Benefits Management in University-Inudstry
R&D Collaborative Projects: A Review on Benefits and Success Factors. u.o., Elsevier B.V.,
pp. 921-927.
Atkinson, R., 1999. Project management: cost, time and quality, two best guesses and a
phenomenon, its time to accept other success criteria. International Journal of Project
Management Vol.17, No. 6, pp. 337-342.
Basili, V. R. o.a., 2010. Linking software development and business strategy through
measurement. IEEE Computer 43, no.4, pp. 57-65.
Blomkvist, P. & Hallin, A., 2015. Metod för teknologer : Examensarbete enligt 4-fasmodellen.
1:4 red. Lund: Studentlitteratur AB.
Breese, R., Jenner, S., Serra, C. E. M. & Thorp, J., 2015. Benefits management: Lost or found
in translation. International Journal of Project Management 33, pp. 1438-1451.
Calderini, S. R. o.a., 2005. The Impact of Project Portfolio Management on Information
Technology Projects, London: Ashridge Business School UK.
Carlson, C. R. & Wilmot, W. W., 2006. Innovation : the five disciplines for creating what
customers want. 1st red. New York: Crown Publishing Group.
Gammelgård, M., Ekstedt, M. & Gustafsson, P., 2006. A Categorization of Benefits From IS/IT
Investments. Stockholm, u.n.
Gunasekaran, A., Love, P., Rahimi, F. & Miele, R., 2001. A model for investment justification
in information technology projects. International Journal of Information Management 21, pp.
349-364.
Heslin, P. A., 2009. Better than brainstorming? Potential contextual boundary conditions to
brainwriting for idea generation in organizations. Journal of Occupational and Organizations
Psychology, Volym 82, pp. 129-145.
Hove, S. E. & Anda, B., 2005. Experiences from Conducting Semi-Structured Interviews in
Empirical Software Engineering Research. u.o., ResearchGate.
Irani, Z. & Love, P., 2001. Developing a frame of reference for ex-ante IT/IS investment
evaluation. European Journal of Information Systems.
Josefsson, S., 2011. Expected Benefits in Business Development Projects, How to Formulate
and Evaluate, Uppsala: Uppsala Universitet.
Kaplan, R. S. & Norton, D. P., 1993. Putting the Balanced Scorecard to Work. Harvard
Business Review, Volym September-October.
Marr, B., Schiuma, G. & Neely, A., 2004. Intellectual capital - defining key performance
indicators for organizational knowledge assets. Business Process Management Journal, 10(5),
pp. 551-569.

56
Mossalam, A. & Arafa, M., 2016. The role of project manager in benefits realization
management as a project constraint/driver. HBRC Journal 12, pp. 305-315.
Peppard, J. & Ward, J., 2004. Beyond strategic information systems: towards an IS capability.
Journal of Strategic Information Systems 13, pp. 167-194.
Porter, M. E., 1979. How competitive forces shape strategy. Harvard Business Review, pp. 137-
145.
Rabionet, S. E., 2011. How I learned to Design and Conduct Semi-structured Interviews: An
Ongoing and Continuous Journey. The Qualitative Report , 16(2), pp. 563-566.
Serra, C. E. M., 2016. Benefits Realization Management : Strategic Value from Portfolios,
Programs, and Projects. Boca Raton, Florida: Taylor and Francis Group.
Serra, C. E. M. & Kunc, M., 2015. Benefits Realisation Management and ins influence on
project sucess and on the execution of business strategies. International Journal of Project
Management 33, pp. 53-66.
Shahin, A. & Mahbod, M. A., 2007. Prioritization of key performance indicators : An
integration of analytical hierarchy process and goal setting. International Journal of
Productivity and Performance Management, 56(3), pp. 226-240.
Treacy, M. & Wiersema, F., 1993. Customer Intimacy and Other Value Disciplines. Harvard
Business Review, 71(1), pp. 84-93.
Van Grembergen, W. & De Haes, S., 2005. Measuring and Improving IT Governance Through
the Balanced Scorecard. Informations Systems Control Journal, Volume 2.
Ward, J. & Daniel, E., 2012. Benefits management : how to increase the business value of your
IT projects. 2 red. u.o.:John Wiley & Sons.
Ward, J., De Hertogh, S. & Viaene, S., 2007. Managing Benefits from IS/IT Investments: an
Emprical Investigation into Current Practice. Hawaii, IEEE Computer Society.
Ward, J., Taylor, P. & Bond, P., 1996. Evaluation and realisation of IS/IT benefits: an empirical
study of current practice. European Journal of Information Systems, pp. 214-225.
Wohlin, C., 2014. Guidelines for Snowballing in Systematic Literature Studies and a
Replication in Software Engineering. London, u.n.
Zwikael, O. & Smyrk, J., 2011. Project Management for the Creation of Organizational Value.
London: Springer-Verlag London Limited.

57
9. APPENDIX
A1. Interview guide
Introduction • What is your title?
• How long have you been working for Scania?
• Did you have a part in the development phase of the IT-tool?
- How long were you involved in the development of the IT-tool?
• Do you use the IT-tool in your daily work?
- How long have you been using the IT-tool?
- How often do you use the IT-tool?
• What is your perception/definition of a benefit? (This is how I think about benefits...)
• What is your experience of working with benefits?
P1: Benefit identification and structuring • Before the IT-tool development project started, were benefits:
- Expected? How?
- Categorized? How?
- Ranked? How?
• What type of tangible benefits are generally recognized by Scania?
• What type of intangible benefits are generally recognized by Scania?
• What are the most important benefits in your opinion (obtained through the IT-tool)?
• What is a benefit of average importance in your opinion (obtained through the IT-tool)?
• What are the least important benefits in your opinion (obtained through the IT-tool)?
P2: Benefit planning and expectation • Were expected benefits well thought through?
• Were the expected benefits ambitious or easily obtained?
• Is a benefits realisation plan usually created?
- Can you describe the plan for the IT-tool / why is there no plan?
P3: Benefit realisation • How were benefits realized during the IT-tool development project?
• Was anyone made responsible to realise a certain benefit?
- Why / why not?
• What happens if a benefit is not realised?
P4-5: Evaluation and potential for further benefits • Were benefits evaluated when the IT-tool project was finished? How?
• Were the expected benefits met when the IT-tool project was evaluated?
- Why / why not?
• Is the current evaluation method valid in your own opinion?
- Do you see room for improvement?
• Do/did you face problems while using the IT-tool? Often? What kind of problems?
• Do/did you see potential for further benefits after the IT-tool was implemented?
- Have these potential benefits been followed up on or left unnoticed? How?


A2. IT-tool C scorecard

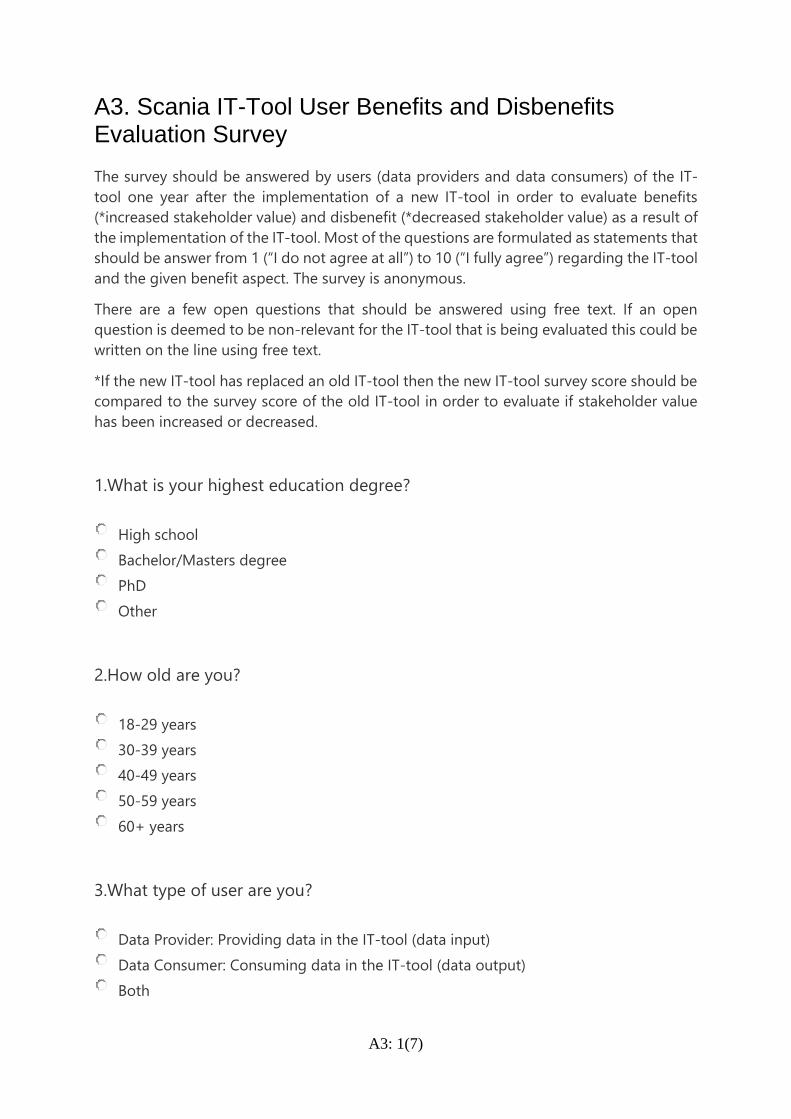
A3: 1(7)
A3. Scania IT-Tool User Benefits and Disbenefits Evaluation Survey
The survey should be answered by users (data providers and data consumers) of the IT-
tool one year after the implementation of a new IT-tool in order to evaluate benefits
(*increased stakeholder value) and disbenefit (*decreased stakeholder value) as a result of
the implementation of the IT-tool. Most of the questions are formulated as statements that
should be answer from 1 (“I do not agree at all”) to 10 (“I fully agree”) regarding the IT-tool
and the given benefit aspect. The survey is anonymous.
There are a few open questions that should be answered using free text. If an open
question is deemed to be non-relevant for the IT-tool that is being evaluated this could be
written on the line using free text.
*If the new IT-tool has replaced an old IT-tool then the new IT-tool survey score should be
compared to the survey score of the old IT-tool in order to evaluate if stakeholder value
has been increased or decreased.
1.What is your highest education degree?
High school
Bachelor/Masters degree
PhD
Other
2.How old are you?
18-29 years
30-39 years
40-49 years
50-59 years
60+ years
3.What type of user are you?
Data Provider: Providing data in the IT-tool (data input)
Data Consumer: Consuming data in the IT-tool (data output)
Both

A3: 2(7)
4.What is your job title?
5.How long experience do you have of working with the IT-tool (answer in
years)?
6.Easy to use and learn aspect.
Q: The IT-tool is easy to use.
The logic and pedagogic perception of the IT-tool and amount of time and effort required to
learn and use the IT-tool.
I do not agree at all 1 2 3 4 5 6 7 8 9 10 I fully agree
7.Easy to use and learn aspect.
Q: The IT-tool is easy to learn.
The logic and pedagogic perception of the IT-tool and amount of time and effort required to
learn and use the IT-tool.
I do not agree at all 1 2 3 4 5 6 7 8 9 10 I fully agree
8.Easy to use and learn aspect.
Q: In what way could the IT-tool be changed to be easier to use or learn?
The logic and pedagogic perception of the IT-tool and amount of time and effort required to
learn and use the IT-tool.

A3: 3(7)
9.Planning aspect.
Q: The IT-tool supports me to better be able to plan my work.
Ability to structure upcoming work tasks and an understanding of how much time that is
required to full fill them.
I do not agree at all 1 2 3 4 5 6 7 8 9 10 I fully agree
10.Planning aspect.
Q: I am able to predict how long time work tasks connected to the IT-tool will
take.
Ability to structure upcoming work tasks and an understanding of how much time that is
required to full fill them.
I do not agree at all 1 2 3 4 5 6 7 8 9 10 I fully agree
11.Flexibility aspect.
Q: The IT-tool assists me to be more flexible in my work (e.g. pause a work task
and finish it at a later stage).
The ability to adapt to change when deemed beneficial.
I do not agree at all 1 2 3 4 5 6 7 8 9 10 I fully agree
12.Security aspect.
Q: The IT-tool supports the security of important information, systems and other
sensitive material.
The ability to secure sensitive information and access important systems and material.
I do not agree at all 1 2 3 4 5 6 7 8 9 10 I fully agree
13.Decision making aspect.
Q: The IT-tool supports me to make well informed decisions.
The ability to take controlled and well balanced decisions.
I do not agree at all 1 2 3 4 5 6 7 8 9 10 I fully agree

A3: 4(7)
14.Collaboration aspect.
Q: The IT-tool supports collaboration between companies within Traton.
Improved Collaboration between employees, projects, teams and organizations.
I do not agree at all 1 2 3 4 5 6 7 8 9 10 I fully agree
15.Collaboration aspect.
Q: The IT-tool supports collaboration between departments at Scania.
Improved Collaboration between employees, projects, teams and organizations.
I do not agree at all 1 2 3 4 5 6 7 8 9 10 I fully agree
16.Collaboration aspect.
Q: The IT-tool supports Collaboration within my project(s).
Improved Collaboration between employees, projects, teams and organizations.
I do not agree at all 1 2 3 4 5 6 7 8 9 10 I fully agree
17.Collaboration aspect.
Q: The IT-tool supports collaboration within my team(s).
Improved Collaboration between employees, projects, teams and organizations.
I do not agree at all 1 2 3 4 5 6 7 8 9 10 I fully agree
18.Collaboration aspect.
Q: The IT-tool supports good relations to third parties.
Improved Collaboration between employees, projects, teams and organizations.
I do not agree at all 1 2 3 4 5 6 7 8 9 10 I fully agree

A3: 5(7)
19.Communication aspect.
Q: The IT-tool supports my ability to share information.
Ability to access and share qualitative information in an effective manner.
I do not agree at all 1 2 3 4 5 6 7 8 9 10 I fully agree
20.Quality of IT-tool aspect.
Q: The quality of the IT-tool itself is high.
Perceived positive product and service attribute or increased performance such as low
amount of problems and a high amount of user satisfaction.
I do not agree at all 1 2 3 4 5 6 7 8 9 10 I fully agree
21.Quality of IT-tool aspect.
Q: I am satisfied with the IT-tool.
Perceived positive product and service attribute or increased performance such as low
amount of problems and a high amount of user satisfaction.
I do not agree at all 1 2 3 4 5 6 7 8 9 10 I fully agree
22.Quality of IT-tool aspect.
Q: I seldom encounter problems with the IT-tool.
Perceived positive product and service attribute or increased performance such as low
amount of problems and a high amount of user satisfaction.
I do not agree at all 1 2 3 4 5 6 7 8 9 10 I fully agree
23.Quality of IT-tool aspect.
Q: Can you describe the problems that you encounter?
Perceived positive product and service attribute or increased performance such as low
amount of problems and a high amount of user satisfaction.

A3: 6(7)
24.Quality of IT-tool aspect.
Q: How could the quality of the IT-tool be improved?
Perceived positive product and service attribute or increased performance such as low
amount of problems and a high amount of user satisfaction.
25.Creating knowledge aspect.
Q: The IT-tool supports me to create a deeper understanding of information.
The ability to create a deeper understanding from information, facts and skills.
I do not agree at all 1 2 3 4 5 6 7 8 9 10 I fully agree
26.Creativity aspect.
Q: The IT-tool supports me with better conditions to be creative.
The conditions and the ability to explore and generate new ideas that could lead to new
solution for new or old problems.
I do not agree at all 1 2 3 4 5 6 7 8 9 10 I fully agree
27.Health and working environment aspect.
Q: The IT-tool helps me to relieve stress.
Striving for meaningful work at a reasonable pace with reasonable demands in a productive
environment, at a manageable stress level with the ability to receive help when necessary.
I do not agree at all 1 2 3 4 5 6 7 8 9 10 I fully agree
28.Health and working environment aspect.
Q: I am able to obtain help when I have questions, problems or concerns linked
to the IT-tool.
Striving for meaningful work at a reasonable pace with reasonable demands in a productive
environment, at a manageable stress level with the ability to receive help when necessary.
I do not agree at all 1 2 3 4 5 6 7 8 9 10 I fully agree

A3: 7(7)
29.Health and working environment aspect.
Q: The IT-tool reduces time for administrative work tasks.
Striving for meaningful work at a reasonable pace with reasonable demands in a productive
environment, at a manageable stress level with the ability to receive help when necessary.
I do not agree at all 1 2 3 4 5 6 7 8 9 10 I fully agree
30.Health and working environment aspect.
Q: In what way could the IT-tool be changed in order to improve your working
environment?
Striving for meaningful work at a reasonable pace with reasonable demands in a productive
environment, at a manageable stress level with the ability to receive help when necessary.


A4: 1(6)
A4. Scania Company Benefits and Disbenefits of IT-tool Evaluation Survey
The survey should be answered by personnel responsible for the evaluation of a new IT-
tool one year after implementation in order to evaluate benefits (*increased stakeholder
value) and disbenefit (*decreased stakeholder value) as a result of the implementation of
the new IT-tool. Most of the questions are formulated as statements that should be answer
from 1 (“I do not agree at all”) to 10 (“I fully agree”) regarding the new IT-tool and the
given aspect. The survey is anonymous.
There are also a few open questions that should be answered using free text. If an open
question is deemed to be non-relevant for the IT-tool that is being evaluated this could be
written on the line using free text.
*If the new IT-tool has replaced an old IT-tool then the new IT-tool survey score should be
compared to the survey score of the old IT-tool in order to evaluate if stakeholder value
has been increased or decreased.
1.Development or purchase of IT-tool aspect.
Q: A low amount of time have been spent to develop or purchase the IT-tool?
Time (and resources) required to develop or purchase the IT-tool.
I do not agree at all 1 2 3 4 5 6 7 8 9 10 I fully agree
2.Development or purchase of IT-tool aspect.
Q: A low amount of resources have been spent to develop or purchase the IT-
tool?
(Time and) resources required to develop or purchase the IT-tool.
I do not agree at all 1 2 3 4 5 6 7 8 9 10 I fully agree
3.Maintenance aspect.
Q: The IT-tool requires a low amount of time for maintenance and support?
Time (and resources) required to support the IT-tool.
I do not agree at all 1 2 3 4 5 6 7 8 9 10 I fully agree

A4: 2(6)
4.Maintenance aspect.
Q: The IT-tool requires a low amount of resources for maintenance and support?
(Time and) resources required to support the IT-tool.
I do not agree at all 1 2 3 4 5 6 7 8 9 10 I fully agree
5.Skill procurement aspect.
Q: A low amount of time is required to train new users to use the IT-tool?
Time (and resources) required to train or hire new employees.
I do not agree at all 1 2 3 4 5 6 7 8 9 10 I fully agree
6.Skill procurement aspect.
Q: A low amount of resources are required to train new users to use the IT-tool?
(Time and) resources required to train or hire new employees.
I do not agree at all 1 2 3 4 5 6 7 8 9 10 I fully agree
7.Skill procurement aspect.
Q: A low amount of employees have been hired in order to use the IT-tool?
Time and resources needed to train new users or hire new employees.
I do not agree at all 1 2 3 4 5 6 7 8 9 10 I fully agree
8.Economic aspect.
Q: The IT-tool is estimated to save a high amount of money for Scania over 5
years after implementation?
Saved money (or increased profit).
I do not agree at all 1 2 3 4 5 6 7 8 9 10 I fully agree

A4: 3(6)
9.Economic aspect.
Q: The IT-tool is estimated to increase the profit of Scania over 5 years after
implementation?
(Saved money or) increased profit.
I do not agree at all 1 2 3 4 5 6 7 8 9 10 I fully agree
10.Economic aspect.
Q: How much money is Scania estimated to earn or save over a 5 year period
due to the use of the IT-tool (saving + increased profit - investments -
maintenance)?
Saved money or increased profit.
11.Quality output and outcome aspect
Q: The information quality in the new IT-tool is of high quality?
Information quality in the IT-tool (output) and quality as an outcome of the IT-tool.
I do not agree at all 1 2 3 4 5 6 7 8 9 10 I fully agree
12.Quality output and outcome aspect
Q: It is clear where the information in the IT-tool comes from?
Information quality in the IT-tool (output) and quality as an outcome of the IT-tool.
I do not agree at all 1 2 3 4 5 6 7 8 9 10 I fully agree
13.Quality output and outcome aspect
Q: The IT-tool support increased quality of the final product?
Information quality in the IT-tool (output) and quality as an outcome of the IT-tool.
I do not agree at all 1 2 3 4 5 6 7 8 9 10 I fully agree

A4: 4(6)
14.Efficiency and time aspect.
Q: Time to market of the final product is shortened due to the new IT-tool?
Saved time, shorter time to market, shorter time to obtain the same result, free time to
explore.
I do not agree at all 1 2 3 4 5 6 7 8 9 10 I fully agree
15.Effciency and time aspect.
Q: The IT-tool is efficient and time saving?
Saved time, shorter time to market, shorter time to obtain the same result, free time to
explore.
I do not agree at all 1 2 3 4 5 6 7 8 9 10 I fully agree
16.Strategic aspect.
Q: The IT-tool is aligned with corporate strategy?
IT-tool compatibility with corporate strategy, current and upcoming trends/challenges.
I do not agree at all 1 2 3 4 5 6 7 8 9 10 I fully agree
17.Strategic aspect.
Q: The IT-tool assist Scania to pursue upcoming trends?
IT-tool compatibility with corporate strategy, current and upcoming trends/challenges.
I do not agree at all 1 2 3 4 5 6 7 8 9 10 I fully agree
18.Strategic aspect.
Q: The IT-tool support Scania to handle upcoming challenges?
IT-tool compatibility with corporate strategy, current and upcoming trends/challenges.
I do not agree at all 1 2 3 4 5 6 7 8 9 10 I fully agree

A4: 5(6)
19.Technical aspect.
Q: The IT-tool support Scania to achieve a technological advantage over the
competitors?
Being in line or ahead of competitors from a technical standpoint.
I do not agree at all 1 2 3 4 5 6 7 8 9 10 I fully agree
20.Environmental aspect.
Q: The IT-tool reduces the need of paper copies?
Saving resources such as electricity and minimizing the release of CO2 and NOx.
I do not agree at all 1 2 3 4 5 6 7 8 9 10 I fully agree
21.Environmental aspect.
Q: The IT-tool reduces the need of traveling?
Saving resources such as electricity and minimizing the release of CO2 and NOx.
I do not agree at all 1 2 3 4 5 6 7 8 9 10 I fully agree
22.Employability and to retain staff aspect.
Q: The IT-tool reduce tiresome and monotone work tasks?
Reducing the time spent with tiresome and monotone work tasks and making Scania more
attractive in the job market.
I do not agree at all 1 2 3 4 5 6 7 8 9 10 I fully agree
23.Employability and to retain staff aspect.
Q: The IT-tool makes Scania more attractive as an employer?
Reducing the time spent with tiresome and monotone work tasks and making Scania more
attractive in the job market.
I do not agree at all 1 2 3 4 5 6 7 8 9 10 I fully agree

A4: 6(6)
24.Mandatory and legal demand aspect.
Q: The IT-tool helps Scania meet current legal demands?
Meeting laws, rules and regulations of different markets.
I do not agree at all 1 2 3 4 5 6 7 8 9 10 I fully agree
25.Mandatory and legal demand aspect.
Q: The IT-tool will help Scania meet future legal demands?
Meeting laws, rules and regulations of different markets.
I do not agree at all 1 2 3 4 5 6 7 8 9 10 I fully agree


TRITA -ITM-EX 2019:535
www.kth.se