
Quantification of Proteins Involved in Drug Metabolism and ... · 188 enzymes and 66 transporters...
16
Quantification of Proteins Involved in Drug Metabolism and Disposition in the Human Liver Using Label-Free Global Proteomics Narciso Couto,* ,§,†,⊥ Zubida M. Al-Majdoub, §,⊥ Brahim Achour, § Phillip C. Wright, †,∥ Amin Rostami-Hodjegan, §,‡ and Jill Barber* ,§ § Centre for Applied Pharmacokinetic Research, University of Manchester, Stopford Building, Oxford Road, Manchester M13 9PT, U.K. † Department of Chemical and Biological Engineering, ChELSI Institute (Chemical Engineering at the Life Science Interface), University of Sheffield, Sir Robert Hadfield Building, Mappin Street, Sheffield S1 3JD, U.K. ‡ Simcyp Ltd. (a Certara company), 1 Concourse Way, Sheffield S1 2BJ, U.K. * S Supporting Information ABSTRACT: There is an urgent need (recognized in FDA guidance, 2018) to optimize the dose of medicines given to patients for maximal drug efficacy and limited toxicity (precision dosing), which can be facilitated by quantitative systems pharmacology (QSP) models. Accurate quantification of proteins involved in drug clearance is essential to build and improve QSP models for any target population. Here we describe application of label-free proteomics in microsomes from 23 human livers to simultaneously quantify 188 enzymes and 66 transporters involved in xenobiotic disposition, including 17 cytochrome P450s (CYPs), 10 UDP-glucuronosyltransferases (UGTs), 7 ATP-binding cassette (ABC) transporters, and 11 solute carrier (SLC) transporters; six of these proteins are quantified for the first time. The methodology allowed quantification of thousands of proteins, allowing estimation of sample purity and understanding of global patterns of protein expression. There was overall good agreement with targeted quantification and enzyme activity data, where this was available. The effects of sex, age, genotype, and BMI on enzyme and transporter expression were assessed. Decreased expression of enzymes and transporters with increasing BMI was observed, but a tendency for older donors to have higher BMIs may have confounded this result. The effect of genotype on enzymes expression was, however, clear-cut, with CYP3A5*1/*3 genotype expressed 16-fold higher compared with its mostly inactive *3/*3 counterpart. Despite the complex, time-consuming data analysis required for label-free methodology, the advantages of the label-free method make it a valuable approach to populate a broad range of system parameters simultaneously for target patients within pharmacology and toxicology models. KEYWORDS: human liver microsomes, cytochrome P450, uridine 5′-diphosphate-glucuronosyltransferase, ATP-binding cassette transporters, solute carrier transporters, label-free proteomics ■ INTRODUCTION Quantitative systems pharmacology (QSP) models, such as physiologically based pharmacokinetic (PBPK) models, are increasingly used to predict appropriate doses of drugs for patient groups, especially groups that may not be assessed during clinical trials (young, old, pregnant, and chronically diseased patients, for example). Over 30 recent drug labels have benefitted from model-informed decisions about dosing in lieu of clinical studies. 1,2 Publication of the final FDA guidance on using PBPK models is another indication of the fact that these models are here to stay. 3 In the human liver, cytochrome P450 (CYP) and uridine 5′- diphosphate-glucuronosyltransferase (UGT) enzymes, in combination with uptake and efflux transporters, play a vital role in the disposition of most drugs and xenobiotics. Because of factors such as genetic predisposition, lifestyle choices, age, and disease, the expression of these proteins varies considerably among individuals. 4 As a result, drug treatments can vary in efficacy from patient to patient and toxic side effects may develop in certain populations. 4 The reliable prediction of drug behavior and safety across all populations is of paramount importance to the design and development of novel drugs and is of considerable value to pharmaceutical industries and regulatory authorities. 1,5 The abundance of specific proteins in the human liver has been measured in either tissue lysates or enriched microsomal fractions, using targeted mass spectrometry-based quantitative Received: September 6, 2018 Revised: November 24, 2018 Accepted: January 3, 2019 Published: January 4, 2019 Article pubs.acs.org/molecularpharmaceutics Cite This: Mol. Pharmaceutics 2019, 16, 632-647 © 2019 American Chemical Society 632 DOI: 10.1021/acs.molpharmaceut.8b00941 Mol. Pharmaceutics 2019, 16, 632−647 Downloaded via UNIV OF MANCHESTER on February 12, 2019 at 13:23:03 (UTC). See https://pubs.acs.org/sharingguidelines for options on how to legitimately share published articles.
Transcript of Quantification of Proteins Involved in Drug Metabolism and ... · 188 enzymes and 66 transporters...

Quantification of Proteins Involved in Drug Metabolism andDisposition in the Human Liver Using Label-Free Global ProteomicsNarciso Couto,*,§,†,⊥ Zubida M. Al-Majdoub,§,⊥ Brahim Achour,§ Phillip C. Wright,†,∥
Amin Rostami-Hodjegan,§,‡ and Jill Barber*,§
§Centre for Applied Pharmacokinetic Research, University of Manchester, Stopford Building, Oxford Road, Manchester M13 9PT,U.K.†Department of Chemical and Biological Engineering, ChELSI Institute (Chemical Engineering at the Life Science Interface),University of Sheffield, Sir Robert Hadfield Building, Mappin Street, Sheffield S1 3JD, U.K.‡Simcyp Ltd. (a Certara company), 1 Concourse Way, Sheffield S1 2BJ, U.K.
*S Supporting Information
ABSTRACT: There is an urgent need (recognized in FDA guidance, 2018)to optimize the dose of medicines given to patients for maximal drugefficacy and limited toxicity (precision dosing), which can be facilitated byquantitative systems pharmacology (QSP) models. Accurate quantificationof proteins involved in drug clearance is essential to build and improve QSPmodels for any target population. Here we describe application of label-freeproteomics in microsomes from 23 human livers to simultaneously quantify188 enzymes and 66 transporters involved in xenobiotic disposition,including 17 cytochrome P450s (CYPs), 10 UDP-glucuronosyltransferases(UGTs), 7 ATP-binding cassette (ABC) transporters, and 11 solute carrier(SLC) transporters; six of these proteins are quantified for the first time.The methodology allowed quantification of thousands of proteins, allowingestimation of sample purity and understanding of global patterns of proteinexpression. There was overall good agreement with targeted quantificationand enzyme activity data, where this was available. The effects of sex, age, genotype, and BMI on enzyme and transporterexpression were assessed. Decreased expression of enzymes and transporters with increasing BMI was observed, but a tendencyfor older donors to have higher BMIs may have confounded this result. The effect of genotype on enzymes expression was,however, clear-cut, with CYP3A5*1/*3 genotype expressed 16-fold higher compared with its mostly inactive *3/*3counterpart. Despite the complex, time-consuming data analysis required for label-free methodology, the advantages of thelabel-free method make it a valuable approach to populate a broad range of system parameters simultaneously for target patientswithin pharmacology and toxicology models.
KEYWORDS: human liver microsomes, cytochrome P450, uridine 5′-diphosphate-glucuronosyltransferase,ATP-binding cassette transporters, solute carrier transporters, label-free proteomics
■ INTRODUCTION
Quantitative systems pharmacology (QSP) models, such asphysiologically based pharmacokinetic (PBPK) models, areincreasingly used to predict appropriate doses of drugs forpatient groups, especially groups that may not be assessedduring clinical trials (young, old, pregnant, and chronicallydiseased patients, for example). Over 30 recent drug labelshave benefitted from model-informed decisions about dosingin lieu of clinical studies.1,2 Publication of the final FDAguidance on using PBPK models is another indication of thefact that these models are here to stay.3
In the human liver, cytochrome P450 (CYP) and uridine 5′-diphosphate-glucuronosyltransferase (UGT) enzymes, incombination with uptake and efflux transporters, play a vitalrole in the disposition of most drugs and xenobiotics. Becauseof factors such as genetic predisposition, lifestyle choices, age,
and disease, the expression of these proteins variesconsiderably among individuals.4 As a result, drug treatmentscan vary in efficacy from patient to patient and toxic sideeffects may develop in certain populations.4 The reliableprediction of drug behavior and safety across all populations isof paramount importance to the design and development ofnovel drugs and is of considerable value to pharmaceuticalindustries and regulatory authorities.1,5
The abundance of specific proteins in the human liver hasbeen measured in either tissue lysates or enriched microsomalfractions, using targeted mass spectrometry-based quantitative
Received: September 6, 2018Revised: November 24, 2018Accepted: January 3, 2019Published: January 4, 2019
Article
pubs.acs.org/molecularpharmaceuticsCite This: Mol. Pharmaceutics 2019, 16, 632−647
© 2019 American Chemical Society 632 DOI: 10.1021/acs.molpharmaceut.8b00941Mol. Pharmaceutics 2019, 16, 632−647
Dow
nloa
ded
via
UN
IV O
F M
AN
CH
EST
ER
on
Febr
uary
12,
201
9 at
13:
23:0
3 (U
TC
).
See
http
s://p
ubs.
acs.
org/
shar
ingg
uide
lines
for
opt
ions
on
how
to le
gitim
atel
y sh
are
publ
ishe
d ar
ticle
s.

proteomics approaches, which require the use of stableisotope-labeled standards, either in the form of concatenatedproteotypic peptides (QconCAT) or as synthetic peptides(AQUA).6−11 The crucial requirement of such targetedproteomic approaches is a set of unique peptides per proteinunder study with proven flyability in the mass spectrometer.12
The use of targeted proteomics approaches for thequantification of CYPs, UGTs, and transporters has resultedin disparities in reported protein abundances.13 This can beattributed to interlaboratory variability in the choice ofstandard peptides. In addition, differences in samplepreparation methods and the technical difficulties presentedby these proteins, particularly the high level of sequencesimilarity between the proteins within their respectivesubfamilies, have obscured genuine interindividual differencesin protein expression.13 The lack of a standardized, systematicmethodology for all steps in the quantification of proteinabundance, from tissue collection to mass spectrometricanalysis, has recently been recognized as a major obstacle togenerating consistent proteomic data.14,15 A further inherentlimitation of targeted proteomics is that the number of proteinsthat can be simultaneously analyzed is limited. Therefore, acomprehensive investigation of all relevant drug metabolizingenzymes and transporters using targeted proteomics is time-consuming and costly. The resource implications of targetedversus untargeted analysis have been previously analyzed andshown that the targeted methodology is not economicallyjustified when a comprehensive analysis of drug metabolizingenzymes and transporters is desired.16 Label-free proteomicquantification of drug metabolizing enzymes and transportersis therefore an attractive alternative. Label-free methods do notrequire the prior manual selection of unique peptides forprotein quantification; instead, protein quantification is basedon the intensities of peaks corresponding to all unique peptidesdetected by the mass spectrometer.17,18 The advantage oflabel-free methods is that they enable the simultaneousquantification of large numbers of proteins allowing asystems-level understanding of the protein complement withinan individual and across populations.19 However, measurementof low abundance proteins using global proteomic methodsstill requires further optimization, and reported correlationsbetween targeted and global analyses are less well-estab-lished.15,19
We aimed in this study to quantify a wide range of proteinsrelevant to the fate of drugs in humans. To our knowledge, thecurrent report represents the most comprehensive analysis ofthe abundance of drug metabolizing enzymes, particularly,CYPs and UGTs, and drug transporters in human livermicrosomal fractions to date using a label-free quantitativeproteomic approach. This systematic study allows theevaluation of the global proteomic profile of the samples aswell. This allowed an assessment of the purity of themicrosomal samples. In addition, we were able to investigatethe implication of the dynamic range of the proteome on thecomparative analysis of protein abundance between individu-als, and correlations between protein abundance and in vitroenzymatic activity and demographic characteristics.
■ MATERIALS AND METHODSChemicals. Unless otherwise indicated, all chemicals were
supplied by Sigma-Aldrich (Poole, Dorset, U.K.) with thehighest purity available. Sequencing grade modified trypsin wassupplied by Promega (Southampton, U.K.). All solvents were
HPLC grade and supplied by ThermoFisher Scientific (Paisley,U.K.).
Human Liver Microsomal Samples. Human livermicrosomes (HLMs) from nontumorous liver samples (n =23) were provided by Pfizer (Groton, CT, USA). Suppliers ofthese samples were Vitron (Tucson, AZ, USA) and BDGentest (San Jose, CA, USA). Demographic (ethnicity, age,and gender), clinical (medical history, medications, smokinghistory, and alcohol consumption), and genotype informationon these donors were also provided by Pfizer (SupplementaryTable 1). The 23 donors (10 females, 13 males) had anaverage age of 48.7 years (range 27−66 years) and an averageBMI of 29.7 kg m−2 (range 18.0−39.6 kg m−2), including 9overweight and 9 obese donors. Ethical approval was obtainedby the suppliers, and the sample donors were anonymized.These samples have previously been analyzed by targetedquantitative proteomics.10,11,20 In the present study, label-freequantification was applied to these samples according theworkflow shown in Supplementary Figure 1. Liver microsomalfractions were prepared using differential centrifugationmethodology as previously described.21 Briefly, low speedcentrifugation (10000g) was performed to separate cellulardebris from the crude cytosolic fraction made up of cytosoliccomponents and low weight organelles. High speedcentrifugation (100000g) was performed to pellet the micro-somal fraction.
Protein Content Quantification and Sample Prepara-tion. Protein content in the HLM samples was estimated by aspectrophotometric protein assay using the Bradford reagent(ThermoFisher Scientific, Hemel Hempstead, UK).22 Analysiswas made in triplicate according to the manufacturer’s protocolusing bovine serum albumin (BSA) as a standard. Microsomalfractions from 23 individuals were selected in this study. Toenable absolute quantification by mass spectrometry, 100 μg ofeach HLM fraction was spiked with an internal standardprotein mixture containing 0.3 μg of equine myoglobin, 0.15μg of bovine cytochrome c, and 0.2 μg of BSA. Thesenonhuman proteins were selected because their low similaritywith their human counterparts minimizes interference. To eachfraction containing the standards, sodium deoxycholate wasadded to achieve a final concentration of 10% (w/v). Themixture was mixed well and incubated at room temperature for10 min.For protein digestion, a the filter-aided sample preparation
(FASP) method was used as previously described with minormodifications, in order to optimize for microsomal sam-ples.14,23 Before sample addition, Amicon Ultra 0.5 mLcentrifugal filters at 3 kDa molecular weight cutoff MerckMillipore, Nottingham, U.K.) were conditioned by brieflycentrifuging 400 μL of 60% (v/v) methanol at 14000g at roomtemperature. The deoxycholate-solubilized HLM samples werethen transferred to the conditioned filter units. A finalconcentration of 100 mM 1,4-dithiothreitol (DTT) wasadded to the protein mixture, which was incubated at 56 °Cfor 40 min. Following incubation, the samples were centrifugedat 14000g at room temperature for 20 min. Alkylation wasperformed with 50 mM iodoacetamide in the dark for 30 minat room temperature.After alkylation, deoxycholate removal was performed by
buffer exchange using two successive washes with 8 M urea in100 mM Tris-HCl (pH 8.5). To reduce urea concentration,three additional washes were performed using 1 M urea in 50mM ammonium bicarbonate (pH 8.5). Protein digestion was
Molecular Pharmaceutics Article
DOI: 10.1021/acs.molpharmaceut.8b00941Mol. Pharmaceutics 2019, 16, 632−647
633

achieved by adding trypsin (trypsin/protein ratio 1:25)followed by overnight incubation at 37 °C. Peptides wererecovered by centrifugation (14000g, 20 min) first by elutionusing100 mM ammonium bicarbonate (pH 8.5) followed by asecond elution using 0.5 M sodium chloride. The elutedpeptides were dried in a vacuum concentrator. The driedpeptides were resuspended in loading buffer (3% (v/v)acetonitrile in water with 0.1% (v/v) trifluoroacetic acid)and desalted using a C18 column (Nest group, USA). Thepeptides were again dried using a vacuum concentrator andstored at −20 °C until mass spectrometric analysis.Liquid Chromatography and Tandem Mass Spec-
trometry (LC-MS/MS). Dried peptides samples wereresuspended in 100 μL of loading buffer, and 1.0 μL of eachsample was loaded on an UltiMate 3000 rapid separation liquidchromatography (RSLC; Dionex, Surrey, U.K.) coupled to anonline Q Exactive HF Hybrid Quadrupole-Orbitrap massspectrometer (ThermoFisher Scientific, Bremen, Germany).The samples were analyzed in analytical duplicates (46 runs intotal). Peptides were reversed-phase separated on a PepMapRSLC C18 column (2 μm particles, 100 Å, 75 μm innerdiameter, 50 cm length) (Thermo Scientific, U.K.) precededby a C18 PepMap100 μ-precolumn (5 μm, 100 Å, 300 μminner diameter, 5 mm length) (ThermoFisher Scientific, UK).A multistep gradient was used from 4% to 40% buffer B (80%(v/v) acetonitrile with 0.1% (v/v) formic acid) for 100 min ata flow rate of 300 nL min−1. The composition of buffer A wasHPLC grade water containing 0.1% (v/v) formic acid. Thesensitivity and m/z accuracy of the mass spectrometer wasevaluated using a positive ion calibration solution (Thermo-Fisher Scientific, Paisley, U.K.). The performance of the liquidchromatographer and mass spectrometer was evaluated usingHeLa protein digest standard (ThermoFisher Scientific,Paisley, U.K.) over a 90 min gradient. Data were acquired inthe positive ion mode in a data-dependent manner alternatingbetween survey MS and MS/MS scans. MS scans wereperformed over the range of 100−1500 m/z, with 60 000resolution, automatic gain control (AGC) of 3 × 10⁶, and 100ms maximal injection time. The top 18 precursor ions weresequentially selected for fragmentation using higher-energycollisional dissociation (HCD) with 28% normalized collisionenergy and precursor isolation window of 1.2 m/z. MS/MSscans were acquired at 30 000 resolution, AGC of 5 × 10⁴, and120 ms maximal injection time. Dynamic exclusion was set to30 s.LC-MS/MS Data Analysis. Protein and peptide identi-
fication and quantification were performed using Progenesisv4.0 (Nonlinear Dynamics, Newcastle-upon-Tyne, U.K.) andMascot (Matrix Science, London, U.K.). The Progenesissoftware was used for precursor ion alignment based onretention time. Following precursor alignment, data wereexported as Mascot generic files (mgf), and subsequentlyproteins were identified using Mascot. Proteins were identifiedby searching against a reference human proteome databasecontaining 71 599 entries (UniProt, May 2017). Using Mascot,the precursor mass tolerance was set to 5 ppm, fragment masstolerance was set to 0.5 Da, cysteine carbamidomethylationwas considered as fixed modification, and oxidation ofmethionine and deamidation of asparagine/glutamine wereconsidered as variable modifications. Trypsin was set as theproteolytic enzyme, and one missed cleavage was allowed. Thelist of identified proteins was imported back into Progenesis,and the identified proteins were matched with their abundance
quantified using BSA as the internal standard of choice. Amongthe three proteins used as internal standards, BSA was selectedbecause the amount of BSA spiked in to each sample wasempirically in the right dynamic range of the proteins ofinterest. The abundance of each relevant protein wasquantified by the “Hi-N” method.24 In this method, the peakintensity associated with the N most abundant nonconflictingpeptide ions was automatically selected for quantification. Themean value of the intensities of the three most intense uniquepeptides of the protein of interest relative to the internalstandard was used for the calculation of the proportionalityfactor.24 The abundance of the protein of interest wascalculated by multiplying the proportionality factor of eachprotein by the known abundance of BSA. Progenesis, incommon with other mass spectrometry software, oftenidentifies as “unique” peptides that are actually present inmore than one cytochrome P450 or UGT enzyme. Toovercome this limitation, the uniqueness of peptides fromCYPs and UGTs was analyzed using pBLAST search (NCBI,USA). The abundance of each CYP and UGT protein detectedin the HLM samples was recalculated manually using theunique peptides identified using pBLAST. The abundance wasexpressed in units of pmol mg−1 microsomal protein.
Protein Subcellular Localization and Annotation ofEnzymes and Transporters. To assess the purity andmakeup of the microsomal fractions, the subcellular local-ization of all identified proteins (n = 2208) was annotatedaccording to three databases, Gene Ontology (GO), UniProt,and the Human Protein Atlas (HPA), by searching the genenames against these repositories. Where there was evidence ofexpression in more than one subcellular component, theprotein was assigned to all relevant localizations. The identifiedenzymes and transporters were checked for evidence ofexpression in hepatic tissue at both the RNA and proteinlevels against the NCBI human database and HPA; onlyhepatic proteins were included in subsequent analysis. Inaddition, the role of hepatic enzymes and transporters wasidentified using UniProt and NCBI databases, leading toselection of proteins involved in xenobiotic or drug metabolismand disposition. Only drug metabolizing enzymes and drugtransporters quantifiable in at least one-third of the samples (n≥ 7) were considered for subsequent statistical analysis.
Cross-Methodology Assessment of Measured En-zyme Abundance Levels. To establish the accuracy of thedeveloped label-free assay, the abundance levels of enzymesmeasured in this study were compared to previouslydetermined concentrations in matched samples using twotargeted proteomic methodologies, QconCAT in the case ofCYPs11 and UGTs25 and AQUA in the case of UGTs.10
Assessment of CYP and UGT Abundance againstEnzymatic Activity. To validate the proteomic method,assessment of direct correlation between the quantifiedabundance of major drug metabolizing CYPs and UGTs andtheir enzymatic activity was performed. Metabolite appearancerates for CYPs (1A2, 2B6, 2C9, 2C19, 2D6, 3A4, and 3A5)and for UGTs (1A1, 1A3, 1A4, 1A6, 1A9, 2B4, 2B7, and 2B15)in these samples were kindly provided by Pfizer (Groton, CT,USA). Cytochrome P450 substrates26 were phenacetin(CYP1A2), bupropion (CYP2B6), diclofenac (CYP2C9), S-mephenytoin (CYP2C19), bufuralol (CYP2D6), and testoster-one (CYP3A4). CYP3A5 activity was measured usingmidazolam in the presence of a CYP3cide to silenceCYP3A4.27 UGT substrates20,28 were β-estradiol (UGT1A1),
Molecular Pharmaceutics Article
DOI: 10.1021/acs.molpharmaceut.8b00941Mol. Pharmaceutics 2019, 16, 632−647
634

Figure 1. Global proteomic analysis of human liver microsomes (n = 23 samples), showing the subcellular localization of identified proteins (A)and the origin of the 20 most abundantly expressed proteins mapped along with cell and organelle markers (B), showing that this fraction iscontaminated due to the presence of different cell types (cell markers: ASGR1/2, hepatocytes; STAB1/2, liver endothelial cells) andcosedimentation of several cellular components (organelle markers: CANX, endoplasmic reticulum; ATP1A1/CD81, plasma membrane; COX4,mitochondria, PEX14, peroxisomes); the 20 most abundant proteins were of three origins, reticular, mitochondrial, and cytoplasmic/cytosolic. Thecumulative amount of the quantified proteins (C), representing assessment of purity of the microsomal fraction, shows contribution of the 20 mosthighly abundant proteins to total protein amount (22%−32%). A large number of drug and xenobiotic metabolizing and transporting proteins wereidentified in the HLM samples (D), among which cytochrome P450 enzymes, UGTs, ATP-binding cassette (ABC), and solute carrier (SLC)transporters (E) are of particular interest. In panel A, the numbers of proteins in each subcellular component is shown along with percentagecontribution to the total number of proteins; these percentages add up to more than 100% due to expression of several proteins in more than onesubcellular location. ABC, ATP-binding cassette transporters; CYP, cytochrome P450 enzymes; DME, drug/xenobiotic metabolizing enzymes; ER,endoplasmic reticulum; PM, plasma membrane; SLC, solute carrier transporters; UGT, uridine 5′-diphospho-glucuronosyltransferases.
Molecular Pharmaceutics Article
DOI: 10.1021/acs.molpharmaceut.8b00941Mol. Pharmaceutics 2019, 16, 632−647
635
chenodeoxycholic acid (UGT1A3), trifluoperazine(UGT1A4), 5-hydroxytryptophol (UGT1A6), propofol(UGT1A9), zidovudine (UGT2B7), and S-oxazepam(UGT2B15).Statistical Analysis. All statistical analysis of the data was
performed using Microsoft Excel 2010, GraphPad Prism v7.03(La Jolla California, USA), and R v3.4.3. Nonparametricstatistics were used since a considerable proportion of the dataset did not follow normal distribution. The normality of datadistribution was assessed using three tests: D’Agostino−Pearson, Shapiro−Wilk, and Kolmogorov−Sminov normalitytests. The Spearman rank-order correlation (Rs) test, with t-distribution of the p-values, was used to assess enzymeabundance−activity correlation and intercorrelation betweenprotein abundance levels. The level of scatter of data wasevaluated by linear regression (R2). The relationship betweenage and expression level was also assessed using thesecorrelation tests. Differences between abundances generated
by targeted (QconCAT/AQUA) and label-free methods wereassessed using Mann−Whitney U-test and Kolmogorov−Sminov cumulative distribution test. Bias and scatter of thelabel free, AQUA, and QconCAT data sets were assessed usingaverage fold error (AFE) and absolute average fold error(AAFE), respectively. Differences between genotypes and BMIcategories were assessed using nonparametric Kruskal−WallisANOVA followed by post hoc Mann−Whitney U-test. The p-value cutoff for statistical significance was set at 0.05, whichwas Bonferroni-corrected when iterative tests were required togenerate correlation matrices. Hierarchical cluster analysis(HCA) and principal components analysis (PCA) wereperformed using proteome-wide similarity data based onpercentage identical peptide (PIP) and percentage identicalprotein (PIPr)23 values across the 23 samples. Graphs weregenerated using GraphPad Prism v7.03 and R v3.4.3.
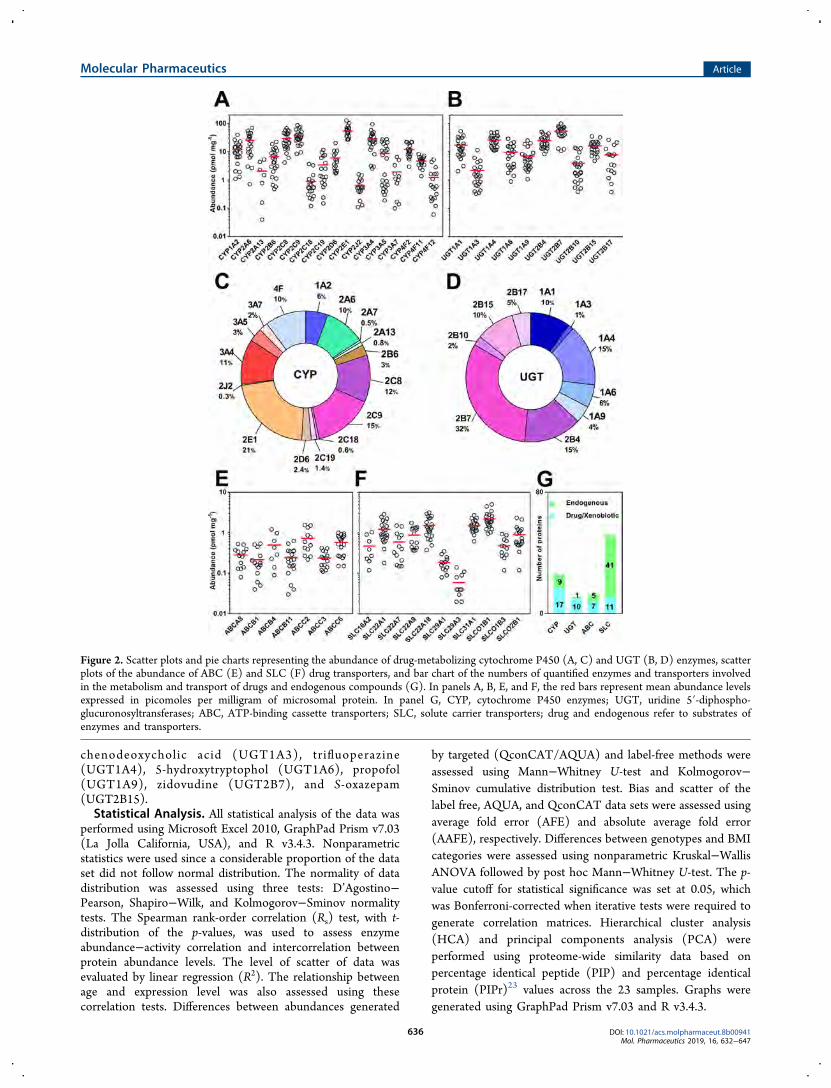
Figure 2. Scatter plots and pie charts representing the abundance of drug-metabolizing cytochrome P450 (A, C) and UGT (B, D) enzymes, scatterplots of the abundance of ABC (E) and SLC (F) drug transporters, and bar chart of the numbers of quantified enzymes and transporters involvedin the metabolism and transport of drugs and endogenous compounds (G). In panels A, B, E, and F, the red bars represent mean abundance levelsexpressed in picomoles per milligram of microsomal protein. In panel G, CYP, cytochrome P450 enzymes; UGT, uridine 5′-diphospho-glucuronosyltransferases; ABC, ATP-binding cassette transporters; SLC, solute carrier transporters; drug and endogenous refer to substrates ofenzymes and transporters.
Molecular Pharmaceutics Article
DOI: 10.1021/acs.molpharmaceut.8b00941Mol. Pharmaceutics 2019, 16, 632−647
636
■ RESULTS
General Outcome. Across the twenty-three liver micro-somal fractions, a total of 2208 proteins were quantified with aminimum of two unique peptides each and a false discoveryrate of ≤1% at the protein and peptide levels. In each sample,an average of 1994 proteins was quantified (range 1836−2152proteins). The present study represents an increase ofapproximately 30% of ADME proteins quantified in livermicrosomal samples when compared with previously reporteddata.15,29
Evaluation of the Reproducibility of the ProteomicsData. Analytical replicates were evaluated in two ways. First,high reproducibility was seen in the quantified abundance ofidentical proteins across analytical replicates as the coefficientof determination from regression analysis (R2) varied between0.79 and 0.99, with a slope of approximately one. In addition,categorical evidence was used to assess the similarity betweenpeptides identified in the analytical replicates at the level of theprimary analytes (peptides) using the descriptor percentageidentical peptides (PIP) as previously described.23 In eachsample, a very high similarity was seen in the peptidesidentified in the analytical replicates with PIP varying between92% and 100%.The details of replicate evaluation are providedin Supplementary Table 2. Values in this range point to a highdegree of consistency in both sample preparation andinstrument performance and are reassuring, especially in viewof the long mass spectrometry run required by 23 samples induplicate.Assessment of the Quality of Liver Microsomal
Fractions. Subcellular localization analysis of the samplespredicted that approximately 50% of the quantified proteinswere localized in the endoplasmic reticulum and the plasmamembrane. The remaining proteins were largely predicted to
be localized in the cytoplasm or cytosol, the mitochondria, andthe nucleus (Figure 1A). This prediction was confirmed by thepresence of markers specific for these organelles. Althoughcalnexin (CANX), the specific marker for endoplasmicreticulum membrane, was abundant in the global microsomalprotein profile, markers for mitochondrial membrane (cyto-chrome c oxidase; COX4), plasma membrane (sodium/potassium-transporting ATPase subunit alpha-1 and clusterof differentiation 81; ATP1A1 and CD81) and peroxisomalmembrane (peroxisomal membrane protein; PEX14) were alsopresent (Figure 1B).30−32 Established protein markers forhepatocytes, asialoglycoprotein receptor 1 (ASGR1) andasialoglycoprotein receptor 2 (ASGR2), were highly expressedin the microsomal preparation,33,34 but markers specific tononparenchymal endothelial cells (stabilin 1 and 2; STAB1/2)were also present, indicating some heterogeneity of cell type.35
Markers associated with other cell types such as Kupffer cells,Ito cells, and intrahepatic cholangiocytes were not found. Theheterogeneity of the microsomal samples makes this analysisespecially important, as variation in contamination would havea profound effect on the apparent abundance of proteinsinvolved in drug metabolism and transport when expressed aspmol of protein per microgram of microsomal protein, as isconventional.29,36,37
An analysis of the 20 most abundant proteins across allmicrosomal fractions was undertaken to determine whether thecontaminants could affect the quantification of proteins in themicrosomal fractions. In this study, 15 out of the 20 mostabundant proteins quantified in the microsomal fractions werepredicted to be localized in the endoplasmic reticulum (Figure1B). The most abundant protein in all microsomal fractionswas either liver carboxylesterase 1 (CES1) or epoxidehydrolase 1 (EPHX1), both reticular proteins, at average
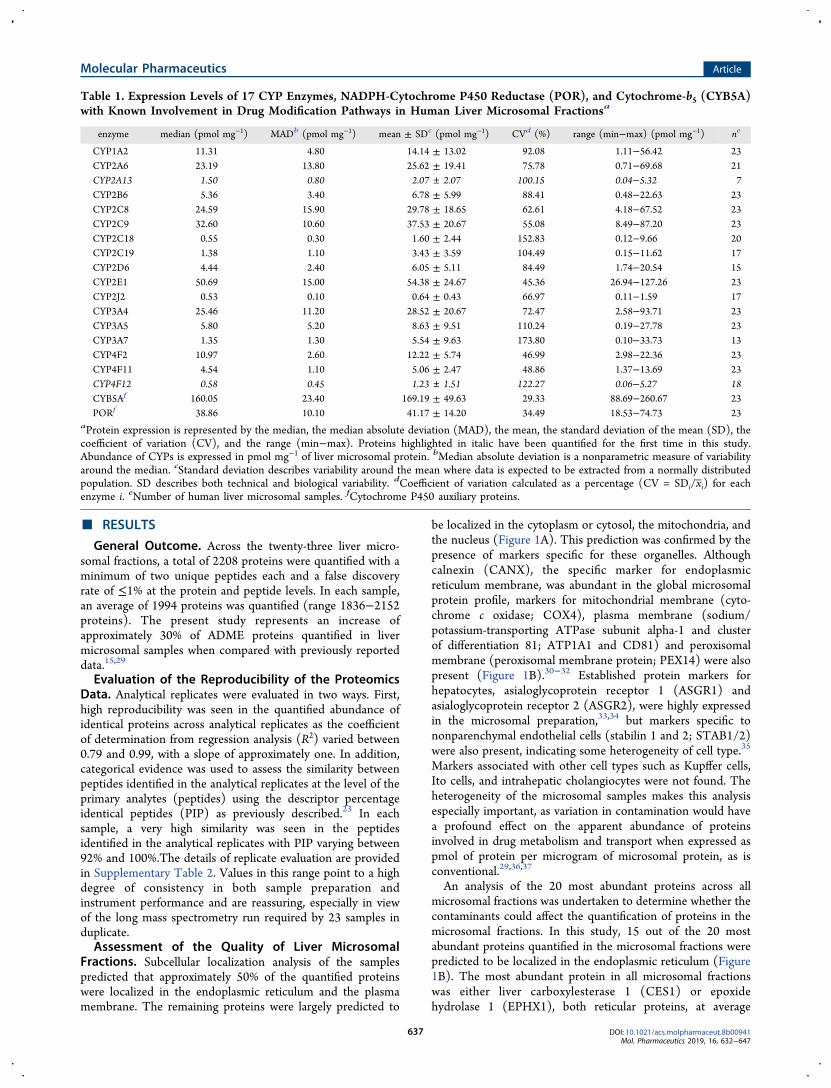
Table 1. Expression Levels of 17 CYP Enzymes, NADPH-Cytochrome P450 Reductase (POR), and Cytochrome-b5 (CYB5A)with Known Involvement in Drug Modification Pathways in Human Liver Microsomal Fractionsa
enzyme median (pmol mg−1) MADb (pmol mg−1) mean ± SDc (pmol mg−1) CVd (%) range (min−max) (pmol mg−1) ne
CYP1A2 11.31 4.80 14.14 ± 13.02 92.08 1.11−56.42 23CYP2A6 23.19 13.80 25.62 ± 19.41 75.78 0.71−69.68 21CYP2A13 1.50 0.80 2.07 ± 2.07 100.15 0.04−5.32 7CYP2B6 5.36 3.40 6.78 ± 5.99 88.41 0.48−22.63 23CYP2C8 24.59 15.90 29.78 ± 18.65 62.61 4.18−67.52 23CYP2C9 32.60 10.60 37.53 ± 20.67 55.08 8.49−87.20 23CYP2C18 0.55 0.30 1.60 ± 2.44 152.83 0.12−9.66 20CYP2C19 1.38 1.10 3.43 ± 3.59 104.49 0.15−11.62 17CYP2D6 4.44 2.40 6.05 ± 5.11 84.49 1.74−20.54 15CYP2E1 50.69 15.00 54.38 ± 24.67 45.36 26.94−127.26 23CYP2J2 0.53 0.10 0.64 ± 0.43 66.97 0.11−1.59 17CYP3A4 25.46 11.20 28.52 ± 20.67 72.47 2.58−93.71 23CYP3A5 5.80 5.20 8.63 ± 9.51 110.24 0.19−27.78 23CYP3A7 1.35 1.30 5.54 ± 9.63 173.80 0.10−33.73 13CYP4F2 10.97 2.60 12.22 ± 5.74 46.99 2.98−22.36 23CYP4F11 4.54 1.10 5.06 ± 2.47 48.86 1.37−13.69 23CYP4F12 0.58 0.45 1.23 ± 1.51 122.27 0.06−5.27 18CYB5Af 160.05 23.40 169.19 ± 49.63 29.33 88.69−260.67 23PORf 38.86 10.10 41.17 ± 14.20 34.49 18.53−74.73 23
aProtein expression is represented by the median, the median absolute deviation (MAD), the mean, the standard deviation of the mean (SD), thecoefficient of variation (CV), and the range (min−max). Proteins highlighted in italic have been quantified for the first time in this study.Abundance of CYPs is expressed in pmol mg−1 of liver microsomal protein. bMedian absolute deviation is a nonparametric measure of variabilityaround the median. cStandard deviation describes variability around the mean where data is expected to be extracted from a normally distributedpopulation. SD describes both technical and biological variability. dCoefficient of variation calculated as a percentage (CV = SDi/xi) for eachenzyme i. eNumber of human liver microsomal samples. fCytochrome P450 auxiliary proteins.
Molecular Pharmaceutics Article
DOI: 10.1021/acs.molpharmaceut.8b00941Mol. Pharmaceutics 2019, 16, 632−647
637

concentrations of 360 and 247 pmol mg−1 liver microsomalprotein, respectively. The 20 most abundant proteinsconstituted 22%− 32% (average 24%) of the quantifiedmicrosomal fraction (Figure 1C).Assessment of the Abundance of Cytochrome P450
and Uridine 5′-Diphosphate-GlucuronosyltransferaseUGT Enzymes and Drug Transporters. CytochromeP450 (CYP) and uridine 5′-diphosphate-glucuronosyltransfer-ase (UGT) enzymes are the principal enzymes responsible forthe metabolism of drugs and xenobiotics. Of these, 188enzymes and 66 transporters were quantified in at least sevenindividuals as shown in Supplementary Tables 8−11. Theseinclude 26 CYPs, 11 UGTs, 12 ABC transporters, and 52 SLC
transporters (Figure 1D,E). Of the quantified CYPs, UGTs andtransporters, 17 CYPs, 10 UGTs, 7 ABC transporters and 11SLC transporters are known to be associated with drugclearance based on pharmacological and toxicological evidence.Hepatic microsomal abundance levels of these enzymes andtransporters are shown in Figure 2 and summarized in Tables1−3. Where literature values were available, they werecompared with the present study and found to be in broadagreement (Supplementary Tables 4−7). The most highlyexpressed CYPs were CYP2E1, CYP2C9, CYP2C8, CYP3A4,and CYP2A6 (Figure 2A).6,38−40 The most highly expressedUGT was UGT2B7, followed by UGT1A4, UGT2B4,UGT1A1, and UGT2B15 (Figure 2B). The pie charts in
Table 2. Expression Levels of 10 UGT Enzymes with Known Involvement in Drug Glucuronidation in Human LiverMicrosomal Fractionsa
enzyme median (pmol mg−1) MADb (pmol mg−1) mean ± SDc (pmol mg−1) CVd (%) range (min−max) (pmol mg−1) ne
UGT1A1 12.29 4.60 17.13 ± 12.81 74.79 2.08−53.64 23UGT1A3 1.36 0.80 2.21 ± 2.55 115.72 0.33−11.58 23UGT1A4 22.70 8.90 26.06 ± 12.41 47.63 11.18−49.88 23UGT1A6 7.89 5.50 9.64 ± 7.69 79.81 0.90−29.10 23UGT1A9 5.19 2.40 7.18 ± 6.47 90.13 1.07−25.00 23UGT2B4 24.57 10.10 24.64 ± 12.06 48.95 8.36−50.58 23UGT2B7 56.17 14.90 53.97 ± 22.84 42.31 10.86−100.37 23UGT2B10 1.92 1.40 3.99 ± 4.29 107.71 0.39−13.84 23UGT2B15 15.42 5.60 16.18 ± 7.85 48.54 4.80−35.12 23UGT2B17 5.43 3.45 7.81 ± 7.93 101.47 0.38−26.50 16
aProtein expression is represented by the median, the median absolute deviation (MAD), the mean, the standard deviation of the mean (SD), thecoefficient of variation (CV), and the range (min−max). Abundance of UGTs is expressed in pmol mg−1 of liver microsomal protein. bMedianabsolute deviation is a nonparametric measure of variability around the median. cStandard deviation describes variability around the mean wheredata is expected to be extracted from a normally distributed population. SD describes both technical and biological variability. dCoefficient ofvariation calculated as a percentage (CV = SDi/xi) for each enzyme i. eNumber of human liver microsomal samples.
Table 3. Expression Levels of 18 Transporters with Known Involvement in Drug Clearance in Human Liver MicrosomalFractionsa
transporter median (pmol mg−1) MADb (pmol mg−1) mean ± SDc (pmol mg−1) CVd (%) range (min−max) (pmol mg−1) ne
ATP-Binding Cassette TransportersABCA8 0.27 0.10 0.28 ± 0.15 51.96 0.08−0.53 13ABCB1 0.18 0.09 0.47 ± 0.77 162.43 0.04−2.95 16ABCB4 0.36 0.25 0.50 ± 0.41 81.92 0.09−1.21 8ABCB11 0.22 0.13 0.28 ± 0.21 76.26 0.03−0.90 21ABCC2 0.54 0.25 0.73 ± 0.49 67.93 0.22−1.55 12ABCC3 0.25 0.10 0.74 ± 1.40 188.35 0.11−5.42 18ABCC6 0.70 0.30 1.02 ± 1.47 145.01 0.15−6.60 21
Solute Carrier TransportersSLC16A2 0.33 0.20 0.47 ± 0.35 73.27 0.12−1.04 8SLC22A1 1.02 0.40 1.35 ± 0.93 69.19 0.18−4.09 22SLC22A7 0.43 0.25 0.79 ± 0.87 110.53 0.15−3.36 14SLC22A9 0.77 0.35 0.88 ± 0.48 54.35 0.36−1.75 14SLC22A18 1.31 0.50 1.52 ± 0.82 54.04 0.38−3.15 21SLC29A1 0.18 0.10 0.18 ± 0.08 43.49 0.08−0.35 13SLC31A1 1.46 0.40 1.61 ± 0.69 42.72 0.62−3.62 21SLC29A3 0.04 0.02 0.06 ± 0.04 66.02 0.02−0.14 11SLCO1B1 1.98 0.60 2.45 ± 1.59 64.65 0.96−8.04 23SLCO1B3 0.47 0.20 0.77 ± 0.83 107.93 0.12−3.25 14SLCO2B1 0.63 0.30 0.89 ± 0.58 65.08 0.12−2.36 19
aProtein expression is represented by the median, the median absolute deviation (MAD), the mean, the standard deviation of the mean (SD), thecoefficient of variation (CV), and the range (min−max). Proteins highlighted in italic have been quantified for the first time in this study.Abundance of transporters is expressed in pmol mg−1 of liver microsomal protein. bMedian absolute deviation is a nonparametric measure ofvariability around the median. cStandard deviation describes variability around the mean where data is expected to be extracted from a normallydistributed population. SD describes both technical and biological variability. dCoefficient of variation calculated as a percentage (CV = SDi/xi) foreach enzyme i. eNumber of human liver microsomal samples.
Molecular Pharmaceutics Article
DOI: 10.1021/acs.molpharmaceut.8b00941Mol. Pharmaceutics 2019, 16, 632−647
638
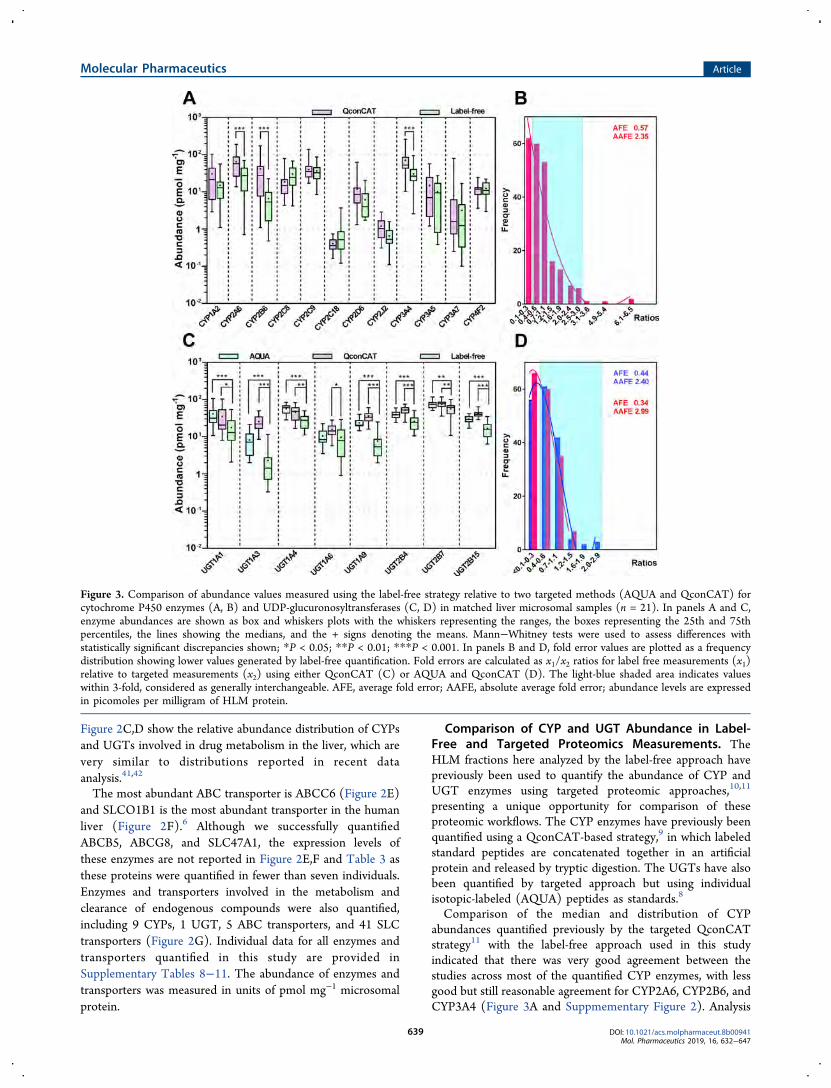
Figure 2C,D show the relative abundance distribution of CYPsand UGTs involved in drug metabolism in the liver, which arevery similar to distributions reported in recent dataanalysis.41,42
The most abundant ABC transporter is ABCC6 (Figure 2E)and SLCO1B1 is the most abundant transporter in the humanliver (Figure 2F).6 Although we successfully quantifiedABCB5, ABCG8, and SLC47A1, the expression levels ofthese enzymes are not reported in Figure 2E,F and Table 3 asthese proteins were quantified in fewer than seven individuals.Enzymes and transporters involved in the metabolism andclearance of endogenous compounds were also quantified,including 9 CYPs, 1 UGT, 5 ABC transporters, and 41 SLCtransporters (Figure 2G). Individual data for all enzymes andtransporters quantified in this study are provided inSupplementary Tables 8−11. The abundance of enzymes andtransporters was measured in units of pmol mg−1 microsomalprotein.
Comparison of CYP and UGT Abundance in Label-Free and Targeted Proteomics Measurements. TheHLM fractions here analyzed by the label-free approach havepreviously been used to quantify the abundance of CYP andUGT enzymes using targeted proteomic approaches,10,11
presenting a unique opportunity for comparison of theseproteomic workflows. The CYP enzymes have previously beenquantified using a QconCAT-based strategy,9 in which labeledstandard peptides are concatenated together in an artificialprotein and released by tryptic digestion. The UGTs have alsobeen quantified by targeted approach but using individualisotopic-labeled (AQUA) peptides as standards.8
Comparison of the median and distribution of CYPabundances quantified previously by the targeted QconCATstrategy11 with the label-free approach used in this studyindicated that there was very good agreement between thestudies across most of the quantified CYP enzymes, with lessgood but still reasonable agreement for CYP2A6, CYP2B6, andCYP3A4 (Figure 3A and Suppmementary Figure 2). Analysis
Figure 3. Comparison of abundance values measured using the label-free strategy relative to two targeted methods (AQUA and QconCAT) forcytochrome P450 enzymes (A, B) and UDP-glucuronosyltransferases (C, D) in matched liver microsomal samples (n = 21). In panels A and C,enzyme abundances are shown as box and whiskers plots with the whiskers representing the ranges, the boxes representing the 25th and 75thpercentiles, the lines showing the medians, and the + signs denoting the means. Mann−Whitney tests were used to assess differences withstatistically significant discrepancies shown; *P < 0.05; **P < 0.01; ***P < 0.001. In panels B and D, fold error values are plotted as a frequencydistribution showing lower values generated by label-free quantification. Fold errors are calculated as x1/x2 ratios for label free measurements (x1)relative to targeted measurements (x2) using either QconCAT (C) or AQUA and QconCAT (D). The light-blue shaded area indicates valueswithin 3-fold, considered as generally interchangeable. AFE, average fold error; AAFE, absolute average fold error; abundance levels are expressedin picomoles per milligram of HLM protein.
Molecular Pharmaceutics Article
DOI: 10.1021/acs.molpharmaceut.8b00941Mol. Pharmaceutics 2019, 16, 632−647
639

of fold-errors for individual microsomal samples assessed usingthe developed method relative to the targeted approachrevealed that approximately 70% of the values generated by thetwo methods were within 3-fold20 and 21% of values werewithin the bioequivalence range (80%−125%).43 Both bias(indicated by a value of the average fold error, AFE, different
from 1) and scatter (indicated by an absolute average folderror, AAFE, higher than 1) were observed (Figure 3B).UGT enzymes had previously been quantified by two
targeted approaches, based on AQUA and QconCATstandards (Figure 3C Suppmementary Figure 2). Thequantification of UGTs is extremely challenging because of
Figure 4. Correlation of the abundance levels of cytochrome P450 (A) and uridine 5′-diphospho-glucuronosyltransferase enzymes (B) measuredusing label-free global proteomics against catalytic activity. Strong and significant correlations (Rs > 0.70, P < 0.008) with very limited scatter (R2 >0.50) are shown in red; moderate correlations (Rs > 0.50, P < 0.008) with limited scatter (R2 > 0.30) are shown in blue. CYP substrates: CYP1A2(phenacetin), CYP2B6 (bupropion), CYP2C9 (diclofenac), CYP2C19 (S-mephenytoin), CYP2D6 (bufuralol), CYP3A4 (testosterone), CYP3A5(midazolam). UGT substrates: UGT1A1 (β-estradiol), UGT1A3 (chenodeoxycholic acid), UGT1A4 (trifluoperazine), UGT1A6 (5-hydroxytryptophol), UGT1A9 (propofol), UGT2B7 (zidovudine), UGT2B15 (S-oxazepam). Abundance is measured in units of picomoleenzyme per milligram of microsomal protein, and activity is measured in units of nanomole per minute per milligram of microsomal protein. TheCYP3A5 activity was measured in the presence of a CYP3cide to silence CYP3A4.
Figure 5. Covariates of expression of hepatic cytochrome P450 and UGT enzymes measured using the label-free proteomic strategy. The variablesassessed were sex (A, B), age (C), genotype (D), and body mass index, BMI (E). Sex did not affect expression with no significant differencesbetween male and female donors (A and B). An overall declining trend with age was observed for all enzymes, with little statistical significanceexcept for a few UGT examples (C). Genotype was a significant factor for CYP3A5 expression with *1/*3 genotype being expressed at higherlevels than *3/*3 (16-fold higher). Only borderline significant difference in expression was seen between CYP2D6 genotypes (C). There was anoverall declining trend of expression with BMI with differences of expression observed between normal weight, overweight, and moderately obesepatients (D) assessed using ANOVA and Mann−Whitney test for group and pairwise analysis. In panels A, B, and D, abundance data are presentedas mean ± SD. In panel C, Rs is Spearman rank-order correlation coefficient. In panel E, the boxes are the 25th and 75th percentiles, the whiskersare the ranges, the lines are the medians, and the + signs are the means. The scale inset on the right is the BMI scale for the three categories(normal BMI 18.5−25; overweight BMI 25−30; obese BMI > 30 kg m−2); *P < 0.05; **P < 0.01; ***P < 0.001.
Molecular Pharmaceutics Article
DOI: 10.1021/acs.molpharmaceut.8b00941Mol. Pharmaceutics 2019, 16, 632−647
640
(a) the very low abundance of some of these proteins, (b) thefact that they are membrane-bound, and (c) the shared peptidesequences between UGTs, and hence, the difficulty inidentifying unique peptides. Overall the present experimentsreported lower abundances for the UGTs than either of thetargeted methods, although again the values determined herefell within the range of UGT abundance reported in theliterature (Supplementary Table 5) and a large proportion(approximately 64%) of values were within 3-fold, with asmaller proportion (17%) within the bioequivalence range.20,43
Figure 3D shows the presence of both bias and scatter whenthe methods were compared.Correlation between CYPs and UGTs Protein Ex-
pression and Enzymatic Activity. The correlation betweenprotein abundance quantified by the label-free approach and invitro enzymatic activity was assessed for all CYP and UGTenzymes for which activity data were available. Correlationswere deemed strong when the values correlated well (Rs > 0.60with statistical significance against a Benferroni-correctedcutoff p-value) and demonstrated limited scatter (R2 > 0.30).The results demonstrated strong, significant, and positivecorrelation between abundance and enzymatic activity acrossall CYP enzymes (Figure 4A). These correlations are betterthan those observed in a previous study using a targetedQconCAT strategy,11 thus highlighting the importance of theselection of peptide for quantification (Supplementary Tables13−15). Strong positive correlation between protein abun-dance and enzymatic activity was also seen for two UGTenzymes, UGT1A3 and UGT1A4, with moderate positivecorrelation for the remaining UGT enzymes (Figure 4B).These correlations are comparable with those observed using atargeted AQUA strategy,20 which assessed correlation in a
larger sample size (n = 59) compared to the current study (n =23).
Covariates of Expression of Liver Enzymes andTransporters. Trends in the expression of enzymes andtransporters were assessed with reference to several factors,including sex, age, genotype, smoking, alcohol consumption,and body mass index (BMI) of donors. Demographic andclinical information on donors is provided in SupplementaryTable 1. There were no significant differences in expression ofenzymes between male and female donors (Figure 5A,B); theseemingly higher levels of CYP3A4 and 3A7 in female donorsdid not reach statistical significance (Mann−Whitney U-test, P> 0.05). A declining trend of expression with age was observedfor enzymes and transporters, which did not reach statisticalsignificance due to extensive scatter of the data, except for afew examples, including UGT2B15 (Figure 5C). Smoking anddrinking did not seem to affect expression of enzymes;however, the number of smokers (n = 4) and regular alcoholconsumers (n = 3) among the donors was very low forstatistical assessment. The effect of genotype on expression wasdemonstrated by CYP3A5, with 16-fold higher levels (Mann−Whitney U-test, P < 0.001) observed with *1/*3 genotypecompared to its mostly inactive *3/*3 counterpart (Figure5D). The effect of BMI was assessed in three categories(healthy weight, BMI 18.5−25 kg m−2; overweight, 25−30 kgm−2; and obese >30 kg m−2), and expression of enzymes andtransporters tended to decline with increasing BMI (Figure5E). Nonparametric (Kruskal−Wallis) ANOVA showed differ-ences with borderline statistical significance for CYP2E1 (P =0.08) and statistically significant differences for UGTs 1A3,1A4, and 2B10, and transporters SLC27A2 and SLC27A5 (P <0.05). Post hoc Mann−Whitney U-test showed statisticallysignificant differences between BMI categories for CYP2E1,
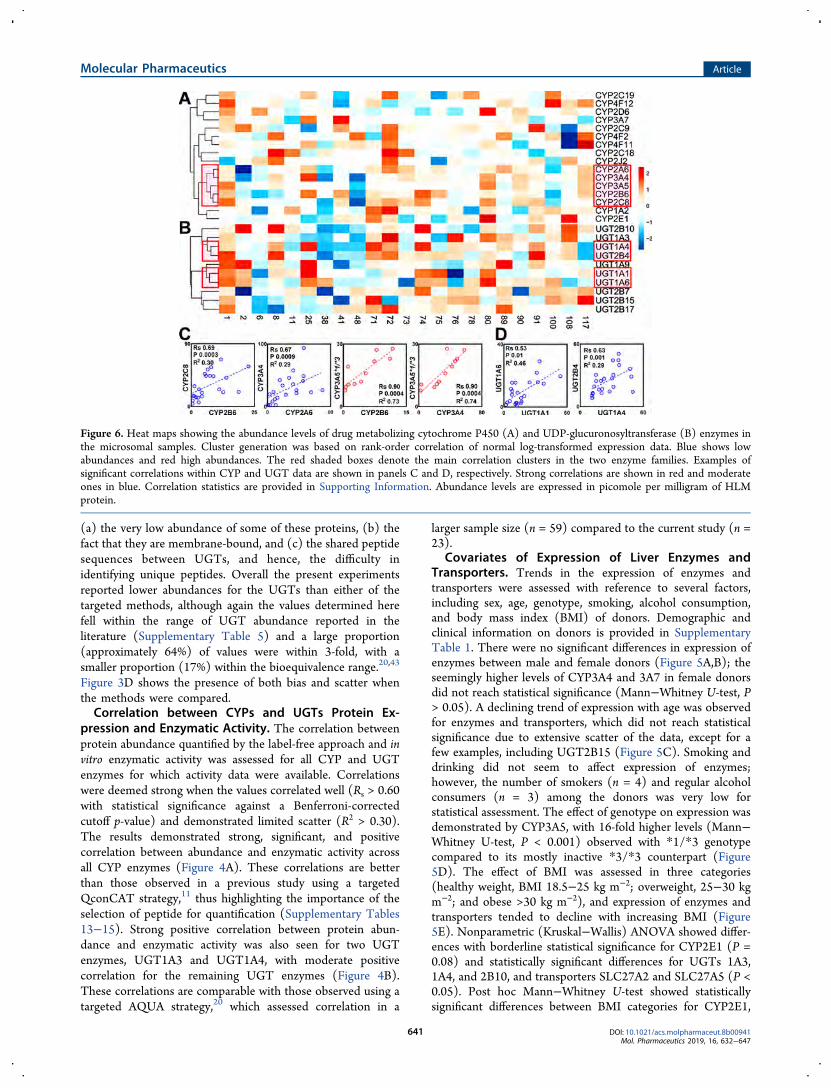
Figure 6. Heat maps showing the abundance levels of drug metabolizing cytochrome P450 (A) and UDP-glucuronosyltransferase (B) enzymes inthe microsomal samples. Cluster generation was based on rank-order correlation of normal log-transformed expression data. Blue shows lowabundances and red high abundances. The red shaded boxes denote the main correlation clusters in the two enzyme families. Examples ofsignificant correlations within CYP and UGT data are shown in panels C and D, respectively. Strong correlations are shown in red and moderateones in blue. Correlation statistics are provided in Supporting Information. Abundance levels are expressed in picomole per milligram of HLMprotein.
Molecular Pharmaceutics Article
DOI: 10.1021/acs.molpharmaceut.8b00941Mol. Pharmaceutics 2019, 16, 632−647
641
UGTs 1A3, 1A4, and 2B10, and SLCs 27A2 and 27A5 (P <0.05). The average age for the three categories was 42.3, 46.1,and 55.4 years, so the effect of BMI may have beenconfounded by age.Correlations of Expression between Hepatic Drug-
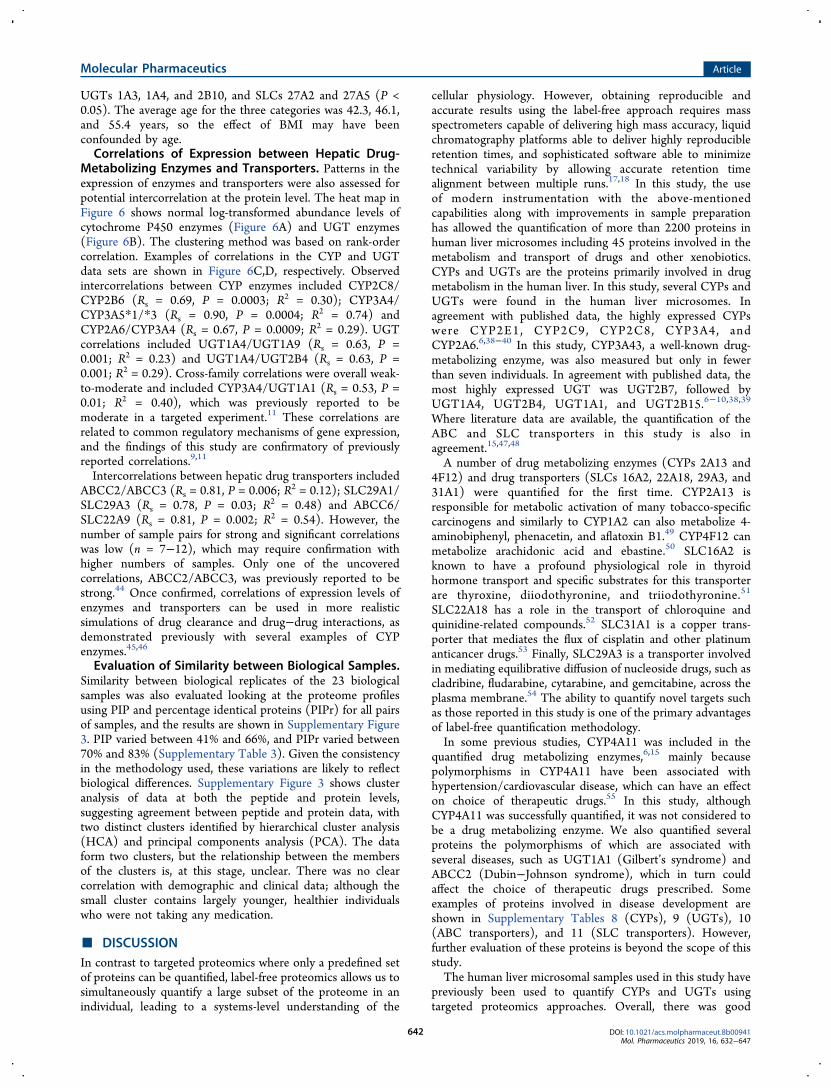
Metabolizing Enzymes and Transporters. Patterns in theexpression of enzymes and transporters were also assessed forpotential intercorrelation at the protein level. The heat map inFigure 6 shows normal log-transformed abundance levels ofcytochrome P450 enzymes (Figure 6A) and UGT enzymes(Figure 6B). The clustering method was based on rank-ordercorrelation. Examples of correlations in the CYP and UGTdata sets are shown in Figure 6C,D, respectively. Observedintercorrelations between CYP enzymes included CYP2C8/CYP2B6 (Rs = 0.69, P = 0.0003; R2 = 0.30); CYP3A4/CYP3A5*1/*3 (Rs = 0.90, P = 0.0004; R2 = 0.74) andCYP2A6/CYP3A4 (Rs = 0.67, P = 0.0009; R2 = 0.29). UGTcorrelations included UGT1A4/UGT1A9 (Rs = 0.63, P =0.001; R2 = 0.23) and UGT1A4/UGT2B4 (Rs = 0.63, P =0.001; R2 = 0.29). Cross-family correlations were overall weak-to-moderate and included CYP3A4/UGT1A1 (Rs = 0.53, P =0.01; R2 = 0.40), which was previously reported to bemoderate in a targeted experiment.11 These correlations arerelated to common regulatory mechanisms of gene expression,and the findings of this study are confirmatory of previouslyreported correlations.9,11
Intercorrelations between hepatic drug transporters includedABCC2/ABCC3 (Rs = 0.81, P = 0.006; R2 = 0.12); SLC29A1/SLC29A3 (Rs = 0.78, P = 0.03; R2 = 0.48) and ABCC6/SLC22A9 (Rs = 0.81, P = 0.002; R2 = 0.54). However, thenumber of sample pairs for strong and significant correlationswas low (n = 7−12), which may require confirmation withhigher numbers of samples. Only one of the uncoveredcorrelations, ABCC2/ABCC3, was previously reported to bestrong.44 Once confirmed, correlations of expression levels ofenzymes and transporters can be used in more realisticsimulations of drug clearance and drug−drug interactions, asdemonstrated previously with several examples of CYPenzymes.45,46
Evaluation of Similarity between Biological Samples.Similarity between biological replicates of the 23 biologicalsamples was also evaluated looking at the proteome profilesusing PIP and percentage identical proteins (PIPr) for all pairsof samples, and the results are shown in Supplementary Figure3. PIP varied between 41% and 66%, and PIPr varied between70% and 83% (Supplementary Table 3). Given the consistencyin the methodology used, these variations are likely to reflectbiological differences. Supplementary Figure 3 shows clusteranalysis of data at both the peptide and protein levels,suggesting agreement between peptide and protein data, withtwo distinct clusters identified by hierarchical cluster analysis(HCA) and principal components analysis (PCA). The dataform two clusters, but the relationship between the membersof the clusters is, at this stage, unclear. There was no clearcorrelation with demographic and clinical data; although thesmall cluster contains largely younger, healthier individualswho were not taking any medication.
■ DISCUSSIONIn contrast to targeted proteomics where only a predefined setof proteins can be quantified, label-free proteomics allows us tosimultaneously quantify a large subset of the proteome in anindividual, leading to a systems-level understanding of the
cellular physiology. However, obtaining reproducible andaccurate results using the label-free approach requires massspectrometers capable of delivering high mass accuracy, liquidchromatography platforms able to deliver highly reproducibleretention times, and sophisticated software able to minimizetechnical variability by allowing accurate retention timealignment between multiple runs.17,18 In this study, the useof modern instrumentation with the above-mentionedcapabilities along with improvements in sample preparationhas allowed the quantification of more than 2200 proteins inhuman liver microsomes including 45 proteins involved in themetabolism and transport of drugs and other xenobiotics.CYPs and UGTs are the proteins primarily involved in drugmetabolism in the human liver. In this study, several CYPs andUGTs were found in the human liver microsomes. Inagreement with published data, the highly expressed CYPswere CYP2E1, CYP2C9, CYP2C8, CYP3A4, andCYP2A6.6,38−40 In this study, CYP3A43, a well-known drug-metabolizing enzyme, was also measured but only in fewerthan seven individuals. In agreement with published data, themost highly expressed UGT was UGT2B7, followed byUGT1A4, UGT2B4, UGT1A1, and UGT2B15.6−10,38,39
Where literature data are available, the quantification of theABC and SLC transporters in this study is also inagreement.15,47,48
A number of drug metabolizing enzymes (CYPs 2A13 and4F12) and drug transporters (SLCs 16A2, 22A18, 29A3, and31A1) were quantified for the first time. CYP2A13 isresponsible for metabolic activation of many tobacco-specificcarcinogens and similarly to CYP1A2 can also metabolize 4-aminobiphenyl, phenacetin, and aflatoxin B1.49 CYP4F12 canmetabolize arachidonic acid and ebastine.50 SLC16A2 isknown to have a profound physiological role in thyroidhormone transport and specific substrates for this transporterare thyroxine, diiodothyronine, and triiodothyronine.51
SLC22A18 has a role in the transport of chloroquine andquinidine-related compounds.52 SLC31A1 is a copper trans-porter that mediates the flux of cisplatin and other platinumanticancer drugs.53 Finally, SLC29A3 is a transporter involvedin mediating equilibrative diffusion of nucleoside drugs, such ascladribine, fludarabine, cytarabine, and gemcitabine, across theplasma membrane.54 The ability to quantify novel targets suchas those reported in this study is one of the primary advantagesof label-free quantification methodology.In some previous studies, CYP4A11 was included in the
quantified drug metabolizing enzymes,6,15 mainly becausepolymorphisms in CYP4A11 have been associated withhypertension/cardiovascular disease, which can have an effecton choice of therapeutic drugs.55 In this study, althoughCYP4A11 was successfully quantified, it was not considered tobe a drug metabolizing enzyme. We also quantified severalproteins the polymorphisms of which are associated withseveral diseases, such as UGT1A1 (Gilbert’s syndrome) andABCC2 (Dubin−Johnson syndrome), which in turn couldaffect the choice of therapeutic drugs prescribed. Someexamples of proteins involved in disease development areshown in Supplementary Tables 8 (CYPs), 9 (UGTs), 10(ABC transporters), and 11 (SLC transporters). However,further evaluation of these proteins is beyond the scope of thisstudy.The human liver microsomal samples used in this study have
previously been used to quantify CYPs and UGTs usingtargeted proteomics approaches. Overall, there was good
Molecular Pharmaceutics Article
DOI: 10.1021/acs.molpharmaceut.8b00941Mol. Pharmaceutics 2019, 16, 632−647
642

agreement in protein abundance measurements between thelabel-free approach used in the present study and the previoustargeted proteomic approaches; nonetheless, the results are notidentical. This can be due to several factors. First, label-freequantification assumes a uniform correlation between peptidepeak intensity and its abundance, which is not true sincedifferent peptides present at the same concentration generatemass spectrometric signals of different intensities.12 The Hi-3method can theoretically offset peptide-specific bias to somedegree by using the median of the three most intense signalsfor each protein. Taking this into account, in contrast totargeted proteomics, label-free analysis is not intrinsically anabsolute quantification strategy. Second, differences inabundance of proteins quantified using label-free and targetedproteomics may be affected by the proteins and peptides usedas standards for quantification. In particular, the choice ofsignature peptides for targeted quantification of CYP, UGT,and transporter proteins is challenging and relies on stringentcriteria. We compared the peptides used for label-free analysiswith those used for targeted quantification (where available),and there was limited overlap between the two sets(Supplementary Tables 13−15). In addition, appraisal of theset of peptides used for the global analysis indicated theirsuitability as surrogates. Most importantly, the discrepancies inobserved protein abundances may well be driven by differencesin workflows used for sample preparation (SupplementaryTable 17) with no consensus on standardized methodology. Instudies involving drug metabolism in the liver, proteinabundances obtained from mass spectrometric analysis arenormalized to the mass of liver microsomal fractions. However,the purity of microsomal fractions is not typically reported,which makes interlaboratory comparisons of results quitechallenging. Although only 19% of the results were within thebioequivalence range of 0.8- to 1.25-fold,43 which is extremelystrict for this purpose, in the majority of cases (67% of allratios), the two methods yielded a fold difference of less than3.20 Analysis of the AFE and AAFE showed that the untargetedmethodology gives systematically lower results than thetargeted methods for UGTs but not for CYPs. In principle,we would expect targeted methodology to yield more accuratequantification, because the standards are simple isotopomers ofthe peptides being assessed, whereas untargeted methods relyon medians of dissimilar standards. In practice, poor choice ofstandards, transitions, or molar ratio of standard to sample cancompromise targeted measurements, and only the last of theseapplies to untargeted experiments. Both sets of measurementsshow good agreement with activity data, but the activity data isnot based on absolute amounts of enzymes (CYPs or UGTs)so cannot be used to arbitrate between the proteomicsmeasurements. Nevertheless, assessment of correlationsbetween protein abundances estimated by the label-free andtargeted approaches indicated that the data were generallywell-correlated, as shown in Supplementary Table 16.The real advantage of label-free measurements, especially
when acquired using state-of-the-art mass spectrometry, is thata very large number of proteins may be quantifiedsimultaneously. The additional proteins include markers ofdifferent cell types and cellular components, enabling anassessment of the purity of biological samples not immediatelyavailable by other methods. Human liver microsomes were,until recently, thought to be composed predominantly ofendoplasmic reticulum from the parenchymal hepatocytes.56
Discrepancies in the total number detected in liver systems, as
reported previously,15 may well be due to the nature of thesystem being analyzed, with analyses of whole cell lysatesgenerally identifying higher numbers of proteins compared toenriched fractions, such as microsomes. Other differences canbe attributed to several methodological factors that can affectevery step of the experimental workflow. Recently, it has beenshown that microsomal fractions are typically heterogeneous,enriching endoplasmic reticulum but also proteins from othercellular compartments.29 The reliability of quantification ofproteins of interest may therefore be compromised byvariability in the levels of nonreticular proteins. On thepositive side, the contamination by other cell types and cellularcomponents was very consistent across these samples, rangingfrom 22% to 32%. Label-free methodology is expected to beparticularly powerful when microsomal preparations fromdifferent sources are compared. Cytosolic enzymes involvedin drug-metabolism (e.g., sulfotransferases or glutathionetransferases) were also detected in the microsomal fractions;however, since the cytosol represents a contaminant tomicrosomal preparations, these abundance data should beestablished in a more representative fraction, such as, cytosolor homogenate, in order for these data to be used in systemspharmacology modeling and extrapolation exercises.Drug-metabolizing enzymes and transporters have histor-
ically been quantified in units of picomole per milligram ofmicrosomal protein. This is also the case in this manuscript.We have previously shown that varying expression of the mostabundant proteins can affect the apparent abundance of theproteins involved in drug metabolism and transport, whenexpressed as picomole of protein per milligram of microsomalprotein.29,37,57 We and others have therefore advocated the useof picomole per gram of tissue as a way of overcoming theeffects of the most abundant proteins in the human livermicrosomes on absolute quantification of the abundance ofdrug metabolizing enzymes and transporters.29,37,57 Thepresent study points to a still more important reason for achange in unit, the possibility of varying amounts ofcontamination. There are, of course, limitations to using tissuemass as a standard for these measurements, although theliterature is encouraging.Simulations of drug trials rely on the use of scaling factors,
including abundance levels, with realistic variability andcorrelations with clinical and demographic factors.5 Our datarevealed large levels of interindividual variation across CYPenzymes (4−340-fold), UGT enzymes (5−70-fold), ABCtransporters (7−200-fold), and SLC transporters (4−27-fold),highlighting the importance of elucidating and incorporatingsources of variability. There were no significant sex-relateddifferences in abundance of enzymes and transporters,consistent with a recent meta-analysis of CYP proteinabundance.42 The overall trend of age-related decline inenzyme and transporter levels, although with no statisticalsignificance in most cases, seemed to be a consistentobservation, which requires further confirmation. The effectof age after maturation of expression has previously beenreported to be minimal on abundance and activity of CYPenzymes per mass of liver.58−60 However, in vivo metabolicratios analysis showed a decrease in whole liver metaboliccapacity with age, mirroring the decline in renal function.61
These two observations can be explained by a decline in liversize to match body size decrease in older adults,62
accompanied by a decrease in the amount of liver proteinper gram of liver.63 Therefore, although the abundance levels
Molecular Pharmaceutics Article
DOI: 10.1021/acs.molpharmaceut.8b00941Mol. Pharmaceutics 2019, 16, 632−647
643
normalized to microsomal protein content seem minimallyaffected, there are indications that whole liver content of suchenzymes and transporters may be affected. This finding iscorroborated by reduced drug hepatic clearance observed inolder patients.64
Out of all the factors examined, genotype is perhaps themost clinically recognized covariate of expression and activity.The data in this study confirmed previously highlightedgenotype-specific differences in the expression of CYP3A511,65
and CYP2D6.66 These differences in expression are expectedto propagate to differences in enzymatic activity and thereforehepatic clearance of substrate drugs of these enzymes. Inaddition, our data suggest that higher body mass index (BMI)is consistent with a decline in the expression of enzymes andtransporters, in line with recent evidence.67 This observation isconsistent with the pro-inflammatory effect of obesity leadingto decreased enzymatic and transporter activity.68 Theanalyzed set of samples was mostly from older obese oroverweight donors, which should be considered when usingthe generated data.Although information related to expression covariates has
the potential to improve the accuracy of predicting drugclearance and drug−drug interactions, it can be argued thatthese factors are still not utilized effectively. This highlights theimportance of collecting data on very well-characterizedpopulations, such as the present data set. Another very usefulaspect of abundance data that has recently been incorporatedinto modeling exercises is intercorrelations between individualproteins.45,46 The data set uncovered several correlations thatcan be used to build more realistic systems pharmacologymodels, including the intercorrelations CYP3A4/CYP3A5*1/*3,45 UGT1A4/UGT2B4,69 and ABCC2/ABCC3.44 Thesecan also be confirmed at the mRNA level,70,71 which furthersupports reports of common genetic regulation of expression ofenzymes and transporters. It has been reported that drugtransporter abundances quantified in microsomal fractions arefrequently overestimated. To overcome this problem, therelative expression scaling factor (REF), which accounts for thedifferences between the abundance of drug transporters inmicrosomal fractions and those in human hepatocytes, hasbeen used to improve the accuracy of in vivo drug clearance forin vitro−in vivo extrapolation.36 Such approaches, whenestablished, should enable more realistic predictions of theoutcomes of therapy and better design of dosage regimens.29
■ CONCLUSIONSWe describe a label-free proteomic approach for thequantification of drug-metabolizing enzymes and transportersin liver, based on high resolution mass spectrometry andrigorous data analysis. Validity of the data was confirmedagainst targeted proteomic data in matched samples andagainst enzyme catalytic activity. The method provides highlycomprehensive information that can be used to ascertain thequality of samples, describe expression covariates, and clusterdonors based on the primary analytes. The informationobtained generally complements that of targeted proteomics,and the label-free approach enabled quantification of two drug-metabolizing enzymes and four transporters for the first time.The pattern of expression supports the view that genotype, age,and obesity (but not gender) affect the expression of severaldrug-metabolizing enzymes and transporters. We expect thatthe use of this versatile label-free quantification approach willincrease the availability of accurate and comprehensive protein
abundance information, which will enhance prediction of drugefficacy and safety using computational models. This in turnwill enable the optimization of dosage of medicines given topatients to achieve maximal drug efficacy with limited toxicity.Considering the many existing gaps in QSP models, label-freeproteomics offers a fast solution for simultaneous quantifica-tion of a wide range of proteins as the first step, which can, intime, be complemented by more targeted measurements.
■ ASSOCIATED CONTENT*S Supporting InformationThe Supporting Information is available free of charge on theACS Publications website at DOI: 10.1021/acs.molpharma-ceut.8b00941.
Demographic and clinical information from the liverdonors, reproducibility data, comparative information ontargeted and label-free proteomics for CYPs, UGTs, andtransporters, label-free quantification information for allidentified CYPs, UGTs, and transporters, a compilationof sample preparation and analytical procedures used indifferent laboratories, pictorial representation of theexperimental workflow, and principal componentanalysis data of biological reproducibility using PIPand PIPr (PDF)
■ AUTHOR INFORMATIONCorresponding Authors*E-mail: [email protected].*E-mail: [email protected] Couto: 0000-0001-7565-4357Zubida M. Al-Majdoub: 0000-0002-1497-3140Brahim Achour: 0000-0002-2595-5626Present Address∥P.C.W.: School of Engineering, Faculty of Science,Agriculture & Engineering, Newcastle University, Newcastleupon Tyne, NE1 7RU, UK.Author Contributions⊥N.C. and Z.M.A.-M. contributed equally to this work. Thisstudy was conceived by N.C., Z.M.A.-M., and J.B. N.C. andZ.M.A.-M. performed the experiments. Data analysis wasperformed by N.C., Z.M.A.-M., B.A., and J.B. All authorscontributed to the writing of the manuscript.NotesThe authors declare no competing financial interest.
■ ACKNOWLEDGMENTSThe authors thank Pfizer (Groton, CT) for providing HLMsamples along with demographic, clinical, and enzymaticactivity data, the ChELSI Institute, University of Sheffield,for access to LC-MS/MS instrumentation (funded underBBSRC grant BB/M012166/1 and EPSRC grant EP/E036252/1), and the Bio-MS core facility, University ofManchester, for access to Progenesis software. We also thankDr. Anna Vildhede (AstraZeneca) for providing label-free datafrom her study.
■ ABBREVIATIONSABC, ATP-binding cassette; ADME, absorption, distribution,metabolism, and elimination; AQUA, absolute quantification;BSA, bovine serum albumin; CYP, cytochrome P450; DDI,
Molecular Pharmaceutics Article
DOI: 10.1021/acs.molpharmaceut.8b00941Mol. Pharmaceutics 2019, 16, 632−647
644

drug−drug interaction; FASP, filter-aided sample preparation;HLM, human liver microsome; IVIVE, in vitro−in vivoextrapolation; LC-MS/MS, liquid chromatography-tandemmass spectrometry; PBPK, physiologically based pharmacoki-netics; QconCAT, quantification concatemer; SLC, solutecarrier; UGT, uridine 5′-diphosphate-glucuronosyltransferase;UPLC, ultraperformance liquid chromatography
■ REFERENCES(1) Jamei, M. Recent Advances in Development and Application ofPhysiologically-Based Pharmacokinetic (PBPK) Models: A Transitionfrom Academic Curiosity to Regulatory Acceptance. CurrentPharmacology Reports 2016, 2, 161−169.(2) Rostami-Hodjegan, A. Physiologically Based PharmacokineticsJoined With In Vitro−In Vivo Extrapolation of ADME: A MarriageUnder the Arch of Systems Pharmacology. Clin. Pharmacol. Ther.2012, 92 (1), 50−61.(3) FDA Program of physiologically-based pharmacokinetic andpharmacodynamic modeling (PBPK Program), 2018.(4) Turner, R. M.; Park, B. K.; Pirmohamed, M. ParsingInterindividual Drug Variability: An Emerging Role for SystemsPharmacology. Wiley Interdisciplinary Reviews: Systems Biology andMedicine 2015, 7, 221−241.(5) Rostami-Hodjegan, A.; Tucker, G. T. Simulation and Predictionof in Vivo Drug Metabolism in Human Populations from in VitroData. Nat. Rev. Drug Discovery 2007, 6, 140−148.(6) Ohtsuki, S.; Schaefer, O.; Kawakami, H.; Inoue, T.; Liehner, S.;Saito, A.; Ishiguro, N.; Kishimoto, W.; Ludwig-Schwellinger, E.;Ebner, T.; et al. Simultaneous Absolute Protein Quantification ofTransporters, Cytochromes P450, and UDP-Glucuronosyltransferasesas a Novel Approach for the Characterization of Individual HumanLiver: Comparison with MRNA Levels and Activities. Drug Metab.Dispos. 2012, 40 (1), 83−92.(7) Sato, Y.; Nagata, M.; Tetsuka, K.; Tamura, K.; Miyashita, A.;Kawamura, A.; Usui, T. Optimized Methods for Targeted Peptide-Based Quantification of Human Uridine 5′-Diphosphate-Glucurono-syltransferases in Biological Specimens Using Liquid Chromatog-raphy-Tandem Mass Spectrometry. Drug Metab. Dispos. 2014, 42 (5),885−889.(8) Harbourt, D. E.; Fallon, J. K.; Ito, S.; Baba, T.; Ritter, J. K.; Glish,G. L.; Smith, P. C. Quantification of Human Uridine-DiphosphateGlucuronosyl Transferase 1A Isoforms in Liver, Intestine, and KidneyUsing Nanobore Liquid Chromatography−Tandem Mass Spectrom-etry. Anal. Chem. 2012, 84 (1), 98−105.(9) Margaillan, G.; Rouleau, M.; Klein, K.; Fallon, J. K.; Caron, P.;Villeneuve, L.; Smith, P. C.; Zanger, U. M.; Guillemette, C.Multiplexed Targeted Quantitative Proteomics Predicts HepaticGlucuronidation Potential. Drug Metab. Dispos. 2015, 43 (9),1331−1335.(10) Fallon, J. K.; Neubert, H.; Hyland, R.; Goosen, T. C.; Smith, P.C. Targeted Quantitative Proteomics for the Analysis of 14 UGT1Asand −2Bs in Human Liver Using NanoUPLC-MS/MS with SelectedReaction Monitoring. J. Proteome Res. 2013, 12 (10), 4402−4413.(11) Achour, B.; Russell, M. R.; Barber, J.; Rostami-Hodjegan, A.Simultaneous Quantification of the Abundance of Several Cyto-chrome P450 and Uridine 5′-Diphospho-GlucuronosyltransferaseEnzymes in Human Liver Microsomes Using Multiplexed TargetedProteomics. Drug Metab. Dispos. 2014, 42 (4), 500−510.(12) Couto, N.; Barber, J.; Gaskell, S. J. Matrix-Assisted LaserDesorption/Ionisation Mass Spectrometric Response Factors ofPeptides Generated Using Different Proteolytic Enzymes. J. MassSpectrom. 2011, 46 (12), 1233−1240.(13) Wegler, C.; Gaugaz, F. Z.; Andersson, T. B.; Wisniewski, J. R.;Busch, D.; Groer, C.; Oswald, S.; Noren, A.; Weiss, F.; Hammer, H.S.; et al. Variability in Mass Spectrometry-Based Quantification ofClinically Relevant Drug Transporters and Drug MetabolizingEnzymes. Mol. Pharmaceutics 2017, 14 (9), 3142−3151.
(14) Wisniewski, J. R.; Zougman, A.; Nagaraj, N.; Mann, M.Universal Sample Preparation Method for Proteome Analysis. Nat.Methods 2009, 6 (5), 359−362.(15) Vildhede, A.; Wisniewski, J. R.; Noren, A.; Karlgren, M.;Artursson, P. Comparative Proteomic Analysis of Human Liver Tissueand Isolated Hepatocytes with a Focus on Proteins Determining DrugExposure. J. Proteome Res. 2015, 14 (8), 3305−3314.(16) Al Feteisi, H.; Achour, B.; Barber, J.; Rostami-Hodjegan, A.Choice of LC-MS Methods for the Absolute Quantification of Drug-Metabolizing Enzymes and Transporters in Human Tissue: AComparative Cost Analysis. AAPS J. 2015, 17 (12), 438−446.(17) Neilson, K. A.; Ali, N. A.; Muralidharan, S.; Mirzaei, M.;Mariani, M.; Assadourian, G.; Lee, A.; Van Sluyter, S. C.; Haynes, P.A. Less Label, More Free: Approaches in Label-Free QuantitativeMass Spectrometry. Proteomics 2011, 11 (4), 535−553.(18) Megger, D. A.; Bracht, T.; Meyer, H. E.; Sitek, B. Label-FreeQuantification in Clinical Proteomics. Biochim. Biophys. Acta, ProteinsProteomics 2013, 1834 (8), 1581−1590.(19) Wisniewski, J. R.; Wegler, C.; Artursson, P. Multiple-Enzyme-Digestion Strategy Improves Accuracy and Sensitivity of Label- andStandard-Free Absolute Quantification to a Level That Is Achievableby Analysis with Stable Isotope-Labeled Standard Spiking. J. ProteomeRes. 2018, 18 (1), 217−224.(20) Achour, B.; Dantonio, A.; Niosi, M.; Novak, J. J.; Fallon, J. K.;Barber, J.; Smith, P. C.; Rostami-Hodjegan, A.; Goosen, T. C.Quantitative Characterization of Major Hepatic UDP-Glucuronosyl-transferase Enzymes in Human Liver Microsomes: Comparison ofTwo Proteomic Methods and Correlation with Catalytic Activity.Drug Metab. Dispos. 2017, 45 (10), 1102−1112.(21) Langenfeld, E.; Zanger, U. M.; Jung, K.; Meyer, H. E.; Marcus,K. Mass Spectrometry-Based Absolute Quantification of MicrosomalCytochrome P450 2D6 in Human Liver. Proteomics 2009, 9 (9),2313−2323.(22) Bradford, M. M. A Rapid and Sensitive Method for theQuantitation of Microgram Quantities of Protein Utilizing thePrinciple of Protein-Dye Binding. Anal. Biochem. 1976, 72 (1−2),248−254.(23) Al Feteisi, H.; Al-Majdoub, Z. M.; Achour, B.; Couto, N.;Rostami-Hodjegan, A.; Barber, J. Identification and Quantification ofBlood-Brain Barrier Transporters in Isolated Rat Brain Microvessels. J.Neurochem. 2018, 146 (6), 670−685.(24) Silva, J. C.; et al. Absolute Quantification of Proteins byLCMSE: A Virtue of Parallel Ms Acquisition. Mol. Cell. Proteomics2006, 5 (1), 144−156.(25) Achour, B.; Dantonio, A.; Niosi, M.; Novak, J. J.; Al-Majdoub,Z. M.; Goosen, T. C.; Rostami-Hodjegan, A.; Barber, J. DataGenerated by Quantitative Liquid Chromatography-Mass Spectrom-etry Proteomics Are Only the Start and Not the Endpoint:Optimization of Quantitative Concatemer-Based Measurement ofHepatic Uridine-5′-Diphosphate−Glucuronosyltransferase Enzymeswith Reference to Catalytic Activity. Drug Metab. Dispos. 2018, 46(6), 805−812.(26) Walsky, R. L.; Obach, R. S. Validated Assays for HumanCytochrome P450 Activities. Drug Metab. Dispos. 2004, 32 (6), 647−660.(27) Walsky, R. L.; Obach, R. S.; Hyland, R.; Kang, P.; Zhou, S.;West, M.; Geoghegan, K. F.; Helal, C. J.; Walker, G. S.; Goosen, T.C.; et al. Selective Mechanism-Based Inactivation of CYP3A4 byCYP3cide (PF-04981517) and Its Utility as an in Vitro Tool forDelineating the Relative Roles of CYP3A4 versus CYP3A5 in theMetabolism of Drugs. Drug Metab. Dispos. 2012, 40 (9), 1686−1697.(28) Walsky, R. L.; Bauman, J. N.; Bourcier, K.; Giddens, G.;Lapham, K.; Negahban, A.; Ryder, T. F.; Obach, R. S.; Hyland, R.;Goosen, T. C. Optimized Assays for Human UDP-Glucuronosyl-transferase (UGT) Activities: Altered Alamethicin Concentration andUtility to Screen for UGT Inhibitors. Drug Metab. Dispos. 2012, 40(5), 1051−1065.(29) Achour, B.; Al Feteisi, H.; Lanucara, F.; Rostami-Hodjegan, A.;Barber, J. Global Proteomic Analysis of Human Liver Microsomes:
Molecular Pharmaceutics Article
DOI: 10.1021/acs.molpharmaceut.8b00941Mol. Pharmaceutics 2019, 16, 632−647
645

Rapid Characterization and Quantification of Hepatic Drug-Metabolizing Enzymes. Drug Metab. Dispos. 2017, 45 (6), 666−675.(30) Neufeld, C.; Filipp, F. V.; Simon, B.; Neuhaus, A.; Schuller, N.;David, C.; Kooshapur, H.; Madl, T.; Erdmann, R.; Schliebs, W.; et al.Structural Basis for Competitive Interactions of Pex14 with theImport Receptors Pex5 and Pex19. EMBO J. 2009, 28 (6), 745−754.(31) Rak, M.; Benit, P.; Chretien, D.; Bouchereau, J.; Schiff, M.; El-Khoury, R.; Tzagoloff, A.; Rustin, P. Mitochondrial Cytochrome cOxidase Deficiency. Clin. Sci. 2016, 130 (6), 393−407.(32) Prior, K. K.; Wittig, I.; Leisegang, M. S.; Groenendyk, J.;Weissmann, N.; Michalak, M.; Jansen-Durr, P.; Shah, A. M.; Brandes,R. P. The Endoplasmic Reticulum Chaperone Calnexin Is a NADPHOxidase NOX4 Interacting Protein. J. Biol. Chem. 2016, 291 (13),7045−7059.(33) Peters, D. T.; Henderson, C. A.; Warren, C. R.; Friesen, M.;Xia, F.; Becker, C. E.; Musunuru, K.; Cowan, C. A. AsialoglycoproteinReceptor 1 Is a Specific Cell-Surface Marker for Isolating HepatocytesDerived from Human Pluripotent Stem Cells. Development 2016, 143(9), 1475−1481.(34) Harris, R. L.; van den Berg, C. W.; Bowen, D. J. ASGR1 andASGR2, the Genes That Encode the Asialoglycoprotein Receptor(Ashwell Receptor), Are Expressed in Peripheral Blood Monocytesand Show Interindividual Differences in Transcript Profile. Mol. Biol.Int. 2012, 2012, 1−10.(35) Miller, C. M.; Donner, A. J.; Blank, E. E.; Egger, A. W.; Kellar,B. M.; Østergaard, M. E.; Seth, P. P.; Harris, E. N. Stabilin-1 andStabilin-2 Are Specific Receptors for the Cellular Internalization ofPhosphorothioate-Modified Antisense Oligonucleotides (ASOs) inthe Liver. Nucleic Acids Res. 2016, 44 (6), 2782−2794.(36) Vildhede, A.; Nguyen, C.; Erickson, B. K.; Kunz, R. C.; Jones,R.; Kimoto, E.; Bourbonais, F.; Rodrigues, A. D.; Varma, M. V. S.Comparison of Proteomic Quantification Approaches for HepaticDrug Transporters: Multiplexed Global Quantitation Correlates withTargeted Proteomic Quantitation. Drug Metab. Dispos. 2018, 46 (5),692−696.(37) Drozdzik, M.; Busch, D.; Lapczuk, J.; Muller, J.; Ostrowski, M.;Kurzawski, M.; Oswald, S. Protein Abundance of Clinically RelevantDrug-Metabolizing Enzymes in the Human Liver and Intestine: AComparative Analysis in Paired Tissue Specimens. Clin. Pharmacol.Ther. 2018, 104 (3), 515−524.(38) Achour, B.; Russell, M. R.; Barber, J.; Rostami-Hodjegan, A.Simultaneous Quantification of the Abundance of Several Cyto-chrome P450 and Uridine 5′-Diphospho-GlucuronosyltransferaseEnzymes in Human Liver Microsomes Using Multiplexed TargetedProteomics. Drug Metab. Dispos. 2014, 42 (4), 500−510.(39) Asha, S.; Vidyavathi, M. Role of Human Liver Microsomes inIn Vitro Metabolism of DrugsA Review. Appl. Biochem. Biotechnol.2010, 160 (6), 1699−1722.(40) Zhang, H.-F.; Li, Z.-H.; Liu, J.-Y.; Liu, T.-T.; Wang, P.; Fang,Y.; Zhou, J.; Cui, M.-Z.; Gao, N.; Tian, X.; et al. Correlation ofCytochrome P450 Oxidoreductase Expression with the Expression of10 Isoforms of Cytochrome P450 in Human Liver. Drug Metab.Dispos. 2016, 44 (8), 1193−1200.(41) Achour, B.; Rostami-Hodjegan, A.; Barber, J. ProteinExpression of Various Hepatic Uridine 5′-Diphosphate Glucuronosyl-transferase (UGT) Enzymes and Their Inter-Correlations: A Meta-Analysis. Biopharm. Drug Dispos. 2014, 35 (6), 353−361.(42) Achour, B.; Barber, J.; Rostami-Hodjegan, A. Expression ofHepatic Drug-Metabolizing Cytochrome P450 Enzymes and TheirIntercorrelations: A Meta-Analysis. Drug Metab. Dispos. 2014, 42 (8),1349−1356.(43) Davit, B. M.; Nwakama, P. E.; Buehler, G. J.; Conner, D. P.;Haidar, S. H.; Patel, D. T.; Yang, Y.; Yu, L. X.; Woodcock, J.Comparing Generic and Innovator Drugs: A Review of 12 Years ofBioequivalence Data from the United States Food and DrugAdministration. Ann. Pharmacother. 2009, 43 (10), 1583−1597.(44) Mooij, M. G.; van de Steeg, E.; Van Rosmalen, J.; Windster, J.D.; de Koning, B. A. E.; Vaes, W. H.; van Groen, B. D.; Tibboel, D.;Wortelboer, H. M.; de Wildt, S. N. Proteomic Analysis of the
Developmental Trajectory of Human Hepatic Membrane TransporterProteins in the First Three Months of Life. Drug Metab. Dispos. 2016,44, 1005−1013.(45) Barter, Z. E.; Perrett, H. F.; Yeo, K. R.; Allorge, D.; Lennard, M.S.; Rostami-Hodjegan, A. Determination of a Quantitative Relation-ship between Hepatic CYP3A5*1/*3 and CYP3A4 Expression forUse in the Prediction of Metabolic Clearance in Virtual Populations.Biopharm. Drug Dispos. 2010, 31 (8−9), 516−532.(46) Doki, K.; Darwich, A. S.; Achour, B.; Tornio, A.; Backman, J.T.; Rostami-Hodjegan, A. Implications of Intercorrelation betweenHepatic CYP3A4-CYP2C8 Enzymes for the Evaluation of Drug-DrugInteractions: A Case Study with Repaglinide. Br. J. Clin. Pharmacol.2018, 84 (5), 972−986.(47) Prasad, B.; Evers, R.; Gupta, A.; Hop, C. E. C. A.; Salphati, L.;Shukla, S.; Ambudkar, S. V.; Unadkat, J. D. Interindividual Variabilityin Hepatic Organic Anion-Transporting Polypeptides and P-Glycoprotein (ABCB1) Protein Expression: Quantification by LiquidChromatography Tandem Mass Spectroscopy and Influence ofGenotype, Age, and Sex. Drug Metab. Dispos. 2014, 42 (1), 78−88.(48) Fallon, J. K.; Smith, P. C.; Xia, C. Q.; Kim, M. S. Quantificationof Four Efflux Drug Transporters in Liver and Kidney Across SpeciesUsing Targeted Quantitative Proteomics by Isotope DilutionNanoLC-MS/MS. Pharm. Res. 2016, 33 (9), 2280−2288.(49) Fukami, T.; et al. CYP2A13 Metabolizes the Substrates ofHuman CYP1A2, Phenacetin, and Theophylline. Drug Metab. Dispos.2007, 35 (3), 335−339.(50) Hashizume, T. Involvement of CYP2J2 and CYP4F12 in theMetabolism of Ebastine in Human Intestinal Microsomes. J.Pharmacol. Exp. Ther. 2002, 300 (1), 298−304.(51) Bernal, J.; Guadano-Ferraz, A.; Morte, B. Thyroid HormoneTransporters-Functions and Clinical Implications. Nat. Rev. Endo-crinol. 2015, 11 (7), 406−417.(52) Ito, S.; Fujino, Y.; Ogata, S.; Hirayama-Kurogi, M.; Ohtsuki, S.Involvement of an Orphan Transporter, SLC22A18, in Cell Growthand Drug Resistance of Human Breast Cancer MCF7 Cells. J. Pharm.Sci. 2018, 107 (12), 3163−3170.(53) Fung, K. L.; Tepede, A. K.; Pluchino, K. M.; Pouliot, L. M.;Pixley, J. N.; Hall, M. D.; Gottesman, M. M. Uptake of CompoundsThat Selectively Kill Multidrug-Resistant Cells: The Copper Trans-porter SLC31A1 (CTR1) Increases Cellular Accumulation of theThiosemicarbazone NSC73306. Mol. Pharmaceutics 2014, 11 (8),2692−2702.(54) King, A. E.; Ackley, M. A.; Cass, C. E.; Young, J. D.; Baldwin, S.A. Nucleoside Transporters: From Scavengers to Novel TherapeuticTargets. Trends Pharmacol. Sci. 2006, 27 (8), 416−425.(55) Polonikov, A.; Sirotina, S.; Ponomarenko, I.; Shvetsov, Y.;Bykanova, M.; Bocharova, A.; Vagaytseva, K.; Stepanov, V.;Solodilova, M. AB074. Genetic Variation in CYP2U1, CYP4A11and CYP4F2 Involved in the Biosynthesis of HydroxyeicosatetraenoicAcids and Susceptibility to Hypertension and Atherosclerosis ofVarious Locations. Ann. Transl. Med. 2017, 5 (S2), AB074−AB074.(56) Hewitt, N. J.; Lechon, M. J. G.; Houston, J. B.; Hallifax, D.;Brown, H. S.; Maurel, P.; Kenna, J. G.; Gustavsson, L.; Lohmann, C.;Skonberg, C.; et al. Primary Hepatocytes: Current Understanding ofthe Regulation of Metabolic Enzymes and Transporter Proteins, andPharmaceutical Practice for the Use of Hepatocytes in Metabolism,Enzyme Induction, Transporter, Clearance, and HepatotoxicityStudies. Drug Metab. Rev. 2007, 39, 159−234.(57) Prasad, B.; Bhatt, D. K.; Johnson, K.; Chapa, R.; Chu, X.;Salphati, L.; Xiao, G.; Lee, C.; Hop, C. E. C. A.; Mathias, A.; et al.Abundance of Phase 1 and 2 Drug-Metabolizing Enzymes inAlcoholic and Hepatitis C Cirrhotic Livers: A Quantitative TargetedProteomics Study. Drug Metab. Dispos. 2018, 46 (7), 943−952.(58) Wolbold, R.; Klein, K.; Burk, O.; Nussler, A. K.; Neuhaus, P.;Eichelbaum, M.; Schwab, M.; Zanger, U. M. Sex Is a MajorDeterminant of CYP3A4 Expression in Human Liver. Hepatology2003, 38, 978−988.(59) Galetin, A.; Brown, C.; Hallifax, D.; Ito, K.; Houston, J. B.Utility of Recombinant Enzyme Kinetics in Prediction of Human
Molecular Pharmaceutics Article
DOI: 10.1021/acs.molpharmaceut.8b00941Mol. Pharmaceutics 2019, 16, 632−647
646

Clearance: Impact of Variability, CYP3A5, and CYP2C19 on CYP3A4Probe Substrates. Drug Metab. Dispos. 2004, 32 (12), 1411−1420.(60) King, B. P.; Leathart, J. B. S.; Mutch, E.; Williams, F. M.; Daly,A. K. CYP3A5 Phenotype-Genotype Correlations in a BritishPopulation. Br. J. Clin. Pharmacol. 2003, 55 (6), 625−629.(61) Rostami-Hodjegan, A.; Kroemer, H. K.; Tucker, G. T. In-VivoIndices of Enzyme Activity: The Effect of Renal Impairment on theAssessment of CYP2D6 Activity. Pharmacogenetics 1999, 9 (3), 277−286.(62) Johnson, T. N.; Tucker, G. T.; Tanner, M. S.; Rostami-Hodjegan, A. Changes in Liver Volume from Birth to Adulthood: AMeta-Analysis. Liver Transplant. 2005, 11 (11), 1481−1493.(63) Barter, Z. E.; Chowdry, J. E.; Harlow, J. R.; Snawder, J. E.;Lipscomb, J. C.; Rostami-Hodjegan, A. Covariation of HumanMicrosomal Protein per Gram of Liver with Age: Absence ofInfluence of Operator and Sample Storage May Justify InterlaboratoryData Pooling. Drug Metab. Dispos. 2008, 36 (12), 2405−2409.(64) Polasek, T. M.; Patel, F.; Jensen, B. P.; Sorich, M. J.; Wiese, M.D.; Doogue, M. P. Predicted Metabolic Drug Clearance withIncreasing Adult Age. Br. J. Clin. Pharmacol. 2013, 75 (4), 1019−1028.(65) Westlind-Johnsson, A.; Malmebo, S.; Johansson, A.; Otter, C.;Andersson, T. B.; Johansson, I.; Edwards, R. J.; Boobis, A. R.;Ingelman-Sundberg, M. Comparative Analysis of CYP3A Expressionin Human Liver Suggests Only a Minor Role for CYP3A5 in DrugMetabolism. Drug Metab. Dispos. 2003, 31 (6), 755−761.(66) Zanger, U. M.; Fischer, J.; Raimundo, S.; Stuven, T.; Evert, B.O.; Schwab, M.; Eichelbaum, M. Comprehensive Analysis of theGenetic Factors Determining Expression and Function of HepaticCYP2D6. Pharmacogenetics 2001, 11, 573−585.(67) EMA. Reflection Paper on Investigation of Pharmacokineticsand Pharmacodynamics in the Obese Population. 2018, pp 1−11.(68) Morgan, E. T. Impact of Infectious and Inflammatory Diseaseon Cytochrome P450-Mediated Drug Metabolism and Pharmacoki-netics. Clin. Pharmacol. Ther. 2009, 85 (4), 434−438.(69) Margaillan, G.; Rouleau, M.; Klein, K.; Fallon, J. K.; Caron, P.;Villeneuve, L.; Smith, P. C.; Zanger, U. M.; Guillemette, C.Multiplexed Targeted Quantitative Proteomics Predicts HepaticGlucuronidation Potential. Drug Metab. Dispos. 2015, 43 (9),1331−1335.(70) Wortham, M.; Czerwinski, M.; He, L.; Parkinson, A.; Wan, Y. J.Y. Expression of Constitutive Androstane Receptor, Hepatic NuclearFactor 4α, and P450 Oxidoreductase Genes Determines Interindi-vidual Variability in Basal Expression and Activity of a Broad Scope ofXenobiotic Metabolism Genes in the Human Liver. Drug Metab.Dispos. 2007, 35 (9), 1700−1710.(71) Izukawa, T.; Nakajima, M.; Fujiwara, R.; Yamanaka, H.;Fukami, T.; Takamiya, M.; Aoki, Y.; Ikushiro, S.; Sakaki, T.; Yokoi, T.Quantitative Analysis of UGT1A and UGT2B Expression Levels inHuman Livers. Drug Metab. Dispos. 2009, 37 (8), 1759−1768.
Molecular Pharmaceutics Article
DOI: 10.1021/acs.molpharmaceut.8b00941Mol. Pharmaceutics 2019, 16, 632−647
647


![· Web viewWhile this impressive catalytic repertoire gives P450s huge potential and desirability as green alternatives to traditional organo- and metallocatalysts [7-9], there are](https://static.fdocuments.in/doc/165x107/5e3819ad27aa8964fa6518e3/web-view-while-this-impressive-catalytic-repertoire-gives-p450s-huge-potential-and.jpg)


