Quantification of Myocardial Area at Risk With T2-Weighted CMR: Comparison With Contrast-Enhanced...
7
Quantification of Myocardial Area at Risk With T2-Weighted CMR Comparison With Contrast-Enhanced CMR and Coronary Angiography Jeremy Wright, MBBS,*‡ Tom Adriaenssens, MD,† Steven Dymarkowski, MD, PHD,* Walter Desmet, MD, PHD,† Jan Bogaert, MD, PHD* Leuven, Belgium; and Brisbane, Australia OBJECTIVES We sought to quantify the myocardium at risk in reperfused acute myocardial infarction (AMI) in man with T2-weighted (T2W) cardiac magnetic resonance (CMR). BACKGROUND The myocardial area at risk (AAR) is defined as the myocardial tissue within the perfusion bed distally to the culprit lesion of the infarct-related coronary artery. T2W CMR is appealing to retrospectively determine the myocardial AAR after reperfused AMI. Data on the utility of this technique in humans are limited. METHODS One hundred eight patients with successfully reperfused ST-segment elevation AMI were studied between 1 and 20 days after percutaneous coronary intervention (PCI). We compared the volume of hyperintense myocardium on T2W CMR with the myocardial AAR determined by contrast- enhanced CMR with infarct endocardial surface length (ESL) and AAR estimated by conventional coronary angiography with the BARI (Bypass Angioplasty Revascularization Investigation) risk score. RESULTS The volume of hyperintense myocardium on T2W CMR (mean 32 16%, range 3% to 67%) was consistently larger than the volume of myocardial infarction measured with contrast-enhanced images (mean 17 12%, range 0% to 55%) (p 0.001). Myocardial salvage ranged from 4% to 45% of the left ventricular myocardium (mean 14 10%). The AAR determined by T2W CMR compared favorably with the infarct ESL (r 0.77) with contrast-enhanced CMR, and there was moderate correlation between the BARI angiographic risk score and infarct ESL (r 0.42). The time between PCI and CMR did not cause a significant difference in the volume of T2W hyperintense myocardium (r 0.11, p 0.27) or the calculated volume of salvaged myocardium (r 0.12, p 0.23). CONCLUSIONS T2W CMR performed early after successfully reperfused AMI in humans enables retrospective quantification of the myocardial AAR and salvaged myocardium. (J Am Coll Cardiol Img 2009;2:825–31) © 2009 by the American College of Cardiology Foundation From the Departments of *Radiology and †Cardiology, Gasthuisberg University Hospital, Leuven, Belgium; and the ‡Greenslopes Private Hospital, Brisbane, Australia. Manuscript received December 3, 2008; revised manuscript received February 10, 2009, accepted February 17, 2009. JACC: CARDIOVASCULAR IMAGING VOL. 2, NO. 7, 2009 © 2009 BY THE AMERICAN COLLEGE OF CARDIOLOGY FOUNDATION ISSN 1936-878X/09/$36.00 PUBLISHED BY ELSEVIER INC. DOI:10.1016/j.jcmg.2009.02.011
-
Upload
jeremy-wright -
Category
Documents
-
view
212 -
download
0
Transcript of Quantification of Myocardial Area at Risk With T2-Weighted CMR: Comparison With Contrast-Enhanced...
J A C C : C A R D I O V A S C U L A R I M A G I N G V O L . 2 , N O . 7 , 2 0 0 9
© 2 0 0 9 B Y T H E A M E R I C A N C O L L E G E O F C A R D I O L O G Y F O U N D A T I O N I S S N 1 9 3 6 - 8 7 8 X / 0 9 / $ 3 6 . 0 0
P U B L I S H E D B Y E L S E V I E R I N C . D O I : 1 0 . 1 0 1 6 / j . j c m g . 2 0 0 9 . 0 2 . 0 1 1
Quantification of Myocardial Areaat Risk With T2-Weighted CMRComparison With Contrast-Enhanced CMR and Coronary Angiography
Jeremy Wright, MBBS,*‡ Tom Adriaenssens, MD,† Steven Dymarkowski, MD, PHD,*Walter Desmet, MD, PHD,† Jan Bogaert, MD, PHD*
Leuven, Belgium; and Brisbane, Australia
O B J E C T I V E S We sought to quantify the myocardium at risk in reperfused acute myocardial
infarction (AMI) in man with T2-weighted (T2W) cardiac magnetic resonance (CMR).
B A C K G R O U N D The myocardial area at risk (AAR) is defined as the myocardial tissue within the
perfusion bed distally to the culprit lesion of the infarct-related coronary artery. T2W CMR is appealing
to retrospectively determine the myocardial AAR after reperfused AMI. Data on the utility of this
technique in humans are limited.
M E T H O D S One hundred eight patients with successfully reperfused ST-segment elevation AMI
were studied between 1 and 20 days after percutaneous coronary intervention (PCI). We compared the
volume of hyperintense myocardium on T2W CMR with the myocardial AAR determined by contrast-
enhanced CMR with infarct endocardial surface length (ESL) and AAR estimated by conventional
coronary angiography with the BARI (Bypass Angioplasty Revascularization Investigation) risk score.
R E S U L T S The volume of hyperintense myocardium on T2W CMR (mean 32 � 16%, range 3% to
67%) was consistently larger than the volume of myocardial infarction measured with contrast-enhanced
images (mean 17 � 12%, range 0% to 55%) (p � 0.001). Myocardial salvage ranged from �4% to 45%
of the left ventricular myocardium (mean 14 � 10%). The AAR determined by T2W CMR compared
favorably with the infarct ESL (r � 0.77) with contrast-enhanced CMR, and there was moderate
correlation between the BARI angiographic risk score and infarct ESL (r � 0.42). The time between PCI
and CMR did not cause a significant difference in the volume of T2W hyperintense myocardium (r � 0.11,
p � 0.27) or the calculated volume of salvaged myocardium (r � 0.12, p � 0.23).
C O N C L U S I O N S T2W CMR performed early after successfully reperfused AMI in humans enables
retrospective quantification of the myocardial AAR and salvaged myocardium. (J Am Coll Cardiol Img
2009;2:825–31) © 2009 by the American College of Cardiology Foundation
From the Departments of *Radiology and †Cardiology, Gasthuisberg University Hospital, Leuven, Belgium; and the‡Greenslopes Private Hospital, Brisbane, Australia.
Manuscript received December 3, 2008; revised manuscript received February 10, 2009, accepted February 17, 2009.
Tpimso
iedv
paisemfATiatqwa
oba
M
PtcMie2dmpodmhCcCpsbUCoBCdbwsai(emnpssqbswrmtu
A
A
A
A
i
C
r
E
l
F
L
P
i
S
c
T
T
T
M
TR � repetition time
J A C C : C A R D I O V A S C U L A R I M A G I N G , V O L . 2 , N O . 7 , 2 0 0 9
J U L Y 2 0 0 9 : 8 2 5 – 3 1
Wright et al.
Quantification of Myocardium at Risk With T2W CMR
826
he myocardial area at risk (AAR) is definedas the myocardial tissue within the perfusionbed that is distal to the culprit lesion of theinfarct-related coronary artery. In humans, the
ortion of the AAR that is irreversibly injured (i.e.,nfarcted) ranges from 0% (aborted infarction) to as
uch as 88% (1). The proportion of the AAR thaturvives—the salvaged myocardium—is dependentn multiple factors including time to reperfusion,
See page 832
schemic pre-conditioning, collateral flow, distalmbolization, reperfusion injury, and microvascularysfunction. Because the extent of myocardial sal-age determines final infarct size, quantification of
myocardial salvage is an appealing methodfor the assessment of the efficacy of differ-ent therapies for acute myocardial infarc-tion (AMI).
However, quantification of AAR re-mains challenging. Fluorescent micro-spheres are the reference standard formeasuring the AAR in animal studies. Inhumans, the most widely used technique issingle-photon emission computed tomog-raphy (SPECT), but there are many draw-backs to its widespread use. These include24-h isotope availability, additional radia-tion exposure for the patient and theoperator, and suboptimal spatial resolu-tion. Cardiac magnetic resonance (CMR)is an attractive technique to noninvasivelyquantify the AAR. First, infarct endocar-dial surface length (ESL) measured withcontrast-enhanced CMR has recentlybeen described as a measure of AAR (2).Assuming the widely accepted “wave front
henomenon” of irreversible injury during coronaryrtery occlusion (3), AAR is estimated by measur-ng the circumferential extent of endocardial necro-is (as a percentage of total left ventricular [LV]ndocardial circumference) on contrast-enhancedagnetic resonance images. The results compared
avorably with 2 angiographic risk score estimates ofAR (2). Second, it has been demonstrated that2-weighted (T2W) CMR, or “edema-weighted”
maging in animal models and patients, performedfter myocardial infarction can retrospectively iden-ify the AAR (4,5). The purpose of this study was touantify AAR in patients with reperfused AMIith T2W CMR and to compare results with both
r
y
ssion
ngiographic risk scores and infarct ESL. More- m
ver, we evaluated the influence of the time delayetween percutaneous coronary intervention (PCI)nd T2W CMR-derived AAR measures.
E T H O D S
atient population. One hundred thirty-four pa-ients with ST-segment elevation AMI and suc-essful PCI were prospectively enrolled between
ay 2003 and October 2007. Patients werencluded if they had cumulative ST-segmentlevation of 6 mm or more, PCI between 2 and4 h after symptom onset, and significant LVysfunction (hypokinesia of at least 3 contiguousyocardial segments). Exclusion criteria included
ulmonary edema, cardiogenic shock, prior cor-nary artery bypass grafting, significant renalysfunction (glomerular filtration rate �60 ml/in/1.73 m2), or other major comorbidities. One
undred nineteen consecutive patients underwentMR during the in-hospital phase. This study
omprises 108 of the 119 patients in whom T2WMR-derived AAR quantification was able to beerformed. We obtained informed written con-ent from all patients, and the study was approvedy the ethics review board of the Gasthuisbergniversity Hospital, Leuven, Belgium.MR imaging. The CMR studies were performedn a 1.5-T system (Intera, Philips Medical Systems,est, the Netherlands) with commercially availableMR software, electrocardiographic triggering,edicated cardiac surface coils, and inspiratoryreath holds. After determining the cardiac axesith localizers, vertical and horizontal long-axis and
hort-axis cine CMR was performed with a bal-nced steady-state free procession sequence. Imag-ng parameters were as follows: repetition timeTR): 3.6 ms; echo time (TE): 1.8 ms; turbo fieldcho: 14; flip angle: 60°; slice thickness: 8 mm;atrix: 160 � 256; field of view (FOV): 300 mm;
umber of phases: 30. Next, T2W CMR waserformed by encompassing the LV in cardiachort-axis direction with a dark-blood T2Whort tau inversion-recovery fast spin echo se-uence. Imaging parameters were TR: 2 hearteats; TE: 100 ms; turbo factor: 33; FOV: 350 mm;lice thickness: 8 mm. Finally, a breath-hold, T1-eighted 3-dimensional contrast-enhanced inversion-
ecovery gradient-echo sequence after intravenous ad-inistration of 0.2 mmol/kg gadolinium-diethylene
riamine pentaacetic acid in cardiac short-axis wassed to depict the presence, location, and extent of
B B R E V I A T I O N S
N D A C R O N YM S
AR � area at risk
MI � acute myocardial
nfarction
MR � cardiac magnetic
esonance
SL � endocardial surface
ength
OV � field of view
V � left ventricle/ventricula
CI � percutaneous coronar
ntervention
PECT � single-photon emi
omputed tomography
2W � T2-weighted
E � echo time
IMI � Thrombolysis In
yocardial Infarction
yocardial infarction. Imaging parameters were as
fc�1inIatttietiCab-vtcsds((aeipqhathiwocstCwagdPTlwAs
btenfBtlrAwTflwlSmfccBactvgtwC
R
Tpap(psTehlvrs(p(Cr
J A C C : C A R D I O V A S C U L A R I M A G I N G , V O L . 2 , N O . 7 , 2 0 0 9
J U L Y 2 0 0 9 : 8 2 5 – 3 1
Wright et al.
Quantification of Myocardium at Risk With T2W CMR
827
ollows: TR: 4.5 ms; TE: 1.3 ms; flip angle: 15°; 20ontiguous slices, slice thickness: 5 mm; matrix: 128
256; and FOV: 350 mm. Images were obtained0 to 20 min after contrast administration, and thenversion time was tailored to null signal fromormal myocardium.mage analysis. All CMR images were analyzed onn offline workstation (ViewForum, Philips Elec-ronics, Best, the Netherlands), and the results arehe consensus of 2 experienced observers blinded tohe angiographic data (S.D. and J.B.). To avoidnterpretation bias, T2W images and contrast-nhanced CMR images were presented separatelyo the readers in a random way, respecting annterval of 3 days between readings. Moreover,MR readers were blinded to the clinical and
ngiographical data. Endocardial and epicardialorders were delineated on the end-diastolic andsystolic short-axis slices for quantification of LVolumes, function, and mass. The AAR was quan-ified on the T2W images by delineation of myo-ardium with signal intensity 2 SDs above the meanignal obtained in the remote noninfarcted myocar-ium. If present, a central core of hypointenseignal within the area of increased signal intensityhemorrhagic infarction) was included in the AAR6,7). Increased signal intensity from the blood pooldjacent to the endocardium due to slow flow wasxcluded. The volume of T2W increased signalntensity was normalized for LV mass and ex-ressed as a percentage. Myocardial infarction wasuantified by delineation of the areas of hyperen-ancement on the contrast-enhanced CMR imagesnd was also normalized for LV mass. If present,he dark subendocardial zone in the center of theyperenhancement (microvascular obstruction) was
ncluded in the infarct volume. The infarct ESLas calculated as the percentage of summed lengthsf endocardial hyperenhancement/total LV endo-ardial surface length (again, the hypoenhancedurface of microvascular obstruction was included inhe infarct).oronary angiography. Cardiac catheterizationith selective injection of right and left coronary
rteries was performed before PCI. The angio-rams were retrospectively assessed indepen-ently by 2 angiographers (not present at theCI) blinded to the CMR data (J.W. and T.A.).he anatomic area at risk distally to the culprit
esion in the infarct-related artery was estimatedith the adapted angiographic BARI (Bypassngioplasty Revascularization Investigation)
coring system (8). Right ventricular marginal (
ranches, atrial branches, and septal branches ofhe posterior descending coronary artery werexcluded from the analysis. All remaining termi-ating coronary arteries were qualitatively gradedrom 0 to 3 on the basis of relative length. TheARI risk score was defined as the percentage of
he sum scores of the vessels distal to the culpritesion divided by the total LV score. Noninfarct-elated artery stenoses did not contribute to theAR (Fig. 1). Consensus between angiographersas used for subsequent analysis. When thehrombolysis In Myocardial Infarction (TIMI)ow grade was �0 before PCI, the culprit vesselas verified by the 12-lead electrocardiogram and
eft ventriculography in 2 orthogonal planes.tatistical analysis. Continuous data are reported asean � SD, and categorical data are reported as
requencies and percentages. Correlations betweenontinuous variables were assessed with Pearson’sorrelation coefficient r. The technique proposed byland and Altman was used to compare T2W AARnd BARI risk score with infarct ESL. Discrepan-ies between T2W AAR and infarct ESL correlatedo clinical factors with Pearson’s r (continuousariables) and 1-way analysis of variance for cate-orical variables. All tests were 2-tailed, and statis-ical significance was accepted at p � 0.05. Dataere analyzed with SPSS version 15.0 (SPSS Inc.,hicago, Illinois).
E S U L T S
he demographic data of the 108 patients areresented in Table 1. The culprit vessel was the leftnterior descending coronary artery in 48 (44%)atients, the left circumflex coronary artery in 1211%), and the right coronary artery in 48 (44%)atients. All patients had a region of increasedignal intensity detected on T2W CMR (Fig. 2).hree patients had no increased signal on contrast-
nhanced CMR (aborted infarcts), and 4 patientsad evidence of prior infarction (in different vascu-
ar territories) on contrast-enhanced CMR. Micro-ascular obstruction was identified in 69 patients,ange 0 to 80 g (mean 6.3 � 10.7 g). Time fromymptom onset to PCI ranged from 120 to 720 minmean 250 � 139 min). The CMR was usuallyerformed within 1 week of PCI, range 22 to 496 hmean 93 � 64 h).omparison of infarct size and (T2W AAR). Infarct sizeanged from 0% to 55% of the LV myocardium
mean 17 � 12%). The T2W AAR ranged from 3%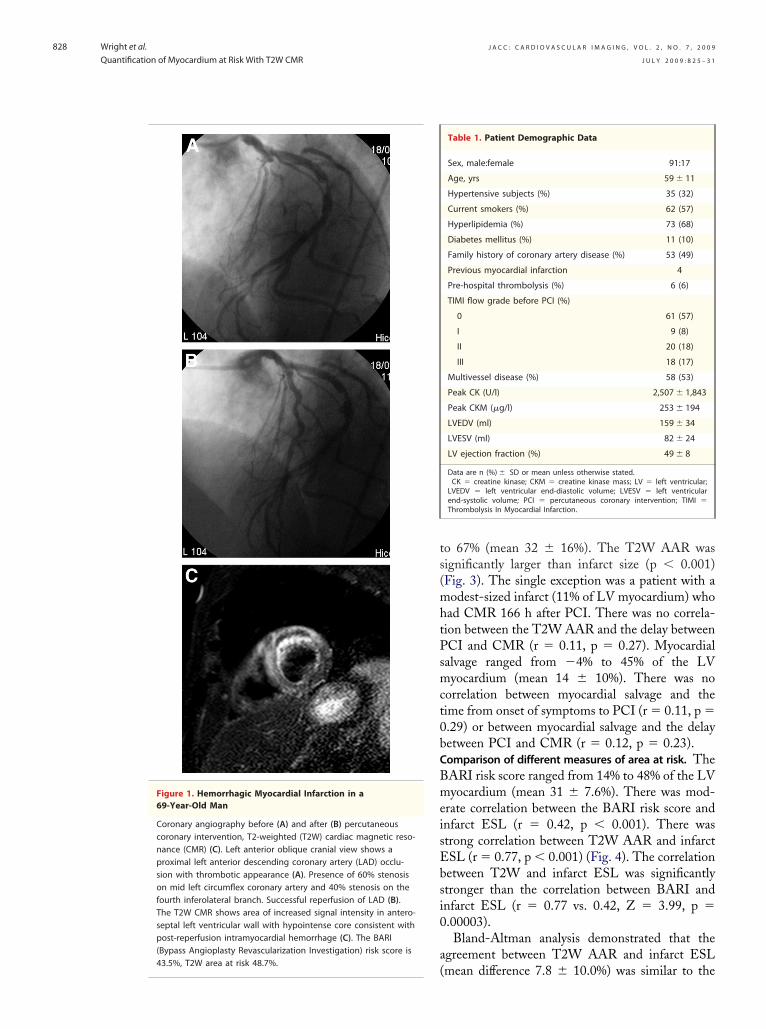
ts(mhtPsmct0bCBmeisEbsi0
a(
43.5%, T2W area at risk 48.7%.
J A C C : C A R D I O V A S C U L A R I M A G I N G , V O L . 2 , N O . 7 , 2 0 0 9
J U L Y 2 0 0 9 : 8 2 5 – 3 1
Wright et al.
Quantification of Myocardium at Risk With T2W CMR
828
o 67% (mean 32 � 16%). The T2W AAR wasignificantly larger than infarct size (p � 0.001)Fig. 3). The single exception was a patient with aodest-sized infarct (11% of LV myocardium) who
ad CMR 166 h after PCI. There was no correla-ion between the T2W AAR and the delay betweenCI and CMR (r � 0.11, p � 0.27). Myocardialalvage ranged from �4% to 45% of the LVyocardium (mean 14 � 10%). There was no
orrelation between myocardial salvage and theime from onset of symptoms to PCI (r � 0.11, p �.29) or between myocardial salvage and the delayetween PCI and CMR (r � 0.12, p � 0.23).omparison of different measures of area at risk. TheARI risk score ranged from 14% to 48% of the LVyocardium (mean 31 � 7.6%). There was mod-
rate correlation between the BARI risk score andnfarct ESL (r � 0.42, p � 0.001). There wastrong correlation between T2W AAR and infarctSL (r � 0.77, p � 0.001) (Fig. 4). The correlationetween T2W and infarct ESL was significantlytronger than the correlation between BARI andnfarct ESL (r � 0.77 vs. 0.42, Z � 3.99, p �.00003).Bland-Altman analysis demonstrated that the
greement between T2W AAR and infarct ESL
Table 1. Patient Demographic Data
Sex, male:female 91:17
Age, yrs 59 � 11
Hypertensive subjects (%) 35 (32)
Current smokers (%) 62 (57)
Hyperlipidemia (%) 73 (68)
Diabetes mellitus (%) 11 (10)
Family history of coronary artery disease (%) 53 (49)
Previous myocardial infarction 4
Pre-hospital thrombolysis (%) 6 (6)
TIMI flow grade before PCI (%)
0 61 (57)
I 9 (8)
II 20 (18)
III 18 (17)
Multivessel disease (%) 58 (53)
Peak CK (U/l) 2,507 � 1,843
Peak CKM (�g/l) 253 � 194
LVEDV (ml) 159 � 34
LVESV (ml) 82 � 24
LV ejection fraction (%) 49 � 8
Data are n (%) � SD or mean unless otherwise stated.CK � creatine kinase; CKM � creatine kinase mass; LV � left ventricular;
LVEDV � left ventricular end-diastolic volume; LVESV � left ventricularend-systolic volume; PCI � percutaneous coronary intervention; TIMI �Thrombolysis In Myocardial Infarction.
Figure 1. Hemorrhagic Myocardial Infarction in a69-Year-Old Man
Coronary angiography before (A) and after (B) percutaneouscoronary intervention, T2-weighted (T2W) cardiac magnetic reso-nance (CMR) (C). Left anterior oblique cranial view shows aproximal left anterior descending coronary artery (LAD) occlu-sion with thrombotic appearance (A). Presence of 60% stenosison mid left circumflex coronary artery and 40% stenosis on thefourth inferolateral branch. Successful reperfusion of LAD (B).The T2W CMR shows area of increased signal intensity in antero-septal left ventricular wall with hypointense core consistent withpost-reperfusion intramyocardial hemorrhage (C). The BARI(Bypass Angioplasty Revascularization Investigation) risk score is
mean difference 7.8 � 10.0%) was similar to the
adDTetLdnPv
D
TqcitwsaeqbsdAm
nrti
pd
bracagsr
J A C C : C A R D I O V A S C U L A R I M A G I N G , V O L . 2 , N O . 7 , 2 0 0 9
J U L Y 2 0 0 9 : 8 2 5 – 3 1
Wright et al.
Quantification of Myocardium at Risk With T2W CMR
829
greement between BARI and infarct ESL (meanifference 7.3 � 11.2%) (Fig. 5).iscrepancies between T2W AAR and infarct ESL.here was no significant correlation of the differ-
nces between T2W AAR and infarct ESL withime to reperfusion, time between PCI and CMR,V ejection fraction, or infarct size. The meanifference between T2W AAR and infarct ESL didot seem to be predicted by TIMI flow grade beforeCI, the culprit vessel, or single- versus multi-essel disease (Table 2).
I S C U S S I O N
his study demonstrates that it is possible touantify the volume of myocardium that has in-reased signal intensity on T2W CMR after AMIn humans. Animal studies have demonstrated thathis portion of the myocardium correlates closelyith the AAR as measured by fluorescent micro-
pheres (4) and is thought to encompass reversiblynd irreversibly injured myocardium. Contrast-nhanced CMR with late (or delayed) imaging foruantification of irreversible myocardial injury haseen extensively validated in acute and chronicettings (9–11). Thus, comparing the volume ofelayed enhancement with the volume of T2WAR it is possible to determine the proportion ofyocardium that has been salvaged.The T2W CMR has long been considered tech-
ically challenging, due to the long echo timesequired and reduced spatial resolution and signal-o-noise ratios. Current pulse sequences with ded-
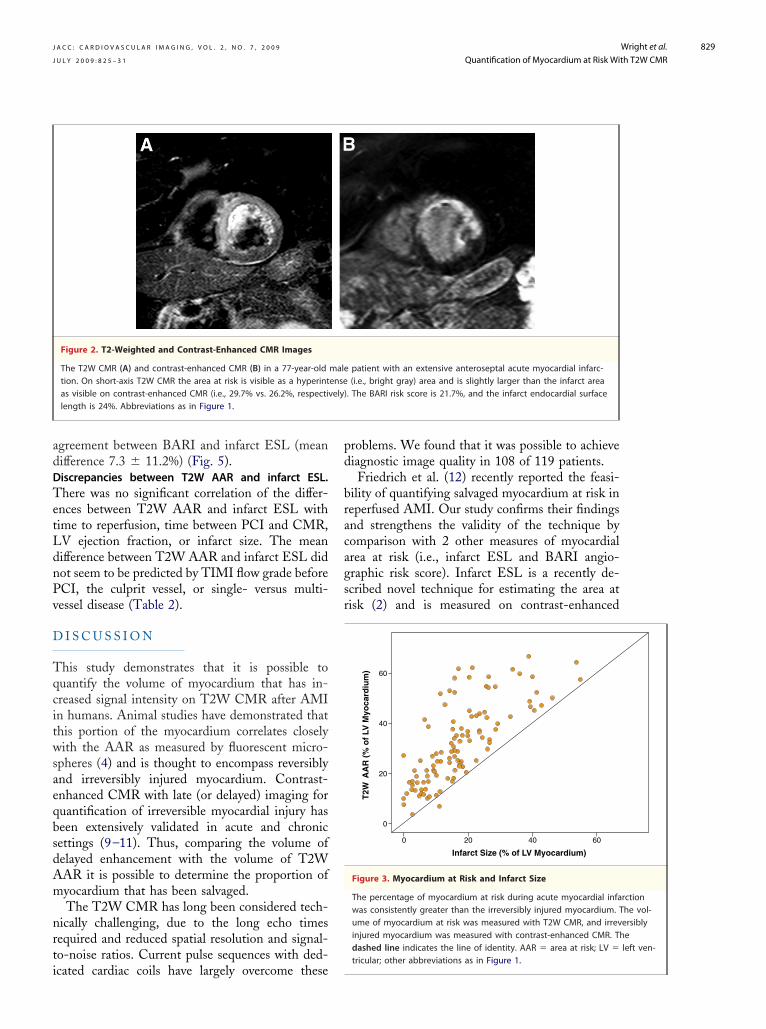
Figure 2. T2-Weighted and Contrast-Enhanced CMR Images
The T2W CMR (A) and contrast-enhanced CMR (B) in a 77-year-oldtion. On short-axis T2W CMR the area at risk is visible as a hyperintas visible on contrast-enhanced CMR (i.e., 29.7% vs. 26.2%, respectivlength is 24%. Abbreviations as in Figure 1.
cated cardiac coils have largely overcome these
roblems. We found that it was possible to achieveiagnostic image quality in 108 of 119 patients.Friedrich et al. (12) recently reported the feasi-
ility of quantifying salvaged myocardium at risk ineperfused AMI. Our study confirms their findingsnd strengthens the validity of the technique byomparison with 2 other measures of myocardialrea at risk (i.e., infarct ESL and BARI angio-raphic risk score). Infarct ESL is a recently de-cribed novel technique for estimating the area atisk (2) and is measured on contrast-enhanced
patient with an extensive anteroseptal acute myocardial infarc-(i.e., bright gray) area and is slightly larger than the infarct area. The BARI risk score is 21.7%, and the infarct endocardial surface
0
20
40
60
0 20 40 60
T2W
AA
R (
% o
f LV
Myo
card
ium
)
Infarct Size (% of LV Myocardium)
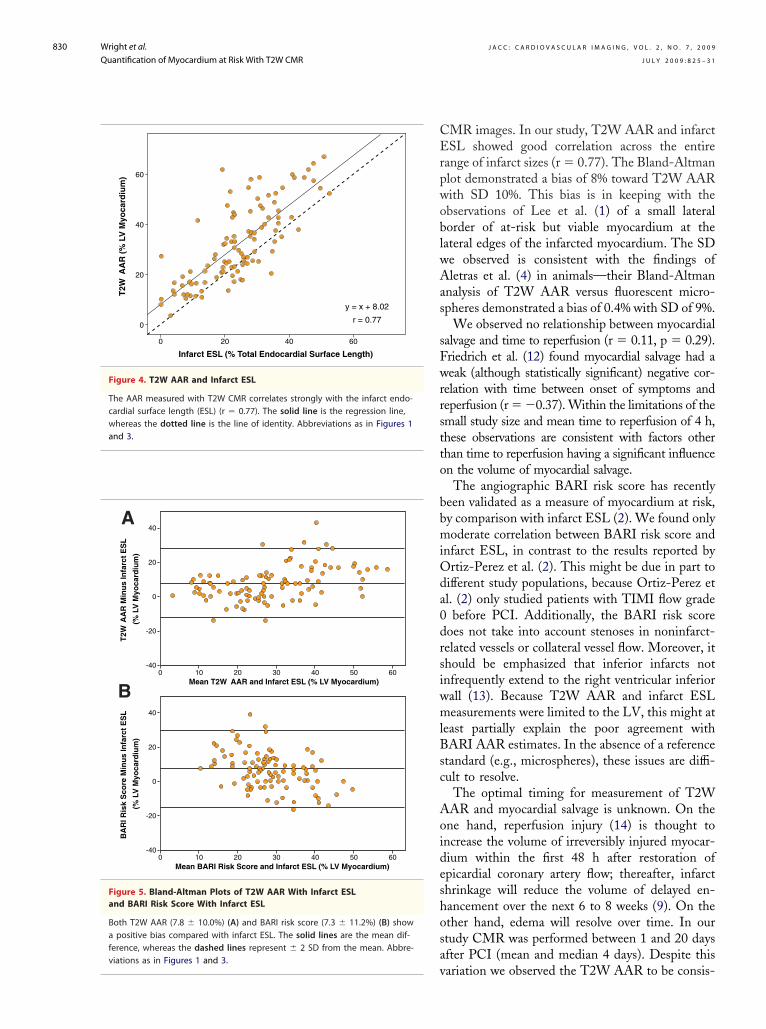
Figure 3. Myocardium at Risk and Infarct Size
The percentage of myocardium at risk during acute myocardial infawas consistently greater than the irreversibly injured myocardium. Tume of myocardium at risk was measured with T2W CMR, and irrevinjured myocardium was measured with contrast-enhanced CMR. Thdashed line indicates the line of identity. AAR � area at risk; LV �
maleenseely)
rctionhe vol-ersiblyeleft ven-
tricular; other abbreviations as in Figure 1.
CErpwoblwAas
sFwrrstto
bbmiOda0drsiwmlBsc
Aoideshosav
and 3.
viations as in Figures 1 and 3.
J A C C : C A R D I O V A S C U L A R I M A G I N G , V O L . 2 , N O . 7 , 2 0 0 9
J U L Y 2 0 0 9 : 8 2 5 – 3 1
Wright et al.
Quantification of Myocardium at Risk With T2W CMR
830
MR images. In our study, T2W AAR and infarctSL showed good correlation across the entire
ange of infarct sizes (r � 0.77). The Bland-Altmanlot demonstrated a bias of 8% toward T2W AARith SD 10%. This bias is in keeping with thebservations of Lee et al. (1) of a small lateralorder of at-risk but viable myocardium at theateral edges of the infarcted myocardium. The SDe observed is consistent with the findings ofletras et al. (4) in animals—their Bland-Altman
nalysis of T2W AAR versus fluorescent micro-pheres demonstrated a bias of 0.4% with SD of 9%.
We observed no relationship between myocardialalvage and time to reperfusion (r � 0.11, p � 0.29).riedrich et al. (12) found myocardial salvage had aeak (although statistically significant) negative cor-
elation with time between onset of symptoms andeperfusion (r � �0.37). Within the limitations of themall study size and mean time to reperfusion of 4 h,hese observations are consistent with factors otherhan time to reperfusion having a significant influencen the volume of myocardial salvage.
The angiographic BARI risk score has recentlyeen validated as a measure of myocardium at risk,y comparison with infarct ESL (2). We found onlyoderate correlation between BARI risk score and
nfarct ESL, in contrast to the results reported byrtiz-Perez et al. (2). This might be due in part to
ifferent study populations, because Ortiz-Perez etl. (2) only studied patients with TIMI flow grade
before PCI. Additionally, the BARI risk scoreoes not take into account stenoses in noninfarct-elated vessels or collateral vessel flow. Moreover, ithould be emphasized that inferior infarcts notnfrequently extend to the right ventricular inferiorall (13). Because T2W AAR and infarct ESLeasurements were limited to the LV, this might at
east partially explain the poor agreement withARI AAR estimates. In the absence of a reference
tandard (e.g., microspheres), these issues are diffi-ult to resolve.
The optimal timing for measurement of T2WAR and myocardial salvage is unknown. On thene hand, reperfusion injury (14) is thought toncrease the volume of irreversibly injured myocar-ium within the first 48 h after restoration ofpicardial coronary artery flow; thereafter, infarcthrinkage will reduce the volume of delayed en-ancement over the next 6 to 8 weeks (9). On thether hand, edema will resolve over time. In ourtudy CMR was performed between 1 and 20 daysfter PCI (mean and median 4 days). Despite this
0
20
40
60
0 20 40 60
T2W
AA
R (
% L
V M
yoca
rdiu
m)
Infarct ESL (% Total Endocardial Surface Length)
y = x + 8.02
r = 0.77
Figure 4. T2W AAR and Infarct ESL
The AAR measured with T2W CMR correlates strongly with the infarct endo-cardial surface length (ESL) (r � 0.77). The solid line is the regression line,whereas the dotted line is the line of identity. Abbreviations as in Figures 1
-40
-20
0
20
40
0 10 20 30 40 50 60
T2W
AA
R M
inu
s In
farc
t E
SL
(% L
V M
yoca
rdiu
m)
Mean T2W AAR and Infarct ESL (% LV Myocardium)
-40
-20
0
20
40
0 10 20 30 40 50 60
BA
RI R
isk
Sco
re M
inu
s In
farc
t E
SL
(% L
V M
yoca
rdiu
m)
Mean BARI Risk Score and Infarct ESL (% LV Myocardium)
B
A
Figure 5. Bland-Altman Plots of T2W AAR With Infarct ESLand BARI Risk Score With Infarct ESL
Both T2W AAR (7.8 � 10.0%) (A) and BARI risk score (7.3 � 11.2%) (B) showa positive bias compared with infarct ESL. The solid lines are the mean dif-ference, whereas the dashed lines represent � 2 SD from the mean. Abbre-
ariation we observed the T2W AAR to be consis-

tcTmibddp
C
IcrCfm
R
Dpj
R
J A C C : C A R D I O V A S C U L A R I M A G I N G , V O L . 2 , N O . 7 , 2 0 0 9
J U L Y 2 0 0 9 : 8 2 5 – 3 1
Wright et al.
Quantification of Myocardium at Risk With T2W CMR
831
ently larger than infarct size measured withontrast-enhanced CMR. The only patient with2W AAR less than infarct size was an 82-year-oldan. Though unproven, the likely cause is prior
nfarction due to the same culprit vessel. The delayetween PCI and CMR did not cause systematicifferences in the measured T2W AAR or myocar-ial salvage, although serial studies of individualatients were not performed.
O N C L U S I O N S
t is possible to retrospectively quantify the myo-ardium at risk and salvaged myocardium aftereperfused ST-segment elevation AMI with T2WMR. This should enable new insights into reper-
usion therapy and contribute to clinical decision-aking.
eprint requests and correspondence: Dr. Jan Bogaert,epartment of Radiology, Gasthuisberg University Hos-
ital, Herestraat 49, B-3000 Leuven, Belgium. E-mail:
[email protected]. coronary artery; T2W � T2-weighted; other abbreviations as in Table 1.1
1
1
1
Kc
E F E R E N C E S
1. Lee JT, Ideker RE, Reimer KA. Myo-cardial infarct size and location in rela-tion to the coronary vascular bed at riskin man. Circulation 1981;64:526–34.
2. Ortiz-Perez JT, Meyers SN, Lee DC,et al. Angiographic estimates of myo-cardium at risk during acute myocar-dial infarction: validation study usingcardiac magnetic resonance imaging.Eur Heart J 2007;28:1750–8.
3. Reimer KA, Jennings RB. The “wave-front phenomenon” of myocardialischaemic cell death. II. Transmuralprogression of necrosis within theframework of ischemic bed size (myo-cardium at risk) and collateral flow.Lab Invest 1979;40:633–44.
4. Aletras AH, Tilak GS, Natanzon A, etal. Retrospective determination of thearea at risk for reperfused acute myocar-dial infarction with T2-weighted car-diac magnetic resonance imaging: his-topathological and displacementencoding with stimulated echoes(DENSE) functional validations. Cir-culation 2006;113:1865–70.
5. Dymarkowski S, Ni Y, Miao Y, et al.Value of T-2 weighted magnetic res-
onance imaging early after myocardialinfarction in dogs: comparison withbis-gadolinium-mesoporphyrin en-hanced T1-weighted magnetic reso-nance imaging and functional datafrom cine magnetic resonance imag-ing. Invest Radiol 2002;37:77–85.
6. Lotan CS, Miller SK, Bouchard A, etal. Detection of intramyocardial hem-orrhage using high-field proton (1H)nuclear magnetic resonance imaging.Cathet Cardiovasc Diagn 1990;20:205–11.
7. Lotan CS, Bouchard A, Cranney GB,Bishop SP, Pohost GM. Assessmentof postreperfusion myocardial hemor-rhage using proton NMR imaging at1.5T. Circulation 1992;86:1018–25.
8. Alderman EL, Stadius M. The an-giographic definitions of the BypassAngioplasty Revascularization In-vestigation. Coron Artery Dis 1992;3:1189 –207.
9. Kim RJ, Fieno DS, Parrish TB, et al.Relationship of MRI delayed contrastenhancement to irreversible injury, in-farct age, and contractile function.Circulation 1999;100:1992–2002.
10. Wu E, Judd RM, Vargas JD, KlockeFJ, Bonow RO, Kim R. Visualizationof presence, location, and transmural
extent of healed Q-wave and non-Q mwave myocardial infarction. Lancet2001:357:21–8.
1. Wagner A, Mahrholdt H, Holly TA,et al. Contrast-enhanced MRI androutine single photon emission com-puted tomography (SPECT) perfu-sion imaging for detection of suben-docardial myocardial defects: animaging study. Lancet 2003;361:374–9.
2. Friedrich MG, Abdel-Aty H, TaylorA, Schulz-Menger J, Messroghli D,Dietz R. The salvaged area at risk inreperfused acute myocardial infarctionas visualised by cardiovascular mag-netic resonance. J Am Coll Cardiol2008;51:1581–7.
3. Larose E, Ganz P, Reynolds HG, etal. Right ventricular dysfunction as-sessed by cardiovascular magnetic res-onance imaging predicts poor progno-sis late after myocardial infarction.J Am Coll Cardiol 2007;49:855–62.
4. Yellon DM, Hausenloy DJ. Myocar-dial reperfusion injury. N Engl J Med2007;357:1121–35.
ey Words: area at risk yardiac magnetic resonance y
Table 2. Pearson Correlates and Univariate Predictors of DiscrepanciesBetween T2W AAR and Infarct ESL
T2W AAR Infarct ESL
r p Value
Time from symptom onset to reperfusion 0.02 0.85
Time from PCI to CMR 0.03 0.75
LV ejection fraction �0.1 0.31
Infarct size (% LV myocardium) 0.29 0.003
Mean � SD
Coronary anatomy
Single-vessel disease 7.3 � 9.5 0.665
Multivessel disease 8.2 � 10.5
Culprit vessel
LAD 9.6 � 10.0 0.098
LCx 9.4 � 6.8
RCA 5.6 � 10.4
TIMI flow grade before PCI
0 6.2 � 7.9 0.355
I 6.2 � 11.2
II 10.9 � 12.9
III 10.2 � 11.4
AAR � area at risk; CMR � cardiac magnetic resonance; ESL � endocardial surface length;LAD � left anterior descending coronary artery; LCx � left circumflex artery; RCA � right
yocardial infarction y edema.