Quantification of Hydrologic Budget Parameters for … of Biological and Agricultural Engineering,...
49
144 Quantification of Hydrologic Budget Parameters for the Vadose Zone and Epikarst in Mantled Karst J. V. Brahana 1 , Tiong Ee Ting 2 , Mohammed Al-Qinna 3 , John F. Murdoch 4 , Ralph K. Davis 1 , Jozef Laincz 1 , Jonathan J. Killingbeck 5 , Eva Szilvagyi 6 , Margaret Doheny- Skubic 7 , Indrajeet Chaubey 4 , P.D. Hays 1,8 , and Greg Thoma 2 1 Department of Geosciences, 113 Ozark, University of Arkansas, Fayetteville, AR 72701 2 Department of Chemical Engineering, 3202 Bell, University of Arkansas, Fayetteville, AR 72701 3 Faculty of Natural Resources and Environment, The Hashemite University, Zarqa 13115, Jordan 4 Department of Biological and Agricultural Engineering, University of Arkansas, Fayetteville, AR 72701 5 Department of Geology, Central Washington University, Ellensburg, Washington 6 Department of Geology, Beloit College, 700 College St., Beloit, WI 53511 7 Department of Geology, Carleton College, 300 N. College St., Northfield, MN 55057 8 US Department of Agriculture, National Water Management Center, 44 Ozark, Fayetteville, AR 72701 ABSTRACT Hydrologic studies at the Savoy Experimental Watershed initially focused on conduit-flow and trans- port in the karst aquifers that underlie the site. Recently, in the last two years, a new research focus has shifted to the shallower, more diffuse-flow pathways that contribute water to the fast-flow conduits. The extended residence time and exponentially-increased particle surface areas in the soil, regolith, and epikarst have been suspected to be active geochemical sites for microbe-soil-water-rock interaction. Preliminary chemical analyses indicate that the interface and interflow zones are indeed optimum locations for bio- geochemical processing. To more fully document and provide needed data on fluxes, hydraulic parameters, and calibration quantities for numerical testing of hypotheses, an accurate characterization of hydrologic budget components within all aspects of the flow system was undertaken. This study briefly summarizes new infrastructure and presents preliminary results that have helped refine a coherent, integrated conceptual model. INTRODUCTION The Savoy Experimental Watershed (SEW) is a University of Arkansas property that encompasses about 1250 hectares typical of the karst terrane of the Ozark Plateaus of the mid-continent (Brahana et al., 1998). It is a long-term hydrologic research site that provides an opportunity to investigate processes of flow and contaminant fate and transport in situ at a well-characterized and well-instrumented site. The surface-water/ground-water interface and the interflow zones in the vadose region in the south- ern part of Basin 1 (fig. 1) of SEW currently is an area of intensive hydrologic instrumentation and infrastructure buildup. A multidisciplinary research team of hydrogeologists, biologists, soil scientists, Figure 1. Basin 1 (ellipse), in Savoy Experimen- tal Watershed.
Transcript of Quantification of Hydrologic Budget Parameters for … of Biological and Agricultural Engineering,...
144
Quantification of Hydrologic Budget Parameters for the Vadose Zone and Epikarst in Mantled Karst J. V. Brahana1, Tiong Ee Ting2, Mohammed Al-Qinna3, John F. Murdoch4, Ralph K.
Davis1, Jozef Laincz1, Jonathan J. Killingbeck5, Eva Szilvagyi6, Margaret Doheny-
Skubic7, Indrajeet Chaubey4, P.D. Hays1,8, and Greg Thoma21Department of Geosciences, 113 Ozark, University of Arkansas, Fayetteville, AR 727012Department of Chemical Engineering, 3202 Bell, University of Arkansas, Fayetteville, AR 727013Faculty of Natural Resources and Environment, The Hashemite University, Zarqa 13115, Jordan4Department of Biological and Agricultural Engineering, University of Arkansas, Fayetteville, AR 727015Department of Geology, Central Washington University, Ellensburg, Washington6Department of Geology, Beloit College, 700 College St., Beloit, WI 535117Department of Geology, Carleton College, 300 N. College St., Northfield, MN 550578US Department of Agriculture, National Water Management Center, 44 Ozark, Fayetteville, AR 72701
ABSTRACT
Hydrologic studies at the Savoy Experimental Watershed initially focused on conduit-flow and trans-port in the karst aquifers that underlie the site. Recently, in the last two years, a new research focus has shifted to the shallower, more diffuse-flow pathways that contribute water to the fast-flow conduits. The extended residence time and exponentially-increased particle surface areas in the soil, regolith, and epikarst have been suspected to be active geochemical sites for microbe-soil-water-rock interaction. Preliminary chemical analyses indicate that the interface and interflow zones are indeed optimum locations for bio-geochemical processing. To more fully document and provide needed data on fluxes, hydraulic parameters, and calibration quantities for numerical testing of hypotheses, an accurate characterization of hydrologic budget components within all aspects of the flow system was undertaken. This study briefly summarizes new infrastructure and presents preliminary results that have helped refine a coherent, integrated conceptual model.
INTRODUCTION
The Savoy Experimental Watershed (SEW) is a University of Arkansas property that encompasses about 1250 hectares typical of the karst terrane of the Ozark Plateaus of the mid-continent (Brahana et al., 1998). It is a long-term hydrologic research site that provides an opportunity to investigate processes of flow and contaminant fate and transport in situ at a well-characterized and well-instrumented site.
The surface-water/ground-water interface and the interflow zones in the vadose region in the south-ern part of Basin 1 (fig. 1) of SEW currently is an area of intensive hydrologic instrumentation and infrastructure buildup. A multidisciplinary research team of hydrogeologists, biologists, soil scientists,
Figure 1. Basin 1 (ellipse), in Savoy Experimen-tal Watershed.
145
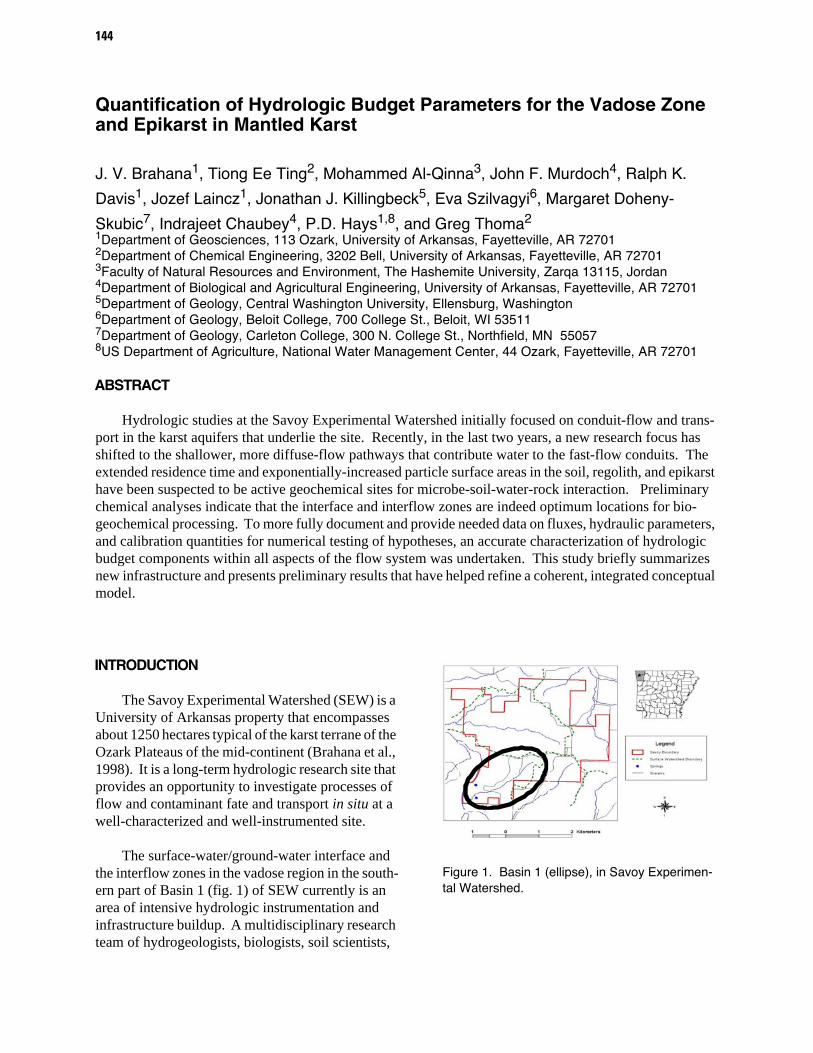
Figure 2. Vadose zone and epikarst research area showing geometry of infrastructure in Basin 1. Circles are weirs at springs, parallel lines identify the trench, and rectangles represent field plots. Details of the infrastructure are shown in figure 3.
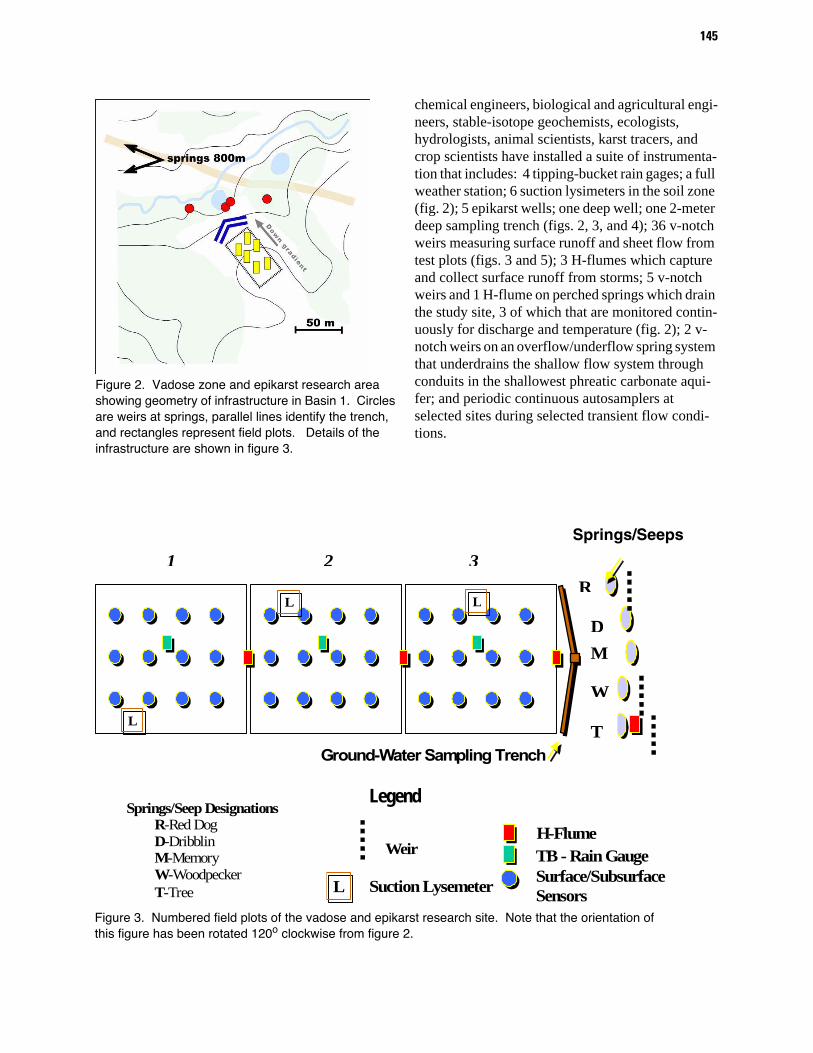
chemical engineers, biological and agricultural engi-neers, stable-isotope geochemists, ecologists, hydrologists, animal scientists, karst tracers, and crop scientists have installed a suite of instrumenta-tion that includes: 4 tipping-bucket rain gages; a full weather station; 6 suction lysimeters in the soil zone (fig. 2); 5 epikarst wells; one deep well; one 2-meter deep sampling trench (figs. 2, 3, and 4); 36 v-notch weirs measuring surface runoff and sheet flow from test plots (figs. 3 and 5); 3 H-flumes which capture and collect surface runoff from storms; 5 v-notch weirs and 1 H-flume on perched springs which drain the study site, 3 of which that are monitored contin-uously for discharge and temperature (fig. 2); 2 v-notch weirs on an overflow/underflow spring system that underdrains the shallow flow system through conduits in the shallowest phreatic carbonate aqui-fer; and periodic continuous autosamplers at selected sites during selected transient flow condi-tions.
H-Flume TB - Rain Gauge Surface/SubsurfaceSensors
Legend
L
L
L
L
Ground-Water Sampling Trench
Weir
1 2 3
T
W
M D
R
Springs/Seep Designations R-Red Dog D-Dribblin M-Memory W-Woodpecker T-Tree Suction Lysemeter
Figure 3. Numbered field plots of the vadose and epikarst research site. Note that the orientation of this figure has been rotated 120o clockwise from figure 2.
Springs/Seeps
146
OBJECTIVES, METHODOLOGY, AND BACKGROUND
This report has two main objectives: 1) to pro-vide a brief description of the type of infrastructure currently in place, including methodology, rationale, and expected accuracy; and 2) to synthesize data and make hydrologic interpretations based on those data. Inasmuch as space limitations preclude a detailed summary of results, information provided is not complete; the interested reader is directed to http://www.uark.edu/depts/savoyres/index.html.
Discharge at springs is determined by measur-ing the head in the pool behind 22.5o v-notch weirs. The stage-discharge data are represented theoreti-cally by the equation:
Q = 274.4 H2.5 (1)
where Q is discharge in liters per second, and H is head in meters above the bottom of the v-notch (Grant and Dawson, 1997). Below 0.06 meters, the stage discharge relation was determined empirically. Spring stage is monitored by transducers on a 5-minute interval, with an accuracy of 0.001 meter.
Precipitation is monitored by tipping-bucket rain gages, which are set to record increments (0.01 feet) of rainfall instantaneously. These are recorded with a time stamp, totalized every 5 minutes by the weather station, and recorded on digital data loggers powered by solar cells. Loggers also record other relevant digital data, and are periodically down-loaded on approximately bi-weekly intervals.
Sensors attached to weirs measure the presence or absence of surface runoff during specific storms, and subsurface saturation sensors measure depth to soil saturation. There are 36 of each of these sen-sors; accuracy is 0.002 meters (m) for the surface runoff sensors, and about 0.050 m for the subsurface saturation sensors. Water level in wells is measured with pressure transducers, which have an accuracy of 0.001 meters. Total flow from each of the plots is measured by pressure transducers attached to still-ing wells on H-flumes.
The karst hydrogeology in SEW includes aqui-fers covered by a thin, rocky soil, and a variable thickness of regolith which mantles the bedrock (figs. 4 and 5). Below the regolith lies the Boone Formation, a layer of impure, cherty limestone of approximately 55 m thickness (Al-Rashidy, 1999). The Boone is widespread and is considered to be a karst-forming formation, but owing to its high con-centration of insoluble chert and clay (as much as 70%) insoluble debris remaining from weathering mantles the surface of the carbonate rock and plugs voids in the developing conduits and bedding planes. The resulting overall karst nature of this for-mation typically is masked. Underneath the Boone Limestone is a relatively- pure, crystalline, chert-free St. Joe Limestone, about 6 m thick (Al-Rashidy, 1999). The St. Joe Formation is the predominant
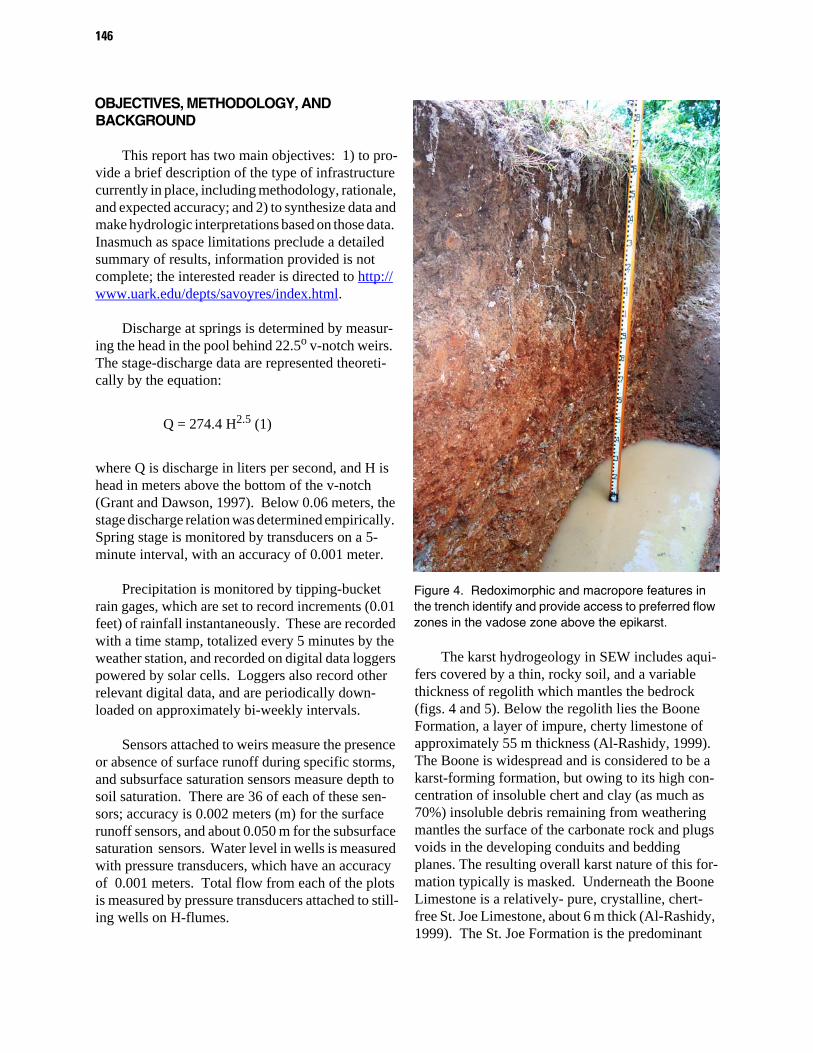
Figure 4. Redoximorphic and macropore features in the trench identify and provide access to preferred flow zones in the vadose zone above the epikarst.

147
karst-forming unit in the area, and has most of the dominant zones in which the larger continuous springs, seeps, and caves occur. The ground-water flow in SEW and this part of the Ozarks is lithologically-controlled, with modification by structure (Brahana, 1997; Unger, 2004). The Chat-tanooga Shale (a black, relatively impermeable but highly fractured shale) forms the underlying imper-meable boundary of the shallow carbonate aquifer at the SEW. The ground water flows westward and dis-charges directly into the nearby Illinois River, which flows on top of the Chattanooga Shale from the south to the north.
To explain the controlling influences of the aspects of the regolith and soil matrix, macropores, burrows, tubes, hardpans, and other permeability contrasts in the nonindurated vadose zone (fig. 4) and epikarst of Basin 1 in SEW, we described a sim-ple geometric conceptual model of the subsurface conduit network systems comprising three impor-tant flow zones: 1) interface (soil zone); 2) interflow (lateral flow zone); and 3) focused-flow (conduit-flow zone) (fig. 5). Sampling infrastructure for each of the zones includes the following: 1) inter-
face—weirs and flumes (occasional; runoff rare); lysimeters (soil-water samplers; common for intense storms); 2) interflow—interceptor trench (occasional; intense storms); seeps and springs at the intersection of the perching layer and the land sur-face —weirs and flumes (continuous flow); and 3) focused flow—weirs (continuous springs issuing from limestone at the terminus of the ground-water basin).
The interface is well-established as a zone where biogeochemical processing occurs, and the zone of focused flow is known for minimal process-ing, whereas the interflow zone is poorly under-stood. It is thought to be important for geochemical processing, especially for constituents such as nitrates and dissolved organic carbon (Laincz, 2005). The instrumentation to assess flow and stor-age through these zones is therefore critical to understanding the hydrologic budget at this and sim-ilar sites, owing to a longer residence time for water, and increased opportunity for enhanced biological activity.
Figure 5. Schematic representation of environments in the shallow flow zone at the Savoy Experimental Water-shed (figure modified from Laincz, 2005).

148
DISCUSSION
The measurement of interflow through the weirs at the seeps and springs (Tree, Woodpecker, and Red Dog) provides insight into a component of the hydrologic budget that is seldom quantified. For the period 15 July through 20 July 2005, measure-ments of discharge were made in early morning and mid- afternoon using a graduated cylinder and a stopwatch. Ten measurements were averaged for each data point shown on the graphs (fig. 6). All plots show a diurnal reduction in flow during the period of maximum solar radiation, reflected also in the transducer measurements at each weir. This loss of water from the shallow ground-water system is interpreted to be to evapotranspiration, and is on the order of 5 to 25 milliliters per second over the course of a diurnal cycle for each spring. The period of record is not long, owing to the recent installation of the weirs this past spring, but preliminary results reflect consistent and reproducible records using multiple tools, and provide confidence that the quan-tities are accurate and reflect actual conditions in the subsurface.
Another suite of data from the epikarst site shows transient variations in stage of the H-flume at Tree Spring, and water levels in 3 epikarst wells (fig. 7) within the field plots. Three transient storm pulses are reflected in the water-level records start-ing on Julian date 112 (21 April 2004), with an obvi-ous lag in the first record from plot 3 (fig. 3), reflecting the furthest downgradient well. This lag in water-level increase is interpreted to be caused by dryer conditions in a downgradient direction. Water level in the downgradient well does not rise until deficient soil moisture in the plot has been accom-modated, after which time the water-level responses are rapid and coincident with the wells in plots 1 and 2. The delayed response of the H-flume at Tree Spring is explained by unsaturated conditions along the flow path initially requiring saturation. Once achieved, subsequent spring stage rises are almost instantaneous with precipitation occurrence and with ground water increases in wells (fig. 7).
Physical and chemical water-quality parameters are valuable tools that also hold clues for under-standing the complexities of flow in karst terranes
(fig. 8). Continuous monitoring of two springs at the distal end of the ground-water flow path in Basin 1 provides an illustrative example. Langle Spring, the underflow part of the focused flow sys-tem, is about 3 centimeters lower than Copperhead, the overflow spring. During a 33-day period starting in December 1997, five major storms perturbed the stability of the temperature of these springs (fig.8). These produced a general overall cooling in the dis-charge waters of Langle, although the trend was by no means linear or gradual. Water from Copper-head, on the other hand, showed both warming and cooling trends, numerous abrupt reversals in heating
Figure 6. Diurnal variations in discharge (Q) in Tree, Woodpecker, and Red Dog Springs, interpreted to re-flect increased transpiration during periods of maxi-mum solar radiation. All springs are shallow and perched on chert in epikarst of lower 5 meters of the Boone Formation. 0 time is midnight, 15 July 2005.

149
and cooling, as well as many more fluctuations of about 1o C in the interval from December 13 through December 20. These diurnal variations were ultimately traced to a leaky, ephemeral surface pond that commonly stored water after periods of intense
rainfall. The pond was exposed to solar heating dur-ing clear weather following storms, and the heated water leaked into the karst aquifer and as it mixed with water from other sources, it imparted the diur-nal thermal signature to Copperhead Spring. The signature was not obvious at Langle, owing to its much longer distance from the leaky pond.
The wider ranges of temperature in Copperhead Spring suggest that this part of the system is more open to surface water, and less thermally isolated than Langle. Cold water from the storm of 25 December obviously had an impact on the thermal regime of both springs, but the slope of the decrease at Langle supports the hypothesis that much of the water from the northern part of the spring system is more insulated from surface effects.
Near identical temperatures from the two springs on 8 December 1997 is interpreted to be caused by point-source input to each spring from fractures nearby the orifices. This effect is repeated on 25 December, and is thought to be a strong indi-cation of the temperature of the precipitation at the time of coincident temperatures. Based on a prelim-inary assessment of all available data, the following
Figure 7. Transient variations in water levels in shal-low wells in the epikarst research area and from con-tinuously monitored stage in the H-flume at Tree Spring. Three storms are reflected in rapid water level rises in all records. Wells were constructed by auger-ing to refusal in epikarst. Julian date 112 starts mid-night, 21 April 2004; increasing dates are successive days of 24 hours.
Figure 8. Temperature of two springs, Langle and Copperhead, that resurge from the St. Joe Limestone (fo-cused flow, figure 4) at the distal end of the ground-water flow path in Basin 1. Comparing and contrasting the temperature variations in response to precipitation allows a detailed assessment of contributions to point sourc-es of discharge in this indurated carbonate aquifer.

150
conceptual model is thought to describe the control-ling influences of surface- and ground-water interaction within the SEW (fig. 9). Ground-water recharge (from precipitation) within SEW is distrib-uted areally across the mantled aquifer, yet prelimi-nary data suggest that runoff and recharge occur at discrete points. Lateral flow in the vadose zone, and temporal changes in directions of flow are a function of many factors which are highly variable, and can only be observed over long periods of observation that reflect the full range of hydrologic variability experienced at the site. Surface-water basins and ground-water basin boundaries do not coincide at SEW. This means that if a contaminant were spilled on the ground in one watershed, it may not necessar-ily show up in wells or springs in the same water-shed; it may be “pirated” along unseen underground flow routes to discharge at another resurgence point. Permeability contrasts within the soil, at the soil-rock interface, and within the solid-rock aquifer con-centrate flow and distribute it down gradient along the flow paths of least resistance. These preferred pathways are a reflection of many factors, and are a dominant control on the hydrology. Springs in Basin 1 represent the interception of flowpaths with
the land surface, and these range across a continuum of intermittent, infrequent flowing seeps that barely trickle to continuous springs that flow year-round. The epikarst developed on the Boone Formation, and the relatively-pure limestone of the St. Joe For-mation represent the two most common zones in which continuous springs and seeps occur. Hydrau-lic gradients of the ground-water, which generally appear to follow the tilt (structural dip) of the rock formations, act independently (are decoupled) from surface-water bodies where confinement by chert layers in the Boone Formation is effective. This decoupling is also lithologically controlled, but in areas of faults and major joints, exhibits strong structural control. Stream piracy is one manifesta-tion of combined lithologic and structural control that is obvious in Basin 1.
CONCLUSIONS
The wealth of karst understanding at SEW has benefited from long-term integrated research of a truly multidisciplinary flavor. Research projects have grown from basic descriptive studies of resource assessments to sophisticated
Figure 9. Conceptual model showing the relation between the karst flow components of Basin 1 in SEW (Ting, 2005).
151
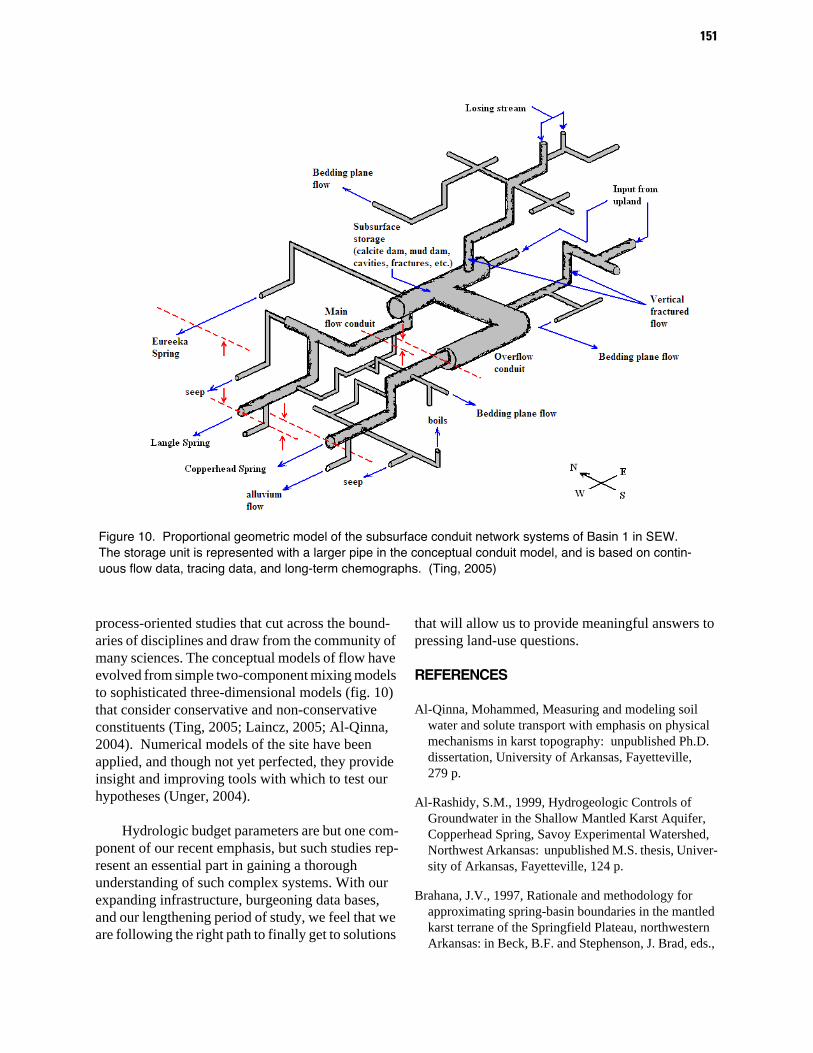
process-oriented studies that cut across the bound-aries of disciplines and draw from the community of many sciences. The conceptual models of flow have evolved from simple two-component mixing models to sophisticated three-dimensional models (fig. 10) that consider conservative and non-conservative constituents (Ting, 2005; Laincz, 2005; Al-Qinna, 2004). Numerical models of the site have been applied, and though not yet perfected, they provide insight and improving tools with which to test our hypotheses (Unger, 2004).
Hydrologic budget parameters are but one com-ponent of our recent emphasis, but such studies rep-resent an essential part in gaining a thorough understanding of such complex systems. With our expanding infrastructure, burgeoning data bases, and our lengthening period of study, we feel that we are following the right path to finally get to solutions
that will allow us to provide meaningful answers to pressing land-use questions.
REFERENCES
Al-Qinna, Mohammed, Measuring and modeling soil water and solute transport with emphasis on physical mechanisms in karst topography: unpublished Ph.D. dissertation, University of Arkansas, Fayetteville, 279 p.
Al-Rashidy, S.M., 1999, Hydrogeologic Controls of Groundwater in the Shallow Mantled Karst Aquifer, Copperhead Spring, Savoy Experimental Watershed, Northwest Arkansas: unpublished M.S. thesis, Univer-sity of Arkansas, Fayetteville, 124 p.
Brahana, J.V., 1997, Rationale and methodology for approximating spring-basin boundaries in the mantled karst terrane of the Springfield Plateau, northwestern Arkansas: in Beck, B.F. and Stephenson, J. Brad, eds.,
Figure 10. Proportional geometric model of the subsurface conduit network systems of Basin 1 in SEW. The storage unit is represented with a larger pipe in the conceptual conduit model, and is based on contin-uous flow data, tracing data, and long-term chemographs. (Ting, 2005)

152
Sixth Multidisciplinary Conference on Engineering Geology and Hydrogeology of Karst Terranes, A.A. Balkema, Rotterdam, p. 77-82.
Brahana, J.V., Sauer, T.J., Kresse, Tim, Al-Rashidy, Said, Shirley, Tracy, and McKee, Paul, 1998, Tipping the scale in long-term karst research—Hydrogeologic characterization of the Savoy Experimental Water-shed: Proceedings Volume, Water Quality of Surface and Ground Water and Best Management Practice, Arkansas Water Resources Center, p. 9-17.
Fanning, B.J., 1994, Geospeleologic analysis of cave and karst development within the Boone and St. Joe Forma-tions of Benton and Madison counties, Northwest Arkansas: unpublished M.S. thesis, University of Arkansas, Fayetteville, 144 p.
Grant, D.M and Dawson, B.D., 1997, Isco Open channel flow measurement handbook: Isco, Inc., Lincoln, Nebraska, 5th ed.
Laincz, Jozef, 2005, A biogeochemical /hydrological approach to characterize transport and cycling of nitro-gen in mantled karst watershed: Arkansas Water Research Conference, Fayetteville, Conference Pro-ceedings [compact disk].
National Research Council, 2001, Conceptual models of flow and transport in the fractured vadose zone: National Academy Press, Washington, 374 p.
Palmer, A.N., 1990, Groundwater processes in karst ter-ranes, in Higgins, C.G., and Coates, D.R. (eds.), Groundwater geomorphology: The role of subsurface water in Earth-surface processes and landforms, Boul-der, Colorado: Geological Society of America Special Paper 252.
Ting, Tiong Ee, 2005, Assessing bacterial transport, stor-age and viability in mantled karst of Northwest Arkan-sas using clay and Escheria coli labeled with lan-thanide-series metals: unpublished Ph.D. dissertation, University of Arkansas, Fayetteville.
Unger, Tim, 2004, Structural controls influencing groundwater flow within the mantled karst of the Savoy Experimental Watershed, Northwest Arkansas: unpublished M.S. thesis, University of Arkansas, Fayetteville, 124 p.
153
Characterization of Nutrient Processing at the Field and Basin Scale in the Mantled Karst of the Savoy Experimental Watershed, Arkansas
By Jozef Laincz1, P.D. Hays2,3, Sue Ziegler4, Byron Winston4, J.F. Murdoch5, J.V. Brahana2, K.F. Steele2, Indrajeet Chaubey5, and Ralph K. Davis2 1Program of Environmental Dynamics, 113 Ozark, University of Arkansas, Fayetteville, AR 727012Department of Geosciences, 113 Ozark, University of Arkansas, Fayetteville, AR 727013US Department of Agriculture, National Water Management Center, 44 Ozark, Fayetteville, AR 727014Department of Biological Sciences, 528 Science and Engineering, University of Arkansas, Fayetteville, AR 727015Department of Biological and Agricultural Engineering, 203 Engineering, University of Arkansas, Fay-etteville, AR 72701
ABSTRACT
Animal production and associated pasture application of animal manures in vulnerable karst regions poses a significant threat to water quality. Balanced nutrient application presupposes an understanding of biogeochemical processes and controls on nitrogen transport, transformation, and sequestration—an under-standing that is not well evolved for karst.
Concentration and bioavailability of dissolved organic carbon, and karst hydrogeological compart-ments were investigated as important factors controlling nutrient cycling and transport. Additionally, con-centration and isotopic composition of NO3
- was used to determine the extent of denitrification and immobilization of nitrate.
The study incorporated sampling events during two hydrologic regimes, storm and base flow, to char-acterize three components of a shallow system of a karst watershed: (1) surface-water/ground-water inter-face (soil/regolith) zone, (2) interflow over permeability contrasts zone, and (3) focused flow zone. The first two are presumably the zones with increased biogeochemical processing of nutrients due to longer retention time and greater matrix/water ratios. The importance of the soil zone in nutrient utilization and immobili-zation is well established. Conversely, the minimal degree of nutrient processing that occurs in the focused flow zone in karst is also well documented; however, the amount of nutrient processing that may occur in the interflow zone in karst setting has not been studied. The potential for nutrient processing that may occur in the interflow zone is important because of the lack of processing in thin soils and the focused flow zones that typify karst.
Study results indicate that dilution of dissolved nutrient species and flow bypassing the soil zone through macropores are two important controls on nitrogen behavior. A key finding of the study is that the decrease of nitrate concentrations observed within the interflow zone is greater than can be ascribed to dilu-tion, indicating that microbial processing of nitrate is an important occurrence. Hydrologic conditions dic-tate flow-paths and affect biogeochemical processing of nitrate.
Once the biogeochemical mechanisms proposed are completely elucidated, the impact of agricultural practices on the integrity of these zones, and the way the processes occurring within these zones can be cap-italized upon for nutrient management can be tested.

154
Transport Potential of Cryptosporidium parvum Oocysts in a Drinking-Water, Karstic-Limestone Aquifer: What We Have Learned Using Oocyst-Sized Microspheres in a 100-m Convergent Tracer Test at Miami's Northwest Well Field
Ronald W. Harvey1, Allen M. Shapiro2, Robert A. Renken3, David W. Metge1, Joseph N. Ryan4, Christina L. Osborn4, and Kevin J. Cunningham31U.S. Geological Survey, 3215 Marine Street, Boulder, Colorado 803032U.S. Geological Survey, 12201 Sunrise Valley Drive, Reston, Virginia 201923U.S. Geological Survey, 9100 NW 36th St., Miami, FL 331784Dept. Civil, Environ., and Arch. Eng., University of Colorado, Boulder, Colorado 80309
ABSTRACT
Aquifers characterized by karstic limestone are highly vulnerable to contamination by pathogens, in part because their solution-enlarged conduits and fracture systems can result in rapid and significant pref-erential flow. Contamination by Cryptosporidium parvum, a waterborne pathogenic protist, is of particular concern in areas where shallow karstic systems also serve as the drinking water supply. The vulnerability of Miami’s Northwest Well Field (NWWF) to contamination by C. parvum oocysts was assessed in a large-scale, forced-gradient (convergent) injection and recovery test. The field study involved simultaneous pulse introduction to the Biscayne Aquifer of a conservative tracer (SF6, an inert gas) and a polydispersed suspen-sion of oocyst-sized (2-5 µm, diameter) carboxylated polystyrene microspheres. Estimated fractional recoveries for the microspheres at a municipal supply well 100-m downgradient from the injection borehole were inversely related to microsphere diameter and ranged from 2.8% for the largest to 5.6% for the smallest size classes or from 4.7% - 9.3%, respectively, if corrected for the incomplete (~60%) cumulative recovery observed for SF6 in the same field test. Results from flow-through column studies with NWWF limestone cores housed in a modified triaxial cell indicated that microsphere surrogates may underestimate the trans-port potential of oocysts in Biscayne Aquifer by 4-6 fold, in part because of the microspheres’ more-reactive surface (more negative zeta potential) under the calcium, ionic strength, and very slightly alkaline condi-tions of the Biscayne Aquifer. Our study suggests that, although the karstic limestone within the Biscayne Aquifer appears to have a substantive sorptive capacity for oocysts, it may take more than two hundred meters of transport to ensure even a 1-log unit removal of oocysts in the vicinity of the NWWF, depending upon the local-scale heterogeneity and factoring in a reasonable margin of safety. Flow-through column studies involving intact limestone cores housed within a modified triaxial cell suggest that considerable spa-tial variation in the transport behavior of microspheres relative to a conservative tracer may be expected because of the spatial variations in limestone structure beneath the NWWF.
155
Ground-Water Quality Near a Swine Waste Lagoon in a Mantled Karst Terrane in Northwestern Arkansas
Christopher M. Hobza1, David C. Moffit2, Danny P. Goodwin3, Timothy Kresse4, John Fazio4, John V. Brahana5, and Phillip D. Hays11U.S. Geological Survey Arkansas Water Science Center, Fayetteville, AR2Natural Resources Conservation Service National Water Management Center, Ft. Worth, TX3Natural Resources Conservation Service National Water Management Center, Little Rock, AR 4Arkansas Department of Environmental Quality, Little Rock, AR5University of Arkansas Department of Geosciences, Fayetteville, AR
ABSTRACT
Livestock production is generally the predominant agricultural practice in mantled karst terranes because the thin, rocky soils associated with carbonate bedrock are not conducive to crop production. Unfor-tunately, livestock production in karst areas can create environmental problems because of rapid, focused flow through soil and regolith. A study was conducted by the U.S. Geological Survey in cooperation with the Natural Resources Conservation Service National Water Management Center, the University of Arkan-sas, and the Arkansas Department of Environmental Quality to examine a swine waste storage lagoon in a mantled karst terrane at the University of Arkansas' Savoy Experimental Watershed to evaluate the effects of a swine waste lagoon on ground-water quality. The Savoy Experimental Watershed is a long-term, multi-disciplinary research site, which is approximately 1,250 hectares and encompasses parts of six drainage basins. An anaerobic swine waste lagoon was constructed at the Savoy Swine Facility in compliance with U.S. Department of Agriculture Natural Resources Conservation Service Conservation Waste Storage Prac-tice Standard no. 313 in one of the drainage basins. An inventory of springs, seeps, sinkholes, and losing streams was conducted in the basin where the waste lagoon was constructed. Based on the inventory, nine shallow monitoring wells were augered to refusal in the regolith. Shallow ground-water from wells, springs, and an interceptor trench was sampled and analyzed for nutrients, major cations, and major anions during high-flow and low-flow conditions. Results from ground-water sampling indicate concentrations of chloride and nitrate were higher than concentrations from non-agricultural land-use areas in the Ozarks, but were comparable to concentrations near the site prior to the construction of the swine facility. A sample collected from an interceptor trench indicated that nutrients are able to pass through the clay liner. The results of an electromagnetic geophysical survey indicated that there were no preferred flow paths from the swine waste storage lagoon. Based on these results, it appears that the swine waste lagoon built using the Natural Resources Conservation Service Conservation Practice no. 313 is minimally affecting the ground-water quality of the area.

156
INTRODUCTION
Animal production in northwestern Arkansas is the predominant agricultural practice because the thin, rocky soils are unsuitable for sustainable crop production. Nationally, Arkansas ranks 2nd in broiler production, 16th in cattle, and 17th in swine production (U.S. Department of Agriculture, 2003). Animal waste generated from these agricultural operations typically is applied to local pastures, often in excess of nutrient requirements. These excess nutrients have little opportunity for natural attenuation in a mantled karst setting because of thin soils and underlying karst geology that allow rapid, focused flow resulting in contaminated ground and surface waters. Adamski (1987) compared nutrient concentrations in springs in an intensely farmed area with a minimally affected forested area and reported that the areas of intense livestock production had elevated concentrations of nitrate and chloride.
One potential source of ground-water contami-nation is from animal waste stored in anaerobic lagoons generated from confined animal feeding operations. These lagoon structures are designed to store animal waste for a specified time period until the waste is ready to be applied as liquid fertilizer to adjacent pastures or cropland. If not properly located, designed, constructed, and maintained, ani-mal waste lagoons can adversely affect water quality through the introduction of excess nutrients and bac-teria (Ham and DeSutter, 2000).
The Natural Resources Conservation Service (NRCS) has developed several Best Management Practices (BMPs) to reduce this risk of ground-water contamination. Waste Storage Practice no. 313 was created to allow producers to safely and effectively store animal waste while protecting ground-water resources in environmentally sensitive areas across a variety of hydrogeological environments (Natural Resources Conservation Service, 2003). Ideally, these structures are located in areas with thick soils, over deep or confined aquifers, and away from domestic water supplies. When this is not possible, the NRCS provides options that allow an additional measure of safety such as an impermeable geosyn-thetic membrane liner or a compacted liner con-
structed from native soil with a specific permeability.
This BMP has been successful in protecting ground-water resources in other hydrogeologic set-tings, (David Moffit, Natural Resources Conserva-tion Service, oral commun., 2004) but its effectiveness has not been evaluated in areas with thin soils such as a mantled karst setting. To address this need, the U.S. Geological Survey in cooperation with the Natural Resources Conservation Service National Water Management Center, the University of Arkansas, and the Arkansas Department of Envi-ronmental Quality designed a study to determine the effectiveness of Waste Storage Practice no. 313 for storing swine waste in a mantled karst setting. The purpose of this report is to describe ground-water quality near the swine waste lagoon.
STUDY AREA
The Savoy Swine Facility is located within the Savoy Experimental Watershed (SEW) in northern Washington County in northwestern Arkansas (fig. 1). The SEW serves as a long-term, multi-disci-plinary research site to examine water-quality prob-lems associated with livestock production in a mantled karst setting. The SEW offers a unique opportunity to test and evaluate the environmental effects of different animal agricultural practices. In 2002 the University of Arkansas constructed the Savoy Swine Facility to improve planned large-scale swine production. The Savoy Swine Facility is managed as a demonstration farm to provide a long-term model for environmentally friendly manage-ment of animal nutrition, animal waste and odors (Maxwell and others, 2003).
The Savoy Swine Facility is located within the Springfield Plateau (Fenneman, 1938), which is underlain by nearly flat lying Mississippian-age cherty limestones and limestones. These sedimentary sequences have been incised by streams to form dendritic drainages and rolling hills. Karst features such as springs, sinkholes, losing streams, caves, and conduits are present in the study area (Little, 1999).

157
0
0
1
1
2 Miles
2 Kilometers
Base map modified fromU.S. Geolog ical Survey digital data, 1996
36 07’30”o
36 10’o
94 22’30”o 94 20’o 94 17’30”o
Figure 1. Location of the Savoy Swine Farm and diagram of waste storage infrastructure within the Savoy Experimental Watershed.
The major geologic units present in the study area are the Chattanooga Shale, the St. Joe Lime-stone Member of the Boone Formation, and the Boone Formation. The Chattanooga Shale is a black, Devonian-age shale that is approximately 45 feet thick within the SEW (Little, 1999) that unconform-ably underlies the St. Joe Limestone Member. The Chattanooga Shale acts as a regional confining unit where it is present in the Ozarks separating ground-water flow between the Mississippian-age lime-stones which compose the Springfield Plateau aqui-fer and the underlying Ordovician-age dolomites and sandstones which compose the Ozark aquifer (Imes and Emmett, 1994). The St. Joe Limestone Member, which is part of the Boone Formation is a relatively pure limestone, is conformably overlain by cherty limestone. The Boone Formation consists of Mississippian-age cherty limestones and is thick-est beneath the uplands throughout the study area. The bedrock in the study area is overlain by regolith that is the weathering product of the cherty lime-
stone of the Boone Formation that creates the man-tled karst topography. The soils formed from the regolith are composed of silt loams and the associ-ated subsoils are silty clay loam or cherty silt loam (Harper and others, 1969).
The waste storage infrastructure at the Savoy Swine Facility was constructed in compliance with Waste Storage Practice no. 313 (Natural Resources Conservation Service, 2003). Because the swine facility was constructed over an unconfined lime-stone aquifer, more stringent design options were considered for the waste lagoon. The most econom-ical solution was to construct a compacted clay liner from sieved native soil with a target coefficient of permeability of 1.0 x 10⁻⁷ centimeters per second (Stan Rose, Natural Resources Conservation Ser-vice, oral commun., 2004). Because of budget con-straints during the construction, the Savoy Swine Facility is only able to house half the animals it was initially designed for. As a result the waste storage

158
36 07’30”o
36 08o
36 08’30”o
94 20’30”o 94 20’o 94 19’30”o 94 19’o
Base map modified fromU.S. Geological Survey digital data, 1996
0
0
0.25
0.25 0.5 Kilometer
0.5 Mile
ANAEROBICLAGOON
INTERCEPTORTRENCH
Figure 2. Location of water-quality sampling points within study area.
infrastructure is substantially oversized with respect to the number of animals served (Karl VanDev-ender, University of Arkansas, oral commun., 2004). The Savoy Swine Farm has a unique project-specific design constructed with four holding ponds each designed to store animal waste for a set of ani-mals with a specific diet (fig. 1).
METHODS
A karst inventory was conducted in the area of the swine farm to gain a better understanding of the ground-water system prior to sampling point selec-tion and well drilling. An inventory of springs, seeps, sinkholes, and losing and gaining reaches of streams was compiled. Nine shallow monitoring wells were augered to the depth of drilling refusal in the regolith. All wells were constructed with 2-inch polyvinyl chloride (PVC) casing and slotted PVC screen sections. A sand filter pack was installed sur-rounding the screened section with 2 feet of bento-nite overlying the filter pack to prevent surface
contamination. An interceptor trench was installed west of the anaerobic lagoon on the swine farm and was excavated with a backhoe to the bedrock surface to allow collection of lagoon leachate moving down-gradient from the anaerobic lagoon after a storm event (fig. 1).
Sampling points consisted of monitoring wells, springs, seeps, and the interceptor trench. Water-quality samples were collected (fig. 2) during high-flow conditions in April 2004 and low-flow condi-tions in October 2004. The interceptor trench was sampled after one storm event on July 27, 2004. All samples were analyzed for nutrients including nitrate plus nitrite, ammonium, total Kjeldahl nitro-gen, total phosphorus, and orthophosphate, major cations and major anions by the Arkansas Depart-ment of Environmental Quality (ADEQ) Water Quality Laboratory in Little Rock, Arkansas. Nitrate plus nitrite concentrations are reported as nitrate for this report because nitrate is the dominant form of nitrogen for this analyte. Fewer monitoring wells
were sampled during low-flow conditions because some of the wells were dry or did not yield water for sampling.
An electromagnetic geophysical survey was conducted near the waste storage infrastructure to determine any areas of preferential seepage from the lagoon and to assess the selection and placement of the sampling points. An EM-31 is a frequency domain electromagnetic instrument that is capable of determining subsurface conductivity (Geonics, 1984). Electromagnetic surveys have been success-ful in the past locating areas of preferred seepage from animal waste lagoons. Areas of lagoon seepage result in anomalously high subsurface conductivities compared to unaffected areas (Brune and Doolittle, 1990). Conductivity data were collected with a hor-izontal dipole instrument orientation providing an average depth of investigation of 6 meters. Global Positioning System (GPS) data and subsurface con-ductivity data were collected simultaneously. These data were plotted and contoured using the computer program Surfer (2002) for visual interpretation of results.
GROUND-WATER QUALITY
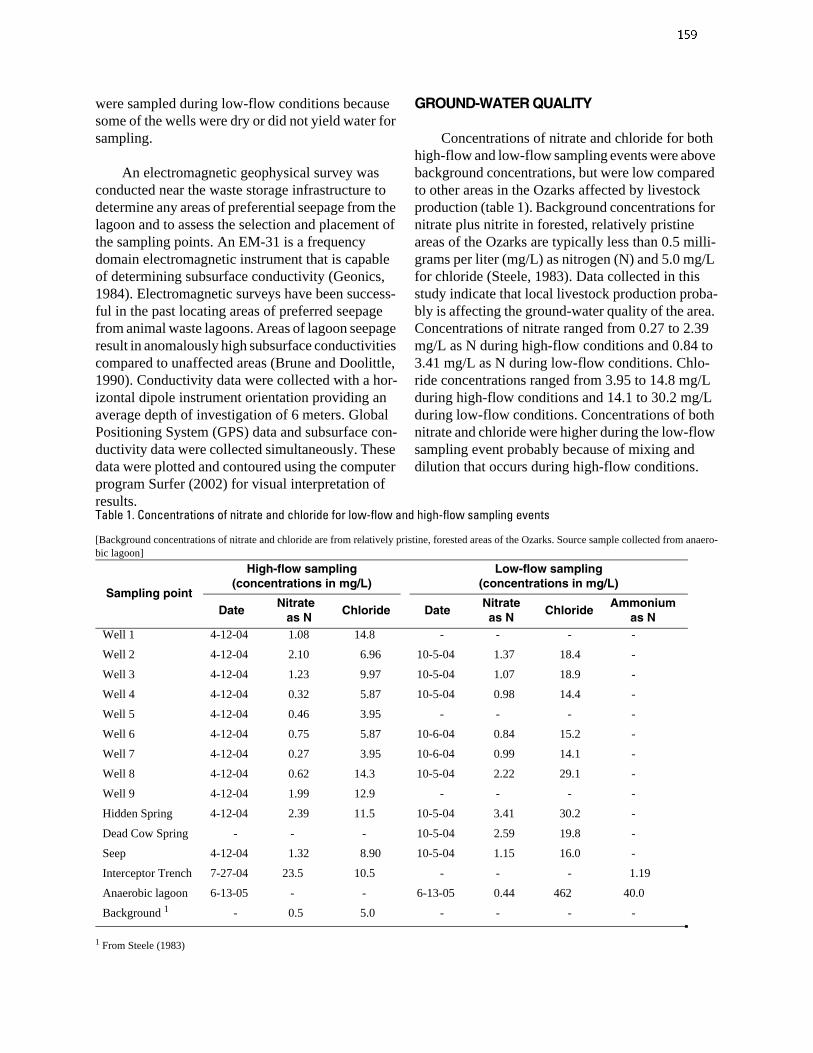
Concentrations of nitrate and chloride for both high-flow and low-flow sampling events were above background concentrations, but were low compared to other areas in the Ozarks affected by livestock production (table 1). Background concentrations for nitrate plus nitrite in forested, relatively pristine areas of the Ozarks are typically less than 0.5 milli-grams per liter (mg/L) as nitrogen (N) and 5.0 mg/L for chloride (Steele, 1983). Data collected in this study indicate that local livestock production proba-bly is affecting the ground-water quality of the area. Concentrations of nitrate ranged from 0.27 to 2.39 mg/L as N during high-flow conditions and 0.84 to 3.41 mg/L as N during low-flow conditions. Chlo-ride concentrations ranged from 3.95 to 14.8 mg/L during high-flow conditions and 14.1 to 30.2 mg/L during low-flow conditions. Concentrations of both nitrate and chloride were higher during the low-flow sampling event probably because of mixing and dilution that occurs during high-flow conditions.
1 From Steele (1983)
Table 1. Concentrations of nitrate and chloride for low-flow and high-flow sampling events
[Background concentrations of nitrate and chloride are from relatively pristine, forested areas of the Ozarks. Source sample collected from anaero-bic lagoon]
Sampling point
High-flow sampling(concentrations in mg/L)
Low-flow sampling (concentrations in mg/L)
DateNitrate as N
Chloride DateNitrateas N
ChlorideAmmonium
as NWell 1 4-12-04 1.08 14.8 - - - -
Well 2 4-12-04 2.10 6.96 10-5-04 1.37 18.4 -
Well 3 4-12-04 1.23 9.97 10-5-04 1.07 18.9 -
Well 4 4-12-04 0.32 5.87 10-5-04 0.98 14.4 -
Well 5 4-12-04 0.46 3.95 - - - -
Well 6 4-12-04 0.75 5.87 10-6-04 0.84 15.2 -
Well 7 4-12-04 0.27 3.95 10-6-04 0.99 14.1 -
Well 8 4-12-04 0.62 14.3 10-5-04 2.22 29.1 -
Well 9 4-12-04 1.99 12.9 - - - -
Hidden Spring 4-12-04 2.39 11.5 10-5-04 3.41 30.2 -
Dead Cow Spring - - - 10-5-04 2.59 19.8 -
Seep 4-12-04 1.32 8.90 10-5-04 1.15 16.0 -
Interceptor Trench 7-27-04 23.5 10.5 - - - 1.19
Anaerobic lagoon 6-13-05 - - 6-13-05 0.44 462 40.0
Background 1 - 0.5 5.0 - - - -
egbaker
Text Box
159

These results were comparable to a previous study conducted prior to the construction of the Savoy Swine Facility. Little (1999) collected water-quality samples from springs, seeps, and wells prox-imal to the study area under high-flow and low-flow sampling conditions. Nitrate concentrations ranged from 0.06 to 4.64 mg/L as N and chloride concentra-tions ranged from 2.89 to 27.0 mg/L as N. The ele-vated concentrations suggest that the basin probably was affected by local livestock production prior to the construction of the Savoy Swine Facility. The highest concentrations of nitrate and chloride were detected near the University of Arkansas Beef Head-quarters towards the eastern portion of the study area (fig. 2).
The results from the interceptor trench sample indicate that nitrogen is seeping through the anaero-bic lagoon liner as ammonium with nitrification converting the ammonium into nitrate. The intercep-tor trench sample had concentrations of nitrate at 23.5 mg/L as N and ammonium concentrations at 1.19 mg/L as N. A water-quality sample was col-lected from the anaerobic lagoon on June 13, 2005. The form of nitrogen within the anaerobic lagoon is predominantly ammonium, with concentrations at 40.0 mg/L as N. Nitrate concentrations were 0.44 mg/L as N and chloride concentrations were 462 mg/L in the lagoon sample (table 1). The lagoon
leachate is probably mixing with other waters result-ing in lower concentrations of nitrate and chloride in downgradient sampled wells and springs. Based on these ground-water quality data, the swine waste lagoon built using the Natural Resources Conserva-tion Practice no. 313 is minimally affecting the ground-water quality of the area.
ELECTROMAGNETIC GEOPHYSICAL SURVEY
The results of the EM-31 survey did not identify any areas of preferential seepage from the holding ponds, settling basin, or anaerobic lagoon. Subsur-face conductivities ranged from 0.6 to 21.0 millim-hos per meter. It appears that most of the leakage is from the anaerobic lagoon and the leachate is migrating from the source in a fairly uniform pattern (fig. 3). There is very little leakage from the waste holding ponds and settling basin. This is probably because the animal waste stored in both the holding ponds and settling basin contains a much higher pro-portion of solid animal waste compared to the anaer-obic lagoon. The solid waste is able to create a seal that decreases liner permeability (Natural Resources Conservation Service, 2003). Based on the results of the EM-31 survey it appears that the oversizing of the waste storage infrastructure is having a negative impact on the effectiveness of the anaerobic lagoon.
egbaker
Text Box
160

161
3
12
126
18126 6
96
3
0
0
50 Meters
50 Feet
36 08’32”o
36 08’35”o
36 08’37”o
97 19’37”o 97 19’35”o 97 19’32”o
Figure 3. Results of EM-31 electromagnetic survey.
SUMMARY
A study was conducted to evaluate the effects of a swine waste lagoon on ground-water quality in a mantled karst terrane at the University of Arkansas' Savoy Experimental Watershed. An anaerobic swine waste lagoon was constructed at the Savoy Swine Facility in compliance with U.S. Department of Agriculture NRCS Conservation Waste Storage Practice Standard no. 313. An inventory of springs, seeps, and losing streams was conducted in the basin where the waste lagoon was constructed. Based on the inventory, sampling sites were selected and nine shallow monitoring wells were augered to the depth of drilling refusal in the regolith. Shallow ground-water from wells, springs and an interceptor trench was sampled for nutrients, major cations, and major anions during high-flow and low-flow conditions.
Data collected in this study indicate that the ground-water quality of the area is probably being affected by local livestock production. The concen-trations of nitrate and chloride for both high-flow and low-flow sampling events were above back-ground concentrations, but were low compared to other agriculturally affected areas in the Ozarks. Concentrations of nitrate plus nitrite ranged from 0.27 to 2.39 mg/L as N during high-flow conditions and 0.84 to 3.41 mg/L as N during low-flow condi-tions. Chloride concentrations ranged from 3.95 to 14.8 mg/L during high-flow conditions and 14.1 to 30.2 mg/L during low-flow conditions. Concentra-tions of both nitrate and chloride were higher during the low-flow sampling event probably because of mixing and dilution that occurs during high-flow conditions.

162
These results were comparable to a previous study conducted prior to the construction of the Savoy Swine Facility. Water-quality samples were collected from springs, seeps, and wells within near the study area under high-flow and low-flow sam-pling conditions. Nitrate concentrations ranged from 0.06 to 4.64 mg/L as N and chloride concentrations ranged from 2.89 to 27.0 mg/L. The elevated con-centrations suggest that ground water in the basin has been affected by local livestock production prior to the construction of the Savoy Swine Facility.
A water-quality sample collected from an inter-ceptor trench after a storm event on July 27, 2004 had concentrations of nitrate at 23.5 mg/L as N and dissolved ammonium concentrations at 1.19 mg/L as N. The results from the interceptor trench sample indicate that nitrogen is seeping through the anaero-bic lagoon liner as ammonium with nitrification converting the ammonium into nitrate. The lagoon leachate probably is mixing with other waters result-ing in lower concentrations of nitrate and chloride in downgradient sampled wells and springs.
The results of an electromagnetic geophysical survey identified no areas of preferred seepage from the holding ponds, settling basin, and anaerobic lagoon. Most of the leakage appears to be from the anaerobic lagoon and the leachate is migrating from the source in a fairly uniform pattern. Very little leakage from the waste holding ponds and settling basin occurs. This is probably because the animal waste stored in both the holding ponds and settling basin contains a much higher proportion of solid ani-mal waste compared to the anaerobic lagoon. Based on these results, the swine waste lagoon built using the Natural Resources Conservation Service Con-servation Practice no. 313 is minimally affecting the ground-water quality of the area.
SELECTED REFERENCES
Adamski, J.C., 1987, The effect of agriculture on the quality of ground water in a karstified carbonate ter-rain, northwest Arkansas: Unpublished M.S. Thesis, 124 p.
Brune, D.E., and Doolittle, J., 1990, Locating lagoon seepage with radar and electromagnetic survey: Envi-ronmental Geology Water Science, v. 16, no. 3, p. 195-207.
Fenneman, N.M., 1938. Physiography of eastern United States: New York, McGraw-Hill Book Co. Inc., 714 p.
Geonics Limited, 1984, Operating manual for EM-31D non-contacting terrain conductivity meter: 60 p.
Ham, J.M., and DeSutter T.M., 2000, Toward site-spe-cific design standards for animal-waste lagoons: Pro-tecting ground water quality: Journal of Environmental Quality, v. 29, p.1721-1732.
Harper, M.D., Phillips, W.W., and Haley, G.J., 1969, Soil survey of Washington County, Arkansas: U.S. Depart-ment of Agriculture, 94 p.
Imes, J.L., and Emmett, L.F., 1994, Geohydrology of the Ozark Plateau aquifer system in parts of Missouri, Arkansas, Oklahoma, and Kansas: U.S. Geological Survey Professional Paper 1414-D, 127 p.
Little, P.R., 1999, Dominant processes affecting ground-water quality and flow in Basin 2, Savoy Experimental Watershed (SEW): Unpublished M. S. Thesis, 93 p.
Maxwell, C.V., Van Devender, K., Coffey, K.P., Moore, P.A., Chaubey, I., and Smith, D.R., 2003, Swine waste demonstration and training project: University of Arkansas, Division of Agriculture, Final Project Report, 6 p.
Natural Resources Conservation Service, 2003, Agricul-tural waste management field handbook, Appendix 10D: 31 p.
Steele, K. F., 1983, Chemistry of the springs of the Ozark Mountains, northwest Arkansas: Water Resources Completion Report A-055-Ark. 47 p.
Surfer version 8.02, 2002, Surface mapping system: Golden Software.
United States Department of Agriculture, 2003, United States Department of Agriculture National Agricul-tural Statistics Service, accessed June 10, 2005 at http://www.usda.gov/nass/pubs/estindx.htm.
163
Vulnerability (Risk) Mapping of the Madison Aquifer near Rapid City, South Dakota
By Scott L. Miller, Dr. Arden D. Davis, and Dr. Alvis L. LisenbeeSouth Dakota School of Mines and Technology, Department of Geology and Geological Engineering, 501 East St. Joseph Street, Rapid City, SD 57701
ABSTRACT
Water supplies for Rapid City, South Dakota, and surrounding suburban and rural areas are extremely vulnerable to contamination. The impact of ground-water contamination could occur quickly and linger for many years. The City of Rapid City is located within the Rapid Creek watershed in the east-central Black Hills and relies heavily on the Mississippian Madison karst aquifer for drinking-water supplies, utilizing several wells and springs. The aquifer consists of limestone and dolomite and contains paleokarst and recent karst that probably formed along a well-developed fracture system. Previous work indicates stream-related aquifer recharge from the watersheds of Spring Creek (to the south), Boxelder Creek (to the north), and Rapid Creek as well as direct recharge by precipitation on the entire outcrop area west of Rapid City. Spring Creek and Boxelder Creek lose all their flow to karst sinkholes in the aquifer except during periods of high discharge (greater than approximately 28 ft3/sec for Spring Creek and 50 ft3/sec for Boxelder Creek. Ground water from these watersheds converges on wells and springs in the Rapid City area several miles away. Dye-tracer tests for this area indicate ground-water velocities on the order of 1,000 feet per day and residence times range from a few days to several years.
A database of 329 wells, geologic maps, fractures, faults, geologic structures, water-quality data, and dye-tracer test results were analyzed to develop a geologic model to better define local ground-water flow paths and characterize susceptibility zones. Structure contour and depth-to-aquifer maps have been com-pleted for the Madison aquifer. Inherent aquifer susceptibility, combined with human influences, was used to develop a vulnerability (risk) map (1:24,000 scale) for the Madison aquifer for the Rapid City area.

164
Hydrogeologic Characteristics of Four Public Drinking-Water Supply Springs in the Ozark Plateaus of Northern Arkansas
By Joel M. GallowayU.S. Geological Survey, 401 Hardin Road, Little Rock, AR 72211
ABSTRACT
In October 2000, a study was undertaken by the U.S. Geological Survey in cooperation with the Arkan-sas Department of Health to determine the hydrogeologic characteristics, including the extent of the recharge areas, for four springs in northern Arkansas used for public drinking-water supply. Information pertaining to each spring can be used to enable development of effective management plans to protect these water resources and public health. Analyses of discharge, temperature, and water quality were completed to describe ground-water flow characteristics, source-water characteristics, and connectivity of the ground-water system with surface runoff. Water-level contour maps were constructed to determine ground-water flow directions, and ground-water tracer tests were conducted to determine the extent of the recharge areas and ground-water flow velocities.
Two of the springs (Hughes and Stark Springs) were characterized as being influenced by local recharge areas and two springs (Evening Shade and Roaring Springs) reflected regional aquifer recharge. The discharge and water-quality data for Hughes and Stark Springs show the ground-water systems are dominated by rapid recharge from surface runoff and mainly consist of conduit-type flow systems with little diffuse-type flow. The local recharge area for Hughes Spring was estimated as 15.8 square miles, and the local recharge area for Stark spring was estimated as 0.79 square mile. Recharge to Evening Shade and Roaring Springs originates from water entering geologic formations in the Ozark aquifer. As a result, a local recharge area was not delineated, as the area could include relatively remote locations where geologic for-mations composing the Ozark aquifer are exposed and have sufficient porosity and hydraulic conductivity to convey water that falls as precipitation to the subsurface.
INTRODUCTION
Hughes Spring, Stark Spring, Evening Shade Spring, and Roaring Spring supply the public drink-ing water to the communities of Marshall, Cushman, Evening Shade, and Cherokee Village, Arkansas (fig. 1). Anticipated nearby land-use changes may increase threats to the quality of the shallow ground water in part because of the karst terrain, and the extent and location of the recharge areas that con-tribute water to these four public drinking-water supply springs were unknown. Shallow ground-water systems dominated by fracture or conduit flow may be subject to rapid input of surface contami-nants and rapid transport of these contaminants to wells and springs with little opportunity for natural attenuation processes to occur. Many communities
and towns in Arkansas have discontinued the use of springs that discharge shallow ground water because of surface-derived contamination.
In October 2000, the U.S. Geological Survey (USGS) began a cooperative study with the Arkan-sas Department of Health to characterize the hydro-geology and extent of the recharge area for the springs. The purpose of this report is to describe the hydrogeologic characteristics, including the extent of the recharge areas, of Hughes, Stark, Evening Shade, and Roaring Springs. A more detailed description of the results is discussed in Galloway (2004). This information will help water managers to develop plans to protect the recharge area from contamination related to land use and potential spills.

165
Figure 1. Location of springs and study areas.
HughesSpring
StarkSpring
Evening ShadeSpring
RoaringSpring
Marshall
EveningShade
Cushman
Batesville
AshFlat
CherokeeVillag e
Hardy
Ozark Aquifer
SpringfieldPlateauAquifer
Western InteriorPlains Confining
System
Izard
Stone
Sharp
Searcy
Fulton
Marion
Baxter
Van Bure n
Cleburne
Independence
Arkansas
Base from U.S. Geological Surveydigital data, 1:100,000
MissouriArkansas
0 20 Miles10
0 20 Kilometers10
35°30'
36°30'
92°30' 91°30'
EXPLANATIONSpring
Study Area
METHODS OF INVESTIGATION
Several methods were used to determine the hydrogeologic characteristics of each study area. Geomorphic and topographic data from existing maps were gathered and assessed to determine surf-icial controls on infiltration, ground-water flow pathways, and boundaries to ground-water flow. A field inventory of karst features (caves, sinkholes, sinking streams, and enlarged vertical fractures and bedding planes), wells, and springs also was con-ducted in each study area to provide information on the connection of the ground-water system to the land surface and to develop water-level contour maps of the study areas. Several wells were used for
borehole geophysical surveys within the study areas to provide information about the lithology, distribu-tion of permeability, and nature of vertical flow within the ground-water system. To determine flow characteristics and aid in the estimate of the recharge area, the four springs were instrumented to measure discharge, water temperature, and precipitation for October 2001 to October 2002. Water-quality sam-ples were collected at each spring to determine the geochemistry of the contributing geologic units and the susceptibility of the spring to contamination. Samples were collected during base-flow and high-flow conditions and were analyzed for major ions, selected trace constituents, nutrients, fecal indicator bacteria, wastewater constituents, stable isotopes,
166
and radiogenic isotopes. Qualitative tracer tests were conducted from January to June 2002 to iden-tify possible ground-water flowpaths and velocities and confirm the locations of inferred ground-water-basin boundaries. A more detailed discussion of the methods used in the study is presented in Galloway (2004).
LOCALLY RECHARGED SPRINGS
The study area for Hughes Spring includes the Western Interior Plains confining system and the Springfield Plateau and Ozark aquifers. Exposures of geologic units of the Springfield Plateau aquifer dominate the area, smaller parts of the Ozark aquifer are exposed in the northern part of the study area, and parts of the Western Interior Plains confining system are exposed in the southern part of the study area. Units generally dip south-southeast by 3 to 12 degrees and the only large structural feature is a fault, located in the southern part of the study area (Galloway, 2004). The Western Interior Plains con-fining system contains Pennsylvanian-age shale, sandstone, and limestone (Pitkin Limestone, Fay-etteville Shale, and Batesville Sandstone) (fig. 2). The geologic units of the Springfield Plateau aquifer consist of Mississippian-age limestone (Boone For-mation) and are typically separated from the under-lying Ozark aquifer by the Ozark confining unit composed of Devonian-age shale in areas of north-ern Arkansas (fig. 2). Borehole geophysical surveys in several wells show the Ozark confining unit was thin or absent in the Hughes Spring study area; therefore, the unit is not shown in figure 2. The Ozark aquifer is exposed at low altitudes in stream valleys in the northern portion of the Hughes Spring study area. Geologic formations that compose the Ozark aquifer and are exposed in the study area include Devonian- and Silurian-age limestone (Cason Shale, Fernvale Limestone, and Plattin Limestone), and Ordovician-age shale and lime-stones, dolomites, and sandstones (St. Peter Sand-stone and Everton Formation). Water-level data indicate a hydrologic connection exists between the Springfield Plateau aquifer and the Ozark aquifer because of the discontinuous presence of the Ozark confining unit (fig. 2). Karstic features were found in the Hughes Spring study area, mainly in the Mis-sissippian-age Boone Formation. These features
develop as ground water percolates through the limestone resulting in the enlargement of fractures through the dissolution of the carbonate rock form-ing solution channels (fig. 2). Karst features present in the study area include sinkholes, springs, sinking streams, and caves. No surface streams were observed to have flow throughout the year. Brush Creek was observed to have flow along its entire length in the study area only during periods of intense rainfall events. Hughes Spring discharges from fractures in units of the Ozark aquifer, although most of the water probably originates from the over-lying Springfield Plateau aquifer as indicated by the geophysical data, ground-water tracer tests, and geochemical data discussed later in this report.
The Boone Formation is exposed throughout most of the Stark Spring study area at higher alti-tudes. Silurian- and Devonian-age units are present in the northern and western parts of the study area, but are absent near Stark Spring, resulting in an unconformable contact of the Boone Formation and the Ordovician-age shales and dolomites (fig. 2). Field observations in the area indicate that where the Boone Formation is exposed, surface runoff only occurs during periods of intense rainfall. Stark Spring is located near the contact of the Boone For-mation and the underlying less permeable and less karstic Cason Shale.
The discharge for Hughes Spring and Stark Spring varied seasonally and temporally (fig. 3). The mean annual discharges for Hughes Spring for water years 2001 and 2002 were 2.9 and 5.2 cubic feet per second (ft3/s), respectively (Brossett and Evans, 2003). Mean daily discharge ranged from approximately 0.5 to 14 ft3/s for water years 2001 and 2002. The mean annual discharge for Stark Spring for water years 2001 and 2002 was 0.5 and 1.5 ft3/s, respectively (Brossett and Evans, 2003). Mean daily discharge ranged from approximately 0.1 to 23 ft3/s for water year 2001 and from 0.1 to 49 ft3/s for water year 2002. The ratios of annual peak flow to base flow for Hughes Spring (28) and Stark Spring (491) indicated fast-response springs (White, 1988).
Water temperature for Hughes Spring reflected seasonal variations throughout the monitoring

167
period and demonstrated considerable changes dur-ing summer high-flow events (fig. 3). The highest temperatures were recorded in the summer and fall with average temperatures of approximately 17 °C for both seasons. The winter and spring had lower average temperatures of approximately 12 °C and 13 °C, respectively. Large water temperature varia-
tions corresponded to high-flow events. Large water temperature fluctuations were not noticeable for Stark Spring, although slight variations did occur during high-flow events (fig. 3). Recorded water temperature ranged from 13.5 °C to 14.7 °C with a mean of 14.5 °C.
Figure 2. Conceptual model of ground-water flow to Hughes Spring and Stark Spring.
EVERTON FORMATION
ST. PETER SANDSTONE
FERNVALE LIMESTONE/PLATTIN LIMESTONE
BOONE FORMATION
RUDDELL SHALE MEMBEROF THE
MOOREFIELD FORMATIONFAYETTEVILLE SHALE/
BATESVILLE SANDSTONE
PITKIN LIMESTONE
HughesSpring
NORTH SOUTH
NOT TO SCALE
Brush Creek
CASON SHALE
SINKHOLE
SOLUTIONCHANNELS
EXPLANATION
Generalized flow direction of Brush Creek
Generalized ground-water flow direction
OzarkAquifer
SpringfieldPlateauAquifer
Spr
ingf
ield
Pla
teau
Aqu
ifer
Oza
rk A
quife
r
Western InteriorPlains Confining
System
StarkSpring
PokeBayou
LARGECONDUITS
BOONE FORMATION
JOACHIM DOLOMITE
ST. PETER SANDSTONE
EVERTON FORMATION
WEST EAST
NOT TO SCALE
CASONSHALE
SINKHOLE
ENLARGEDFRACTURES
EXPLANATION
Generalized ground-water flow direction

168
The major ion analyses for samples collected between September 2001 to October 2002 for Hughes Spring and Stark Spring show a chemistry that is a calcium bicarbonate type (Hem, 1989) and are indicative of waters from the Springfield Plateau aquifer. The calcium to magnesium ratio ranged from 26 to 38 for Hughes Spring and from 9 to 10 for Stark Spring, indicating contribution from limestone mineralogy (White, 1988). Ratios of calcium to magnesium calculated for other samples collected from wells and springs representing the Springfield Plateau aquifer indicate ratios ranging from 3 to 70, with a median ratio value of 18, also indicating lime-stone mineralogy. Wells and springs representing units in the Ozark aquifer had values for calcium to magnesium ratios ranging from 1 to 3 with a median value of 1, indicating a dolomitic mineralogy.
The geochemistry of Hughes Spring and Stark Spring is characteristic of conduit-dominated ground-water flow systems. Samples collected dur-ing base-flow conditions had calcite saturation index (SIcalcite) (Adamski, 2000) values near or greater than 0.4 (supersaturated with respect to calcite) for Hughes Spring and ranged from -0.12 to 0.16 for Stark Spring. High-flow samples had SIcalcite values of 0.3 and -0.15 (supersaturated to undersaturated with respect to calcite) for Hughes Spring and ranged from -1.05 to 0.34 for Stark Spring. Total
dissolved solids (TDS) concentrations and hardness also changed with flow conditions. Both values decreased as discharge increased, reflecting the effects of reduced residence time of the water with the source rock at higher discharge, allowing for less dissolution at both springs.
Stable isotopes of carbon (δ13C) indicated dif-ferent characteristics of the recharge water as it enters the ground-water system at Hughes Spring compared to Stark Spring. The δ13C data for Hughes Spring indicate that although the ground-water system is dominated by conduit flow, a sub-stantial component of the source water interacts with surface material, such as soils and regolith, before entering the ground-water system during high-flow events. An enrichment of organically derived carbon occurs in the Hughes Spring discharge during high-flow events from water infiltrating into soils in the recharge area before entering the aquifer system. A connection of Hughes Spring with Brush Creek, shown by ground-water tracer tests, would provide pathways for water enriched in organically derived carbon to reach the spring discharge. During base-flow conditions, water in the ground-water system that feeds the Hughes Spring discharge has a longer residence time in the system that allows it to approach equilibrium and maintain an even distribu-tion of inorganically and organically derived carbon, caused by buffering (lowering the acidity) from car-bonate dissolution. The δ13C data show that the recharge water for Stark Spring has less interaction with the soil and regolith before entering the ground-water system than observed at Hughes Spring. Stark Spring displayed a decrease in the calculated per-centage of organically derived carbon during high-flow conditions. These data indicate that runoff enters the ground-water system at a more rapid rate near Stark Spring than near Hughes Spring, and does not allow sufficient interaction with surface material in the recharge area for the transport of organically derived carbon into the ground-water system.
Based on the ground-water tracer test data and the spring discharge, it appears that the recharge area for Hughes Spring generally coincides with the sur-face drainage area, which is approximately 15.8 square miles (mi2). Tracers injected outside the surface drainage area (sites 5-7) were not detected
S T A R K S P R I N G
O c t D e c F e b A p r J u n A u g O c t D e c F e b A p r J u n A u g O c t 0 . 0 1
0 . 1
1
1 0
1 0 0
W A T E R - Q U A L I T Y S A M P L E
H U G H E S S P R I N G
O c t D e c F e b A p r J u n A u g O c t D e c F e b A p r J u n A u g O c t
DIS
CH
AR
GE
, IN
CU
BIC
FE
ET P
ER
SEC
ON
D
0 . 0 1
0 . 1
1
1 0
1 0 0
T O T A L M E A N D A I L Y
T O T A L E S T I M A T E D M E A N D A I L YB A S E F L O W
D A T E
O c t D e c F e b A p r J u n A u g O c t D e c F e b A p r J u n A u g O c t
TEM
PER
ATU
RE,
IN
DEG
RE
ES C
ELSI
US
81 01 21 41 61 82 02 22 4
S T A R K S P R I N GH U G H E S S P R I N G
W A T E R Y E A R 2 0 0 1 W A T E R Y E A R 2 0 0 2
T O T A L M E A N D A I L Y B A S E F L O W
e e
e e
e e
W A T E R - Q U A L I T Y S A M P L E
Figure 3. Daily discharge and water temperature record-ed at Hughes Spring and Stark Spring.

169
within the surface-drainage area (fig. 4). Tracers injected at two sites inside the surface drainage area (sites 2 and 3) were detected at Hughes Spring and at springs along Brush Creek and in Brush Creek itself, indicating a connection between the surface flow in the stream and Hughes Spring. The tracer-test data and spring-discharge data show that Hughes Spring may act as a distributary from Brush Creek during high-flow events, discharging a por-tion of runoff waters resulting from precipitation that occurs in the surface-drainage area.
The recharge area computed from the recorded discharge indicated that the area approximated by the surface drainage was not large enough to pro-duce the discharge observed at Stark Spring. The surface-drainage area is approximately 0.34 mi2. An average computed recharge area of 0.79 mi2 from five storms, assuming a 10 percent reduction in recharge volume from evapotranspiration, soil absorption, and vegetation interception, was used with ground-water tracer test data to delineate the recharge area for Stark Spring.
The configuration of the recharge area for Stark Spring was found to be considerably different than the surface drainage from tracer-test data and geo-logic characteristics of the area. The recharge area is controlled predominantly by the occurrence of the Boone Formation outcrop. No major structural fea-tures were observed from geologic mapping or field observations near the spring, and tracer-test results show that the recharge area extends outside the surface-drainage area to the west of the spring surface-drainage area (fig. 4).
Tracer tests demonstrated rapid ground-water flow velocities in both study areas, which are char-acteristic of conduit-type flow often found in karst
systems (White, 1988). Using distances measured along implied flowpaths from injection sites to recovery sites, estimated minimum velocities ranged from 0.04 to 1.30 miles per day for Hughes Spring and 0.06 miles per day for Stark Spring.
REGIONALLY RECHARGED SPRINGS
The Evening Shade Spring and Roaring Spring study areas lie on the outcrop of the Ozark aquifer (fig. 1) and include Ordovician-age limestone, dolo-mite, and sandstone formations. The units generally have a slight dip to the south-southeast with an angle of less than 1 degree estimated from geophysical logs. No major structural features were evident in the study areas from field observations and geophys-ical logs. Few vertical fractures were observed in acoustic televiewer geophysical logs, but horizontal bedding planes were observed and likely provide the preferred pathways for dissolution (Galloway, 2004). Evening Shade Spring discharges through two main discharge points in the Everton Formation outcrop (fig. 5). One has been enclosed by a spring-house for utilization as a public-water supply and the other resurgent point is in the stream channel of Mill Creek near the springhouse. Roaring Spring dis-charges near the contact between the Cotter Dolo-mite and the Jefferson City Dolomite (fig. 5). The location of Evening Shade Spring and Roaring Spring may be caused by a set of enlarged vertical fractures or conduits not readily visible at the sur-face that may concentrate and convey flow to the surface from fractures and conduits in multiple for-mations composing the Ozark aquifer (fig. 5). Water-level contours, constructed from static water levels measured in wells and springs in both study areas, followed a similar pattern to the regional flow of the Ozark aquifer constructed by Pugh (1998) and Schrader (2001).

170
Figure 4. Locations of tracer injection and recovery sites with implied flowpaths of tracers and delin-eated recharge areas for Hughes and Stark Springs.
gnirpS
keer
C
ekoP
uoya
B
evaC
Creek
StarkSpring
CaveSpring
MillSpring
3
2
4
1
0 0.5 1 Mile
0 0.5 1 Kilometer
91°42' 91°39'
35°51'
35°49'
69
EXPLAN ATION
Site types (with site identifier)
Injection sites
Recovery sites
1StarkSpring Implied flowpath
Surface drainage area
Estimated recharge area
Base from U.S. Geological Surveydigital data, 1:100,000
hsur
B
keer
C
C ree
k
Bu ffa lo
River
Rocky
Cr eek
raeB
Sinkhole
7
6
5
3
2
1
4
S1
S9
S8
S6
S5S4
S3
S2
S15
S16
S14
S13
S11
S10
W28
65
27
65
74
27
74
0 1 2 Miles
0 1 2 Kilometers
Marshall
EXPLANATIONSite types (numberis site identifier)
Recovery sitesS1
Injection sites1
92°36'92°42'36°
35°54'
Base from U.S. Geological Surveydigital data, 1:100,000
HughesSpring
Surface drainage and estimated recharge area for Hughes Spring
Implied f lowpaths

171
Figure 5. Conceptual model of ground-water flow to Evening Shade and Roaring Springs.
StrawberryRiver
PineyFork
MillCreek
Evening ShadeSpring
NORTH SOUTH
NOT TO SCALE
ST. PETER SANDSTONEEVERTON FORMATION
POWELL DOLOMITE
COTTER DOLOMITE
JEFFERSON CITY DOLOMITE
OZA
RK
AQU
IFER
ROUBIDOUX FORMATION
ZONE OF LOWPERMEABILITY ENLARGED
BEDDINGPLANE
EXPLANATION
Generalized flow direction
OZA
RK
AQU
IFER
reviR
gnirpS
kroF
htuoS
gnirpSgnirao
R
COTTER DOLOMITE
DOLOMITEJEFFERSON CITY
ROUBIDOUX FORM ATION
REBMEMENOTSDNASRETNUG)noitamroFedanocsaG(
GASCONADE FORM ATION
NORTH SOUTH
NOT TO SCALE
reviR
gnirpS
kroF
htuoS
EXPLANATION
Generalized flow direction

172
The discharge for Evening Shade Spring and Roaring Spring remained fairly constant with time. The mean daily discharge for Evening Shade Spring, computed from the springhouse discharge point, ranged from 0.88 to 2.29 ft3/s for water year 2001 and from 0.76 to 2.25 ft3/s for water year 2002 (fig. 6). The mean annual discharge for water years 2001 and 2002 was 1.44 and 1.24 ft3/s, respectively (Brossett and Evans, 2003). The spring discharge periodically measured in the channel of Mill Creek ranged from 3.6 to 9.0 ft3/s during water years 2001 and 2002 (fig. 6). The mean daily discharge for Roaring Spring ranged from 4.8 to 7.2 ft3/s, and the mean discharge was 5.7 ft3/s for July 2001 to Octo-ber 2002 (Brossett and Evans, 2003) The ratio of base flow to peak flow for Evening Shade Spring ranged from 2.6 to 3.0 and the ratio for Roaring Spring was 1.5, indicating slow-response springs (White, 1988). The discharge for both springs con-trasts with the fast response, storm input type of dis-charge that was observed at Hughes and Stark Springs.
The recorded water temperature for Evening Shade Spring ranged from 16.7 to 16.8 °C from Feb-ruary 2001 to July 2002, and the water temperature for Roaring Spring ranged from 17.1 to 17.2 °C (fig. 6). The relatively stable discharge and temper-
ature suggest that the Evening Shade Spring and Roaring Spring discharge is representative of a regional ground-water system.
The major ion analyses from Evening Shade Spring and Roaring Spring demonstrated a calcium bicarbonate type water typical of the Ozark aquifer. All samples collected from Evening Shade Spring and Roaring Spring had calcium to magnesium ratio values of 1.3 and 1.1, respectively, indicating contri-bution from a dolomitic mineralogy (White, 1988) that also is representative of formations of the Ozark aquifer. SIcalcite values from samples collected at Evening Shade Spring and Roaring Spring showed the waters are supersaturated with calcite. Values for SIcalcite appeared to have an inverse relation with the quantity of discharge at the time the sample was col-lected. At higher discharges, the SIcalcite decreased and at lower discharges the value increased. Although it has been shown that there is not a large variation in spring discharge during precipitation events, flow velocities in the ground-water system during periods of high precipitation (late winter, early spring) may increase enough to decrease the contact time of the water with the rock because of a steepening of the ground-water gradient. The δ13C data show the water discharging from Evening Shade Spring and Roaring Spring reflected near-equilibrium conditions between the ground water and the aquifer material.
The discharge, geochemical, and hydrogeologic data indicate that the discharges for Evening Shade Spring and Roaring Spring are representative of a regional ground-water flow system (Ozark aquifer) and do not allow for a distinct boundary to be delin-eated for the recharge area contributing to the spring. Ground-water tracer tests conducted in the study area to identify a connection between Evening Shade Spring and local ground-water flow systems resulted in the negative recovery of the three tracers injected into two wells and a sinkhole. Although the tracer tests did not establish that a local recharge area does not exist conclusively, they lend support that the Evening Shade Spring is mainly recharged from the Ozark aquifer. Tracer tests were not attempted in the Roaring Spring study area. The recharge areas for the two springs could include rel-atively remote locations where hydrogeologic units
E V E N I N G S H A D E S P R I N G
O c t D e c F e b A p r J u n A u g O c t D e c F e b A p r J u n A u g O c t
DIS
CH
AR
GE
, IN
CU
BIC
FE
ET
PE
R S
EC
ON
D
0 . 0 1
0 . 1
1
1 0
1 0 0
T O T A L M E A N D A I L YB A S E F L O W
R O A R I N G S P R I N G
O c t D e c F e b A p r J u n A u g O c t D e c F e b A p r J u n A u g O c t 0 . 0 1
0 . 1
1
1 0
1 0 0
D A T E
O c t D e c F e b A p r J u n A u g O c t D e c F e b A p r J u n A u g O c t
TEM
PER
ATU
RE,
IN
DEG
REE
S C
ELSI
US
1 6 . 4
1 6 . 6
1 6 . 8
1 7 . 0
1 7 . 2
1 7 . 4
1 7 . 6E V E N I N G S H A D E S P R I N GR O A R I N G S P R I N G
W A T E R Y E A R 2 0 0 1 W A T E R Y E A R 2 0 0 2
T O T A L M E A N D A I L Y W A T E R - Q U A L I T Y S A M P L E
B A S E F L O W
W A T E R - Q U A L I T Y S A M P L E
e e
e e
e e
Figure 6. Daily discharge and water temperature record-ed at Evening Shade Spring and Roaring Spring.
173
composing the Ozark aquifer are exposed and have sufficient porosity and hydraulic conductivity to convey water that falls as precipitation to the subsur-face.
CONCLUSIONS
Recharge to Hughes Spring and Stark Spring occurs mainly from the Boone Formation that com-poses the Springfield Plateau aquifer. Ground-water tracer tests indicate that the recharge area for Hughes Spring generally coincides with the surface drainage area (15.8 mi2) and that Hughes Spring is directly connected to the surface flow in Brush Creek. Analyses of discharge data show that Stark Spring has a fast response to surface runoff and the estimated recharge area (0.79 mi2) is larger than the surface-drainage area (0.34 mi2). Ground-water tracer tests and the outcrop of the Boone Formation indicate that most of the recharge area extends out-side the surface-drainage area.
The geochemistry of Hughes Spring and Stark Spring demonstrated variations with flow conditions and the influence of surface-runoff in the recharge area. Calcite saturation indices, total dissolved sol-ids concentrations, and hardness demonstrate noticeable differences with flow conditions reflect-ing the reduced residence time and interaction of water with the source rock at high-flow conditions for Hughes Spring. Large water temperature varia-tions also corresponded to high-flow events at Hughes Spring although variations were not as noticeable for Stark Spring during high-flow events.
Evening Shade and Roaring Springs originate from geologic formations composing the Ozark aquifer. Little variation in discharge and tempera-ture was evident during high-flow events and throughout the monitoring period indicating that spring discharge is dominated by regional ground-water flow with small portions of local recharge. As a result, local recharge areas were not delineated, and the area could include relatively remote loca-tions where geologic formations composing the Ozark aquifer are exposed and have sufficient poros-ity and hydraulic conductivity to convey water that falls as precipitation to the subsurface.
REFERENCES
Adamski, J.C., 2000, Geochemistry of the Springfield Plateau aquifer of the Ozark Plateaus Province in Arkansas, Kansas, Missouri and Oklahoma, USA: Hydrological Processes, v. 14, p. 849-866.
Brossett, T. H. and Evans, D.A., 2003, Water resources data, Arkansas, water year 2002: U.S. Geological Survey Water-Data Report AR-02-1, 461 p.
Galloway, J.M., 2004, Hydrogeologic characteristics of four public drinking-water supply springs in northern Arkansas: U.S. Geological Survey Water-Resources Investigations Report 03-4307, 68 p.
Hem, J.D., 1989, Study and interpretation of the chemical characteristics of natural water: U.S. Geological Survey Water Supply Paper 2254, 264 p.
Pugh, A.L., 1998, Potentiometric surface of the Ozark aquifer in northern Arkansas, 1995: U.S. Geological Survey Water-Resources Investigations Report 98-4000, 7 p.
Schrader, T.P., 2001, Potentiometric surface of the Ozark aquifer in northern Arkansas, 2001: U.S. Geological Survey Water-Resources Investigations Report 01-4233, 11 p.
White, W.B., 1988, Geomorphology and hydrology of karst terrains: New York, New York, Oxford Univer-sity Press, Inc., 464 p.

174
Adaptation of the Residence Time Distribution (RTD)-Biodegradation Model to Quantify Peroxide-Enhanced Fuel Biodegradation in a Single Karst Well
Lashun K. King1, Roger D. Painter1, and Tom D. Byl1,21Dept. of Civil & Environmental Engineering, Tennessee State University, Nashville, TN 372092U.S. Geological Survey, 640 Grassmere, Suite 100, Nashville, TN 37211
ABSTRACT
This field study was conducted to determine if a numerical model incorporating residence time distri-bution (RTD) coupled to a first-order rate of biodegradation (k') could be used to quantify toluene and ben-zene removal in a single karst-well injection system. This study involved injecting sodium chloride (NaCl) as a conservative tracer, as well as hydrogen peroxide (H2O2), to enhance aerobic biodegradation of toluene and benzene. A 100-gallon volume of fuel-contaminated karst aquifer water was pumped into a container. NaCl (1.25 kilograms) and 33 percent H2O2 (4 liters) were mixed into the water and injected back into the bedrock aquifer. The NaCl, dissolved oxygen, benzene and toluene concentrations were monitored for sev-eral weeks. Results show that benzene and toluene concentrations declined approximately 10 times faster than the NaCl concentrations, indicating enhanced biodegradation. The RTD was calculated by using the declining NaCl-concentration curve through time. The biodegradation rate was derived from the benzene and toluene data. The RTD-biodegradation formula (described in this paper) was used to predict and quan-tify the enhanced biodegradation of benzene and toluene in the karst aquifer. The RTD-biodegradation for-mula predicted benzene and toluene concentrations in the well through time to within 1 microgram per liter (µg/L) of the actual concentration. This close agreement between the RTD-biodegradation model predic-tion and the measured concentration confirms that this method can be used to quantify enhanced biodegra-dation in a single karst injection well.
INTRODUCTION
Karst aquifers have been recognized as one of the most challenging geologic media in terms of ground-water modeling (Wolfe and others, 1997; White, 2002). Ground-water flow in karst aquifers is complex because of variability in conduit size, shape, and direction (Field, 1993). Numerical mod-els based on Darcy’s Law often are unable to accu-rately characterize contaminant flow through the heterogeneous fractures and dissolution features. To successfully model ground-water flow in karst, a numerical model must provide an accurate mathe-matical representation of the physical karst aquifer system. The non-ideal, complex flow in karst aqui-fers presents greater challenges for modeling bio-degradation processes with partial differential
equations for flow and transport. Chemical engi-neers commonly use a residence-time distribution (RTD) formula to describe non-ideal flow through a reactor. This study adapted and used RTD to describe migration of a conservative tracer through a section of a karst aquifer in south-central Ken-tucky. The RTD formula was modified to incorpo-rate a biodegradation rate for predicting the removal of benzene and toluene. The objective of this study was to develop and adapt the RTD-biodegradation formula for predicting and quantifying biodegrada-tion in a single well injected with hydrogen perox-ide. This numerical approach was tested in a field study where hydrogen peroxide (H2O2) was injected into a bedrock well to enhance aerobic biodegrada-tion of jet fuel in the karst aquifer.

175
DERIVATION OF THE RTD-BIODEGRADATION FORMULA
Obtaining RTD for a Karst, Single-Well, Injection System
The degree of mixing within a non-ideal flow karst system can be characterized by the residence time distribution function, E(t). Experimentally, the RTD function can be calculated using a quantitative tracer study. At an initial time of zero, t = 0, a known mass of conservative tracer (M0) dissolved in a known volume is injected into the karst system. The concentration of the conservative tracer, C, is then measured in the well as a function of time (t).
When the change in time, ∆t, is so small, the C(t) is essentially constant. Therefore, the amount of the tracer (∆M) flowing between t and t+∆t can be expressed as:
(1)
where the term C(t) represents the concentration of the tracer at some time (t) and the term u represents the flow rate of the system, which is constant.
The fraction of the tracer in the non-ideal flow system between t and t+∆t can be mathematically described by as:
(2)
Based on this mass balance for the continuous-input tracer study, the RTD function, (E(t)) can be described as:
(3)
The ratio of is the water discharging from the system that has spent less than the mean theoret-ical time in the flow. The first two moments of E(t) can be defined as the mean residence time and vari-ance of the distribution. The mean residence time (tm) for the non-ideal flow system can be calculated using the equation:
(4)
The variance (σ2) is defined as:
(5)
The E(t), tm, and σ2 for a single-well injection sys-tem can be obtained by numerical differentiation of the conservative tracer data.
Obtaining Peclet Number for a Non-Ideal Flow System
In describing a non-ideal flow system, the con-vective and dispersive nature of the flow is often considered. The Peclet number (Pe) characterizes the degree of flow diffusivity compared to the advective transport. This dimensionless parameter quantitatively characterizes the transport diffusion and is inversely related to the dispersion value, d, for a non-ideal flow system.
(6)
It can be shown that the moments from the E(t), mean residence time and variance obtained from equations 7 and 8 below are related to the Peclet number (Pe) as follows:
(7)
and
(8)
The connection between Peclet number, E(t), mean residence time and variance is accomplished by treating τ (space-time) in the above equations as an unknown and first calculating Pe based on the experimental RTD and then calculating for τ (τ = V/u) (Bischoff and Levenspiel, 1962).
∆M C t( )u∆t=
dMM0-------- uC t( )
M0--------------∆t=
E t( ) ddt----- C t( )
C0----------=
C t( )C0
----------
tm t* ddt----- C t( )
C 0( )----------
⎩ ⎭⎨ ⎬⎧ ⎫
∆t∑=
σ2 t2* ddt----- C t( )
C 0( )----------
⎩ ⎭⎨ ⎬⎧ ⎫
∆t tm2( )–∑=
Pe 1/d( )=
tm 1 2Pe-----+⎝ ⎠
⎛ ⎞ τ=
σ2
τ2----- 2Pe----- 8
Pe2--------+=

176
Adaptation of the RTD-Biodegradation Model for a Single-Well Injection
The fate of organic contaminants in a karst aquifer system also depends on their susceptibility to biodegradation. As a result, the application of the RTD alone is not sufficient to numerically predict the fate of contaminants in a karst aquifer. The karst-contaminant model developed here uses RTD cou-pled to a biodegradation rate reaction.
The chemical kinetics of biodegradation are assumed to be represented by a rate equation such as:
(9)
Equation 9 describes a changing concentration of contaminant A (dCA) through time (dt) as a func-tion of the biodegradation rate (k), the concentration of contaminant A in solution (CA), and bacteria and electron-acceptors, (CB). Since the rate is dependant upon two variables, the rate equation can be expressed as a second-order reaction. If the bacteria and electron acceptors, however, are assumed to be present at a relatively steady state, then (CB) can be considered constant while the contaminant concen-tration (CA) continually changes. In such conditions, CB is treated as a constant and the second-order equation is re-written as a pseudo first-order equa-tion:
(10)
where k' = kCB becomes a pseudo first-order rate constant, which can be obtained by fitting the experimental and field data.
The RTD function and biodegradation function can be coupled to develop the RTD-biodegradation function capable of quantifying biodegradable con-taminants at a given time, C(t). This function can be mathematically expressed as:
(11)
where and C0 = initial con-taminant concentration.
This RTD-biodegradation equation was used to pre-dict and quantify benzene and toluene removal in a single karst well. This approach accounts for the non-ideal flow, axial dispersion, and biodegradation in the karst aquifer directly surrounding the injec-tion well. The following section describes the results of applying this formula in a field study.
METHODS AND MATERIALS
A jet-fuel-contaminated karst site in south-cen-tral Kentucky was selected because of the availabil-ity of site history and previous research (Byl and others, 2002). An unknown quantity of fuel released over a 60-year period has slowly migrated down from the regolith into the bedrock aquifer. The geol-ogy at this site consists of approximately 25 meters of regolith composed of chert (fused silica), clay, silt, sand, and gravel. Underlying the regolith is 3 to 10 meters of epikarst (weathered bedrock embedded with clay). Below the epikarst is limestone bedrock that has water-filled conduit openings ranging from millimeters to 2 meters thick.
A contaminated well was screened in the inter-val from 38.4 to 41.5 meters below ground surface; the top of bedrock is at 38.7 meters below ground surface. A jet pump equipped with a clean Teflon® hose was lowered to a known conduit based on geo-physical information (Gregg Hileman, U.S. Geolog-ical Survey, oral commun., 2005). A no-purge method (Puls and Paul, 1995) was used to pump water at a low, constant rate of 2.6 liters per minute. Periodic water-level measurements verified no decline in head while pumping occurred, indicating that the water was coming from the aquifer. The water temperature was a steady 14.1° C with a spe-cific conductance of 685 microsiemens per centime-ter (µS/cm), and a pH of 10.5. A total of 378-liters (100 gallons) of contaminated aquifer water was pumped into containers and titrated to a pH of 6.5 with 0.1 molar HCl; then the treated water was returned to the aquifer system. A week following the pH adjustment, a 378-liter volume of aquifer water was pumped again and treated with 4 liters of 33 per-cent H2O2. Sodium chloride (1.25 kg) was also
dCA
dt---------- kCACB=
dCA
dt---------- kCACB k′CA⇒=
C t( ) C04*a*e
1/ 2* 1/Pe( )( )
1 a+( )2*ea/ 2* 1/Pe( )( )
1 a–( )–
a2* 1/Pe( )-----------------------
---------------------------------------------------------------------------------------=
a 1 k′t 1/Pe( )+( )=

177
added for the quantitative tracer analysis. Benzene and toluene concentrations were stable at 6 micrograms per liter (µg/L) and 20 µg/L, respec-tively, prior to adding the HCl, and the H2O2 and NaCl.
Volatile organic compound (VOC) samples were collected from the test well and surrounding wells every few days using passive-diffusion bag (PDB) samplers. The PDB-sampling technique pro-vided a 12-hour integrated sample of the well and did not show the temporal variability of grab sam-ples. The dissolved oxygen and specific conduc-tance were measured using a YSI-600 XLM datasonde that was placed in the well at the level of the conduit opening. Two additional karst wells within 100 yards of the injection well also were equipped with monitoring devices and were sampled for VOCs.
The first-order degradation rates (k') developed from the field data were 0.01357 per hour for tolu-ene and 0.072 per hour for benzene biodegradation. The biodegradation rates were then coupled to the RTD equation that had been modified for a single-well system.
RESULTS AND DISCUSSION
A known amount of NaCl was dissolved in 100 gallons of water and injected as a single pulse, displacing an equal vol-ume of water surrounding the injection well. A correlation between the NaCl concentration and the specific conductance was established. Thus, specific con-ductance data provided a mea-sure of conservative tracer concentration with respect to time. Specific conductance was measured in the injection well and two nearby monitoring wells (fig. 1). The benzene concentra-tion in the injection well is shown in figure 1 to illustrate the rapid decline in benzene as compared to NaCl. Dissolved oxygen levels
went from less than 0.1 milligrams per liter (mg/L) to a supersaturated concentration of 55 mg/L as a result of the H2O2 injection (data not shown). The dissolved oxygen declined slowly over a 6-week period.
A comparison of the RTD-biodegradation model predictions and measured field concentra-tions for toluene and benzene indicated close agree-ment between the two approaches (figs. 2 and 3). The graphs show the percentage of contaminants remaining in the water as calculated by the model and measured in the PDB samplers. The predictions of the RTD-biodegradation model and the measured amount of toluene and benzene removed through biodegradation were within 0.5 µg/L at each sam-pling point.
CONCLUSION
The concept that a karst aquifer is analogous to a non-ideal flow reactor was tested, as well as H2O2-enhanced fuel biodegradation. The results indicate that biodegradation was enhanced and the RTD-bio-degradation model could be used to describe the pro-cess in a single well. This is the first known field application of the RTD-biodegradation model in conjunction with enhanced-fuel bioremediation in a karst aquifer. The numerical approach
Post peroxide injection:specific conductance & benzene concentration
y = -3.2141Ln(x) + 17.751R2 = 0.9566
y = -0.2626Ln(x) + 3.2555R2 = 0.9108
0
0.5
1
1.5
2
2.5
3
3.5
4
0 100 200 300 400 500Time, in hours
Spec
ific
cond
ucta
nce,
in
mic
rosi
emen
s pe
r cen
timet
er
0
2
4
6
8
10
12
14
16
18
20
Ben
zene
con
cent
ratio
n,in
mic
rogr
am ( µ
g) p
er li
ter
MCI-1 test well
MCI-4 reference well
MCI-3 reference well
MCI-1 µg/L benzene
Log. (MCI-1 µg/L benzene)
Log. (MCI-1 test well)
Figure 1. Specific conductance measured as a function of time in three karst bedrock wells. The benzene concentration is shown also with concentrations indicated on the second y-axis.
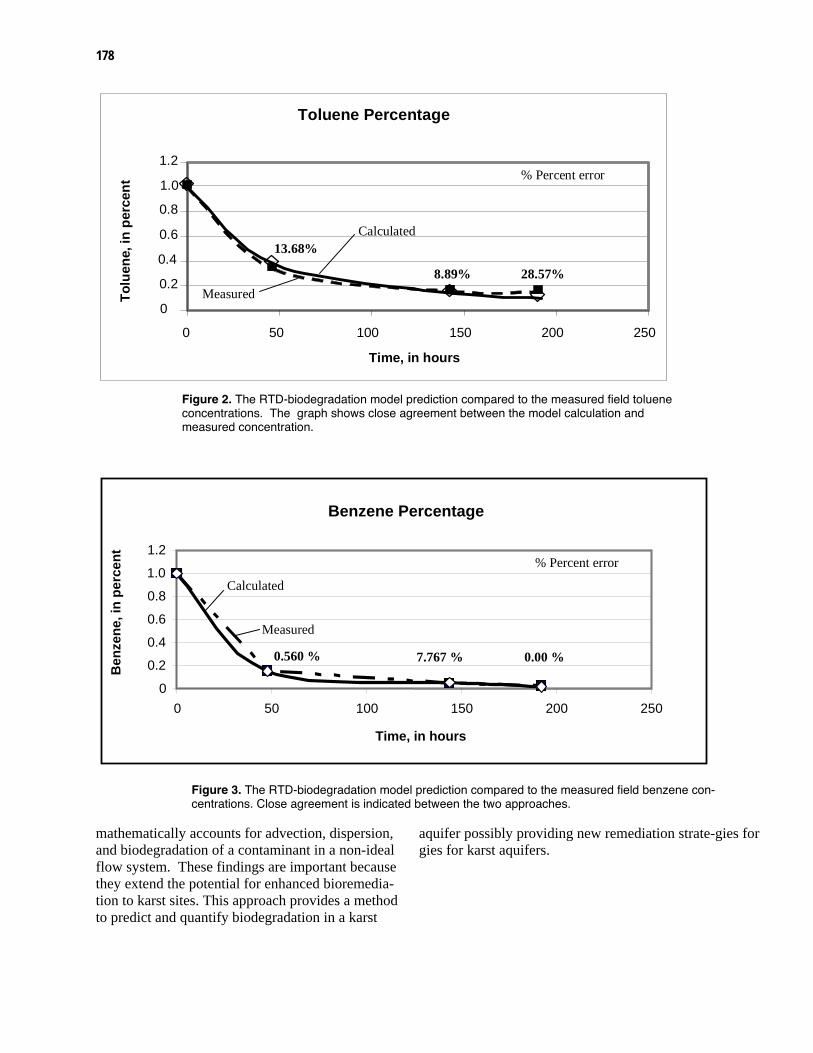
178
s for
13.68%
8.89% 28.57%
Calculated
Measured
% Percent error
Toluene Percentage
0
0.2
0.4
0.6
0.8
1.0
1.2
0 50 100 150 200 250
Time, in hours
Tolu
ene,
in p
erce
nt
Benzene Percentage
0
0.2
0.4
0.6
0.8
1.0
1.2
0 50 100 150 200 250
Time, in hours
Ben
zene
, in
perc
ent
7.767 % 0.00 %
% Percent error
Calculated
Measured
0.560 %
Figure 2. The RTD-biodegradation model prediction compared to the measured field toluene concentrations. The graph shows close agreement between the model calculation and measured concentration.
Figure 3. The RTD-biodegradation model prediction compared to the measured field benzene con-centrations. Close agreement is indicated between the two approaches.
mathematically accounts for advection, dispersion,and biodegradation of a contaminant in a non-ideal flow system. These findings are important because they extend the potential for enhanced bioremedia-tion to karst sites. This approach provides a method to predict and quantify biodegradation in a karst
aquifer possibly providing new remediation strate-giegies for karst aquifers.

179
REFERENCES
Bischoff, K.B., and Levenspiel, Octave, 1962, Fluid dis-persion-generalization and comparison of mathemati-cal models—I. generalization of models: Chemical Engineering Science 17, p. 245-255.
Byl, T.D., Hileman, G.E., Williams, S.D., Metge, D.W., and Harvey, R.W., 2002, Microbial strategies for deg-radation of organic contaminants in karst, in Aiken, G.R., and Kuniansky, E.L. (eds.), U.S. Geological Survey Artificial Recharge Workshop Proceedings, Sacramento, California, April 2-4, 2002: U.S. Geolog-ical Survey Open-File Report 2002-89, p. 61-62, accessed January 27, 2005 at http://water.usgs.gov/ogw/pubs/ofr0289/
Field, M.S., 1993, Karst hydrology and chemical contam-ination. Journal of Environmental Systems v. 22, no. 1, p. 1–26.
Puls, R.W., and Paul, C.J., 1995, Low-flow purging and sampling of ground water monitoring well with dedi-cated systems: Ground Water Monitoring & Remedia-tion v. 1, no. 15, p. 116-123.
White, W.B., 2002, Karst hydrology: recent develop-ments and open questions. Engineering Geology v. 65, p. 85–105.
Wolfe, W.J., Haugh, C.J., Webbers, A., and Deihl, T.H., 1997, Preliminary conceptual models of the occur-rence, fate, and transport of chlorinated solvents in karst aquifers of Tennessee: U.S. Geological Survey Water-Resources Investigations Report 97-4097, 80 p.

180
Free-Living Bacteria or Attached Bacteria: Which Contributes More to Bioremediation?
Roger D. Painter1, Shawkat Kochary1, and Tom D. Byl2,11Civil and Environmental Engineering, Tennessee State University, Nashville, TN 372092U.S. Geological Survey, 640 Grassmere Park, Suite 100, Nashville, TN 37211
ABSTRACT
Researchers have implied that natural bioremediation in karst or fractured rock is unlikely to occur because of the lack of bacteria biofilm in karst aquifers. Hydrologic and geologic characteristics of fractured rock aquifers have been described as not being suited for natural bioremediation because of small microbial populations. If bioremediation in bedrock aquifers is dependent upon contact between surface-attached bac-teria and contaminants, then bioremediation would be limited by the low surface area to volume ratio (SA/V) of karst aquifers. A quantitative basis, however, for accepting or rejecting the assumption that attached bacteria dominate the biodegradation process in karst conduits has not been shown. The objective of this research was to determine if free-living karst bacteria contributed as much to toluene biodegradation as attached bacteria. Two flow-through reactor systems were established to test the different biodegradation rates. Each reactor system consisted of four 1.24-liter cylinders connected together with glass tubing for a total open volume of approximately 5 liters. The second reactor system was similar to the open system except the cylinders were filled with acid-washed, circular glass spheres that increased surface area to vol-ume ratio approximately fivefold compared to the open system. Rhodamine dye was used to calculate the different residence-time distributions in each system. A sterile control study established that less than 3 per-cent of the toluene was lost to abiotic processes. Next, raw water from a karst aquifer containing live, indig-enous bacteria was pumped through each system for 5 days to establish a biofilm on the glass surfaces. Colonization of the surface was confirmed by microscope visualization before toluene was added to the sys-tems. The resulting first-order rate constants were computed to be 0.014 per hour for the open system and 0.0155 per hour for the packed reactor system. If surface-attached bacteria were the main contributors to the biodegradation process and the SA/V ratio was increased fivefold, a significantly higher biodegradation rate should have occurred in the packed reactor. The results of this study indicate that the free-living bacteria indigenous to a karst aquifer contribute as much to the toluene biodegradation process as attached bacteria.
INTRODUCTION
The lack of studies examining biodegradation in karst aquifers may be due to the widespread per-ception that contaminants are rapidly flushed out of karst aquifers. In highly developed and well-connected conduit systems, the rate of contaminant migration is expected to be much faster than the rate of biodegradation. Field (1993) states that remedia-tion techniques such as ground-water extraction or bioremediation are impractical in karst aquifers dominated by conduit flow; however, he also states that the belief that contaminants are rapidly flushed out of karst aquifers is a popular misconception. Large volumes of water may be trapped in fractures
along bedding planes and other features isolated from active ground-water flow paths in karst aqui-fers (Wolfe and others, 1997). In areas isolated from the major conduit flow paths, contaminant migration may be slow enough that biodegradation could reduce contaminant mass if favorable microorgan-isms, food sources, and geochemical conditions are present.
Researchers have implied that natural biore-mediation in karst or fractured rock is unlikely to occur because of the microbiological characteristics of karst aquifers; small microbial populations and low surface area to volume (SA/V) ratio (Vogel, 1994). Typical microbial numbers for material from
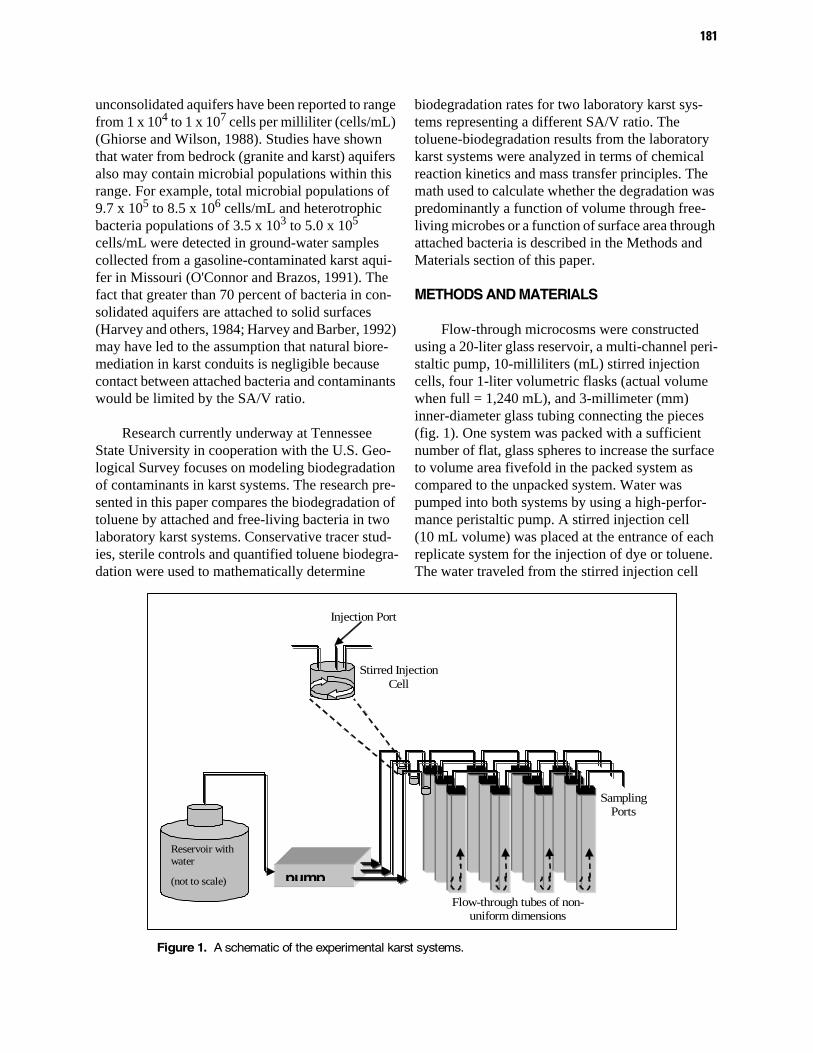
181
unconsolidated aquifers have been reported to range from 1 x 10⁴ to 1 x 10⁷ cells per milliliter (cells/mL) (Ghiorse and Wilson, 1988). Studies have shown that water from bedrock (granite and karst) aquifers also may contain microbial populations within this range. For example, total microbial populations of 9.7 x 10⁵ to 8.5 x 10⁶ cells/mL and heterotrophic bacteria populations of 3.5 x 10³ to 5.0 x 10⁵ cells/mL were detected in ground-water samples collected from a gasoline-contaminated karst aqui-fer in Missouri (O'Connor and Brazos, 1991). The fact that greater than 70 percent of bacteria in con-solidated aquifers are attached to solid surfaces (Harvey and others, 1984; Harvey and Barber, 1992) may have led to the assumption that natural biore-mediation in karst conduits is negligible because contact between attached bacteria and contaminants would be limited by the SA/V ratio.
Research currently underway at Tennessee State University in cooperation with the U.S. Geo-logical Survey focuses on modeling biodegradation of contaminants in karst systems. The research pre-sented in this paper compares the biodegradation of toluene by attached and free-living bacteria in two laboratory karst systems. Conservative tracer stud-ies, sterile controls and quantified toluene biodegra-dation were used to mathematically determine
biodegradation rates for two laboratory karst sys-tems representing a different SA/V ratio. The toluene-biodegradation results from the laboratory karst systems were analyzed in terms of chemical reaction kinetics and mass transfer principles. The math used to calculate whether the degradation was predominantly a function of volume through free-living microbes or a function of surface area through attached bacteria is described in the Methods and Materials section of this paper.
METHODS AND MATERIALS
Flow-through microcosms were constructed using a 20-liter glass reservoir, a multi-channel peri-staltic pump, 10-milliliters (mL) stirred injection cells, four 1-liter volumetric flasks (actual volume when full = 1,240 mL), and 3-millimeter (mm) inner-diameter glass tubing connecting the pieces (fig. 1). One system was packed with a sufficient number of flat, glass spheres to increase the surface to volume area fivefold in the packed system as compared to the unpacked system. Water was pumped into both systems by using a high-perfor-mance peristaltic pump. A stirred injection cell (10 mL volume) was placed at the entrance of each replicate system for the injection of dye or toluene. The water traveled from the stirred injection cell
Flow-through tubes of non-uniform dimensions
Sampling Ports
Stirred Injection Cell
Injection Port
Reservoir with water
(not to scale) pump
Figure 1. A schematic of the experimental karst systems.

182
through a thin glass tube to the bottom of graduated cylinders arranged in series. The water and injected constituents traveled through a series of nonuni-form-size cylindrical glass tubes ranging from 3- to 56-mm in diameter. The non-uniform dimensions in the systems contributed to non-ideal flow conditions such as eddies and currents.
During the conservative dye tracer study, a con-stant flow rate of approximately 3 milliliters per minute (mL/min) was established for both systems. The pump was stopped at the beginning of the tracer study, 476 micrograms (µg) of Rhodamine dye was injected into each stirred injection cell, and the pump was restarted. The Rhodamine concentration at the discharge port was monitored through time by col-lecting samples at 1- to 2-hour time intervals over a 4-day period. A Turner 700® fluorometer was used to quantify the Rhodamine in the water samples. The lower detection limit on the fluorometer was estab-lished at 100 parts per trillion.
Before the toluene biodegradation study was initiated, the experimental systems were sterilized with bleach. The bleach was neutralized with sterile sodium thiosulfate. Filter-sterilized toluene (87 µg) dissolved in 100 microliters (µL) of methanol was delivered into the injection cell and pushed through the system with sterile water that had a pH of 10. Previous work indicated that elevating the pH to 10 to maintain an abiotic system.
Toluene concentration was monitored at the discharge port over the next 5 days. Water samples were collected in clean 40-mL volatile organic com-pound (VOC) vials every 1 to 4 hours. The water samples were immediately analyzed on a Syntex® gas chromatograph (GC) equipped with a purge-and-trap system, 30 meter (m) X 0.32 mm, 1.8-micrometer (µm) silica-film capillary column, argon-carrying gas, and micro-argon ionization detector. The lower detection limit for toluene on the GC was 0.5 microgram per liter (µg/L). Every fourth sample was either a duplicate sample or a standard of known toluene quantity, and a complete calibra-tion curve was run every 6-12 hours.
The biodegradation experiments used water containing live bacteria collected from a 120-foot-
deep well completed in a karst aquifer in south-cen-tral Kentucky. An 87-µg aliquot of toluene was dis-solved in 100 µL of methanol and placed in the stirred injection chamber at time zero. The flow rate used in all experiments was kept constant at approx-imately 3.0 mL/min. Data results from the tracer tests and the biodegradation studies were entered into a computer spreadsheet and all calculations regarding residence-time distribution (RTD) and biodegradation rates were documented in the spreadsheets.
Experimental runs consisted of running the packed system and an unpacked system in parallel under similar conditions. In order to document the presence of attached bacteria, glass slides were sus-pended in both the packed and unpacked systems. The suspended slides were removed prior to and at the end of the experiments and viewed using an epi-fluorescent microscope and the direct-count method (Eaton and others, 1995).
Toluene was selected as the experimental con-taminant because it is a component in most fuels and because previous work indicated Pseudomonad bac-teria, which are heterotrophic aerobic bacteria (HAB), from the Kentucky site could grow using toluene as a food source (Byl and others, 2001; Byl and others, 2002). The concentration of HAB in the water was determined by using the most probable number (MPN) method (Eaton and others, 1995). The MPN bacteria concentrations in the abiotic sys-tems were less than one colony-forming unit per 100 millimeter. The bacteria concentration in ground water from the karst aquifer ranged from 600,000 to 700,000 HAB/mL at the beginning and end of the experiment.
DESCRIPTION OF THE MATHEMATICS USED TO CALCULATE BIODEGRADATION RATES
The fate of biodegradable contaminants in a karst aquifer system is dependant upon the rate of their biodegradation and the amount of time they spend in the system with the bacteria (referred to as residence-time distribution or RTD). As a result, the difference in amount of toluene that is biodegraded in each of the systems is not sufficient to numeri-cally predict the fate of contaminants in a karst

183
aquifer. The biodegradation-rate equation must be coupled to the RTD formula since the removal of the contaminant is a function of RTD and biodegrada-tion reaction rate. Once the equation is established, it can be re-arranged to solve for the biodegradation rate using the experimental data. Following is a description of how the biodegradation rate and RTD equation were coupled.
For a sparingly soluble contaminant (A) reacting with a rate-limiting constituent (B), which may be the microbes themselves or different elec-tron acceptors, the reaction may be second order (symbols are defined in Appendix):
In a situation where the microbes are acclimated and at steady state and electron acceptors are not limiting the concentration, the reaction, CB may not change appreciably while CA changes. Treating CB like a constant, the equation can be rewritten as a first-order equation:
where k' = kCB is the pseudo first-order rate con-stant. Oxygen and microbes were assumed to be not limiting in this laboratory system because the initial water was saturated, allowing use of the pseudo first-order equation.
In this context, the relative contributions of sur-face and volumetric biodegradation to the observed biodegradation rate can be determined by experi-ments with varying SA/V. If free-living bacteria dominate, the biodegradation reaction is volumetric and the observed pseudo first-order rate constants for the packed and unpacked reactors will be of sim-ilar magnitude. If, on the other hand, attached bacte-ria dominate, then the reaction is surface controlled and the observed pseudo first-order rate constants will not be of similar magnitude. If attached bacteria dominate the biodegradation reaction, the rate con-stant will be directly proportional to SA/V ratio.
The non-ideal hydraulic and mass transfer char-acteristics for systems with different SA/V ratios would lead to different lengths of residence time in
each system. The dissimilar residence times in the packed and unpacked systems used in this study can be offset by using the RTD formula (Bischoff, and Levenspiel, 1962). The RTD of solutes in each sys-tem was determined using a conservative dye study to compensate for the shorter residence time in the system with less volume (that is, packed with glass spheres). The residence time (τ) is related to the mean residence time obtained from the RTD as:
.
The Peclet number (Pe) is obtained from the vari-ance of the RTD according to:
.
The Peclet numbers and the amount of toluene biodegraded (Xm) obtained from the biotic experi-ments in the packed and unpacked systems were used to obtain the rate of biodegradation by re-arranging the following:
where:
The Damkohler number (DA) incorporates the bio-degradation reaction rate (k') and time. The equa-tion can be rearranged and solved for k'.
RESULTS AND DISCUSSION
The RTD for each system was calculated from the conservative dye study. The data were numeri-cally integrated to determine the mean residence time (tm) and the variance (σ2) for the packed and unpacked laboratory karst systems. These parame-ters where then used to calculate the Peclet numbers, which are an indicator of the dispersion as the solute moves through the system. The results of the conser-vative dye study are shown in figure 2. After the dye study, the reactor systems were sterilized and tolu-ene was injected to measure the amount of removal by abiotic processes. A mass balance was done on the toluene injected and recovered from the sterile
dCA
dt---------- kCACB=
dCA
dt---------- kCACB k′CA⇒=
tm 1 2Pe-----+⎝ ⎠
⎛ ⎞ τ=
σ2
Pe 2------- 2
Pe----- 8
Pe 2-------+=
Xm 1 4qePe 2⁄( )
1 q+( )2ePeq 2⁄( )
1 q–( )2– ePeq 2⁄–( )
------------------------------------------------------------------------------–=
q 1 4DA Pe⁄+=

184
systems. Approximately 3 percent of the injected toluene was lost to abiotic processes in each of the experimental systems during the sterile run.
In the third phase of the study, water containing live bacteria was pumped through the laboratory systems for 4 days to establish a biofilm on the glass surfaces. Bacteria counts using MPN and micro-scopic methods were used to confirm that bacteria covered the glass surfaces and were suspended in the water at the beginning and end of the experiments (photos 1 and 2). A solution containing 87.0 µg of toluene was injected into each system. Numerical integration of the resulting effluent toluene concen-tration and time (fig. 3) indicated recovery of 61 µg toluene from the unpacked reactor and 69 µg toluene from the packed reactor. The resulting observed tol-uene biodegradation value (Xm) for the packed and unpacked systems was 0.21 and 0.31, respectively.
These Xm values where used in the equation listed above to calculate the observed reaction rate constants (k'observed). The values of k'observed were 0.014 per hour and 0.0155 per hour for the packed and unpacked systems, respectively. The above results for conversion and rate constants for the packed and unpacked systems seem counter-intui-tive at first glance; that is, the packed system has lower conversion and higher reaction rate of the two systems. This occurs because of the complex rela-tion between hydraulic and chemical reaction kinet-ics in a non-ideal flow system. When the residence time is taken into consideration in each system, however, the rate of biodegradation for the free-liv-ing bacteria alone, or volumetric rate, k'volumetric = 0.0135 per hour for both systems.
Dye Study Results
0
100
200
300
400
500
600
700
800
900
0 10 20 30 40 50 60 70 80
Time, in hours
Rho
dam
ine,
in p
arts
per
mill
ion
Figure 2. Rhodamine concentration at the end sampling port as a function of time for the high-surface area (packed) system and low-surface area (unpacked) system and the mean residence time (tm), variability (σ2) and Peclet value (Pe) for each system.
Unpackedtm = 27.4 hr
σ2 = 142.3Pe = 15.8
Packedtm = 15.3 hr
σ2 = 36.6Pe = 13.7
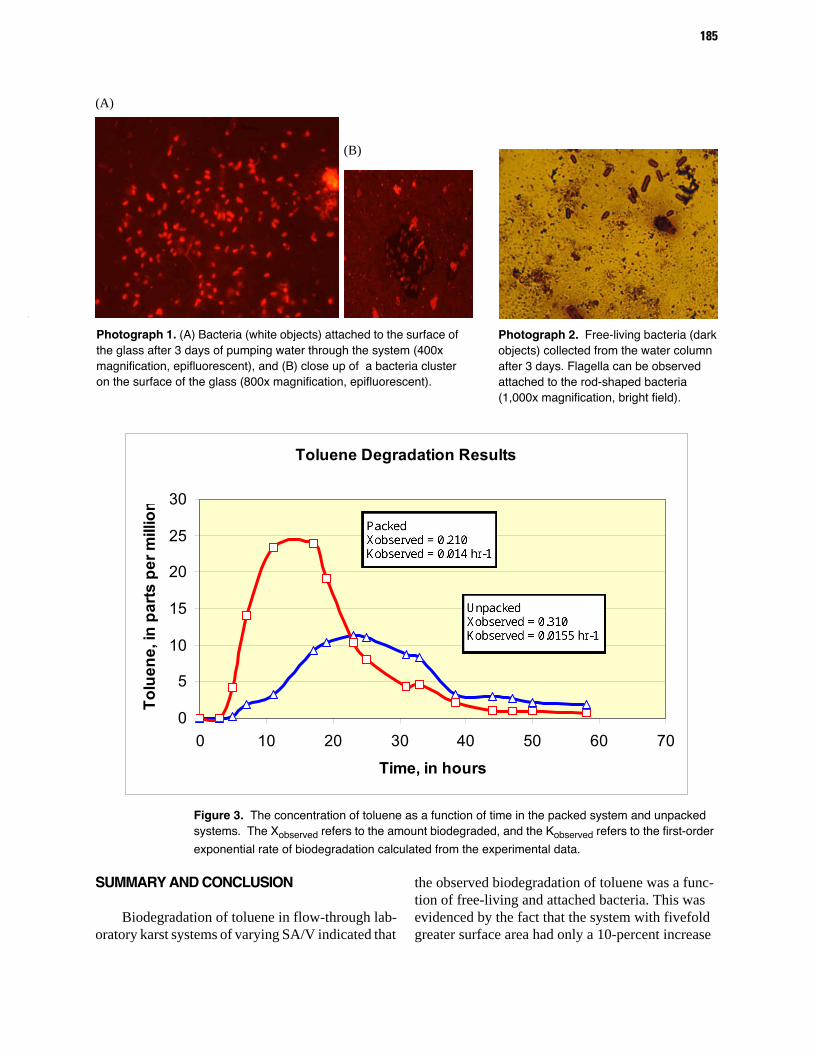
185
SUMMARY AND CONCLUSION
Biodegradation of toluene in flow-through lab-oratory karst systems of varying SA/V indicated that
the observed biodegradation of toluene was a func-tion of free-living and attached bacteria. This was evidenced by the fact that the system with fivefold greater surface area had only a 10-percent increase
(B)
(A)
Photograph 2. Free-living bacteria (dark objects) collected from the water column after 3 days. Flagella can be observed attached to the rod-shaped bacteria (1,000x magnification, bright field).
Photograph 1. (A) Bacteria (white objects) attached to the surface of the glass after 3 days of pumping water through the system (400x magnification, epifluorescent), and (B) close up of a bacteria cluster on the surface of the glass (800x magnification, epifluorescent).
Figure 3. The concentration of toluene as a function of time in the packed system and unpacked systems. The Xobserved refers to the amount biodegraded, and the Kobserved refers to the first-order
exponential rate of biodegradation calculated from the experimental data.
Toluene Degradation Results
0
5
10
15
20
25
30
0 10 20 30 40 50 60 70
Time, in hours
Tolu
ene,
in p
arts
per
mill
ion
egbaker
Text Box
Packed Xobserved = 0.210 Kobserved = 0.014 hr-1
egbaker
Text Box
Unpacked Xobserved = 0.310 Kobserved = 0.0155 hr-1
egbaker
Line
egbaker
Line
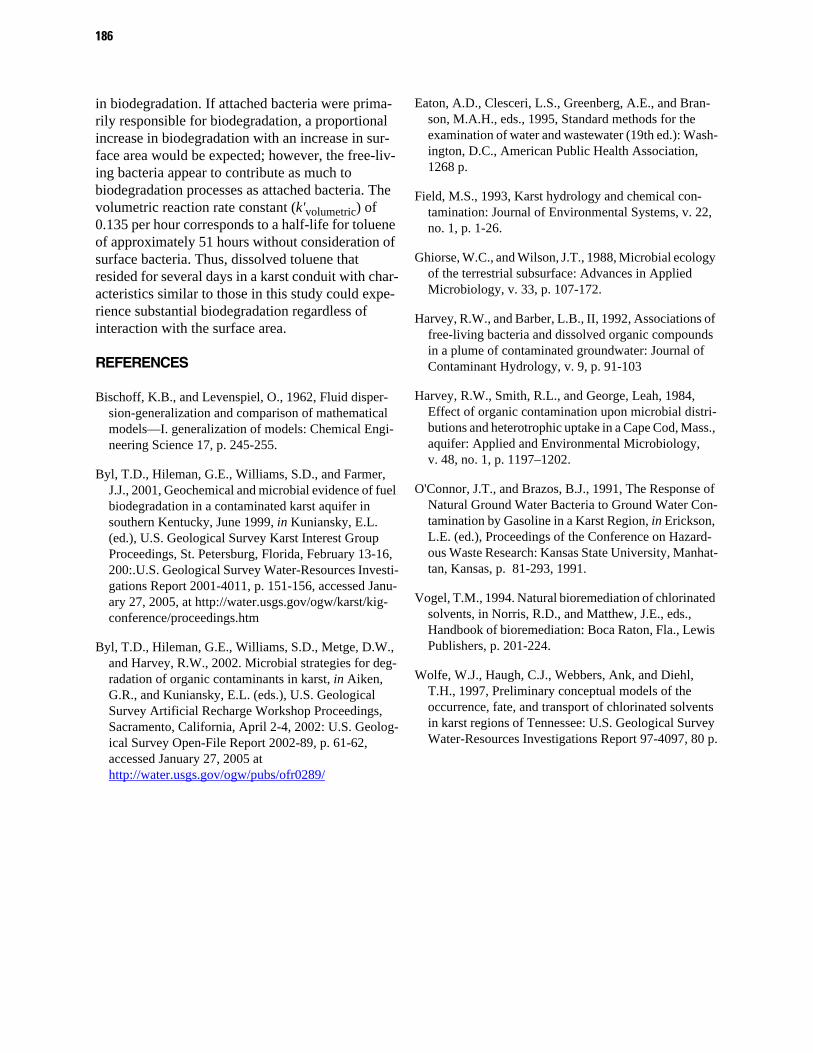
186
in biodegradation. If attached bacteria were prima-rily responsible for biodegradation, a proportional increase in biodegradation with an increase in sur-face area would be expected; however, the free-liv-ing bacteria appear to contribute as much to biodegradation processes as attached bacteria. The volumetric reaction rate constant (k'volumetric) of 0.135 per hour corresponds to a half-life for toluene of approximately 51 hours without consideration of surface bacteria. Thus, dissolved toluene that resided for several days in a karst conduit with char-acteristics similar to those in this study could expe-rience substantial biodegradation regardless of interaction with the surface area.
REFERENCES
Bischoff, K.B., and Levenspiel, O., 1962, Fluid disper-sion-generalization and comparison of mathematical models—I. generalization of models: Chemical Engi-neering Science 17, p. 245-255.
Byl, T.D., Hileman, G.E., Williams, S.D., and Farmer, J.J., 2001, Geochemical and microbial evidence of fuel biodegradation in a contaminated karst aquifer in southern Kentucky, June 1999, in Kuniansky, E.L. (ed.), U.S. Geological Survey Karst Interest Group Proceedings, St. Petersburg, Florida, February 13-16, 200:.U.S. Geological Survey Water-Resources Investi-gations Report 2001-4011, p. 151-156, accessed Janu-ary 27, 2005, at http://water.usgs.gov/ogw/karst/kig-conference/proceedings.htm
Byl, T.D., Hileman, G.E., Williams, S.D., Metge, D.W., and Harvey, R.W., 2002. Microbial strategies for deg-radation of organic contaminants in karst, in Aiken, G.R., and Kuniansky, E.L. (eds.), U.S. Geological Survey Artificial Recharge Workshop Proceedings, Sacramento, California, April 2-4, 2002: U.S. Geolog-ical Survey Open-File Report 2002-89, p. 61-62, accessed January 27, 2005 athttp://water.usgs.gov/ogw/pubs/ofr0289/
Eaton, A.D., Clesceri, L.S., Greenberg, A.E., and Bran-son, M.A.H., eds., 1995, Standard methods for the examination of water and wastewater (19th ed.): Wash-ington, D.C., American Public Health Association, 1268 p.
Field, M.S., 1993, Karst hydrology and chemical con-tamination: Journal of Environmental Systems, v. 22, no. 1, p. 1-26.
Ghiorse, W.C., and Wilson, J.T., 1988, Microbial ecology of the terrestrial subsurface: Advances in Applied Microbiology, v. 33, p. 107-172.
Harvey, R.W., and Barber, L.B., II, 1992, Associations of free-living bacteria and dissolved organic compounds in a plume of contaminated groundwater: Journal of Contaminant Hydrology, v. 9, p. 91-103
Harvey, R.W., Smith, R.L., and George, Leah, 1984, Effect of organic contamination upon microbial distri-butions and heterotrophic uptake in a Cape Cod, Mass., aquifer: Applied and Environmental Microbiology, v. 48, no. 1, p. 1197–1202.
O'Connor, J.T., and Brazos, B.J., 1991, The Response of Natural Ground Water Bacteria to Ground Water Con-tamination by Gasoline in a Karst Region, in Erickson, L.E. (ed.), Proceedings of the Conference on Hazard-ous Waste Research: Kansas State University, Manhat-tan, Kansas, p. 81-293, 1991.
Vogel, T.M., 1994. Natural bioremediation of chlorinated solvents, in Norris, R.D., and Matthew, J.E., eds., Handbook of bioremediation: Boca Raton, Fla., Lewis Publishers, p. 201-224.
Wolfe, W.J., Haugh, C.J., Webbers, Ank, and Diehl, T.H., 1997, Preliminary conceptual models of the occurrence, fate, and transport of chlorinated solvents in karst regions of Tennessee: U.S. Geological Survey Water-Resources Investigations Report 97-4097, 80 p.

187
Appendix. Symbol notation and unit of measure
C solute concentration, moles per liter [M/L]
CA initial contaminant concentration [M/L]
CB bacteria-electron-acceptor concentration [M/L]
C(t) concentration of tracer as a function of time [M/L]
DA Damkohler Number
k' pseudo first-order rate constant [T-1]
Pe Peclet Number [VL/D]
τ space time [T]
t time [T]
tm mean residence time [T]
X(m) observed or calculated value of chemical biodegraded [M/L]
σ2 variance [T2]
188
Desorption Isotherms for Toluene and Karstic Materials and Implications for Transport in Karst Aquifers
Mario Beddingfield1, Khalid Ahmed1, Roger Painter1, and Tom D. Byl2, 11Dept. of Civil and Environmental Engineering, Tennessee State University, Nashville, TN 2U.S. Geological Survey, Nashville, TN
ABSTRACT
Karst aquifers dominated by conduit flow are extremely vulnerable to fuel contamination such as from leaky underground storage tanks or spills. Direct flow paths through fractures and sinkholes often allow contaminants to move rapidly into the conduit system. Not much is known about how the fuel will interact with the carbonate rock in the conduit system. The objective of this research was to bridge this information gap by measuring sorption and desorption of fuels to karst materials. The first phase of this study involved the dissolution and desorption processes. Initial experiments (n=5) used karst bedrock fragments of known size soaked in toluene for 24 hours. Then the sterile toluene-soaked rocks were placed in sterile distilled water. The concentration of toluene dissolved in the water was measured over increasing time periods. These data were used to derive a first-order exponential rate of desorption [Cw(t)=Ciekt]. The empirical value for k was 0.8958. The toluene concentration in the water reached a maximum carrying capacity in approximately 3 weeks. The second phase of this project involved sorption studies using limestone frag-ments of known size and water containing a known concentration of dissolved toluene. The empirical value for the sorption k was 1.006. These results show that sorption is faster than desorption and have implications for designing a model that predicts the fate and transport of fuels in karst aquifers.
This work was supported in part by the U.S. Army Corps of Engineers DACW62-00-H-0001 contract.

189
A Computer Program that Uses Residence-Time Distribution and First-Order Biodegradation to Predict BTEX Fate in Karst Aquifers
Ryan Fitzwater1, Roger Painter1, Valetta Watson1, and Tom D. Byl2, 11Dept of Civil and Environmental Engineering, Tennessee State University Nashville, TN; 2U. S. Geological Survey, Nashville, TN 37211
ABSTRACT
Approximately 40 percent of the United States east of the Mississippi River is underlain by karst aqui-fers. Karst ground-water systems are extremely vulnerable to contamination; however, the fate and transport of contaminants in karst areas are poorly understood because of the complex hydraulic characteristics of karst aquifers. Ground-water models developed using Darcy’s Law coupled to rates of biodegradation are useful for predicting the fate of fuels in unconsolidated aquifers, but have little utility in karst conduits. Con-ceptual models developed for karst aquifers have a consistent theme of non-ideal flow, storage, and active flow components. This research used a residence-time distribution (RTD) model approach that integrated residence times of contaminants isolated in storage areas with the residence time of contaminants moving through conduits coupled to a pseudo-first order rate of biodegradation. The microcosms consisted of four 1-liter chambers connected with small glass tubing. A peristaltic pump provided a consistent flow of karst water from a 10-gallon reservoir. First, a quantitative dye study was done to establish the residence-time distribution of the three systems. This was followed by a sterile toluene run to measure sorption of toluene to the microcosm systems. The third microcosm run incorporated karst bacteria and toluene. The removal of toluene predicted by the RTD-biodegradation model and the experiment were within 2 percent agreement (n=3). The RTD-biodegradation model was transformed into a user-friendly program that utilizes MS Excel® with Visual Basic interfaces. The input sheet of this prototype program requires site information, a biodegradation rate, and the results of a quantitative tracer study. The results, or output pages, provide res-idence-time distribution graphs and various statistical calculations. The output pages also report the calcu-lated amount of BTEX removed during transport through the karst aquifer based on RTD and biodegradation. Additional work is needed to incorporate dilution into the model.
This work was supported in part by the U.S. Army Corps of Engineers DACW62-00-H-0001 contract.

190
Lactate Induction of Ammonia-Oxidizing Bacteria and PCE Cometabolism
LyTreese Hampton P.D. Hays1, Roneisha Graham1, and Tom D. Byl2, 11 Dept. of Civil and Environmental Engineering, Tennessee State University, Nashville, TN2 U.S. Geological Survey, Nashville, TN
ABSTRACT
Water containing bacteria was collected from a PCE-contaminated karst aquifer in north-central Ten-nessee to establish liquid, 1-liter microcosms. The microcosms were spiked with known concentrations of perchloroethylene (PCE) and 11 different formulations of lactic acid. The ammonia-lactate formulation caused a rapid removal of PCE and oxygen (O2). Similar results that were achieved by using a second set of microcosms spiked with ammonia-lactate to re-test the removal rate of PCE and O2 indicated a possible cometabolic PCE-removal process. Although only one report of PCE-cometabolism was found in the liter-ature, ammonia-oxidizing bacteria indigenous to the karst aquifer were hypothesized to be capable of come-tabolizing PCE with the ammonia mono-oxygenase (AMO) pathway. To test this hypothesis, microcosms were established using different forms of ammonia (ammonia-lactate, ammonia-chloride, ammonium plus sodium lactate), reference controls (sterile, live without food, sodium lactate, sterile + ammonia lactate), and ammonia mono-oxygenase inhibitors [2-chloro-6-(trichloromethyl) pyridine, azide, and allylthiourea]. Microcosms treated with ammonia-lactate had the most rapid reduction of PCE and O2, followed by the ammonium + sodium-lactate treatment. The other live microcosms treated with ammonia also experienced significant drops in PCE and O2 after 24 hours. The control (sterile and live without food) microcosms did not experience a significant drop in PCE in the same time period. After 24 hours, the rapid PCE removal in all the ammonia-treated microcosms decreased due to the consumption of the oxygen. Tests with the AMO inhibitor in the presence of ammonia-lactate did not prevent the PCE removal or O2 consumption. Lactate may stimulate AMO or protect the enzyme from inhibition. Additional tests need to be conducted to prove that AMO is responsible for the removal of PCE. These preliminary results provide strong evidence that karst bacteria indigenous to this aquifer can cometabolize PCE.

191
Biodegradation of Toluene as It Continuously Enters a 5-Liter Laboratory Karst System
Fuzail Faridi1, Roger Painter1, and Tom Byl2,11Dept. of Civil and Environmental Engineering, Tennessee State University, Nashville, TN 2U.S. Geological Survey, Nashville, TN
ABSTRACT
Contamination releases can occur as slow, long-term spills rather than as instantaneous spills. These continuous releases can result in a steady state of contaminants that can last months to years. Predicting the fate and transport of these contaminants in a karst aquifer is especially challenging because of the complex hydrogeology and uncertainties in residence time. The objective of this research was to adapt the residence-time distribution (RTD) biodegradation model, which was developed to predict the biotransformation of a single spill in a karst aquifer, for a continuous input of contaminants. Theoretically, the RTD for a karst system calculated from either a pulse- or a continuous-input tracer study would be identical, but mathemat-ical manipulation of the data for the two approaches is quite different. Determination of the RTD from a continuous input requires numerical differentiation of tracer response data as opposed to numerical integra-tion for the pulse approach. Three experimental runs were conducted involving the application of a contin-uous input: (1) rhodamine dye alone to establish RTDs for the systems, (2) sterile toluene (25 micrograms per liter) to quantify abiotic sorption, and (3) toluene with karst bacteria to quantify biodegradation. The three replicate karst systems were each 5 liters and had a continuous flow rate of 3.3 milliliters per minute. The difference between the RTD-based model prediction and the experimental toluene conversions was 17 percent. The continuous-input approach (numerical differentiation) had the tendency to magnify experi-mental and random errors in the tracer response data as compared to the pulse-input method (numerical inte-gration).
This work was supported in part by the U.S. Army Corps of Engineers DACW62-00-H-0001 contract.

192
Bacteria Induced Dissolution of Limestone in Fuel-Contaminated Karst Wells
Serge Mondesir1, and Tom D. Byl 2,11Dept. of Civil & Environmental Engineering, Tennessee State University, Nashville, TN 372092U.S. Geological Survey, Nashville, TN 37211
ABSTRACT
Karst landscapes are formed in water-soluble geologic formations, such as limestone, in which disso-lution processes have enlarged water-transmitting openings. Approximately 20 percent of the United States is underlain by carbonate rocks and is classified as karst, and 40 percent of the United States east of the Mis-sissippi River is underlain by karst aquifers. Karst ground-water systems are extremely vulnerable to con-tamination. Many organic contaminants such as fuels can stimulate bacteria biodegradation and the production of carbon dioxide (CO2). The increased respiration by bacteria in contaminated karsts aquifers can lead to a significant increase in CO2 production and formation of carbonic acid.
A quantitative study was conducted to determine the effect of elevated concentrations of carbonic acid due to bacteria action on limestone dissolution. Sealed flasks were set up that contained 250 milliliters of distilled water, limestone fragments of known size and weight, and varying concentrations of CO2. The flasks with elevated CO2 concentration had a 3-fold increase in the rate of calcium carbonate dissolution. Water with elevated CO2 concentrations had a slightly lower pH than water with the lower CO2 concentra-tions, but the difference in pH was not statistically significant at the 0.05 confidence level. Further tests were done to determine if these lab results applied to field conditions. Water samples were collected from wells completed in karst aquifers. The CO2 concentrations in water samples collected from fuel-contami-nated wells were higher than in samples collected from wells with no fuel contamination. Also, the dis-solved calcium was usually two or three times greater in the fuel-contaminated wells. The results have implications for redesigning geochemical models that predict conduit enlargement when fuel contaminants are present in karst aquifers.
This work was supported in part by the U.S. Army Corps of Engineers DACW62-00-H-0001 contract.