Quantification of emissions from methane sources in Indianapolis using … · Quantification of...
22
Quantification of emissions from methane sources in Indianapolis using an aircraft-based platform Maria Obiminda Cambaliza 1 , Paul Shepson 1 , Brian Stirm 1 , Colm Sweeney 2,3 , Jocelyn Turnbull 2,3 , Anna Karion 2 , Ken Davis 4 , Thomas Lauvaux 4 , Scott Richardson 4 , Natasha Miles 4 , Kevin Gurney 5 , Dana Caulton 1 , Kelly Mays 1 , Rachel Svetanoff 1 , James R. Whetstone 6 , Antonio Possolo 6 , Daniel Samarov 6 , Eric Crosson 7 1 Purdue University, 2 NOAA Earth System Research Laboratory, 3 CIRES, University of Colorado, 4 The Pennsylvania State University, 5 Arizona State University, 6 National Institute of Standards and Technology, 7 Picarro, Inc.
Transcript of Quantification of emissions from methane sources in Indianapolis using … · Quantification of...
Quantification of emissions from methane sources in Indianapolis using
an aircraft-based platform
Maria Obiminda Cambaliza1, Paul Shepson1, Brian Stirm1, Colm Sweeney2,3, Jocelyn Turnbull2,3, Anna Karion2, Ken Davis4, Thomas Lauvaux4, Scott Richardson4,
Natasha Miles4, Kevin Gurney5, Dana Caulton1, Kelly Mays1, Rachel Svetanoff1,
James R. Whetstone6, Antonio Possolo6, Daniel Samarov6, Eric Crosson7
1Purdue University, 2NOAA Earth System Research Laboratory, 3CIRES, University of Colorado, 4The Pennsylvania State University, 5Arizona State University, 6National Institute of Standards and Technology, 7Picarro, Inc.
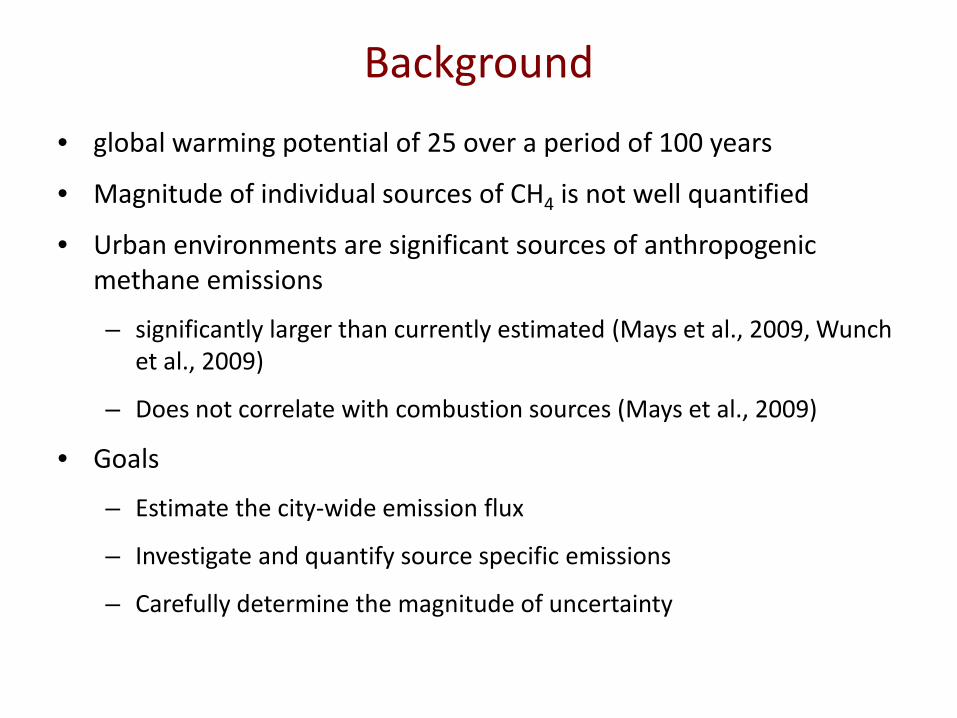
Background
• global warming potential of 25 over a period of 100 years
• Magnitude of individual sources of CH4 is not well quantified
• Urban environments are significant sources of anthropogenic methane emissions
– significantly larger than currently estimated (Mays et al., 2009, Wunch et al., 2009)
– Does not correlate with combustion sources (Mays et al., 2009)
• Goals
– Estimate the city-wide emission flux
– Investigate and quantify source specific emissions
– Carefully determine the magnitude of uncertainty
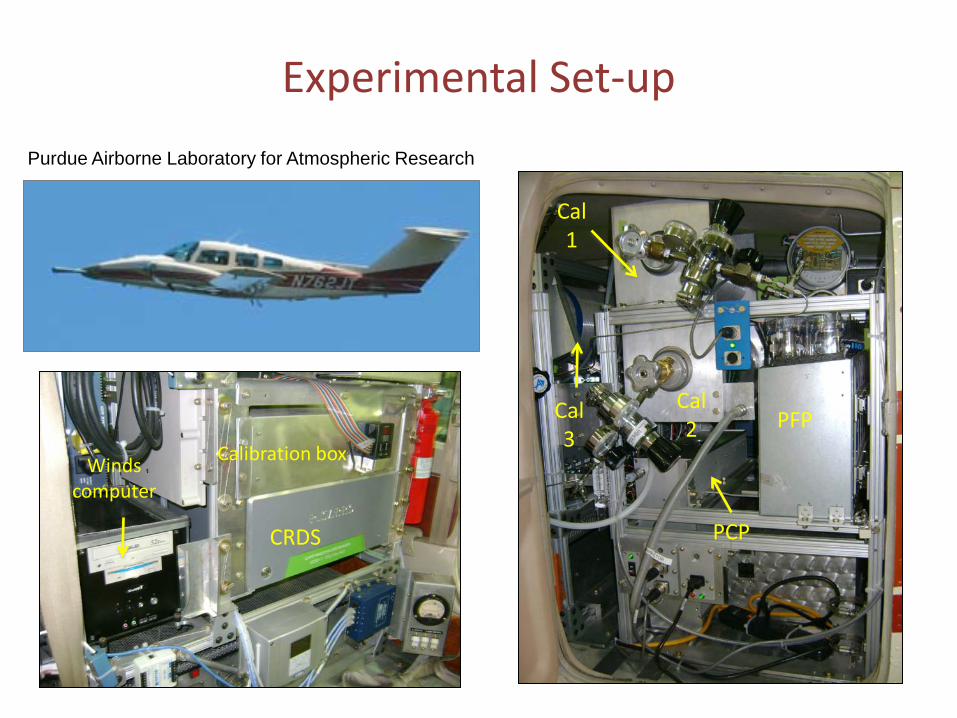
Experimental Set-up
PFP
Cal 1
Cal 2
Cal 3
PCPCRDS
Calibration boxWinds computer
Purdue Airborne Laboratory for Atmospheric Research
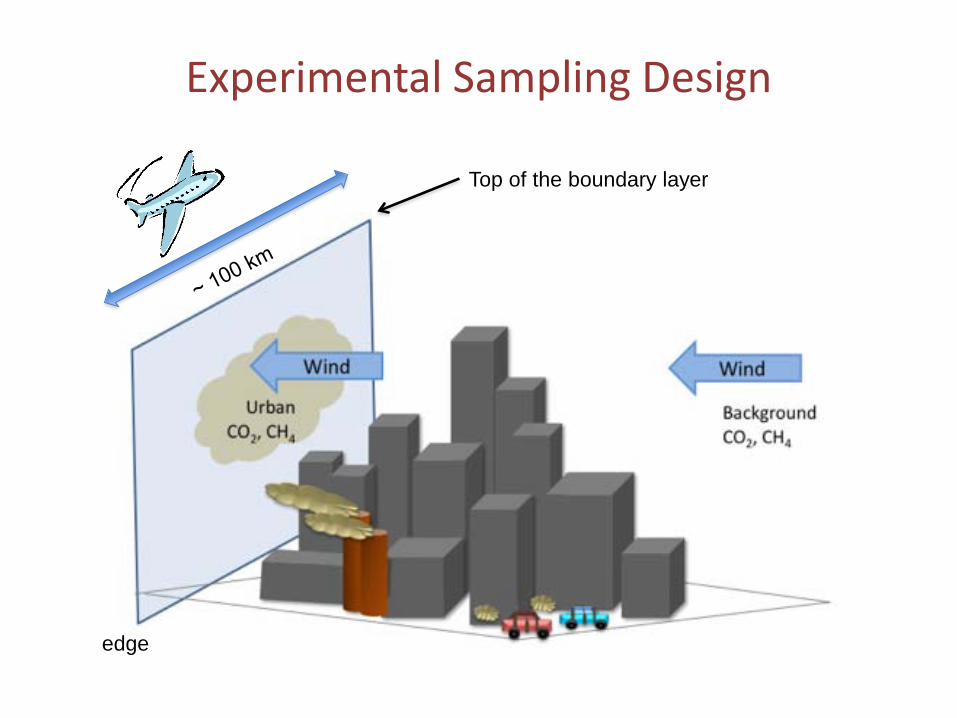
Experimental Sampling Design
Top of the boundary layer
edge
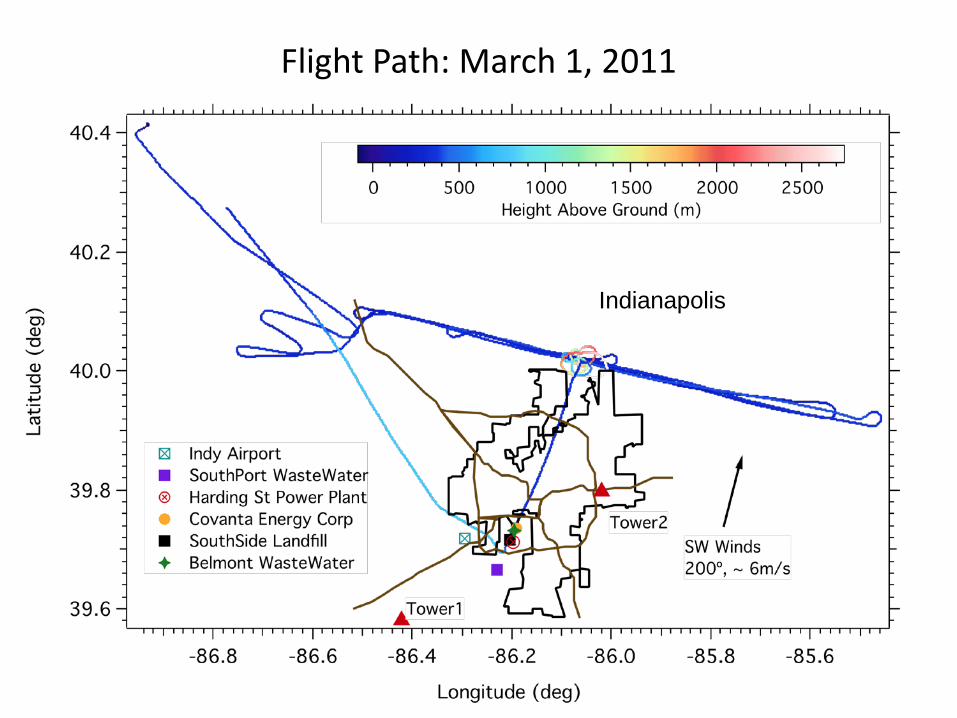
Flight Path: March 1, 2011
Indianapolis

Time series distribution of CO2 and CH4
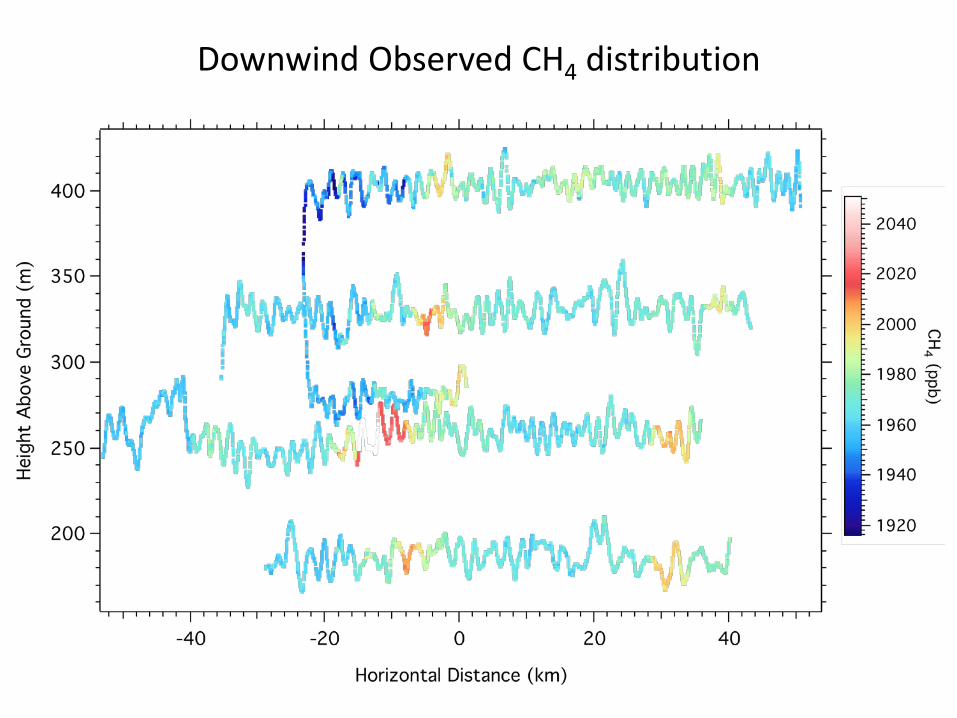
Downwind Observed CH4 distribution
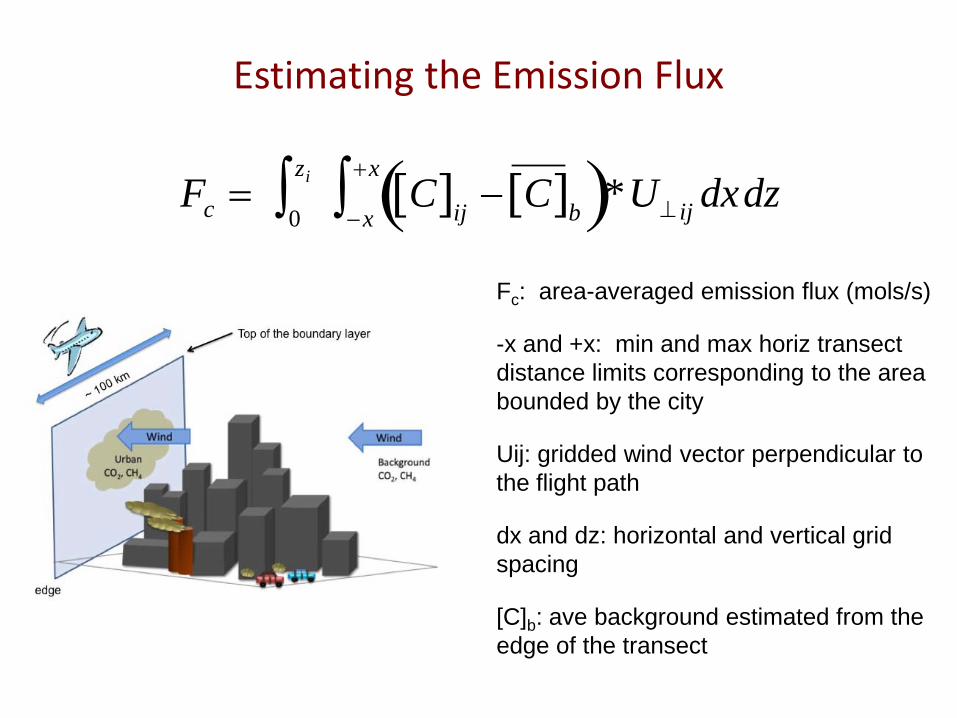
Estimating the Emission Flux
Fc = C[ ]ij − C[ ]b( )*U⊥ ij−x
+x∫0
zi∫ dxdz
Fc: area-averaged emission flux (mols/s)
-x and +x: min and max horiz transect distance limits corresponding to the area bounded by the city
Uij: gridded wind vector perpendicular to the flight path
dx and dz: horizontal and vertical grid spacing
[C]b: ave background estimated from the edge of the transect
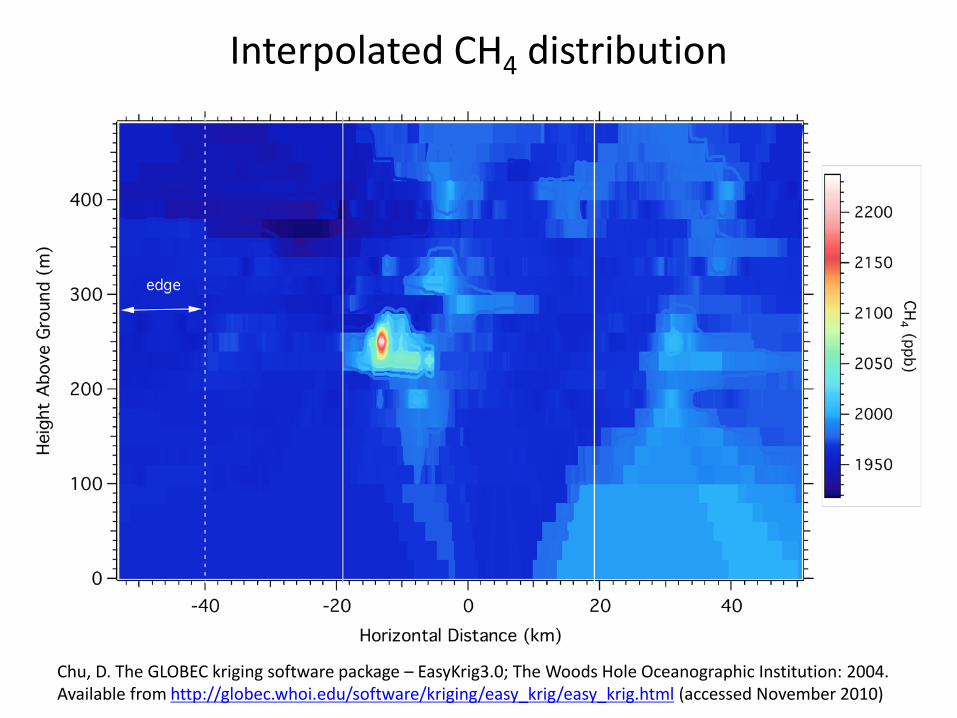
Interpolated CH4 distribution
Chu, D. The GLOBEC kriging software package – EasyKrig3.0; The Woods Hole Oceanographic Institution: 2004. Available from http://globec.whoi.edu/software/kriging/easy_krig/easy_krig.html (accessed November 2010)
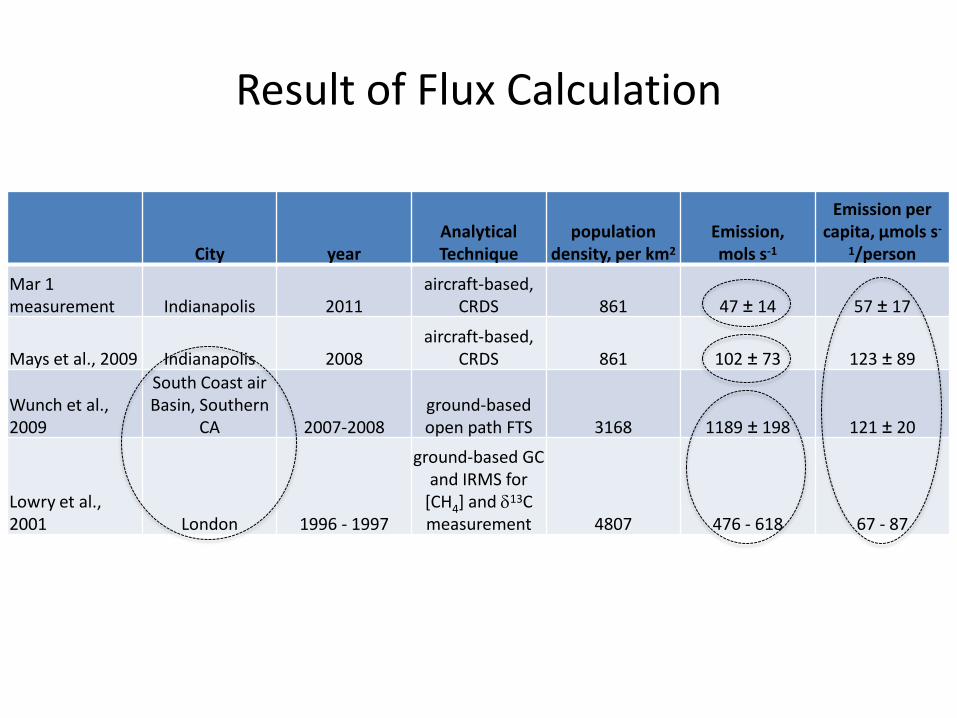
Result of Flux Calculation
City yearAnalytical Technique
population density, per km2
Emission, mols s-1
Emission per capita, μmols s-
1/person
Mar 1 measurement Indianapolis 2011
aircraft-based, CRDS 861 47 ± 14 57 ± 17
Mays et al., 2009 Indianapolis 2008aircraft-based,
CRDS 861 102 ± 73 123 ± 89
Wunch et al., 2009
South Coast air Basin, Southern
CA 2007-2008ground-based open path FTS 3168 1189 ± 198 121 ± 20
Lowry et al., 2001 London 1996 - 1997
ground-based GC and IRMS for
[CH4] and δ13C measurement 4807 476 - 618 67 - 87
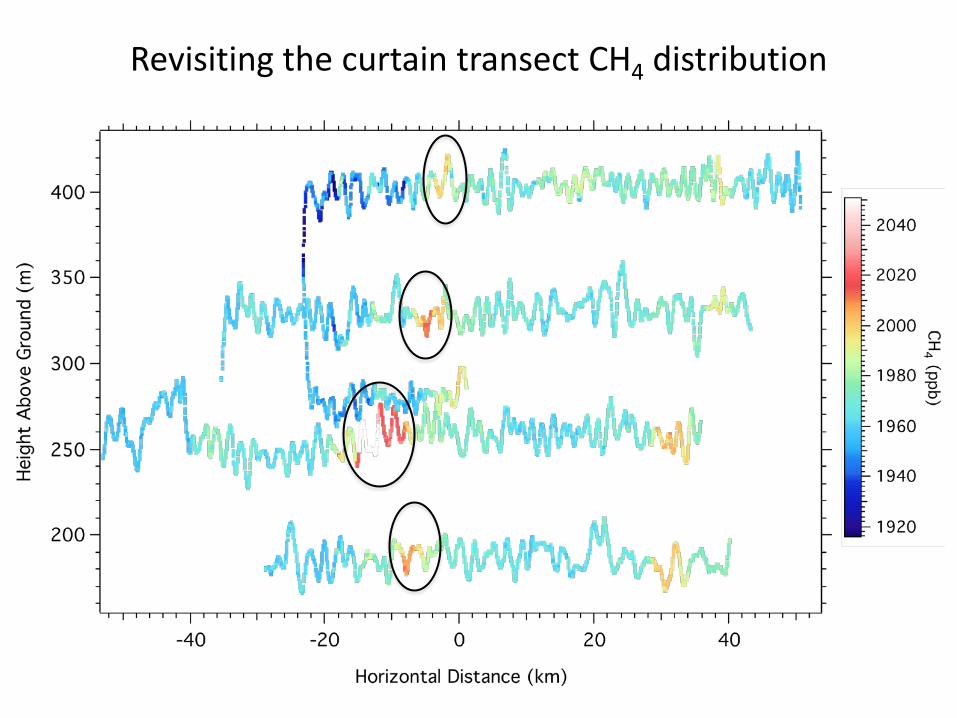
Revisiting the curtain transect CH4 distribution
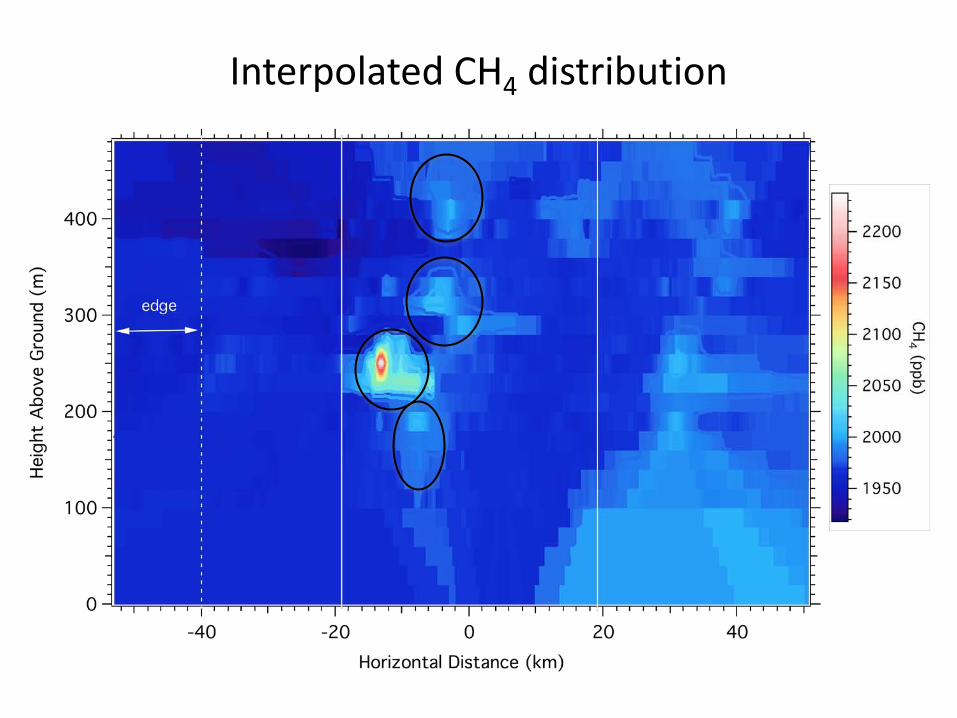
Interpolated CH4 distribution
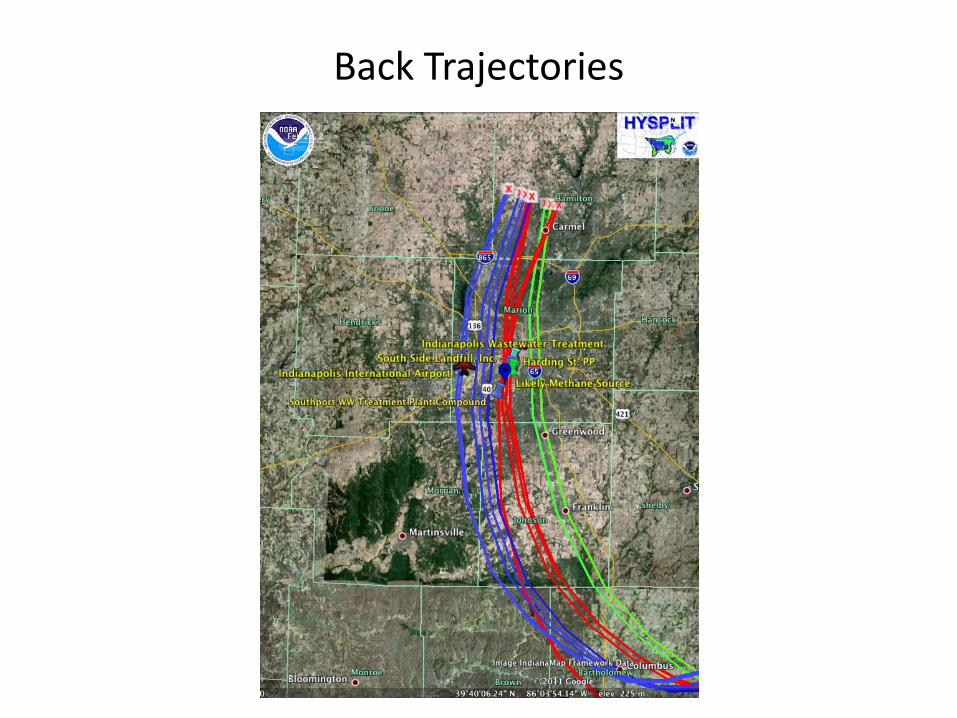
Back Trajectories
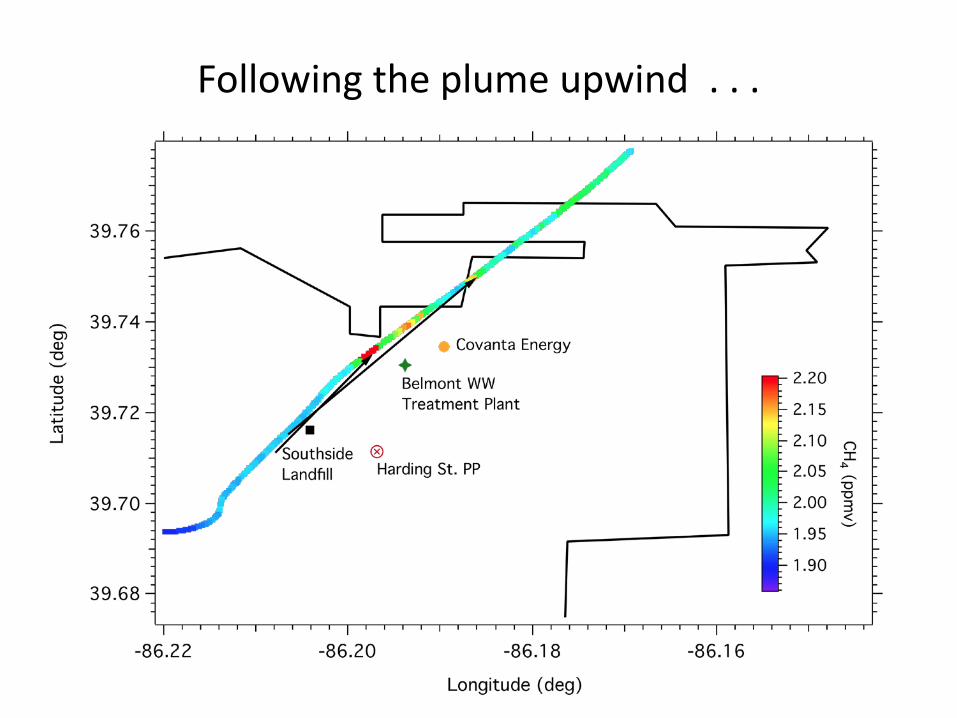
Following the plume upwind . . .
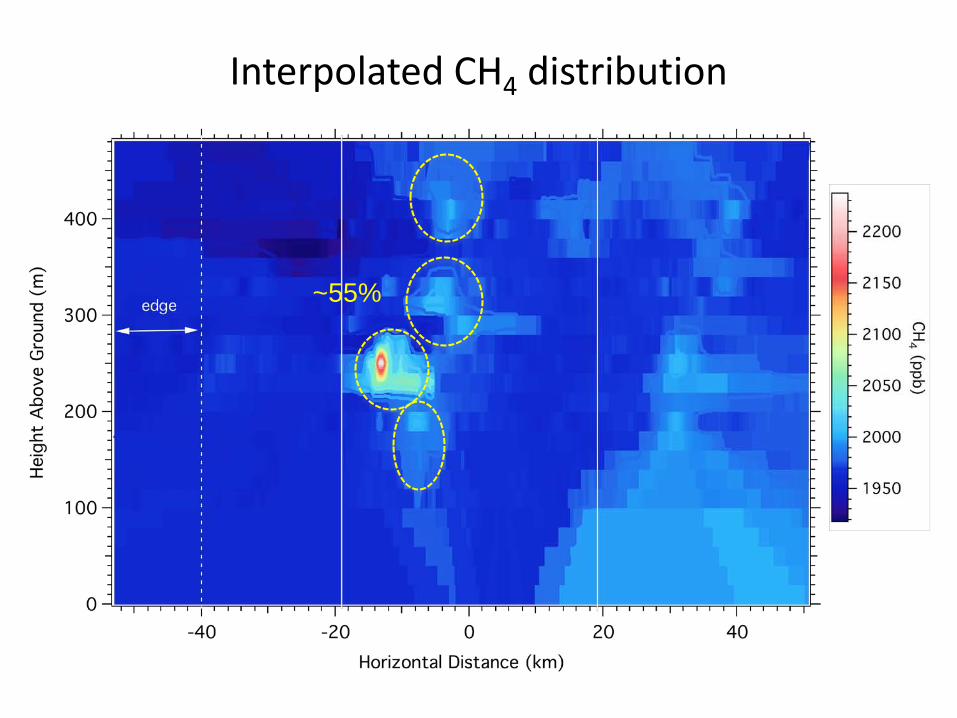
Interpolated CH4 distribution
~55%
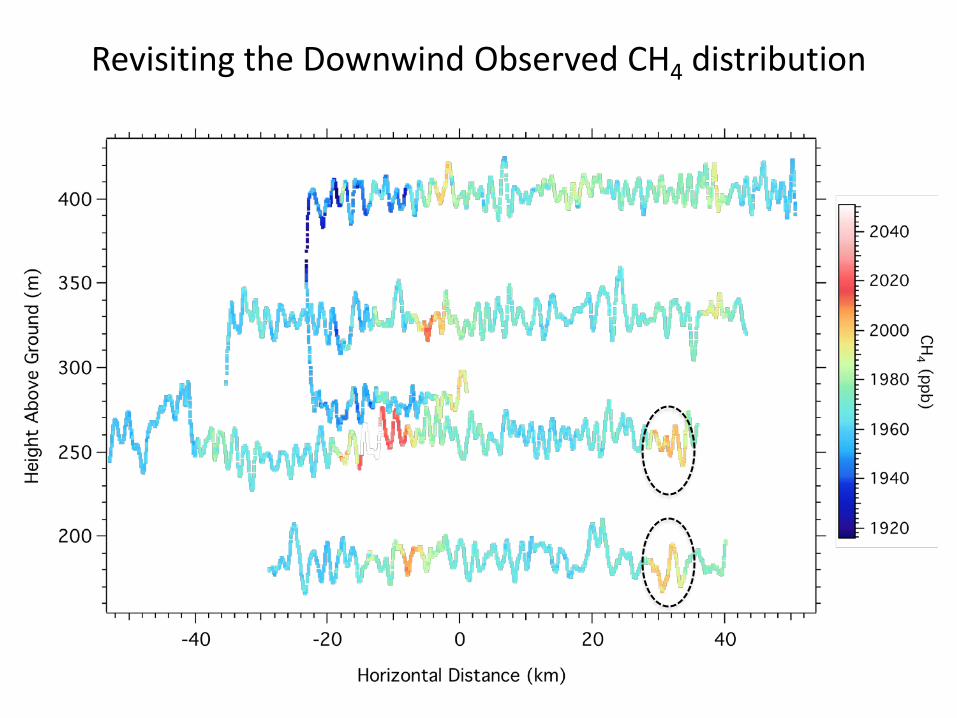
Revisiting the Downwind Observed CH4 distribution
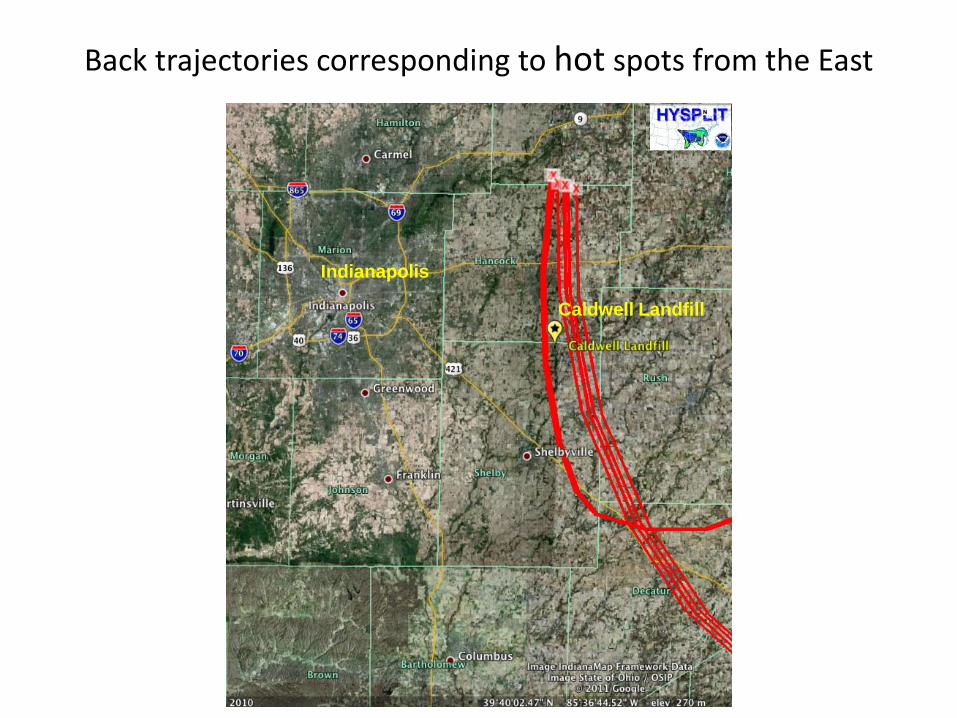
Back trajectories corresponding to hot spots from the East
Indianapolis
Caldwell Landfill
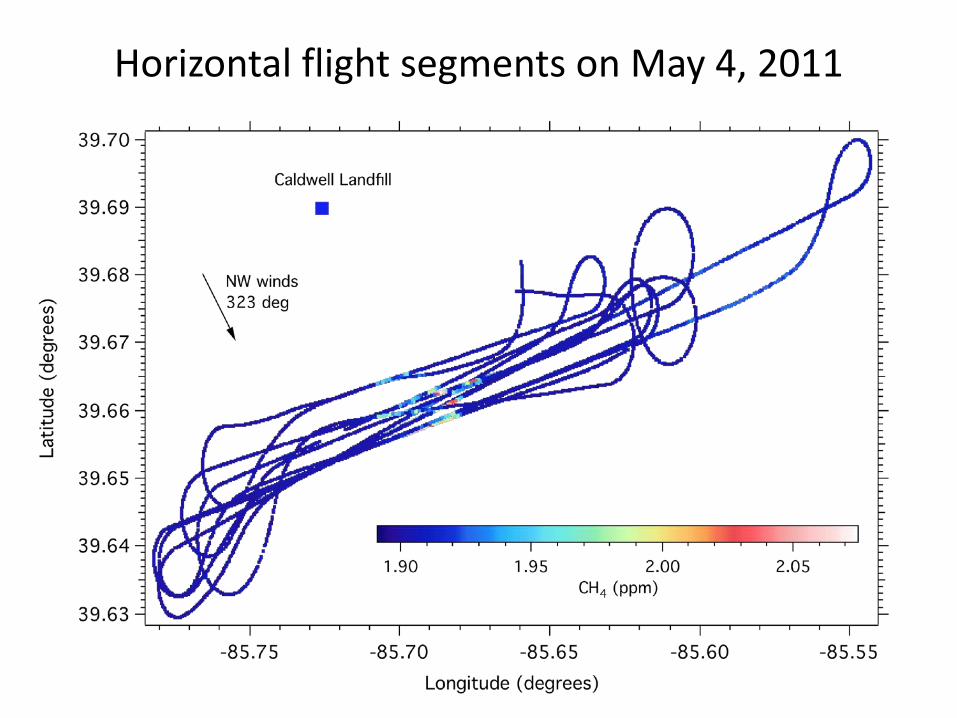
Horizontal flight segments on May 4, 2011
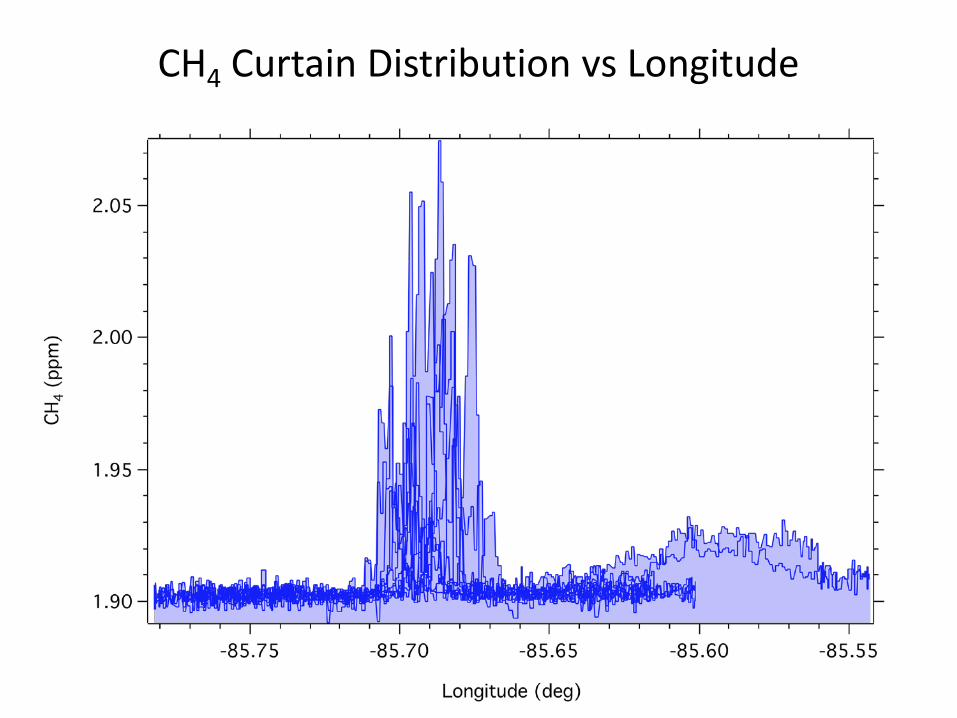
CH4 Curtain Distribution vs Longitude
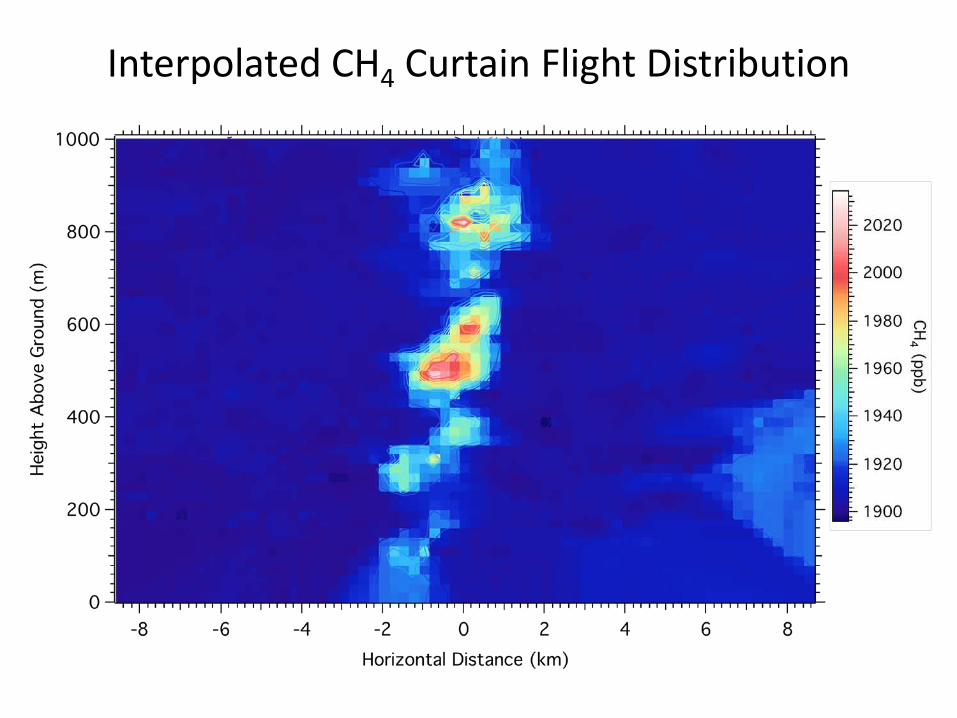
Interpolated CH4 Curtain Flight Distribution

Calculating the Energy Equivalent from the Caldwell Landfill, Morristown, IN
• Estimated Flux = 9.1 mols s-1 = 821 m3 hr-1
• 1 m3 CH4 has an energy content of 2.9 kWhr at 30% efficiency
• 821 m3/hr * (2.9 kWhr/m3 CH4) = 2381 kWhr/hr
• From US EIA: In 2008, the average hourly electricity consumption for a US residential utility customer was 1.26 kWhr
• Emissions from the Caldwell landfill can provide energy for approximately:
– ~ 1890 households (at 30% efficiency)
• Can provide energy for the city of Morristown which has a population of ~1400
• We assume constant emission
Summary and Future Work
• Starting to gain better understanding of CH4 sources and their magnitudes
• Combine aircraft flux measurements with mobile surface measurements of CH4
• Combine aircraft measurements with a Lagrangian particle dispersion model to determine the surface footprint corresponding to elevated CH4concentrations
• Need flask measurements to further constrain the location of CH4 sources
Acknowledgement: Funding from NIST

![The Indianapolis times. (Indianapolis [Ind.]) 1932-11-05 ...](https://static.fdocuments.in/doc/165x107/6190c3bd602f303e2d37f096/the-indianapolis-times-indianapolis-ind-1932-11-05-.jpg)