Quantification of cardiac blood flow by Doppler … Erik Jan.pdf · Quantification of cardiac blood...
136
Quantification of cardiac blood flow by Doppler technique
Transcript of Quantification of cardiac blood flow by Doppler … Erik Jan.pdf · Quantification of cardiac blood...

Quantification of cardiac blood flow by Doppler technique


Quantification of cardiac blood flow by Doppler technique
Quantificering van de bloedstroom door het hart met behulp van Doppler echocardiografie
Proefschrift
ter verkrijging van de graad van Doctor in de Geneeskunde
aan de Erasmus Universiteit Rotterdam
op gezag van de Rector Magnificus Prof. Dr M.W. van Hof
en volgens besluit van het College van Dekanen.
De openbare verdediging zal plaatsvinden op Woensdag, 18 december 1985 te 14.00 uur
door
Erik Jan Meijboom
geboren te Rotterdam.

Begeleidingscommissie
Promotoren: Prof. Dr Ir N. Born Prof. Dr J. Roelandt
Overige !eden: Prof. Dr R.S. Reneman Prof. Dr J.W. Wladimiroff
Bewerking van dit proefschrift vond plaats op de afdelingen kindercardiologie en obstetrie van het Health Science Center van de Universiteit van Tucson, Arizona, de afdeling kindercardiologie van de Universiteit van California, San Diego en de afdelingen echocardiografie en experimentele echocardiografie van het Thoraxcentrum van de Erasmus Universiteit Rotterdam.
Het proefschrift is tot stand gekomen mede door samenwerking in het kader van het Interuniversitair Cardiologisch Instituut, waarbij ondersteuning is gegeven vanuit Groningen, Maastricht, Utrecht, Nijmegen, Amsterdam en Rotterdam.
Het drukken van dit proefschrift werd mede mogelijk gemaakt door een bijdrage van de Nederlandse Hartstichting.

The daffodils
I wandered lonely as a cloud That floats on high o'er vales and hills, When all at once I saw a crowd, A host, of golden daffodils, Beside the lake, beneath the trees, Fluttering and dancing in the breeze,
For oft, when on my couch I lie In vacant or in pensive mood, They flash upon that inward eye Which is the bliss of solitude; And then my heart with pleasure fills, And dances with the daffodils,
W, Wordsworth
Aan Kukel, Plof en K weet


Table of contents
Purpose and scope of the present investigation
Chapter I
An introduction to blood flow calculation across both atrioventricular orifices
Chapter II
A simplified mitral valve method for 2D echo Doppler blood flow calculation: validation in an open chest canine model and initial clinical studies A Doppler echocardiographic method for calculating volume flow across the tricuspid valve: correlative laboratory and clinical studies
Chapter III
A two-dimensional Doppler echocardiographic method for pulmonary and systemic blood flow in a canine model with a variable-sized left-to-right extracardiac shunt
Chapter IV
Limits of reproducibility of blood flow measurements by Doppler echocardiography; variability within the technique
page
13
27
41
59

page
ChapterV
Cardiac Doppler flow velocities in human fetuses 77
Chapter VI
Discussion 95
Chapter VII
Summary 101
Sam en vatting 105
References 109
Acknowledgements 115
Curriculum vitae 117
Publications of the author 121

Purpose and scope of the present investigation
The investigations described in this thesis started as part of the research program of the divisions of pediatric cardiology of the Universities of Arizona and California (San Diego). The investigations were part of an ongoing project designed by D.J. Sahn and L.M. Valdes-Cruz. This project was initiated to implement Doppler techniques in the daily practice of pediatric cardiology. New developments in medical technology made the Doppler techniques integrated into sophisticated two-dimensional echocardiographic equipment available to the clinician. In order to extend the use of the Doppler equipment beyond that of a sophisticated stethoscope and to enter the era of quantitative two-dimensional Doppler echocardiography it was felt that clinical validation of simple quantification approaches was necessary. As an initial approach animal studies were performed. Open chest dog models were created where simultaneously with the Doppler studies electromagnetic flow measurements and pressure gradients could be obtained. The results of both techniques were compared and a good correlation was obtained. Twodimensional Doppler echocardiographic quantifications were subsequently performed in patients with a variety of diseases during cardiac catheterization to validate the results in a clinical setting. The blood flow calculations over the mitral valve orifice and the development of the mitral valve flow method, including the mean to maximal index of the mitral valve, were performed by D. Fisher. Measurement of shunt size at atrial and ventricular level of the left-to- right type was validated by S. Horowitz. The measurement of extracardiac type left-to-right shunting such as in the persistent ductus arteriosus, of the tricuspid valve flow and a simplified approach to measurement of mitral valve flow will be described in this thesis. The tricuspid valve method and the simplified mitral valve methods are both studied in patients during cardiac catheterization for validation purposes and were subsequently used for calculation of flows in the human fetus during the second and third trimester of pregnancies.

This thesis was completed by the study of the reproducibility of the previously described techniques in human subjects. This part of the investigation was performed at the Thoraxcenter in Rotterdam and supported by the Interuniversity Cardiology Institute of the Netherlands. This investigation was supervised by Professor Born and Professor Roeland!. H.Rijsterborgh performed the statistical analysis.

Chapter I
An introduction to blood flow calculation across both atrioventricular orifices


Chapter!
The integration of Doppler techniques in echocardiography Christian Doppler (1803-1853), an Austrian mathematician and physicist described a frequency shift occurring in starlight emitted by a double-star complex (Doppler, 1843). This frequency shift was caused by the displacement of these stars relative to the recipient of the signals. Buys Ballot (1817-1890), a Dutch physicist studied this Doppler effect more extensively and proved that it also occurred in sound waves (Buys Ballot, 1845).
About a century after the discovery of the Doppler effect the advancement of technology allowed the development of systems capable of emitting and receiving ultrasound. These systems made the Doppler effect applicable for medical use.
The general formula for the Doppler frequency shift (.M) is:
2f,.v.cos8
c
where the source of the emitted sound and the receiver for the reflected waves are located at the same place. f, is the frequency of the emitted sound, vis the velocity of the moving reflector, e is the angle between the interception beam and the direction of the movement of the reflector and c is the velocity of sound in the insonated medium.
The ultrasonic Doppler technique was initiated by Satomura in 1955 and proposed in 1959 for measuring blood flow in arteries (Satomura, 1959). The medical use of Doppler was subsequently primarily in the field of peripheral vascular disease. Strandness, Gosling, Roberts and Reneman belong to the group of early workers in this field (Gosling et a!, 1971; Reneman et a!, 1973; Roberts et a!, 1976; Strandness eta!, 1960). In recent years clinical use has become common.
3

Obstetrics is a second field where the use of Doppler quickly established its clinical value appertaining to the investigation of the fetal circulation (Wiadimiroff, 1980). The use of Doppler in cardiology started out in the sixties and early seventies (Baker et a!, 1977; Kalmanson et a!, 1969; Light, 1977; Pourcelot et a!, 1967;). More recently important progress has been reported by Hatle (Hatle and Angelsen, 1982). Initially the Doppler effect was providing only qualitative information. The first quantitative work on gradient measurements was carried out by Holen (Holen and Simonsen, 1979) using the simplified Bernoulli equation:
LlP = pressure drop in mm Hg vm.:u =maximum velocity in m.s-1
LlP=4v~.:lX
This work was based upon investigations performed by continuous wave Doppler systems. These systems were stand-alone devices, with the studies performed blindly and guided only by an audio-signal. When pulsed Doppler systems were integrated into two-dimensional imaging systems, simultaneous imaging and positioning of the Doppler sample became possible. With simultaneous imaging of the intracardiacstructures and recording of the blood velocity at the same spot, calculation of blood flow at that position using quantitative Doppler echocardiography became feasible.
In this study quantitative Doppler echocardiography is based on the assumption that blood flow Q (in cm3 s-1
) can be calculated using a simplified formula:
Q=C. vxA cos e
in which C is constant, a factor which expresses the influence of the velocity profile, Vis mean temporal velocity expressed in cm.s -J, A is the area expressed in cm2 and e is the interception angle between the Doppler interrogation beam and the direction of flow. Each ofthese parameters has its specific potential sources of error. However, it is the area that introduces the largest error, as will be discussed· hereinafter.
Velocity profiles The factor C in the equation mentioned above can vary from I to 0.5 as velocity profiles vary from flat to parabolic. Calculations of volume flow are based on the assumption that the flow studied, has a flat profile and that C equals I. Different
4
methods have been used to study these velocity profiles at the various valve orifices in the heart.
a. Mitral valve orifice Lynch and Bove (1968) studied velocity patterns through the normal mitral valve, by injecting contrast into the left atrium and tracing the instantaneous shape of the contrast front, visualized with high speed cineangiography. These contrast fronts show a remarkable flat profile over the entire left ventricular inflow tract, but expand as they approach the opposite wall. This study provides only information on the leading wavefront in the mitral valve annulus. This information cannot be extrapolated to the wavefronts later in diastole. These studies, however, suggest that a flat spatial velocity profile is most likely to be present throughout diastole.
Brunet al (1978) performed detailed mapping of both the left ventricular inflow and outflow tract by a combined echocardiographic and Doppler technique and they obtained spatial velocity patterns. They characterized the inflow phase of their subjects by an enlarging zone of downward oriented velocity vectors and an abrupt dispersion of the vector orientation at the tip of the anterior mitral leaflet. They found scattering of vectors between the interventricular septum and the anterior mitral leaflet in diastole. This and Bellhouse's observation that the anterior mitral leaflet closes before the posterior mitral leaflet (Bellhouse, 1972) might suggest, however, some asymmetry of the flow profile at the end of diastole.
b. Tricuspid valve orifice The flow patterns across the tricuspid valve in this study are regarded to be of similar aspect as the flow patterns at the mitral orifice.
c. Aortic valve orifice The same technique, used for the study of velocity profiles in the ascending aorta, provides evidence for a more skewed flow profile in the aorta. Peronneau et al (1974) used a multigated Doppler system to assess the aortic velocity profile in open chested dogs and found similar skewed flow profiles. Additionally, flow direction had a small tangential component, while at the inner curvature, retrograde flows were sometimes noticed.
Angelsen (1982) discussed the theoretical aspects of transition from a flat profile at the inlet of a tubular vessel, to a parabolic profile downstream. The region in which this flow change occurs may be characterized by a parameter named inlet length. McDonald (1960) calculated that the inlet length in the aorta is longerthan the ascending aorta itself.
5

Therefore it can be assumed that the flow profile in the ascending aorta is approximately flat. This is a theoretical hypothesis which is further supported by flow velocity studies in the ascending aorta of an open chested dog by Fisher et al (1983). They measured flow velocity of eight different positions in the aorta and varying size sample volumes. Their results show a very limited spectral broadening and no significant difference in flow velocity tracings at the various sites. They state that their results support the assumption that temporal skewing is of minimal importance and that the mean velocity does not differ between the various sites, suggesting a flat flow profile.
These theoretical and experimental studies indicate that flow profiles at semilunar valve orifices are flat and may support the assumption that flow profiles at the atrioventricular valve orifices are similar. The assumptions are made for flow across valves in physiological circumstances and do not necessarily hold for pathophysiological situations.
Mean temporal velocity measurements To calculate the mean temporal flow velocity the measured modal Doppler frequency displayed as a function of time on a horizontal scale is integrated over the cardiac cycle. Flat flow profiles are expressed in a velocity spectrum where most frequencies are clustered close to the outline of the maximum frequency wave form. These narrow clusters facilitate digitizing for mean temporal velocity. The modal frequency, used for the calculations is within the vertically displayed frequency distribution (spectral broadening) and judged subjectively by the intensity of frequencies. The modal velocity indicated by the darkest portion of the narrow spectrum of such a flat profile is relatively easy to obtain. An increase of the spectral broadening, however, which can happen under various circumstances will prevent an accurate determination of the model velocity. Therefore, tracings with spectral broadening of more than 10% of the maximum velocity should be disqualified.
Variation in waveform cohorts of cardiac cycles, caused by the physiologic effects of respiration and beat-to-beat variation is frequently encountered. Increasing the number of cardiac cycles to integrate velocities will diminish the effect of these variations on the outcome of the integrant. Finally the visual assessment of Doppler velocity patterns, although subjective, allows rejection of significant artifacts.
Flow area measurement Measurements of cross-sectional area of flow depends upon the chosen level at
6

which the valve is transsected, the instant of imaging in the cardiac cycle and the procedure used for the calculation of the area.
a. Level oftranssection Theoretically the annular level is the best choice, because that cross-sectional area varies least during the cardiac cycle. Tei et al (1982) and Loeber eta! (1984)forthe tricuspid valve, and Ormiston et al (1981) for the mitral valve used this level for their measurements. A different level is used by Fisher et al (1983) at the mitral valve. They obtain a maximum area at midleaflet level of the mitral valve and introduce an M-mode derived correction factor (mean/maximal index) to calculate at the diastolic mean area of flow. The latter method has the theoretical advantage of including the known physiological variations of valve area during the cardiac cycle but has the disadvantage of having a relatively large cyclic variation. This cyclic variation, the movement of the mitral valve leaflets, however, depends on the blood velocity which is already taken into account in the mean temporal velocity and in this fashion expressed twice in the equation. Additionally, during middiastole the mitral flow velocity may fall back to zero, and, should the then existing mitral valve opening be taken into account? It seems that the derived mean to maximal index in this method functions more as a multiplication factor than as the actual reflection of the true valve orifice.
In the ascending aorta Fisher et al (1983) in the dog and Loeber et al (1984) in human choose for a position just above the sinus ofValsalvae where they encountered the least variation in flow area.
b. Instant of measurement in the cardiac cycle Area variation over the cardiac cycle should be taken into consideration and would theoretically necessitate a registration of the area as a function of time. Ormiston et al (1981) showed changes of the mitral valve area over the cardiac cycle and Tei et al (1982) show the similar phenomenon for the tricuspid annulus. A gradual increase in size during diastole to a maximum in late diastole and a sharp decrease at the early onset of systole. In practice, all authors select one well-defined point in the cardiac cycle to obtain a suitable cross-sectional area, with only Fisher et al (1984) additionally using a mean to maximal index as a correction factor.
c. Area formula If it is assumed that the area can be obtained in one well-defined moment in the cardiac cycle, then the most precise method to calculate the area is planimetry of the complete contour of the orifice cross-section in a frozen frame. Simplification
7

of this calculation becomes possible if the contour is approximated by a circle m an ellipse. This reduces the technique to the measurement of one or two axes, to use in a simplified formula.
It is generally accepted that the aorta is of circular shape. Therefore a diameter (d) is measured on a frozen frame and used in the formula:
7r d' A=--
4
where A= cross-sectional area. Loeber et al (1984) even use this approximation for the tricuspid valve. De Boo et al (1984), however, consider the tricuspid valve to be better approximated by an ellipse. They studied the mitral and tricuspid annulus from two mutually perpendicular positions. To calculate the area of the mitral annulus they used the parasternal long axis and apical four chamber views. Dimensions of the tricuspid annulus were measured using a slightly modified parasternal short axis view and an apical four chamber view. The measurements were taken from a frozen frame, acquired at the moment of the cardiac cycle in which the orifice has its greatest diameter and the attachment of valves could be clearly identified. The difference between the two diameters, obtained in the tricuspid orifice, was statistically significant indicating that it is incorrect to consider the tricuspid orifice as a circle. They therefore measure two perpendicular axes (d 1 and d2) to determine the area according to the formula:
A= rr(d1 xd2)
4
This is in agreement with the data of Tandler (1913) who reviewed the data of several anatomical studies of the atrioventricular valve orifice size and shape. In these studies the mitral valve is described as a circular orifice while the tricuspid orifice has a more triangular shape and a larger circumference.
Ormiston et al (1981) reconstructed the shape of the mitral valve annulus in an echocardiographic study. They concluded that the annulus was more elliptical in systole and rather circular in late diastole. For calculation of the area at midleaflet level a correction factor as used by Fisher et al ( 1983) may lead to satisfactory results in a group of subjects with similar mitral annular velocity waveforms, but in a population with widely differing waveforms it would be expected to introduce a disturbing systematic error in flow calculations. At the annular level, however,
8

the instantaneous cross-sectional area increases gradually during diastole (Ormiston eta!, 1981). We estimated from their data that the cross- sectional area is 8% larger for the top of the A-wave than for the top of the D-wave. Therefore the attribution of the A-wave to mean flow according to the right calculation procedure is weighted by 8% more than the D- wave.
d. Sophisticated method As the cross-sectional area is not constant over the heart cycle, the cycle mean flow should preferably not be calculated by using the formula:
Q= vxA cos e
but in principle a more sophisticated calculation procedure should be performed. The cycle should be split in short time intervals where the relative variations of v, A and e could be neglected, in each interval the attribution to mean flow is calculated and all attributions in the cycle are added to obtain the cycle mean flow Q. In formula this becomes:
RR Q =I v (t) . A (t) . dt
RR x cos O(t) 0
where RR represents the duration of the cardiac cycle. Comparing this sophisticated method to the simplified method we conclude that the simplified approach may be relatively inaccurate. However, since a simplified approach seems much more practical, it was worth wile to evaluate this approach under various circumstances as has been reported in the following chapters.
In the simplified method the diameter measurements are taken from twodimensional frozen frames and reliability depends on the quality of imaging. Martinet a! (1979) demonstrated how poor axial and lateral resolution may lead to an underestimation ofthe orifice size and stress an optimal gainsetting. Such an optimal gainsetting theoretically could minimize these problems.
In recent experiments colour-coded Doppler has been useful in defining the area of flow (Sahn, 1985; Roeland! eta!, 1985). At the atrioventricular orifices the actual area of flow as shown by this method appeared to be smaller than the area calculated from the echocardiogram.ln small ventricular septal defects, however,
9

this situation is reversed and a large area of flow is shown by the colour-coded Doppler systems as compared to that estimated from cross-sectional echocardiography.
Finally one should bear in mind that using the annulus diameter for calculating an area as if it were in fact the area of flow, is a hypothesis. What is really shown are variations in size of the annulus diameter and not necessarily the size of the area of flow. The true area of flow is not really known and it may in fact just be a coincidence that using the annulus diameter yields a reasonable estimate of flow as could be proven during the animal experiments reported in chapters II and Ill.
Measurement of the interception angles The Doppler shift is proportional to the cosine of the angle of intercept between the Doppler interrogation beam and the direction of flow. This angle preferably should be close to 0°. An increase of this angle towards 90° results in a progressive change in measured velocity. The angle between the sampling direction and the direction of flow can only be estimated within the plane of imaging. This direction is an estimate, based on structure orientation, not on flow. Interception angles in the azimuthal plane should be close to 0° by proper positioning of the transducer. Flow measurements in cardiac chamber curvatures should be avoided during sampling as to prevent ambiguity. Studies have been performed with pulsed Doppler devices, simply because at the time of the study these were the only devices featuring an integrated Doppler system into two-dimensional echocardiographs. Currently, however, with integration of continuous wave systems into two-dimensional echocardiographic devices, the question arises as to the relative merits of continuous wave versus pulsed Doppler for quantitative Doppler echocardiography. Advantages of continuous wave Doppler are a better signal to noise ratio and the absence of velocity ambiguity, preventing aliasing.
Theoretically continuous wave will therefore produce a better quality Doppler frequency shift recording. Now that the previously existing problems around the integration of continuous wave Doppler in cross-sectional echocardiographic systems have been solved, comparative studies have to prove the accuracy of this technique. Theoretically the accuracy should be equal or better.
The forthcoming chapters will elucidate aspects of quantitative Doppler echocardiography, such as validation in clinical models, pilot studies in small human populations, variability within the method, and the use of the technique in the human fetus when the simplified approach is used. These studies were carried out with the previously mentioned assumptions taken into account.
10

Chapter II
- A simplified mitral valve method for 2D echo Doppler blood flow calculation: validation in an open chest canine model and initial clinical studies
- A Doppler echocardiographic method for calculating volume flow across the tricuspid valve: correlative laboratory and clinical studies


Chapter II
A simplified mitral valve method for 2D echo Doppler blood flow calculation: validation in an open chest canine model and initial clinical studies
by
Erik J. Meijboom M.D., Suzanna Horowitz B.S., Lilliam ValdesCruz M.D., Douglas Larson M.Sc., Nicolaas Born Ph.D., Hans Rijsterborgh M.Sc., Carlos Oliveira Lima M.D., David J. Sahn M.D.
The Dept. of Pediatrics, University of California San Diego School of Medicine, San Diego, California, U.S.A. and Thoraxcenter, Erasmus University Rotterdam, The Netherlands.
This work was supported in pan by a grant from the Jan Kornelis de Cock Foundation, The Netherlands
Submitted to JAm Coll Cardiol


Chapter II
Abstract
We evaluated a simplified two-dimensional Doppler echocardiographic method for calculating cardiac output, requiring only a four-chamber view for mitral valve flows and compared results to a previously described mitral valve orifice method which uses short axis and four-chamber views. In 4 open chest dogs, a calibrated ascending aortic electromagnetic flow probe was placed and a femoral artery cannula was connected to the pulmonary artery via a calibrated roller pump to vary mitral valve flow (Fisher eta!, 1983), Mitral valve velocities were obtained for both Doppler methods from four-chamber views. Flow area for the mitral valve orifice method was the maximum two-dimensional short axis mitral valve orifice corrected for diastolic mitral valve motion. The simplified mitral valve four-chamber method assumed a circular fixed flow area calculated using the maximal diastolic mitral valve annulus diameter from the fourchamber view. For 20 cardiac outputs between 1.4 -7.7l/min, the correlation between the mitral valve orifice flow and electromagnetic flow meter was not significantly different (r = 0.99, SEE= 0,20 Vmin) from the results for the mitral valve four-chamber method (r= 0,98, SEE= 0,28 Vmin), Further, for 10 children studied in the cath lab, Doppler mitral valve four-chamber flow also correlated well with cardiac output obtained by the thermodilution method (range= 1.2- 5.8 I/ min: r = 0.94, SEE= 0.33l/min). Our study suggests that the simplified mitral valve four-chamber method provides acceptable accuracy for Doppler cardiac output measurement.
Introduction
Quantitative two-dimensional Doppler echocardiography is increasingly used for the calculation of cardiac blood flow volumes, Methods have been published reporting volume flow measurements at various sites such as the ascending aorta and the pulmonary artery (Goldberg et a!, 1982; Stewart et al, !983), More
!5

recently the tricuspid and mitral valve orifice quantitative Doppler volume flow methods have been reported as well (Fisher et al, 1983; Meijboom et al, 1985). Fisher et al (1983) describe a method for the mitral valve which they validated in an animal model and evaluated in the clinical setting. This method, however elegant, requires several measurements on two-dimensional Doppler echocardiograms obtained from two different transducer positions and is therefore sometimes too complicated to use clinically.
Our current study, a simplified method to measure flow volume at the mitral orifice evolved from a previously published method for the tricuspid valve (Loeber eta!, 1984; Meijboom et al, 1985). This simplified method is based on Doppler recording and flow area measurement from one single echo view. In this study the method is validated in an open chest animal model and a pilot study in a small group of patients undergoing cardiac catheterization is reported. The simplified method and the previously described method are compared.
Methods Surgical technique and animal model Four mongrel dogs weighing20-30 kg were anesthetized with sodium pentobarbital (30 mglkg), intubated, and ventilated with a standard Harvard• volume pump respirator. Tidal volume was set 100-150 cc once the chest was open and ventilation rate was 20-25/min. A median sternotomy was performed and the pericardium opened. The ascending aorta and the main pulmonary artery were dissected, cleaned of fat and adventitia, and an appropriately sized, previously calibrated electro-magnetic (EM) flow probe (Gould-Statham SP2204) was placed around the ascending aorta 2 em above the aortic valve. Adequate contact of the cuff was verified by recording phasic aortic flow tracings. The right femoral artery was then dissected, cannulated and connected to a roller pump by 3/8-inch tubing. The return of the roller pump tubing was attached to a cannula inserted and fixed into the main pulmonary artery through a pursestring suture (Fig. ILl). The roller pump had been previously calibrated by measuring flow rates with a stopwatch and a graduated cylinder. Ascending aortic flow was measured using the EM flow meter reading and left-to-right shunt volume was the measured flow through the roller pump. Mitral valve volume flow was assumed to be equal to ascending aortic flow determined by the EM flow meter, since the interventricular septum was intact. Continuous EM flow recordings were obtained throughout the study for comparison with Doppler determined flows. Following each step-by-step change in shunt size achieved by altering pump settings, a period of 2 minutes was allowed to
16

t
Femoral A.
\ Figure II. I
Diagrammatic representation of the surgical animal model utilized to vary mitral valve flow. A femoral artery cannula was connected via 3/8" tubing to a previously calibrated roller pump. The return end of the roller pump tubing was attached to a cannula inserted and fixed into the main pulmonary artery through a purse string suture. Systemic venous return (and therefore mitral valve flow) was varied by changing roller pump setting. See text for details. (Reproduced from Meijboom eta!. 1983).
17

elapse after the EM flow meter readings stabilized before any Doppler recordings were made.
Ultrasound and Doppler methods Ultrasound imaging and Doppler studies were performed with a commercially available range gated pulsed Doppler unit (Electronics for Medicine I Honeywell). The unit contains a 3.5 MHz single element transducer mechanically swept through a 30-75 degree arc to achieve real-time two-dimensional echocardiographic imaging at 30 frames/sec. The scanner could be stopped along any line within the image and a Doppler sample volume could be positioned at any depth along that line. This permitted precise localization of the sample volume and determination of the angle between the direction of Doppler sampling and the estimated direction of flow within the plane of imaging. The angle of intercept relative to the presumed direction of flow within the eleva tiona! or azimuthal plane, that is, the plane perpendicular to the plane of imaging, could not be determined; however, small deviations from sampling exactly parallel to the direction flow (angles= 0° or 180°) were of no practical importance since the cosine of the angle of intercept would still be close to unity (see formula I). Sample volume length was variable between 2 mm and 2 em and was usually set at 5 mm in these studies. Sample volume width in a watertank at 6 dB was± 2 mm at 4-8 em depth. The operational mode of the scanner could be switched from real-time imaging to spatially oriented Doppler sampling in less than 1/10 sec. In Doppler mode, signals were sampled at a pulse repetition frequency of 13 kHz when the signal was obtained from a depth less than 6 em, resulting in a maximal nonambiguously detectable velocity of± 143 em/sec and were sampled at a frequency of7.8 kHz at a depth of 6-12 em, resulting in a maximum nonambiguously detectable flow velocity of 85 em/sec at 0° angle of intercept. Two outputs of the Doppler frequency shift were available: an audio signal and a quantitative fast Fourier transform spectral analysis of the Doppler shift available 200 times/sec. The Doppler spectral output was converted automatically by the scanner to flow velocity in em/sec using the formula:
Formula 1 flow velocity= (frequency shift) x (velocity of sound in blood)
2 (transmitted frequency) (cos 8)
-velocity in em/sec. -frequency in sec-1
-velocity in em/sec.
18

The angle of intercept e, that is, the angle of incidence between direction of flow and tbe Doppler sample volume, was determined manually with a protractor directly from the freeze frame of the two-dimensional image which showed the sample volume position relative to the imaged cardiac structures (Fig. II.2). Correction for angle e was applied manually in formula 2 rather than in formula I (see below). Transmitral flow was obtained by placing the transducer at the cardiac apex imaging in a four-chamber view. The Doppler sample volume was placed within the left ventricular inflow tract just distal to the mitral valve leaflets and lateral to the outflow tract. Once the optimal two-dimensional image and Doppler wave curves were obtained, they were recorded on strip chart at 100 mm/sec paper speed and on video tape (Fig. IL2). The mitral Doppler flow curves were digitized and integrated using a minicomputer to calculate the mean temporal mitral valve flow velocity (see below). An estimate of mitral valve flow area was obtained by positioning the transducer over the atrioventricular valve ring scanning in a short axis plane. A gated stop frame of the maximal diastolic mitral valve orifice opening on a two-dimensional image was recorded. In order to be able to compare our results to the Fisher method; according to his description maximal orifice area was digitized along the inner contours of the two-dimensional image of the mitral leaflet echoes. Since the mitral valve is not maximally opened during the entire diastolic time, a correction factor for the phasic diastolic movement of the valve was calculated as the mean-to-maximum leaflet separation from the derived M-mode trace. The maximum two-dimensional orifice of the mitral valve was multiplied by the mean-tomaximum leaflet separation ratio to arrive at the effective mitral orifice throughout the entire period of diastole (Fisher et al, 1983; Meijboom et al, 1983). For the simplified mitral valve flow method, the estimated area of flow was obtained using a four chamber view. The observed mitral annulus diameter was maximized by anterior/ posterior angulation of the transducer and was then measured as the maximum diastolic diameter (D) between insertion points of anterior and posterior mitral valve leaflets (Fig. II.2). The diameter was converted to mitral flow area using the equation rr (D/2)2
•
In both methods the Doppler sample volume was then placed within the left ventricular inflow tract beyond the mitral valve at the tips of the valve leaflets for recording Doppler velocities. Once the optimal M-mode tracing, two-dimensional image and Doppler wave curves were obtained they were recorded on stripchart and/ or videotape. The mitral valve volume flows were calculated by Doppler as decribed below.
19

Human population In order to evaluate the clinical usefulness, the simplified quantitative Doppler mitral valve flow method was attempted on ten children at rest during cardiac catheterization. The cardiac catheterizations were performed on a clinically indicated but elective base. None of the patients had mitral valve disease. Standard sedation given consisted of DemerolR and ThorazineR Thermodilution cardiac outputs were obtained with an Edwards 9510-A system, after one cool-down injection, as an average of3 measurements, one before and two after obtaining the Doppler data. Human mitral valve Doppler flow studies and echo imaging of the mitral valve orifice were performed in the apical four chamber view. Doppler two-dimensional echocardiographic calculated cardiac outputs were compared to the results of the thermodilution study. The procedure for obtaining the flow data and mitral valve orifice area was similar to that used for the simplified mitral valve method in the animal studies. Doppler flow waves forms, maximum diastolic annulus diameter were obtained in the apical four chamber view. As in the dogs, mitral annular diameter was converted to flow area using the equation (formula 2) shown in the next paragraph. A Doppler sample volume length of 1.2 em was used in the human study. The Fisher method (Fisher et al, 1983) was not attempted in two human studies.
Digitizing methods: calculation of mean temporal flow The mean temporal velocities for the mitral valve were obtained by digitizing and integrating the area under three consecutive R- R interval matched Doppler flow velocity curves with a minicomputer. To accomplish this, the middle of the densest portion of the gray scale spectral display of the Doppler velocity curves was traced (this is the modal velocity shift which is equal to the velocity shift most frequently present in the returning signal, see Fig. 11.2). The minicomputer divided the velocity time integral for the three complete beats by the time interval of the three beats to obtain the mean temporal velocity of mitral valve flow. Systolic flow velocities below the zero line for the mitral traces were minimized by varying transducer position and sample volume sizes. These flow patterns, potentially representing reverse flow when present, were neglected in tracing the curves, that is curves were traced down only to the zero line for the mitral valve. Mitral valve volume flow (per min.) calculations were then performed using formula 2 for the simplified method.
Formula2 mitral flow area
Flow = (mean velocity x from annulus diameter x 60 cos e
20

-·:.-;· - --' ' -::.
---J ~
'I
Figure II.2
Still frames from four-chamber apical view and the derived Doppler recording from the animal study is shown in this figure for the mitral valve.
21

and using formula 3 for the method described by Fisher et al (1983).
Formula3 maximal2 D
Flow (mean velocity) x mitral flow area x (mean to-maximum-index) x 60
cos e
-flow in mllmin. -mean velocity in em/sec. -mitral flow area in cm2.
Repeatability of the measurements To determine repeatability and interobserver variability, all measurements were made in duplicate by investigators who are unaware of simultaneous EM flowmeter readiogs or of each other's results.
Statistical analysis Linear correlations were used to compare Doppler mitral valve flows of the original and simplified methods and the actual flows for both animal and clinical data. Paired !-tests were used to assess the differences of the methods.
Results
Animal studies A total of20 cardiac output values derived from Doppler velocity information and orifice areas by both methods, were compared to simultaneously obtained EMflow-meter-roller-pump recordings (range 1.4 to 7.71/min). Paired differences of the EM flowmeter measurements and the Doppler flows calculated according to Fisher's method had a mean value of 0.017 !/min and a standard deviation of 0.195 1/min. A paired t-test showed no significant differences (p < 0.01) between the measurements. Paired differences of the EM flowmeter measurements and the Doppler flows according to the simplified method obtained a mean value of0.1871/minand a standard deviation of0.3lllmin. No significant differences between these measurements were found. Since the standard deviation of the paired differences represents the reproducibility of the respective measurements, the Fisher method tends to have a better reproducibility, although the F-test applied to the variance ratio did not reach the p < O.Ollevel of significance.
22

Simple linear regression showed an apparent linear relationship between the EM flow meter readings and the Doppler flow measurements according to Fisher's method (Fig. 11.3A) and to Doppler flow measurements according to the simplified method (Fig.II.3B) respectively. Both regression equations yielded a slope close to one and an intercept close to zero. The inter- and intraobserver differences were less than 5%.
Clinical studies Ten Doppler derived cardiac outputs using the simplified method were compared to simultaneously obtained thermodilution cardiac output (range 1.2-5.8 !/min). Paired differences of the Doppler measurements (mean= 3.52; sd = l.7lllmin) and thermodilution readings (mean= 3.59; sd = 1.80 !!min) yielded a mean value of0.07llmin and a standard deviation of0.348 !/min. A paired t-test showed no significant differences (p < 0.01) between the two methods. The result of the simple linear regression between Doppler flow measurements and thermodilution measurements is shown in Fig. 11.4.
Discussion
Previous investigators and our previous studies have indicated that range gated two-dimensional Doppler echocardiography with fast Fourier transform signal processing offers a reliable non-invasive method for the calculation of cardiac output. The mitral valve orifice method as described by Fisher et al (1983), however, requires several views of the heart and multiple recordings (M-mode and 2D Doppler). These data are sometimes difficult to obtain especially in restless children or in adults in whom a clear short axis view perpendicular to the mitral leaflet tips may be difficult to obtain. Therefore in the present study we compared the mitral valve orifice method with a simplified valve annulus method which requires only one view from which the orifice area and Doppler velocity can be obtained. The option of flow calculation at the mitral valve as an additional site facilitates Doppler 'cross checks' of the cardiac output calculation obtained at other sites and is of specific interest for those dealing with the pediatric age group who undertake shunt quantification. We assume that the Doppler flow traces obtained in the mitral orifice are generated by bloodflow with a flat flow profile. This assumption is based on studies performed by Lynch and Bove (1968). They show a flat flow wavefront at the
23

Figure II.3
1 D DOPPLER MVO ..::L/MIN>
8
6
4
2
2
10 DOPPLER MV 4CH ..::L/MIN>
8
6
4
2
Y~ 0.96•X + 0.13 R= 0.994 SEE"' O. 19 l/MIN
8 10
0
Y~ 1.04*X + 0.06 R= 0.986 SEE= 0.31 l/MIN
ai-------,-------,-------~E~M~F~L~O~W~<~l~/~M~l~N~> o 2 4 6 e 10
Results for the animal studies according to the method described by Fisher et al (A) and those obtained by the simplified method (B). The linear regression between Doppler flows and the EM flow meter roller pump results are shown in this figure. The regression lines and the 90% confidence hyperbolae are drawn.
24

opening of the mitral valve by cineangiography. Similar flat flow profiles were obtained from the ascending aorta by Peronneau et al (1972) using pulsed Doppler techniques. Theoretical support is also provided by McDonald and Angelsen (McDonald, 1960; Angelsen, 1982) in their discussion about flow profile from flat to parabolic and the inlet length required therefore. New sophisticated multigate Doppler devices seem also to indicate a flat flow profile. The effects of respiration did not significantly change the measured mean temporal velocities. This differs from findings in our previous similar study of the tricuspid valve orifice (Meijboom et al, 1985). In the animal model this can be explained by the opened chest which diminishes the effect of respiration. In the human pilot study the number of patients may be too small to significantly separate the beat-to-beat respiratory variation and observer interpretation from the effect of respiration. Fisher et al (1983) showed that the length of the Doppler sample volume did not affect the accuracy of the measurements in the ascending aorta. In our study the size of the sample volume was varied only to obtain an optimal signal-to-noise relationship.
Figurell.4
7 DOPPLER MY 4CH <:L/MJN;.
6
s
4
3
2 Y"' 0.93•X + 0.17 R= 0.982 SEE= 0. 35 L/MIN
OI+-----,---,----,,---;CD~T~H~E~R~M~AL=-<~L~/~M~I~N>~ 0 2 3 4 s 6 7
Results of the clinical studies. The linear correlation between the averaged mitral valve flows on the ordinate and the thermodilution results on the abscissa are shown in this figure. The regression line and the 90% confidence hyperbolae are drawn. A very high correlation was obtained over a large range of flows, but with a slightly greater standard errror of the estimate than that obtained in the open chest canine studies.
25

We realize that the proposed method requires a substantial oversimplification of the mitral valve area but our results demonstrated flow calculations to have acceptable accuracy in the clinical setting. Ormiston eta! (!981), however, showed a change in mitral orifice circumference during the cardiac cycle with a sharp decrease in size during systole. In a recent study in our laboratory we found no significant difference in the timing of measurements of mitral valve diameter as long as the measurement was obtained in diastole (Chapter IV).
Conclusion
We have explored a simplified two-dimensional echo Doppler method for the quantitation of flow across the mitral valve orifice. The results in an open chest animal model and pilot studies in children suggest that this method may prove useful as an auxiliary site for non-invasively measuring cardiac output, especially in adults in whom a very clean short axis view perpendicular to the mitral valve leaflet may be difficult to obtain. The simplified method may be less accurate when compared to the Fisher mitral orifice Doppler flow method but may be more useful, especially in adults.
26

Chapter II
A Doppler echocardiographic method for calculating volume flow across the tricuspid valve: correlative laboratory and clinical studies
by
Erik J. Meijboom,M.D., Suzanna Horowitz, B.S., Lilliam M. ValdesCruz,M.D., David J. Sahn M.D., Douglas F. Larson, M.S., and Carlos Oliveira Lima, M.D.
The Dept. of Pediatrics, University of California San Diego School of Medicine, San Diego, California, U.S.A. and The Dept. of Pediatrics, University of Groningen, Groningen, The Netherlands.
Supported in part by a grant from the Hilekes Foundation, The Netherlands.
Published in Circulation 71, No.3. 551-556, 1985


Chapter II
Abstract
In this study we tested a two-dimensional Doppler echocardiographic method for measuring volume flow across the tricuspid valve. Five anesthetized, open-chest dogs had a calibrated electromagnetic flow probe placed on the ascending aorta. Volume flow across the tricuspid valve was controlled by creating a variable femoral-to-pulmonary arterial shunt. Since no standard plane Provided a direct view of the tricuspid valve orifice, tricuspid flow area was estimated by calculating a fixed ciruclar flow orifice from the maximal late diastolic diameter of the tricuspid anulus in a four-chamber view. Doppler-determined velocities across the tricuspid valve and tricuspid anulus images in the four-chamber view were obtained in inspiration and expiration. For 24 cardiac outputs (0.6 to 4.0 liters/min), inspiratory tricuspid flow determined by the Doppler method correlated minimally better (r = .90. SEE= 0.30 liter/min) than did expiratory measurements (r = .89, SEE= 0.35 liter/min) with the time-averaged systemic flow determined electromagnetically. Dopplerdetermined tricuspid volume flows in four-chamber and short-axis two-dimensional echocardiographic views from 10 children were then compared with values determined simultaneously by thermodilution during cardiac catheterization. In the children, Dopplerdetermined flows in short-axis and four-chamberviews, both in inspiration and expiration, were similar~ when results for the two views were averaged in inspiration and expiration, the tricuspid flows predicted by the Doppler method were highly correlated (r = .98, SEE = 0.48liter/min) with the results of thermodilution. The two-dimensional Doppler echocardiographic method provides a means of estimating volume flow across the tricuspid valve noninvasively.
Introduction
Noninvasive two-dimensional Doppler echocardiographic methods for calculating volume flow have achieved variable clinical accuracy mainly because of potential errors in obtaining the cross-sectional areas of flow and in estimating the angle between the direction of interrogation and the direction of flow (Goldberg et al, 1982; Waters et al, 1983).
29

Our experience, even when the circulation is intact, suggests that having several sites at which to determine flow allows a cross-check that increases the accuracy of Doppler-determined flow estimates and that combining sampling sites also provides methods for calculating shunts (Meijboom eta!, 1983; Valdes-Cruz eta!, 1983). Available sites previously studied by Doppler techniques include the mitral valve (Fisher eta!, 1983), pulmonary artery and aorta, and the right ventricular flow tract (Goldberg eta!, 1982; Meijboom eta!, 1983; Stewart eta!, 1983). In this study we explored a method for measurement of volume flow across the tricuspid valve orifice by two-dimensional Doppler echocardiography in an openchest dog preparation and in a small clinical population of children undergoing cardiac catheterization.
Methods
Surgical technique aud auimal preparation Five mongrel dogs weighing 20 to 30 kg were anesthetized with sodium pentobarbital (30 mg/kg), intubated, and ventilated with a standard Harvard volume pump respirator. Tidal volume was set at 100 to 150 cc once the chest was open, and the ventilatory rate was 20 to 25/min. A median sternotomy was performed and the pericardium was opened. The ascending aorta and the main pulmonary artery were dissected and cleaned of fat and adventitia, and an appropriately sized, previously calibrated electromagnetic flow probe (Gould-Statham SP2204) was placed around the ascending aorta 2 em above the aortic valve. Adequate contact of the cuff was verified by recording phasic aortic flow tracings. The right femoral artery was then dissected, cannulated, and connected to a roller pump by 3/8 inch tubing. The return end of the roller pump tubing was attached to a cannula inserted and fixed into the main pulmonary artery through a purse-string suture (Fig. 11.5). The roller pump had been previously calibrated by measuring flow rates with a stopwatch and a graduated cylinder. Ascending aortic flow was measured with the electromagnetic flowmeter reading and left-to-right shunt volume was the measured flow through the roller pump. Systemic blood flow, calculated as systemic venous return at the tricuspid valve, was equal to ascending aortic flow determined by the electromagnetic flowmeter minus the roller pump volume. Continuous electromagnetic flow recordings were obtained throughout the study for comparison with Doppler-determined flows. After each step-by-step change in shunt size achieved by altering pump settings, a period of 2 min was allowed to elapse after the electromagnetic flowmeter reading stabilized before any Doppler recordings were made.
30

t
Femoral A.
I Figure II.5
Diagrammatic representation of the surgical animal preparation used to vary tricuspid valve flow. A femoral arterial cannula was connected via 3/8 inch tubing to a previously calibrated roller pump. The return end of the roller pump tubing was attached to a cannula inserted and fixed into the main pulmonary artery through a purse-string suture. Systemic venous return (and therefore tricuspid valve flow) was varied by changing the roller pump setting. See text for details (Reproduced from Meijboom et al. 1983).
31

Ultrasound and Doppler methods Ultrasound imaging and Doppler studies were performed with a commercially available range-gated, pulsed Doppler unit (Electronics for Medicine Honeywell). The unit contains a 3.5 MHz single-element transducer mechanically swept through a 30 to 75 degree arc to achieve real-time two-dimensional echocardiographic imaging at 30 frames/sec. The scanner could be stopped along any line within the image and a Doppler sample volume could be positioned at any depth along that line. This permitted precise localization of the sample volume and determination of the angle between the direction of Doppler sampling and direction of flow within the plane of imaging. The sampling angle relative to the direction of flow within the elevational or azimuthal plane, i.e. the plane perpendicular to the plane of imaging, could not be determined: however, potential errors in sampling angle were minimized by slight changes in transducer and sample volume position until the cleanest spectral display and audio signal were obtained. Small deviations from sampling exactly parallel to flow (angles ofO or 180 degrees) were of no practical importance, since the cosine of the sampling angle would still be close to unity (see formula I). Sample volume lengrh was variable between 2 mm and 2 em and was usually set at 5 mm in these studies. Sample volume width in a water tank at 6 dB was ± 2 mm at 4 to 8 em depth and was not variable. The operational mode of the scanner could be switched from real-time imaging to spatially oriented Doppler sampling in less than 0.1 sec. In Doppler mode, signals were sampled at a pulse repetition frequency of 13.000 samples/sec when the signal was obtained from a depth less than 6 em, resulting in a maximal nonambiguously detectable velocity of± 143 em/sec, and were sampled at a frequency of 7800 samples/sec at a depth of 6 to 12 em, resulting in a maximal nonambiguously detectable flow velocity of 85 em/sec at 0 degrees sampling angle. Two outputs of the Doppler frequency shift were available: an audio signal and a quantitative fast Fourier transform spectral analysis of the Doppler shift sampled at 200 times/sec. The Doppler spectral output was converted automatically by the scanner to flow velocity (em/sec) with the formula
fl 1 . (frequency shift) x (velocity of sound in blood)
owve ocity= 2 (transmitted frequency) (cos 8)
(I)
The sampling angle 8, i.e. the angle of incidence between direction of flow and the Doppler sample volume, was determined manually with a protractor directly from the freeze frame of the two-dimensional image that showed the sample volume position relative to the imaged cardiac structures. Correction for the angle (j was applied manually in formula 2 rather than in formula I (see below). The tricuspid valve flow area was determined from an apical four-chamber view.
32

The diameter of the tricuspid anulus was obtained by anterior/posterior angulation of the transducer and was measured as the maximal diastolic diameter between insertion points of the septal and anterior tricuspid valve leaflets. The diameter was converted to tricuspid flow area with the equation rr (D/2)2 • The Doppler sample volume was then placed within the right ventricular inflow tract beyond the tricuspid valve for recording of velocities. Once the optimal twodimensional image and Doppler wave forms were obtained for inspiration or expiration, they were recorded on strip chart and/ or videotape. The volume flows across the tricuspid valve were calculated by Doppler techniques as described below.
Human population To evaluate the clinical usefulness of the method, 10 children (6months to 18 years of age, mean 7.2 years) were studied at rest in the catheterization laboratory during a clinically indicated elective cardiac catheterization after standard sedation with meperidine and chlorpromazine. The patients had aortic stenosis (n = 7), aortic coarctation (n = 2), or rheumatic mitral valve disease (n = 1), and none had tricuspid valve disease and/ or intracardiac shunts at atrial or ventricular level. Cardiac outputs determined by thermodilution were performed with an Edwards 9510-A system as an average of three measurements, one before and two after obtaining the Doppler data. Doppler echocardiographic flow studies and imaging of human tricuspid valves (Figs. IL6 and !1.7) were performed both in fourchamber and short-axis views and were compared with the results of the thermodilution studies. The procedure for obtaining the flow data and the tricuspid orifice area in inspiration and expiration was similar to that used in the animal studies for the four-chamber recordings (Fig. !1.6). Doppler flow waveforms and maximal diastolic anulus diameter were also obtained in inspiration and expiration from short-axis views (Fig. IL 7). As in the dogs, tricuspid annular diameter was converted to flow area using the equation rr (D/2)2
• A Doppler sample volume length of I to 2 em was used in human studies.
Digitizing methods: calculation of mean temporal flow The mean flow velocities as a function oftime for the tricuspid valve were obtained by digitizing and integrating the area under three consecutive RR intervalmatched Doppler flow velocity curves with a minicomputer. To accomplish this, we traced the middle of the densest portion of the gray scale spectral display of the Doppler velocity curves (this is the modal velocity shift: the velocity most frequently present in the returning signal). Flow curves were traced to zero during systole, ignoring any low velocity forward or reverse flow recorded when the tricuspid valve was closed. The minicomputer divided the velocity time integral for
33

, d I I 1,,, 1 , I , I , I • 1 , I , l , J , I , I • J , I , I , I • I , 1
Figure 11.6
Still frames from four-chamber apical views and the derived Doppler recordings from two clinical studies. Left, recorded during inspiration~ right. recorded during expiration. RV = right ventricle; LV = left ventricle; RA = right atrium; LA = left atrium; SV = sample volume.
the 3 complete beats by the time of the 3 beats to obtain mean flow velocity across the tricuspid valve with respect to time. Calculations of volume flow across the tricuspid valve were then performed with the formula
flow= mean flow velocity x tricuspid anulus area x 60 sec/min cos e
Repeatability of the measurements
(2)
To determine repeatability and interobserver variability, all measurements for the animal and human studies were made in duplicate by two investigators who were unaware of the simultaneous electromagnetic flowmeter readings or of each other's results.
34

.l.t.t.t.t.t.t.t.t.t.t.!,l,l,l,t.t.t.t.t:t.t.l.!.l.t.t.l,t.t.ll I , I , l , I , l , l , I , I , l , I , I , I , I • I , I , l ,
Figure 11.7
Still frames of the parasternal, short -axis view and the derived Doppler recording from the same patient. Left. recorded during inspiration; right, recorded during expiration. Note the slightly higher velocities obtained during inspiration. Ao= aorta; other abbreviations as in Fig. 11.6.
Statistical analysis Linear correlations were used to compare Doppler-determined flows across the tricuspid valve to actual flows for both the animal and clinical data. Paired t-tests were used to assess measurement repeatability and inter observer variability.
35

Results
Animal studies A total of 24 values for tricuspid valve cardiac output derived from Doppler velocity information and varying from 0.6 to 4.0 liters/min, were calculated and compared with simultaneously obtained electromagnetic flowmeter-roller pump calculated systemic blood flow. Angle corrected peak early diastolic Doppler velocities across the tricuspid valve ranged from 35 to 83 em/sec (all sampled at <6cm depth) and were highest during late inspiration; angle-corrected transvalvular temporal mean flow velocities ranged from 6.1 to 15.3 em/sec. Spectral width (6dB) on these tracings varied from 8 to 21 em/sec. The angle between the sampling cursor and the direction of the tricuspid flow varied from 0 to 30 degrees (mean 19 ± 2.51 SEI). The linear regression between Doppler-determined flows and the results obtained electromagnetically in inspiration yielded a comparable correlation coefficient to that obtained for the expiration studies (r = .90, SEE= 0.3liter/min and r = .89, SEE= 0.35 liter/min, respectively) (Fig. 1!.8). These were not statistically different.
TV FLOW- IIIISPIRATION
5 /
/ "2 / ·;; 4 / • /
'- / /
"' / /
/ / :;: / / 0 3 / / ~ / / ~ / • / c: . •' • / ~ 2 ./ /. .. /
y = 0.89x +0.23 0.. / . / 0.. / ij. / R=O.SO 0 / .. /
SEE=::'::O.J Umin 0 .. .,. / /:.. / . // 00 1 2 3 4 5
SYSTEMIC FLOW (L!min) (Asc. Ao. EM Flow- Roller Pump)
Figure II.8
5
:;: 3 0 ~ ~
c: ~ 2 0.. 0.. 0 0
TV FLOW- EXPIRATION
0o~~,~~2~~3~~4-L~5-'
SYSTEMIC FLOW (L/min) (Asc. Ao. EM Flow- Roller Pump)
Results from the animal studies. showing the linear regression between Dopplerdetermined flows and the electromagnetic flowmeter/roller pump results. The dotted lines represent the 95% confidence limits for the regression relationship. Results obtained in inspiration (left) were slightly better than those obtained during expiration (right).
36

Differences in interobserver variability and repeatability for measuring the same tracings were under 5%.
Clinical studies Ten Doppler-derived cardiac outputs, obtained by the tricuspid valve orifice method in both four-chamber and short-axis views, were compared with simultaneously obtained thermodilution cardiac output measurements from 1.2 to 9.6 liters/min, which when indexed to the patients' body surface area ranged from 3.6 to 9.2 liters/m2/min. For the children, Doppler-derived, angle-corrected peak velocities across the tricuspid valve ranged from 38 to 80 em/sec and were highest in early inspiration. Angle~corrected temporal mean velocities across the tricuspid valve ranged from 8.2 to 18.4 em/sec. The angle of sampling was less than 20 degrees (mean 12.3) for all four-chamber views and less than 35 degrees (mean 17.6) for short-axis views. For this limited clinical series, volume flow results obtained from the two echocardiographic views both in inspiration and expiration were not statistically separable; therefore the mean ofthe four measurements was used for analysis to achieve the best sample averaging over time. When calculated as an average of the two views over the entire respiratory cycle, Dopplerdetermined flow across the tricuspid valve was highly correlated with the thermodilution results (r = .98, SEE = 0.43 liter/min) (Fig. II.9). Correlation of the
Figure 11.9
10
~ 6
~ 4 ~ ~ 0 0 2
PATIENT RESULTS
Results of the clinical studies, showing the linear correlation between the averaged flows across the tricuspid valve on the ordinate and the thermodilution results on the abscissa. A very high correlation was obtained over a large range of flows. but with a slightly greater SEE than that obtained in the open-chest canine studies. The dotted lines represent the 95% confidence limit for the regression relationship.
37

thermodilution- and Doppler-determined flows indexed to the body surface area was also high (r = .96. SEE= 0.54liter/m2/min). Interobserver variability and differences of results on repeated measurements by the same observer were also less than 5% for the clinical studies.
Discussion
Previous studies have indicated that range-gated two-dimensional Doppler echocardiography offers a reliable noninvasive method for measuring cardiac output by calculating cardiac flow at various locations (Fisher et al. 1983; Goldberget al. 1982; Meijboom et al. 1983; Stewart et al. 1983; Val des-Cruz et al, 1983; Waters et al, 1983). The present study validates the tricuspid valve as an additional sampling site for two-dimensional Doppler echocardiographic calculation of intracardiac flow.
When using the tricuspid valve, we encountered the problem of not being able to obtain a satisfactory cross-sectional image of the entire valve orifice itself as we had obtained previously for our studies of mitral valve flow (Fisher et al, 1983). Therefore we assumed the orifice to be of circular shape and maximal in late diastole so it could be estimated from the diameter derived from a single fourchamber or short-axis view, realizing that this was an oversimplification of a complex and dynamic tricuspid valve and anulus structure (Tei et al, 1982). Although we did not attempt to measure diameters from subcostal short-axis vi_ews, imaging in this plane, when possible, would serve as an additional crosscheck if care were taken to maximize the diastole annular diameter. Nonetheless, in spite of these assumptions and oversimplifications, our results demonstrate acceptable accuracy for this method even in the clinical setting. In the presence of tricuspid regurgitation, the forward volume flow measured across the valve would not be total forward cardiac output since a fraction of it would actually be the regurgitant volume. Quantitation of total tricuspid forward flow, however, should still be possible with this technique and, if combined with flow measurement at another cardiac site, would allow estimation of regurgitant volume. In the animal preparation we noted distinct differences in the Doppler-derived flow curves during inspiration and expiration in spite of the absence of negative intrathoracic pressure in the open-chest dog. These flow differences might be explained by a decrease in afterload resulting from a forced expansion of the lungs
38

by the respirator. In these animals, the electromagnetic flowmeter and roller pump averaged inspiratory and expiratory events, but the Doppler studies recorded during inspiration had a slightly lower scatter and a closer correlation to the reference standard for systemic blood flow than those Doppler values obtained in expiration. In our initial human studies, although velocities in general were slightly higher in inspiration (Figs. 1!.6 and 11.7), no systematic statistical difference in calculated volume flows could be demonstrated. We believe that in the clinical setting it is probably correct to average inspiratory and expiratory flow waveforms and to use diastolic tricuspid diameters in whichever view or phase of respiration they may be most clearly imaged to derive an averaged single estimate of tricuspid flow as we did in this pilot study. The short-axis view has the advantage of allowing flow to be measured at a short distance from the transducer, but for many adults the apex may be the only acceptable echo window. It may also provide the only view in which an image of the tricuspid valve insertions can be obtained. Although a variety of methods for calculating volume flow by two-dimensional Doppler echocardiographic methods have been described, they are all subject to errors related to the angle of sampling and to determination of direction of flow, the flow area, flow profile, and potentially, the Doppler velocities themselves. The relative accuracy of the various sampling sites most commonly used has only recently been examined (Stewart et al, 1983). We believe that since any one sampling site may be subject to error in any one examination, a method providing multiple sampling sites will allow cross-checks and, despite prolonging the examination time, may improve the accuracy of the final results. Further, the apical window is still usually available even in some adults who may be difficult to study from other sites; therefore, in the absence of tricuspid valve disease the tricuspid flow may be used as a cross-check for aortic, mitral, or pulmonary flows estimated noninvasively. Furthermore, in children with intracardiac shunts, the tricuspid flow can often be used to provide one parameter for the noninvasive estimation of a pulmonary-to-systemic flow ratio. For example, in the method we described previously for estimation of systemic-to-pulmonary shunt ratios in the presence of extracardiac shunts, pulmonary flow was estimated at the level of the mitral valve and systemic flow in the subvalvular right ventricular outflow tract proximal to the pulmonary valve in a short-axis view (Meijboom et al, 1983). The tricuspid valve could serve equally well in that method as a site for estimating systemic blood flow by Doppler echocardiography. In the commonly used method for estimating shunt size in patients with atrial septal defects, flows in the pulmonary artery and aorta are calculated by Doppler techniques from two different views. Alternatively, in patients with atrial defects, the tricuspid valve could serve as a site for measuring pulmonary flow by Doppler techniques, which when compared
39

with the mitral valve would potentially permit calculation of pulmonary-tosystemic flow ratio from a single apical four-chamber view. Other than the necessity of averaging inspiratory and expiratory Doppler waveforms, the tricuspid valve method differs little from previously described methods and our results suggest that anulus diameter may be derived from a short-axis view, a fourchamber view, or an average of both.
Thus, because it appears accurate and easy to perform and has potential applications as an alternative means for estimating cardiac output or for noninvasive calculation of shunt size, we believe this method may be an important addition to the growing body of Doppler echocardiographic methods in clinical cardiology.
Conclusion
We have explored a two-dimensional Doppler echocardiographic method for quantitating flow across the tricuspid valve. Our results in an open-chest animal preparation and pilot studies in children suggest that this method may prove useful because it uses an auxiliary site for noninvasively measuring cardiac output. It also provides a potential method that may prove useful for estimating tricuspid valve flow in patients with congenital heart lesions such as atrial septal defects, total anomalous pulmonary venous drainage, and other atrial level shunts.
40

Chapter III
A two-dimensional Doppler echocardiographic method for calculation of pulmonary and systemic blood flow in a canine model with a variable-sized left-to-right extracardiac shunt
by
Erik J. Meijboom, M.D., Lilliam Valdes-Cruz, M.D., Suzanna Horowitz, B.S., David J. Sahn, M.D., Douglas F. Larson, M.S., Kent A. Young, Carlos Oliveira Lima, M.D., Stanley J. Goldberg, M.D. and Hugh D. Allen, M.D.
The Dept. of Pediatrics, University of Arizona, Health Sciences Center, Tucson, U.S.A. and The Dept. of Pediatrics, University of Groningen, Groningen, The Netherlands
This study was supported in part by a grant from the Jan Komelis de Cock Foundation, The Netherlands.
Published in Circulation 68, No.2, 437-445, 1983.


Chapter III
Abstract
The purpose of this study was to validate a two~dimensional range-gated Doppler echocardiographic method for measurement of pulmonary and systemic blood flow in a canine model with a surgically created extracardiac systemic-to-pulmonary shunt, the size of which could be varied. In five anesthetized open-chest dogs, a previously calibrated electromagnetic (EM) flowmeter was placed around the ascending aorta, and the femoral artery was dissected, cannulated, and connected to a previously calibrated roller pump. The return tubing from the roller pump was inserted into the main pulmonary artery to create a variable-sized systemic-to-pulmonary artery shunt. In this preparation with intact ventricular and atrial septa, pulmonary blood flow volume was measured as flow from the ascending aorta with the EM flowmeter probe; left-to-right shunt volume was measured from the calibrated roller pump flow, and systemic flow was measured by subtraction of roller pump flow from the EM flowmeter reading of the ascending aorta. In two additional dogs, a 16 mm diameter, 12 em long Teflon graft was placed between the descending aorta and the main pulmonary artery to mimic more closely a patent ductus arteriosus. Flow through the shunt was measured with an EM flowmeter probe placed around the graft. Systemic and pulmonary flows were then calculated by a Doppler echocardiographic method from RR interval-matched beats and compared with simultaneously recorded EM flowmeter measurements from the ascending aorta, and left-to-right shunt flows to permit comparison of pulmonary and systemic flows and their ratios (QP:QS) by both methods. Doppler systemic flow was measured as systemic venous return at the right ventricular outflow tract. The size of the outflow tract and mean flow as a function of time were obtained by echocardiographic imaging and interrogation of the outflow tract from a short-axis view. Pulmonary blood flow could not be measured at the pulmonary artery because of high multidirectional velocities and spectral broadening of the flow curves similar to those obtained in children with patent ductus arteriosus. Therefore, pulmonary blood flow was measured as pulmonary venous return through the mitral valve. The mitral orifice was measured from a short-axis view, and Doppler flow curves were recorded from the apical four-chamber view. For 26 left-to-right shunts, excellent correlations were obtained between Doppler echocardiographic and EM flowmeter measurements of pulmonary flows (range 1.2 to 7.7l/min; r = .99, SEE=± 0.16l/min), systemic flows (range 0.6 to 5.7l/min; r = .99, SEE=± 0.13), and QP:QS ratios (range 0.9:1 to 4.2: I; r = .96, SEE = ± 0.21: I). Our study validates the accuracy of this Doppler echocardiographic method to measure pulmonary and systemic flows and their ratios in the presence of extracardiac aortic-to-pulmonary artery shunts.
43

Introduction
Our previous studies and those of other investigators have demonstrated that two-dimensional Doppler echocardiographic methods are accurate for noninvasive calculation of cardiac flows in the intact circulation in man (Angelsen and Brubakk, 1976; Colocousis eta!, 1977; Darsee eta!, 1980; Fisheret a!, 1982, 1983; Friedman eta!, 1980; Magnin eta!, 1981; Steingart eta!, 1980). Our own work has also shown that Doppler echocardiography accurately measures pulmonary and systemic flows and their ratios, even in the presence oflarge intracardiac shunts in animal models (Valdes-Cruz eta!, 1982). Our purpose was to assess the accuracy of systemic and pulmonary flows measured with a quantitative two-dimensional range-gated Doppler flowmeter in an open-chest canine model with a variablesized, surgically created, extracardiac aortic-to-pulmonary shunt.
Methods
Surgical technique and animal model Seven mongrel dogs weighing 20 to 30 kg were anesthetized with pentobarbital sodium (30 mg!kg), intubated and ventilated with a standard volume pump. A median sternotomy was performed and the pericardium was opened. The ascending aorta and the main pulmonary artery were dissected, cleaned of fat and adventitia, and a previously calibrated electromagnetic (EM) flowmeter probe of appropriate size (Gould-Statham SP2204) was placed around the ascending aorta 2 em above the aortic valve. Adequate contact of the flowmeter cuff was verified by recording phasic aortic flow tracings. In five dogs, the right femoral artery was dissected, cannulated, and connected to a roller pump by 3/8 inch tubing. The return end of the roller pump tubing was attached to a cannula inserted and fixed into the main pulmonary artery through a purse-string suture (Fig. !II. I). The roller pump had been previously calibrated by measurements of flow rates with a stopwatch and a graduated cylinder. In this model with intact atrial and ventricular septa, pulmonary blood flow was measured as the flow from the ascending aorta by the EM flowmeter reading; left-toright shunt volume was the measured flow through the roller pump, and systemic blood flow was equal to the flow from the ascending aorta as determined by the EM flowmeter minus the roller pump volume. In an additional two dogs, a 16 mm diameter, 12 em long Gortex shunt was sewn between the descending aorta and the main puhnonary artery within the thorax to simulate more closely a ductus arteriosus or the surgically created, palliative,
44

t
Fe;,oral A.
\
Figure lll.l
Diagram of the extracorporeal shunt model that demonstrates the interposition of the roller pump between the femoral artery and the main pulmonary artery. SVC =superior vena cava~ IVC = inferior vena cava~ RA = right atrium; LA = left atrium: RV = right ventricle~ LV= left ventricle; PA =pulmonary artery~Ao =ascending aorta; Femoral A= femoral artery.
45

systemic-to-pulmonary artery shunts used clinically. An EM flowmeter probe was placed around the ascending aorta as described above, and another one was placed snugly around the Gortex tubing close to the pulmonary-arterial end. Selective constriction of the tubing at the aortic end allowed variations of shunt size. As before, pulmonary blood flow equaled flow from the ascending aorta as determined by EM flowmeter values; left-to-right shunt volume was measured by the flowmeter probe at the Gortex shunt, and systemic flow was determined by pulmonary blood flow minus left-to-right shunt flow. Continuous EM flowmeter recordings were obtained throughout the study for comparison with Doppler-determined flows. After each step-by-step change in shunt size, achieved by an alteration of punp setting or by degree of Gortex-shunt constriction, a stabilization period of 2 min was allowed and constancy of EM flowmeter readings was observed before any Doppler echocardiographic recordings were made. Doppler measurements of pulmonary and systemic flow were performed as described below for each shunt size, and were matched to each other, to the simultaneous flowmeter measurements, and to the roller pump settings to permit calculation of pulmonary/systemic ratios (QP:QS) by both Doppler echocardiography and EM flowmeter measurements.
Ultrasound and Doppler methods Ultrasound imaging and Doppler echocardiographic studies were performed with a commercially available range-gated pulsed Doppler unit (E forM/ Honeywell). The unit contains a 3.5 MHz single-element transducer that mechanically sweeps through a 30 to 75 degree arc to achieve real-time two-dimensional echocardiographic imaging at 30 frames/sec. The scanner can be stopped along any line within the image and a Doppler sample volume can be positioned at any depth along that line; this permits localization of the sample volume and estimation of the angle between the direction of Doppler sampling and the direction of flow within the plane of imaging. The sampling angle relative to the direction of the flow within the elevational or azimuthal plane, that is, the plane perpendicular to the plane of imaging, could not be determined; however, small deviations from sampling exactly parallel to flow (angles= 0 or 180 degrees) were of no practical importance, since the cosine of the sampling angle would still be close to unity (see formula 1 ). Sample-volume length was variable between 2 mm and 2 em and was usually set at 5 mm in these studies. Sample-volume width in a watertank (that is, the lateral displacement of a transducer required to produce an amplitude fall-off to half-maximum intensity for the returning Doppler signal [6dB] from a moving stringtarget)was ± 1.8 mm between2and4cmindepthand± 2mmat4to 8 em in depth (Walker et a1, 1982). Sample-volume width was not variable. The operational mode of the scanner could be switched rapidly from real-time imaging
46
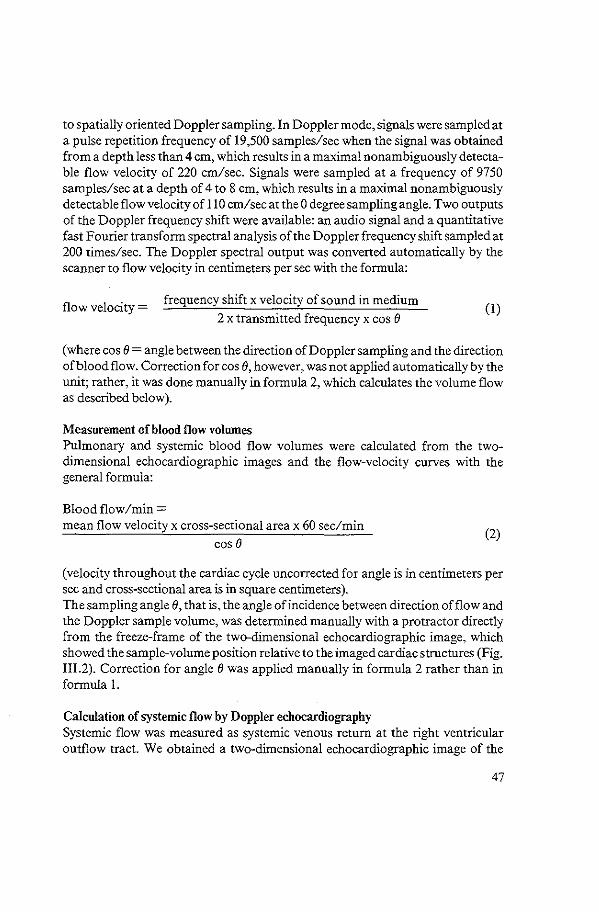
to spatially oriented Doppler sampling. In Doppler mode, signals were sampled at a pulse repetition frequency of 19,500 samples/sec when the signal was obtained from a depth less than 4 em, which results in a maximal nonambiguously detectable flow velocity of 220 em/sec. Signals were sampled at a frequency of 9750 samples/sec at a depth of 4 to 8 em, which results in a maximal nonambiguously detectable flow velocity of 110 em/sec at the 0 degree sampling angle. Two outputs of the Doppler frequency shift were available: an audio signal and a quantitative fast Fourier transform spectral analysis of the Doppler frequency shift sampled at 200 times/sec. The Doppler spectral output was converted automatically by the scanner to flow velocity in centimeters per sec with the formula:
flow velocity= frequency shift x velocity of sound in medium
2 X transmitted frequency X COS 0 (!)
(where cos e =angle between the direction of Doppler sampling and the direction of blood flow. Correction for cos e, however, was not applied automatically by the unit; rather, it was done manually in formula 2, which calculates the volume flow as described below).
Measurement of blood flow volumes Pulmonary and systemic blood flow volumes were calculated from the twodimensional echocardiographic images and the flow-velocity curves with the general formula:
Blood flow/min= mean flow velocity x cross-sectional area x 60 sec/min
cos e (2)
(velocity throughout the cardiac cycle uncorrected for angle is in centimeters per sec and cross-sectional area is in square centimeters). The sampling angle e, that is, the angle of incidence between direction of flow and the Doppler sample volume, was determined manually with a protractor directly from the freeze-frame of the two-dimensional echocardiographic image, which showed the sample-volume position relative to the imaged cardiac structures (Fig. IIL2). Correction for angle e was applied manually in formula 2 rather than in formula L
Calculation of systemic flow by Doppler echocardiography Systemic flow was measured as systemic venous return at the right ventricular outflow tract. We obtained a two-dimensional echocardiographic image of the
47

--.-::- ' --.::-=::- -
ll~1E 6~o2f.' 13? I I
" _J - ,..J\-
Figure III.2
Top: parasternal short-axis image of the right ventricular outflow tract with the Doppler sample volume (SV) positioned proximal to the pulmonary valve (PV). Ao = aorta. Bottom: Doppler velocity curve derived from the outflow tract.
48

right ventricular outflow tract by positioning the transducer over the right ventricular body, aiming superiorly in a short-axis plane (Fig. III.2). The Doppler sample volume was positioned within the outflow tract, below the pulmonic valve, as parallel as possible to the assumed direction of flow as determined by visual examination within the plane being imaged. Once the optimal two-dimensional echocardiographic image and Doppler flow curves were obtained and the sample volume was confirmed to be as parallel as possible to the assumed direction of flow (angle e = 0 degrees), a still frame of the two-dimensional echocardiographic image and the fast Fourier output of the Doppler frequency shift were recorded on a strip chart at a paper speed of 100 mm/sec and on video tape (Fig.III.2). We obtained mean Doppler flow velocity over time by digitizing and integrating the area under the Doppler waveform over three complete cardiac cycles with a Numonics minicomputer (see below). The cross-sectional area of the right ventricular outflow tract was derived from the maximal systolic inner diameter of the outflow tract in a direction parallel to the plane of the pulmonic valve and at a point proximal to it. The measurement was not corrected for variation of right ventricular outflow tract size during the cardiac cycle.
Calculation of pulmonary flows by Doppler echocardiography The pulmonary artery could be imaged, but pulmonary flows could not be quantitated within the main pulmonary artery because the left-to-right shunt that occurred in this area caused spectral broadening of the Doppler flow signals, multidirectional flows, and velocities above the Nyquist limit; this precluded pulmonary artery flow measurement by the Doppler technique. In other sites within the pulmonary artery, a bidirectional pattern with reverse shunt flow toward the pulmonary valve was obtained; however, it was unclear over which flow area of the pulmonary artery this flow pattern would be integrated (Fig. Ill.3). This pulmonary flow pattern closely mimicked patterns found in children with patent ductus arteriosus. Pulmonary flow determined by Doppler echocardiography was therefore measured as pulmonary venous return, that is, flow through the mitral valve orifice. We calculated transmitral flow by placing the transducer at the cardiac apex and by echocardiographic imaging in a four-chamber view. The Doppler sample volume was placed within the left ventricular outflow tract distal to the mitral valve leaflets and lateral to the outflow tract. Once the optimal two-dimensional echocardiographic image and Doppler wave curves were obtained, they were recorded on a strip chart at a paper speed of 100 m/sec and on video tape (Fig. Ill.4). The Doppler flow curves obtained from the mitral valve were digitized and integrated with the minicomputer to calculate the mean temporal flow velocity in the mitral valve (see below).
49

PA FLOW -'PDA• 'TIME 35,32.933
8 CM -135 C~ISEC
Figure 1!1.3
Example of the Doppler flow curve derived from the main pulmonary artery with the Gortex graft completely opened. Note the spectral broadening and multidirectional flow pattern with diastolic flow toward the transducer and the pulmonary valve.
We obtained flow area of the mitral valve by positioning the transducer over the atrioventricular ring and scanning in a short-axis plane. A gated stop frame over the maximal diastolic mitral valve orifice on a two-dimensional echocardiographic image was recorded. Maximal orifice area was digitized along the inner contours of the two-dimensional echocardiographic image of the mitral leaflet. Since the mitral valve is not maximally opened during the entire diastolic time, a correction factor for the phasic diastolic movement of the valve was calculated as the mean-to-maximal leaflet separation from the derived M-mode tracing. The maximal two-dimensional echocardiographic image of the mitral valve orifice was multiplied by the mean-to-maximal leaflet separation ratio to arrive at the effective mitral valve orifice throughout the entire period of diastole (Fisher eta!, 1983; Valdes-Cruz eta!, !983).
50

I , I
Figure III.4
Top left: parasternal short -axis view of the mitral valve orifice. The maximal valve orifice is obtained by gating the real-time two-dimensional echocard.iographic image to a simultaneous electrocardiogram. The maximal valve area is determined by digitization of the inner contour of the valve orifice (black dots) and a correction factor for phasic mitral diastolic variation is calculated as the ratio of mean-to-maximal leaflet separation from the drived M-mode trace (bottom left, see text for details). Top right: apical view of the left ventricle (LV) with sample volume (SV) positioned at the left ventricular inflow area. LA = left atrium. Bottom right: the Doppler mitral inflow velocity is shown. The dotted line shows how this flow record was traced.
Digitizing methods: calculation of mean temporal flow The mean flow velocities as a function of time for the right ventricular outflow tract and mitral valve were obtained by digitization and integration of the area under the Doppler flow velocity curves over three consecutive RR intervalmatched beats. To accomplish this, the middle of the densest portion of the grey scale spectral display of the Doppler velocity curves was traced (this is the modal velocity shift that is most frequently present in the returning signal). The minicomputer divided the velocity-time integral for the three complete beats by the
51

time of the three beats to obtain mean right ventricular outflow tract flow velocity or mitral flow velocity as a function of time. Diastolic flow velocities above the zero line for the right ventricular outflow tract and systolic flow velocities below the zero line for the mitral traces were minimized by changes in transducer position and sample-volume sizes. These flow patterns, which potentiallly represent reverse flow when present, were neglected when the curves were traced: that is, curves were traced only down the zero lines in systole for mitral valve and in diastole for the outflow tract. All curves used for comparison of pulmonary blood flow and systemic blood flow were obtained at equivalent heart rates. As a measure of the presence or absence of turbulence, spectral width of the Doppler curves (em/sec) were measured with the minicomputer at the time of peak flow, in systole or in diastole. The measurement included the width of the grey scale spectrum at peak flow and was cross-checked against a quantized log spectral display that allocates the darkest gray scale to the entire range of velocity present within± 6 dB of the spectral mean (Fig.!II.5).
Reproducibility of measurements To determine reproducibility, all measurements were made in duplicate on the same tracing by the same investigator. To test interobservervariability, all measurements were made independently by investigators who were unaware of the simultaneous EM flowmeter readings or of each other's results.
Statistical analysis Linear correlation was used to compare Doppler pulmonary and systemic flows and QP:QS ratios with those obtained by the combination of EM flowmeters and roller pump. A paired t test was used to assess interobservervariability and errors in reproducibility.
Results
In the seven experimental animals, 26 different sized shunts were obtained. Each animal had a minimum of two and a maximum of eight different shunt magnitudes recorded. We derived 22 shunts from the five dogs with the femoral artery-topulmonary artery shunts and four shunts from two animals with the Gortex shunts. Systemic blood flows derived from the combined EM flowmeter-roller pump
52

10 tl -85 CIIS
18 Ca •S' CIIS
I I I I I I I I l I I l I I I I t I I I
Figure !1!.5
Two recordings illustrate the determination of spectral width from a Doppler display. Top: linear (LIN) allocation of gray scale shows the darkest area as the modal velocity. Our measurement of spectral width includes the width of the gray scale spectrum at peak flow. Bottom: quantized logarithmic (LOG) display of the Doppler signal allots the darkest gray scale intensity to all spectral values within± 6 dB of the spectral mean. Spectral width at peak flow in the upper trace was 17 em/sec, and in the lower trace it was 20 em/sec, as shown by t..
53

6 A c 5
~ 4 3: .2 3 u. :;; c. 2 Q. 0
" 0
0
Figure lll.6
2 3
r:Q.99 SEE:t:O.t34 y:::0.968x +0.073
4 5 6
8 c E ~ 3: .2 u. :;; c. Q.
8
8
6
4
2
0 0 2 4
r:::0.99 SEE:;t0.164 Y=0.963x +0.11
6 EM Flow-Roller Pump ::;; Systemic Flow (Umin)
EM Flow (Umin) = Pulmonruy Blood Flow (Limin)
c 5:1
4:1
0..~ 3:1 0 :;; 8: 2:1 8
1:1 r:0.96 SEE:;t0.21 Y=0.913x +0.147
~'f---,--------,-----,-,---,---, 1:1 2:1 3:1 4:1 5:1
EM and Roller Pump QP:QS
8
Regression analyses that correlate Doppler flows to the simultaneous reference flows for systemic (A) and pulmonary (B) blood flows, and derived QP:QS (C). The 95% confidence limits for the data points are shown by the dotted lines (see text for details).
measurements ranged from 0.6to 5.7!/min; pulmonary flows determined by the EM flowmeter probe around the ascending aorta ranged from 1.2to 7.7!/min, and QP:QS ratios ranged from 0.9:lto 4.2:1. One Doppler measurement of the right ventricular outflow tract was discharged because of an inadequate two-dimensional echcardiographic image. All Doppler measurements of the mitral valve were acceptable. This resulted in 26 Doppler pulmonary flows that ranged from 1.2to 7 .6!/min, 25 Doppler systemic flows that
54

ranged from 0.7 to 5.6!/min, and 25 Doppler QP:QS ratios that ranged from 0.8:1 to 4.2:1. All flow measurements were attempted within 0 to 4 em sampling depth; however, occasional adjustments of transducer and sample-volume position were necessary to maximize flow curves and to avoid valve and wall motion artifacts. Therefore, at times, records were obtained between 4 to 6 em in depth if the maximal signal was easier to record at a greater depth and the velocities were still within the Nyquist limits. Peak Doppler flow velocities measured over the mitral valve ranged from 31 to 118 em/sec with a mean spectral width at± 6 dB of 11.6 ± 0.6 em/sec. Peak flow velocities within both areas of investigation remained within the Nyquist limit of the ultrasound system, even in the presence oflarge shunts.
Correlation of Doppler and EM flowmeter-roller pump flows Figure Ill.6 summarizes our results. Doppler pulmonary flows derived at the mitral valve orifice correlated extremely well with those measured in the ascending aorta by the EM flowmeter (r = .99, SEE=± 0.16!/min). The linear correlation for pulmonary flow measurement, with the highest point eliminated, yielded a correlation coefficient of .98, SEE = ± 0.16. Doppler systemic blood flows obtained at the right ventricular outflow tract also correlated well with those measured from the aortic flow minus the roller pump or the Gortex shunt flow (r = .99, SEE=± 0.13). Eliminating the highest point, we obtained a correlation coefficient ofr= .96, SEE=± 0.14. Finally, Doppler QP:QS ratios also correlated well with the reference standards (r = .96, SEE= 0.21:1). No qualitative or quantitative differences were found between results obtained with the roller pump and the smaller number of determinations obtained from the Gortex shunt model.
Interobserver variability and errors of reproducibility All measurements were highly reproducible. The SEM to test reproducibility was less than 5% when duplicate measurements by one observer on a given record were compared. Further, interobserver variability was also less than 5%.
Discussion
Previous studies (Angelsen and Brubakk, 1976; Colocousis et al, 1977; Darsee et al, 1980; Fisher et al, 1982, 1983; Friedman et al, 1980; Magnin et al, 1981; Steingart et al, 1980) have shown that range-gated two-dimensional Doppler
55

echocardiography with fast Fourier transform spectral analysis of the Doppler frequency shift is a reliable, noninvasive method for calculation of cardiac output and assessment of the magnitude of intracardiac left-to-right shunts. These earlier studies included validation of these measurements in animal models with shunts (Fisher et al, 1982, 1983; Friedman et al, 1980, Valdes-Cruz et al, 1982) and in children with heart disease (Goldberg et al, 1982; Vargas Barron et al, 1982). Our present study further validates two-dimensional Doppler echocardiography for calculation of flows in the presence of both small and large systemic arterial-topulmonary artery left-to-right shunts. In this study, as in shunts through a patent ductus arteriosus encountered in the clinical setting, the shunt stream was directed into the main pulmonary artery, which resulted in increased velocities above the Nyquist limit and multidirectional nonlaminar flow patterns that precluded Doppler pulmonary blood flow measurements in the main pulmonary artery. Therefore, we measured pulmonary flow by Doppler echocardiography as pulmonary venous return through the mitral valve orifice, a technique that had already been validated and proved reliable in our laboratory (Fisher et al, 1983; Valdes-Cruz et al, 1982). In contrast to intracardiac shunts, in the presence of extracardiac shunts distal to the take-off of the vessels to the head and upper extremities, systemic blood flow could not be measured over the ascending aorta by either Doppler echocardiography or by the EM flowmeter, since the aorta also carries shunt flow later diverted into the pulmonary circulation. Therefore, systemic blood flow in our model was calculated by Doppler echocardiography as a systemic venous return in the right ventricular outflow tract proximal to the pulmonary valve. At this site, peak flow velocities were never above the Nyquist limit, and no increase in spectral width was encountered, which indicates no significant turbulence. The measurement of the right ventricular outflow tract was obtained on two-dimensional echocardiographic images at a level just proximal to the pulmonary valve, because that is the area above the crista that has little variation in size throughout the cardiac cycle and is where the walls can be easily defined. The mitral valve orifice method that we used in this study has the advantage of providing a two-dimensional echocardiographic image from which we can measure cross-sectional flow area directly by planimetry, instead of having to calculate it by squaring a diameter measurement. It has proved to be highly accurate in our previous studies, both in humans and animals who have intact circulation (Fisher et al, 1983), as well as for an estimation of pulmonary blood flow in the presence of shunts at the ventricularlevel (Valdes-Cruz et al, 1982; Vargas Barron et al, 1982).
The two models used in our study enabled us to obtain variable and measurable shunt magnitudes in experimental animals and closely simulated ascending aortic
56

and main pulmonary flow patterns of a patent ductus or other systemic arterial-topulmonary arterial shunts encountered in the clinical setting. Doppler tracings obtained in both models were identical and also very similar to those obtained in patients with patent ductus arteriosus. We have recently completed a pilot study to assess the capability of the Doppler echocardiographic method to measure QP:QS ratios in children with isolated patent ductus arteriosus. We studied II patients, ages 3 to 37 months, with isolated ductus arteriosus. QP:QS determinations were performed by indicatordilution techniques (Yang et al, 1978) in the cardiac catheterization laboratory and the results were compared with simultaneously obtained Doppler echocardiographic measurements. In this small group of patients, an encouraging result was obtained in that Doppler QP:QS determinations correlated well with dye-curve QP:QS measurements (r = .89; SEE=± 0.3:1). Neither cardiac motion with reference to the chest wall nor distortion of the ultrasound energy that passed through the chest wall prevented us from obtaining good Doppler echocardiographic studies in these young children or clear images of the right ventricular outflow tract and mitral valve flow areas. Nonetheless, in older patients, echocardiographic imaging of the right ventricular outflow tract may prove difficult; the technique may also prove to have limited applicability in very young infants and premature babies in whom large ductal shunts are often accompanied by left-toright shunting at the foramen ovale, which precludes the use of mitral flow as a measure of total pulmonary flow. In conclusion, our study demonstrates that extracardiac left-to-right shunts can be quantitated accurately by the two-dimensional Doppler echocardiographic method described in the open chest animal model. Our initial pilot studies in young children suggest that in patients with isolated patent ductus arteriosus and no other intracardiac shunts, the technique may prove clinically useful as a measurement of the overall magnitude of the left-to-right shunting.
57


Chapter IV
Limits of reproducibility of blood flow measurements by Doppler echocardiography; variability within the technique
by
Erik J. Meijboom M.D., Hans Rijsterborgh M.Sc., Hans Bot M.Sc., Job A.J. de Boo M.D., Jos R.T.C. Roelandt M.D., Nicolaas Born Ph.D.
Interuniversity Cardiology Institute and Thorax center Erasmus University Rotterdam, The Netherlands


Chapter IV
Abstract
Quantitative Doppler echocardiographic measurements have proven to be of acceptable reliability. This study evaluates the variability of the method for blood flow calculations at the mitral and tricuspid orifice. Four healthy subjects underwent two-dimensional Doppler echocardiography during normal respiration and nonrespiration. Doppler frequency shift recordings were integrated to obtain mean temporal velocity for each cardiac cycle separately. Mean temporal velocity during inspiration and expiration were compared, as were mean temporal velocities of twenty consecutive cycles during nonrespiration. Diameters of mitral orifice and tricuspid orifice and interception angles were measured in ten consecutive cycles at four predetermined moments. All results were averaged to a mean subject situation. Mean temporal velocities were si??ificantly (p<0.001) higher during expiration than during inspiration (12.4and 11.0 cm.s-) for the mitral orifice and lower(9.2and 11.0 cm.s-1)for the tricuspid orifice. Mean temporal velocity at both orifices showed a significantly smaller variability (7.7% and 9.0%) during nonrespiration than during respiration (14.5% and 13.2%). Diameters of mitral orifice and tricuspid orifice were significantly (p<0.001) larger during diastole than during systole while SEM for both was 5.0%. Interception angles measured at mitral orifice are all close to 0° and show minimal variability while at the tricuspid orifice the angle varied from 15° in diastole to 25.5° in systole constituting a significant difference in cosine (0.96 to 0.90) between the two points. Flow calculation can be derived from these data in different fashion, without paying attention to the moment of respiration. based on one cycle measurement and orifice diameter measurement from only three beats. yielding a 90% confidence interval of± 25% for the flow calculation. or a situation using three cycles during nonrespiration for the mean temporal velocity, ten cycles for the diameter. decreasing the 90% confidence interval to 10%.
Introduction
The development of more sophisticated Doppler echocardiographic equipment brought noninvasive quantitative assessment of blood flow within reach. Recent
61

studies (Loeberet a!, 1984; Meijboom eta!, 1983; Stevenson and Kawabori, 1982) indicate that quantitative Doppler echocardiography can be based on the assumption that blood volume flow (Q) in cc.s-1 can be calculated using a simplified formula:
Q=C. v .A cos 8
in which Cis a constant, depending on the shape of the velocity profile; vis mean temporal velocity in cm.s-', measured in the center of the orifice; A is the area in cm2 and 8 is the angle of intercept between the Doppler interrogation beam and the direction of flow. Measurement of each of these parameters has its specific potential sources of error. The reproducibility of calculated flow may depend on the circumstances under which these parameters are measured and on the operator's interpretation. Additionally, the number of cardiac cycles over which the parameter should be averaged is important in order to obtain acceptable reproducibility. The C can vary from I to 0.5 as velocity profiles vary from flat to parabolic. In this study the calculations are based on the assumption that the flow studied has a flat profJle ('plug flow') and that therefore C equals L Flat velocity profiles result in a narrow Doppler shift spectrum where most frequencies are clustered and displayed along the vertical axis of the registration paper as a velocity distribution versus time. In order to calculate the mean temporal velocity the measured Doppler frequency shift is integrated over the entire cardiac cycle (diastolic and systolic phase). The tracing of this instantaneous mean frequency on a graphics tablet requires a subjective judgement by the operator. He decides where the maximum intensity of frequencies, the darkest part of the Doppler tracing is.
Variation of Doppler waveform cohorts caused by the physiologic effects of respiration, beat-to-beat variation and movement of the heart relative to the sample volume is always encountered. Increasing the number of cardiac cycles integrated will diminish the effect of these variations.
Valve crifice measurements obtained from cross-sectional echocardiograms depend on the chosen level at which the valve is transsected and the instant of imaging in the cardiac cycle. Most authors (De Boo et al, 1984; Loeber et al, 1984; Meijboom et al, 1983; Stevenson and Kawabori, 1982) use the annular level of the valve because this cross-sectional area varies least during the cardiac cycle, but pay little attention to rotation and translation of especially the right side of the heart relative to the echocardiographic cross-section. Ormiston (Ormiston eta!, 1981)
62

and Tei (Tei eta!, 1982), however, report significant changes in circumference of both these orifices during the cardiac cycle. Therefore theoretically, volume flow should be calculated by integrating the product of instantaneous velocity and instantaneous area over the cardiac cycle. Nevertheless, authors (De Boo eta!, 1984; Loeber et al, 1984; Meijboom et al, 1983; Stevenson and Kawabori, 1982) reporting values of quantitative cardiac Doppler calculations select a single moment in the cardiac cycle to obtain a representative cross-sectional flow area. Thus the area variation over the cardiac cycle has not been considered to be of great influence. Finally the angle of intercept appears as a parameter in the quantitative calculation of blood flow over the valve orifices. It is important to study the variation of this angle during the cardiac cycle as well.
The aim of the present study is to evaluate the effects of respiration, beat-to-beat variation including the observer~s variability, change in the measured atrioventricular orifice size and variation of the angle of intercept throughout the cardiac cycle on the calculations of flow when using the simplified formula as is shown above.
Methods and materials
Pulsed Doppler velocity recordings and cross-sectional echocardiographic images of the atrioventricular valves were recorded with a HP77020A imaging system (3 MHz) in four subjects (age 23- 37 yrs) with no evidence for cardiovascular disease by physical examination and two-dimensional echocardiography. The recorded 544 beats showed to be sufficient to obtain an estimate for the magnitude of the variability in an ideal situation. Doppler velocity tracings over both the mitral and tricuspid valve orifice were recorded with the transducer in the apical four chamber view position. Special attention was given to place the Doppler sample volume in the diastolic mid annulus position at the onset of diastole. Doppler velocities tracings were obtained for at least 20 consecutive cardiac cycles during normal respiration with simultaneous recording of the respiratory cycle. An example is shown in Fig. IV.!. The Doppler recording was then continued for at least 20 consecutive cycles with the subjects holding their breath at mid expiration (see Fig. IV.2). Are was taken to avoid obtaining data during any forced ventilatory efforts, that is subjects were able to suspend ventilation for 20 cycles without changes in the respirometer signal or any evidence for the onset of inspiration. No change in heart rate was experienced over this short period.
63

Resp • TV
• insp+ exp )Ill -
Fig. IV. I
Doppler velocity recording as obtained at the tricuspid valve (TV) orifice during respiration (Resp.). The upper line indicates the EKG, the lower the respiratory movements.
For diameter measurements the apical four-chamber view was obtained. The maximum diameter of the tricuspid and mitral valve orifices was recorded on videotape for at least 20 cycles while the Doppler sample volume was kept in its appropriate position.
Calculations
Mean temporal velocities were calculated by integrating the Doppler velocity curves on a Houston Hi pad graphics tablet interfaced with an Apple II computer.
64

The recording was traced at the position of the darkest area in the registration, which is indicated in Fig. IV.2 by a dotted line (Meijboom et al, 1985). At the end of the passive inflow phase the spectrum of the Doppler shift broadens when it approaches the zero line. The dotted line is drawn there through the middle of the dark area. From the end of the active inflow phase the dotted line is continued over the zero line to the beginning of the complex disregarding Doppler frequency shifts in this area, most likely representing turbulence and movement of the heart. A Bio-Data Doppler flow program was used for the calculations. During inspiration and expiration each, fifteen cycles were selected and separately integrated to obtain mean temporal velocity (Fig. IV.3) for each orifice and each subject. For the tricuspid valve orifice this meant the largest Doppler velocity shift tracing obtained at the end of inspiration and the smallest tracing at the end of expiration and the opposite for the mitral valve orifice. Subsequently the mean temporal velocity was calculated from approximately 20 consecutive cycles during respiration and nonrespiration (Fig. IV.3).
·~ ~ ' ... ~
J~ ]'
l.~ } I I
f .l
Fig.IV.2
Doppler velocity recording as obtained at the mitral valve (MV) orifice during breathhold (nonrespiration). The upper line indicates the EKG. the lower, fairly straight line the absence of respiratory movements. The dotted line on the velocity recording marks the trace used for the integration to obtain the mean temporal velocity (MTV).
65

c .2 ' ' -,_ I E \ ',I E E "'- : ;~ L.- l ~ l l l ·- u ' / a.o ' ' ,_
' ' " " ....... -.... ' ' ... -.... ...... -.... L > ' ' v
t t '--"I '
' R 20 consecutive cycles (time+)
Fig. IV.3
during respiration
E
respiration curve
Doppler velocity tracing
15 selected cycles at inspiration
15 selected cycles at expiration
' \ ' ' ' ' ' ' ' ' ' ' ' ' ' \ ' ~
' ' ' '
4 ) ' NR---' 20 consecutive cycles
during non-respiration
Schematic indication of data acquisition moments at selected moments during respiration (R) and nonrespiration (NR). The dotted line indicates the recording of respiratory movements, the solid line the Doppler velocity tracing. The selected velocity tracings used for the measurements at inspiration (I) and expiration (E) are indicated with arrows. The tracings used for measurements during respiration (R) and nonrespiration (NR) are indicated.
Each cycle of these sequences was separately integrated to analyse the differences between beats. The measured orifice will change, whether due to movement of the heart relative to the ultrasonic image cross-section or due to a real change during the cardiac cycle.
In order to study the degree of change of orifice diameter during the cardiac cycle, we measured the diameter of both mitral and tricuspid valves during 10 consecutive cycles at four predetermined moments during each cycle. (The moments chosen were the end of the P-wave of the ECG, the Q-wave, the S-wave and in the midpoint between two QRS complexes. For these measurements the phase of respiration was disregarded). The angle of intercept was estimated over each of ten consecutive cycles at the same four moments in the cardiac cycle. The direction of flow was assumed perpendicular to the plane of the valve orifice. The mean values and variances obtained in the four subjects were averaged to obtain a ~mean subject situation'.
66

Results
Mean temporal velocity
The effect of inspiration versus expiration The mean temporal velocities as calculated for the four subjects at the mitral and tricuspid valve orifice are shown in Fig. IVA.
mitral valve
tricuspid valve
Fig. IVA
mean temporal velocity
5 10 velocity _
1 15 em. s
E
R
NR
E
R
NR
Mean values of mean temporal velocities expressed in cm.s 1 with their standard deviations are shown for the mitral valve in the top panel and for the tricuspid valve at the bottom. Each panel shows velocities during inspiration (I), expiration (E), respiration (R) and nonrespiration (NR).
67

Mean values and standard deviations are shown for the velocities at inspiration(!), expiration(E), the consecutive cycles during respiration(R) and during nonrespiration(NR), For both valves a difference was present between the mean temporal velocity measured during inspiration and expiration (p<O.OO l ). At the mitral valve orifice the mean temporal velocities during expiration were significantly higher compared to those during inspiration (12.38 to 10.98 cm.sec-'). This difference is even greater for the mean temporal velocities at the tricuspid orifice but in the opposite direction; the velocities during expiration were smaller than those during inspiration (9.19 to 11.14 cm.sec-1
).
The effect of respiration versus nonrespiration Mean temporal velocities calculated during respiration were greater than those measured during nonrespiration for both valves (p<O.OO l ). The mean temporal velocities during respiration showed a fairly large variability, with a standard deviation of 14.5% and 13.2% of the mean for mitral and tricuspid valves respectively. During nonrespiration this variability was significantly smaller: 7.7% and 9.0% (p<O.OOl).
Diameter measurements The diameter of the mitral annulus is shown in the upper left panel and of the tricuspid annulus in the upper right panel ofFig.IV.S. The selected moments for measuring the diameter during the cardiac cycle are indicated at the S point of the QRS complex (S), in the middle between two QRS complexes (M), at the P-wave (P) and at the Q-wave (Q). The diameters and their standard deviation are expressed in centimeters. The P and M measurements for both valves were significantly larger (p<O.OO l) than the QandS measurements. Standard deviations of these measurements were not significantly different. Diameters of the tricuspid annulus were approximately 0.1 em larger in measured size than those of the mitral valve (p<O.O l ).
Angle measurements The lower panels of Fig. !V.5 show the cosine of the angle of intercept, measured at the same points in the cardiac cycle; S, M, P and Q. In this study the angle measurements have been limited to the cross-sectional plane. The angles of intercept measured at the mitral orifice are all close to 0°; they show a minimum variability and are highly reproducible. At the tricuspid orifice, however, the angle of intercept differs from 15° at theM point to 25.5° at the S point. This constitutes a significant difference in cosine between the two points (0.964 to 0.903; p<0.002).
68

MITRAL VALVE TRICUSPID VALVE
E s M p Q s M p Q u
: j I j f
~
! t t t f • t t t E + -~ Cl
1 • 0 -t ± ± ±
-f • f f c • 0 0.9 u
Orifice diameter and interception angle change during cardiac cycle
Fig. IV.5
The mean values for diameters in centimeters (upper panels) and cosine (lower panels) are depicted for the mitral valve on the left and for the tricuspid valve on the right. The selected measurement points during the cardiac cycle areS at the S point of the QRS complex, Min the middle between two QRS complexes, Pat the Pwave of the EKG and Qat the Q point of the QRS complex.
From our data the SEM of the mean temporal velocity and mean orifice area can be assessed under various conditions. An example of the resulting SEM of the mean mitral and tricuspid velocity, when the measurements are averaged over different numbers of cycles, is given in Table IV.IA and Table IV.IB. These tables show a comparison of respiration versus nonrespiration. It can be seen that averaging the mean mitral velociry over 10 cycles during respiration has about the same % SEM as averaging 3 cycles during nonrespiration. In Table IV.II the measurement of both the orifice areas based on diameter measurements are evaluated when averaged over a different number of cycles. Since the relative errors of the mean values of the parameters for the calculation of
69

Table IV.!
The ""standard error of the mean" (SEM) of the mean temporal velocity expressed as a percentage of the mean value is shown for the mitral (A) and tricuspid (B) valve. The values obtained during respiration and nonrespiration are shown separately. The decrease in variability is shown from left to right with the increase of the number of averaged cardiac cycles from one to three respectively ten.
~ SEM of mitral mean temporal velocity
as calculated when averaged over
1 cycle 3 cycles 10 cycles
during 14. 5 8. 4 4.6 res pi ration
during non- 7.7 4.5 2.4 respiration
% SEM of tricuspid mean temporal velocity
as calculated when averaged over
1 cycle 3 cycles 1 0 cycles
during 13. 2 7.6 4.2 respiration
during non- 9.0 5.2 2.9 respiration
flow are known, the relative error of the resulting flow can be indicated. In Table IV.!!! two different situations are compared for both the mitral flow and the tricuspid flow. As can be seen with no attention to the moment of respiration velocity based on one cycle measurement and the orifice diameter measurement averaged over only three beats in mid-diastole the flow variability yields a SEM in the order of 15%. This corresponds with a 90% confidence interval of± 25%. In case tlte situation is improved (situation !!) by using three cardiac cycles during nonrespiration for the mean temporal velocity, ten cardiac cycles to measure the diameter in mid-diastole, the SEM changes to 5.6% for the mitral and to 6.8% for the tricuspid orifice yielding a 90% confidence interval of± 9.5% and 11%.
70

Table !V.II
The '"'standard error of the mean" (SEM) of the orifice area during middiastole expressed as a percentage of the mean is shown for the mitral and tricuspid annulus. The decrease in variability is displayed from left to right with the increase of the number of averaged cardiac cycles from one to three respectively ten.
% SEM of orifice area during mid-diastole (M)
as calculated when averaged over
1 cycle 3 cycles 1 0 cycles
mitral 10.6 6.1 3.4 annulus
tricuspid 11. 2 6.5 3.4
annulus
Discussion
Pulsed Doppler has been the mode of choice in this study since it is readily available and interfaced with cross-sectional echocardiography devices. This combination allows precise location of the Doppler sample volume by simultaneous cross-sectional imaging of the heart and at the same time it provides an accurate method for optimization of the angle of intercept. Continuous wave Doppler does not yield knowledge of the depth of measurement. In some individuals alignment of the interrogation sound beam may be more difficult because of the larger transducer assembly. The assumption of a flat flow profile at the level of the mitral valve orifice is supported by radiographic studies (Lynch and Bove, 1968), and by Doppler studies over the mitral valve annulus (Brunet a!, 1978). Theoretical support was provided by work on the transition from flat flow profiles at the inlet to parabolic profiles furtheron in a tubular vessel and the calculation of the inlet length, which is the distance necessary for the transition (Halle and Angelsen, 1982; McDonald, 1960). Based on these studies a flat flow profile at the atrioventricular orifices was assumed.
The results presented above have a number of implications for Doppler flow calculations. The impact of these results on the reproducibility of quantitative
71

Table IV.III
Comparison of the variability of flow quantitation for the mitral and tricuspid valve orifice. The variability is expressed in percentage standard error of the mean value for the velocity. area and angle. The last column shows their combined impact on the outcome of the calculated flow.
COMPARISON OF VARIABILITY IN % SEM
mean temporal area cos 8 flow velocity
mitral I 14.5 6. 1 0. 7 15.8
valve II 4.5 3.3 0. 7 5.6
tricuspid I 13. 2 6.5 2. 5 1 4. 9
valve II 5.2 3.6 2.5 6.8
MTV 1 cycle /respiration Area 3 cycles /mid-diastole Cosine 1 cycle /mid-diastole
II MTV 3 cycles I non-respiration Area 1 0 cycles /mid-diastole Cosine 1 cycle /mid-diastole
Situation I -Mean temporal velocity based on one cycle during respiration -Area derived from three diameter measurements at mid-diastole in the cardiac cycle -Angle measured at mid-diastole in the cardiac cycle
Situation II -Mean temporal velocity based on three cycles during nonrespiration -Area derived from ten diameter measurements at mid-diastole in the cardiac cycle -Angle measured at mid-diastole in the cardiac cycle
SEM =standard error of the mean~ MTV =mean temporal velocity.
72

!low measurements will be discussed first. The significant difference in mean temporal velocity between inspiration and expiration create a large variability expressed in standard deviation of mean temporal velocity measurement during respiration. The use of single arbitrary cycles or small groups of cycles disregarding respiratory changes to obtain the mean temporal velocity therefore significantly diminishes the reproducibility of these measurements. Even the use of the average of a sequence of 10 consecutive cardiac cycles, extending over several respiratory cycles, shows considerable scatter as expressed by the standard deviation. Improved reproducibility can be obtained by measuring a sequence of consecutive cardiac cycles during nonrespiration. Diameter measurement variability is slightly less than mean temporal velocity variability, but represents a more important source of error in the flow calculation, because the diameters are squared in the formula to obtain a cross-sectional flow area.
The diameter measurements of the valve were performed at the four selected moments of the cardiac cycle in order to illustrate the effect of orifice diameter changes on the reproducibility of the outcome of the flow calculations. Diameter measurement of the valve annulus during systole (S) is more reproducible, but is rejected for physiological reasons since no flow passes the orifice at that moment. Therefore the moment of choice in the cardiac cycle is the middle point M. When measured at that moment the mean subject data (Table IV.!) show the percent standard deviation of the diameter to be 5.3% for the mitral and 5.6% for the tricuspid valve annulus. This means an estimated percent standard deviation variation of 10.6% and 11.2% on the outcome of the flow measurements exclusively due to measured diameter variation. The flow area is calculated from a diameter measurement assuming a circular geometry of the valve annulus, although it seems preferable to measure two mutually perpendicular diameters using the elliptical equation forthe calculation of the tricuspid annulus area in adults (De Boo et al, 1984). The measurement of the angle of intercept at the mitral valve orifice yielded little influence on the calculations offlow. The angle is highly reproducible, close to 0° and the cosine is therefore close to unity with a variation ofless than I%. The tricuspid valve orifice, however, showed a considerable angle at the moment S in the cardiac cycle (25.5°) with a cosine of 0.990 and a relative large variation of reproducibility (9.3%). This moment (S) should be omitted, especially since no flow is passing the orifice at that particular moment in time. TheM point (mid-diastole) in the cardiac cycle is to be preferred for the angle measurement at the tricuspid orifice, with a mean cosine of 0.96 and a variation of 2.5%. A physiologically expected variation of velocity between inspiration and expira-
73

tion is clearly demonstrated. The explanation of the lower velocities obtained during nonrespiration as compared to those during respiration is less obvious. The measurements of mean temporal velocity and orifice area will be influenced by beat-to-beat variation and observer variability. These influences will be decreased if the number of measurements is increased. The "standard error of the meann (SEM) indicates the accuracy of estimating a mean value given the standard deviation of the measurement and the number of measurements. The results of this study reflect an ideal situation for Doppler quantitation in co-operative normal adult subjects. It is realized that variability will increase in less favourable circumstances.
Conclusions
Quantification of bloodflow across the mitral and tricuspid orifice by crosssectional Doppler echocardiography seems feasible. However, both acquisition and analysis of the data can be tedious and time-consuming. Measurements of mean temporal velocity, area and angle of intercept, required for this calculation, are subject to measurement variability. To optimize reproducibility for mean temporal velocity, this parameter should be obtained during nonrespiration. The flow area is calculated from a diameter measurement assuming a circular geometry of the valve annulus. The measurement during the cardiac cycle does not significantly influence the reproducibility of this parameter. For physiologic reasons the midpoint of the cardiac cycle is chosen. The angle of intercept plays a minor role but a significant point is that angle measurement at the S-point on the ECG in the cardiac cycle for the tricuspid valve should be omitted. Based on the assumption that parameter fluctuations are of random nature the reproducibility of each parameter is improved when the average is obtained over a large number of cardiac and respiratory cycles. The contribution to the variability of calculated flow, however, is not equal for all three parameters. Important in this respect is the impact of diameter variability, which is squared in the flow formula and thus amplified. This study shows that a single observer's reproducibility as expressed in standard error of the mean is in the order of 6% when the mean temporal velocity parameter is based on 3 cycles during nonrespiration, area is calculated from 10 diameter measurements during the midportion of the cardiac cycle and a single measurement of the angle of intercept is carried out in diastole. With this proportion 3/10 II for the different measurements the same order of magnitude of variability for each parameter is contributed to the reproducibility in
74

the flow calculation, and variability of the flow due to reproducibility errors should be limited to 5-7%.
Acknowledgement
We gratefully acknowledge the support of doctor Lindsey D. Allan and Prof. Dr. Van der Werf for constructive criticism of the manuscript and the assistance of Corrie Eefting and Tineke van der Kolk.
75


ChapterV
Cardiac Doppler flow velocities in human fetuses
by
Kathryn L. Reed, M.D. 1), Erik J. Meijboom, M.D. 2), David J. Sahn,
M.D. 3), Sarah A. Scagnelli, R.D.M.S.3), Lilliam M. Valdes-Cruz, M.D.3
), Lewis Shenker, M.D.1)
1) Department of Obstetrics and Gynecology, Arizona Health Sciences Center, Tucson, Arizona, U.S.A., 2
) Division of Pediatric Cardiology, University of Maryland Medical System, Baltimore, Maryland, U.S.A. 3) Division of Pediatric Cardiology, University of California at San Diego, La Jolla, California, U.S.A.
This work was supported in part by a grant from the Arizona Affiliate of the American Heart Association.
Circulation (in print).


ChapterV
Abstract
Cardiac Doppler flow velocity studies were performed in normal human fetuses between 18 and 40 weeks of gestation. Two-dimensional (2-D) linear array and sector scanning techniques were used for the initial evaluation of the fetus, which included a standard ultrasound examination to determine normal anatomy and estimated gestational age and weight. Fetal cardiac ultrasound examination was then performed, with four-chamber, short axis/great vessel, long axis/left ventricular outflow tract, and aortic arch views obtained. Pulsed echo Doppler instrumentation was used to obtain flow velocity measurements through the tricuspid. pulmonary outflow. mitral and aortic outflow regions. Calculation of transvalve volume flow for mitral and tricuspid valves was performed by combining the valve annulus sizes and calculated mean temporal velocities for the valves. Maximum flow velocities were greater through the tricuspid (mean maximal velocity 51± 1.2 (SE) em/sec) than through the mitral (47 ± 1.1 em/sec, p < 0.05) valve regions, with a wide range of scatter for results between fetuses but less than 6% average variation in the individual fetuses during gestation. For 18 fetuses, fetal right heart dimensions and volume flows (mean 307 ± 30 ml/kg/min) were greater than left heart dimensions and volume flows (232 ± 25 ml/kg/min). Doppler echocardiography may prove to be useful as an adjunct to imaging echocardiography for evaluation of fetal cardiac anatomy and function.
Key words: human fetal heart, Doppler echocardiography, cardiac imaging.
Introduction
The human fetal heart can now be examined using ultrasound and echocardiographictechniques (Allan eta!, 1982; DeVore et al, 1982, 1983; Kleinman et al, 1980, 1983; Lange et al, 1980; Sahn eta!, 1980). This allows fetal cardiac anatomy and physiology to be studied in an obstetric population for the purpose of prenatal diagnosis and management.
79

Doppler echocardiographic techniques can be used to determine flow velocity, and, in conjunction with two-dimensional (2-D) real-time imaging, can provide estimates of volume flows (Lewis et al, !984; Meijboom et al, 1985; Valdes-Cruz and Sahn, 1982). These techniques were used in 90 examinations of75 fetuses to establish normal values of temporal flow velocity and to attempt to assess transvalve volume flows in the human fetus.
Methods
Patients were selected from the Obstetrics Clinic at the Arizona Health Sciences Center and from outside referrals. Human Subjects Committee approval was obtained for the study, and informed consent was obtained from each participating mother prior to the examination. Fetuses were examined between 18 and 40 weeks gestation; all fetuses have been examined postnatally and have normal cardiac findings. The intruments used included an Aloka 256linear array scanner and a 3.5 MHz or 5 MHz Honeywell Echo Doppler scanner. With either scanning frequency, Doppler interrogation was performed at 3.5 MHz. Pulse repetition frequency for Doppler was 9500 at 6-12 em depth of investigation so that the maximum unambiguously detectable velocity was 85 centimeters per second (em/sec) when sampled parallel to flow. Routine ultrasound scan measurements of each fetus included biparietal diameters, abdominal diameters, femur lengths, amniotic fluid volume, and placental location. Fetal weight was calculated on the basis of ultrasound measurements (Shepard eta!, 1982).
Cardiac views attempted included four-chamber, four-chamber/left ventricular outflow, short axis/pulmonary artery, and aortic arch imaging.
Examination technique Doppler velocity measurements were obtained by placing the Doppler sample volume immediately distal to the valve leaflets in the ventricle or great vessel into which the blood was flowing. Sample volume length was between 0.1 and 0.3 em for these studies. The location of the pulsed Doppler gate was verified by 2-D ultrasound both before and after each Doppler tracing was obtained. The direction of blood flow was estimated to be perpendicular to the plane of the valve annulus within the plane of imaging. The angle between the estimated direction of
80

blood flow and the Doppler beam was set and the angle indicated directly by the instrument. During Doppler flow velocity recordings, fine angulation of the transducer was performed until the highest maximum velocity tracing pattern possible was obtained at each location studied. In 10 studies, fetuses were examined sequentially by two examiners (S.S. and K.L.R.). Estimates of the angle between the Doppler beam and the direction of blood flow varied less than 10° between examiners. Peak velocities obtained by the individual examiners varied with fetal respiration and fetal movement. The measurements were used only when a series of three consecutive beats with the highest velocity and of similar appearance was obtained in the absence of fetal breathing and movement.
Measurement of records Maximal and mean temporal velocities were determined from page print outputs of the gray scale Doppler spectrum using a minicomputer. Maximal velocities were measured to the highest modal velocity (the darkest portion of the spectrum) in either systole or diastole. Temporal mean velocities were calculated by planimetering the area underneath the gray scale spectral velocity display throughout the cardiac cycle and by dividing by the time over which the flow was traced. Flow velocities were traced along the zero line during no flow periods, diastole for the great arteries and systole for the atrioventricular (A V) valves. An average of three beats was used to determine the value reported. Measured velocities were anglecorrected by dividing by the cosine ofthe angle of incidence. Mean flow velocities were not corrected for heart rate. The normal fetus has a heart rate between 120 and 160 beats per minute, and no fetuses in this study had abnormal heart rates. Maximal velocity tracings could be obtained with a variation of less than 10% by the individual examiners and had similar reproducibility when sequential studies by the two examiners were compared. Repeated tracings of the same printed outputs by the individual examiner varied less than 3 em/sec for maximal velocity and< 0.5 em/sec for temporal mean velocity calculations, and similar differences were found between examiners. All measurements were performed by two examiners (S.S. and K.L.R.).
Volume flow estimates We attempted to estimate volume flow across the atrioventricular valves in a subset of fetuses (n=18 of 26 attempts) studied between 26 and 30 weeks of gestation. To obtain volume flow measurements across the atrioventricular valves, linear array four-chaniber views were obtained and mitral and tricuspid valve diameters were measured in the axial direction. Doppler flow velocities were then obtained after changing fetal position so that flow was consistently toward or away from the transducer through the atrioventricular valves and sampling could
81

be obtained at< 30 angle. Cardiac outputs were calculated using the formula
Q meanVxA
cos e
where Q =flow, mean V= mean temporal velocity,A =area and 8= the angle of incidence (Lewis eta!, 1984; Meijboom eta!, 1985; Val des-Cruz and Sahn, 1982). For the purposes of these calculations, tricuspid and mitral valve annulus diameters in four-chamber views were considered to represent the diameters of circular flow orifice areas in early diastole. This dimensional measurement was undertaken immediately prior to or following the Doppler measurements. The time in the cardiac cycle during which flow area was estimated was determined by slow motion videotape playback from 2-D ultrasound studies. Measurement of the 2-D images was performed from endocardial wall to endocardial wall at the valve annulus just after the opening of the atrioventricular valves (Meijboom et a!, 1985). Due to the small size of the structures examined (diameters of0.44 to 1.2 em) variations in orifice size across the A V valves during diastole were difficult to appreciate on video playback and so the maximum diameter obtained on the frame just after atrioventricular valve opening was selected. Valve flow area was calculated by multiplying ( diameter/2)2 by 7T. All diameters were measured and areas calculated by one examiner (S.S.). Annular diameter measurements varied less than I mm for either valve with repeated measurements.
The Student's !-lest for unpaired values was used to compare maximal and mean temporal flow velocity measurements. Results are reported as mean ± standard error (SE).
Results
Ninety examinations were performed in 75 fetuses. Thirteen fetuses were studied serially. Figure V.l shows a representative four-chamber view of the fetal heart and typical tricuspid and mitral valve tracings obtained in these views. A short axis/pulmonary artery view with a pulmonary artery flow velocity tracing is shown in Figure V.2. Figure V.3 demonstrates a typical left ventricular outflow tract view along with an aortic valve region velocity tracing. As can be seen from the data in Figures V.4 and V.5, we had > 60% success rate for recording atrioventricular valve velocities and pulmonary artery velocities, and < 50%
82

Figure V.I
Fetal TV Velocity
Fetal MV Veloeity
I , I
Two-dimensional four-chamber view of the human fetal heart, with tracings of the Doppler flow velocity through the tricuspid valve (TV) and mitral valve (MV). RV: right ventricle, LV: left ventricle, RA: right atrium, LA: left atrium. The four-chamber view and MV velocity tracing are from the same fetus: the TV velocity tracing was obtained from a different fetus in the study.
83

Figure V.2
_]
Fetal PA Velocity , 1 '
I 1 t
I I
1 a a 1 , r , r , 1 , 1 I 1 I r ,
s CIIIIS I
I
!~
J i
J I
Two-dimensional short axis/pulmonary artery view with a typical pulmonary artery (PA) Doppler flow velocity tracing. RV: right ventricle, RA: right atrium, AO: aorta.
84

FigureV.3
i \' '
Fetal Ao Velocity
I
I'
Two-dimensional left ventricular outflow view with an aortic (AO) outflow Doppler flow velocity tracing. LV: left ventricle. The two-dimensional image and Doppler tracing were obtained from different fetuses in this study.
85

0 Cl) Ill -E CJ ->--
so
50
40
CJ 30 0
~ ~ 20
i:i:
-
-
-
-
10 1-
Figure V.4
.,-_51 ± 1.2 (SE)
..!...
*
11.8± .4 T -'-
**
Max Mean
Tricuspid Valve n=58
'47±1.1 ...L
*
* p<
* * p:N
11.
**
Max Mean
Mitral Valve n=57
Angle-Corrected Maximal and Mean Temporal Velocities
Fetal Tricuspid and Mitral Valve
0.05
s
2±.3
Angle-corrected maximal and mean temporal flow velocities (Group mean ± SE) are shown for the fetal tricuspid and mitral valve. Max: maximal.
86

8 o-
l-70
1-60
1-u 50 Cl) Cl) -E
1-~ 40 >
== u 0
1-~ 30
~ i:i: 20 1-
10 1-
Figure V.S
T 63±1.5
1. ..
. T 72±1.6
1 ..
" p
** p
<0.01
<0.01
16 ± 0.5 ..,... 18 ±0.6
-'-
**
Max Mean
Pulmonary Artery n=56
..J... .. ,.
Max Mean
Aorta n=25
Angle-Corrected Maximal and Mean Temporal Velocities
Fetal Pulmonary Artery and Aorta
Angle-corrected maximal and mean temporal flow velocities (Group mean ± SE) are shown for the fetal pulmonary artery and aorta. Max: maximal.
87

Table V.J
SERIAL VELOCITY MEASUREMENTS ACROSS ATRIOVENTRICULAR VALVES IN PATIENTS STUDIED SERIALLY (em/sec):
TRICUSPID
Weeks 18 - 25 )25 - <32 32 - term % change Pt. 10
RO MAX 59.3 55.0 - 7 MEAN 12.3 15.9 + 29
SP MAX 38.8 46.6 + 20 MEAN 8.3 12.5 + 50
LH MAX 43.7 44.0 + 1 MEAN 9.7 9.3 - 4
sc MAX 44-8 50.6 + 13 MEAN 10.0 u.o + 10
ww MAX 41.0 41.0,47 .1 56.2 + 37 MEAN 8.8 12.0,10.0 14.8 + 68
MH MAX 57.7 53.0 - 8 MEAN 13.5 12.8 - 5
cc MAX 70.0 73.1 + 4 MEAN 13.9 14.5 + 4
EE MAX 50.1 44.6 - 11 MEAN 7.2 9.6 + 33
AVERAGE CHANGE OF MAX VELOCITY + 6.1 AVERAGE CHANGE OF MEAN VELOCITY + 23-0
succes for the aortic recordings if we set criteria that flow must be recorded at less than 30° angle of incidence. A wide scatter was noted in velocities for the whole series, although serial examinations in individual fetuses showed less than a 6% averaged variation for the group in maximal velocities across atrioventricular valves throughout gestation in individual fetuses (Table V.l ). For the entire group, averaged maximal and mean temporal velocity in the tricuspid valve region were 51± 1.2 (SE) (range 34.1 to 78.2) and 11.8 ± 0.4 em/sec (range 7.2 to 16.9), respectively (Figure VA). This was greater than the maximal (47 ± 1.1 em/sec,
88
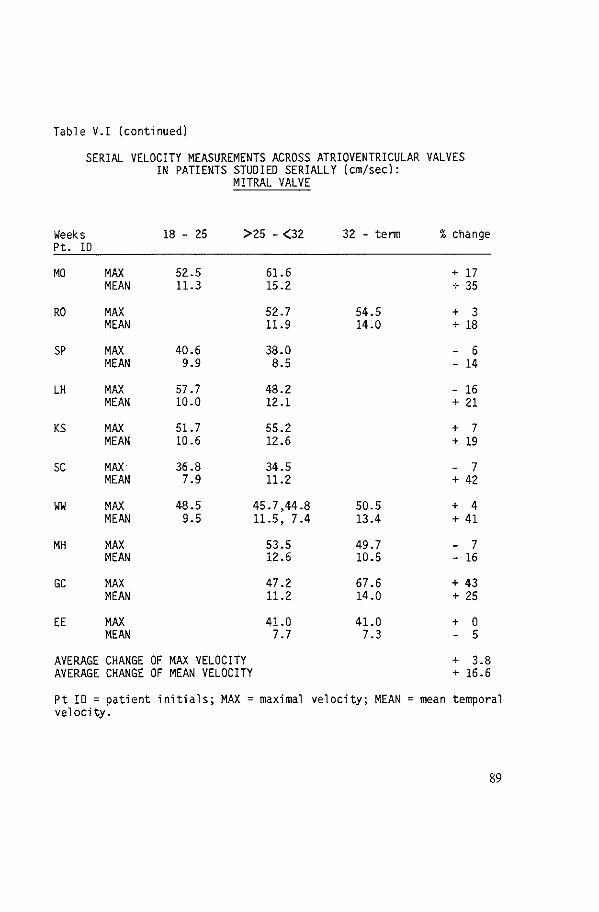
Table V.I (continued)
SERIAL VELOCITY MEASUREMENTS ACROSS ATRIOVENTRICULAR VALVES IN PATIENTS STUDIED SERIALLY (em/sec):
MITRAL VALVE
Weeks 18 - 25 >25 - (32 32 - tenn % change Pt. !0
MO MAX 52.5 61.6 + 17 MEAN 11.3 15.2 + 35
RO MAX 52.7 54.5 + 3 MEAN 11.9 14.0 + 18
SP MAX 40.6 38.0 - 6 MEAN 9.9 8.5 - 14
LH MAX 57.7 48.2 - 16 MEAN 10.0 12.1 + 21
KS MAX 51.7 55.2 + 7 MEAN 10.6 12.6 + 19
sc MAX 36.8 34.5 - 7 MEAN 7.9 11.2 + 42
ww MAX 48.5 45.7,44.8 50.5 + 4 MEAN 9.5 11.5, 7.4 13.4 + 41
MH MAX 53.5 49.7 - 7 MEAN 12.6 10.5 - 16
GC MAX 47.2 67.6 + 43 MEAN 11.2 14.0 + 25
EE MAX 41.0 41.0 + 0 MEAN 7.7 7.3 - 5
AVERAGE CHANGE OF MAX VELOCITY + 3.8 AVERAGE CHANGE OF MEAN VELOCITY + 16.6
Pt IO = patient initials; MAX =maximal velocity; MEAN = mean temporal velocity.
89

range 20.8 to 67.6) (p < 0.05) and not different from the mean (11.2 ± 0.3 em/sec, range 6.6 to 16.5) (p > 0.05) temporal flow velocity through the mitral valve. In 43 fetuses in whom both tricuspid and mitral valve velocity measurements were performed at the same gestational age, tricuspid valve maximal velocity exceeded mitral valve maximal velocity in 73% and tricuspid valve mean velocity exceeded mitral valve mean velocity in 68%. The maximal velocity through the pulmonary artery region for the group as a whole was 60 ± 1.9 em/sec (range 42.1 to 81.6); mean temporal velocity was 16 ± 0.6 em/sec (range 9.2 to 25. 7). Compared to the pulmonary artery flow velocities, the flow velocities across the aortic valve region showed a maximal velocity of70 ± 2.6 em/sec (range 56.0 to 94.0) (p < 0.0 I) and a mean temporal velocity of 18 ± 0.7 em/sec (range 13.7 to 22.5) (p<O.Ol) (Figure V.5) but there was more scatter and more angle correction used in the aortic data and fewer fetuses were successfully studied for aortic flow. In 22 fetuses in which both pulmonary artery and aortic valve region maximal and mean velocities were measured at the same exam, aortic measurements exceeded pulmonary artery measurements in 68% for both phasic maximal and temporal mean determinations. For atrioventricular valves, late diastolic velocities coinciding with atrial contraction were consistently higher than early diastolic filling velocities, resulting in an A-wave dominant Doppler tracing in 97% of the fetuses examined (Figure V.I). This differs from the pattern seen in older children and adults, in whom early diastolic Doppler flow velocity peak is dominant. Eighteen fetuses were examined between 26 and 30 weeks gestation for the purpose of estimating mitral and tricuspid volume flows. This is a time of accelerating growth in the fetus. Criteria for inclusion were axial measurements of A V valve annuli (Figure V.6) and then rotation to allow velocity interrogation for both valves at an angle ofless than 30° during the same examination. Dimensional measurements for atrioventricular valve rings showed wide scatter as a function of estimated fetal weight, as, of course, did calculated volume flows. For the 18 fetuses in this part of the study, area measurements for AV valves ranged from 0.26 to 0.74 cm2 for the tricuspid valve and 0.25 to 0.62 cm2 for the mitral valve. Tricuspid annulus measurements were consistently larger than mitral valve measurements, and tricuspid flow volumes (307 + 30 mllkgEFW*/min) were statistically larger than mitral flow volumes (232 + 25 ml/kgEFW /min) p < 0.0 I (Figure V.6). There was wide scatter in the data but in 15 of 18 fetuses, tricuspid flow/mitral flow volume ratio was greater than I (range 0.89 to 1.81 ), and for the group the ratio was 1.3: 1.
*Estimated Fetal Weight
90

FigureV.6
320 c E -Cl240 ""
3 30 - I_ 07:!: TV:MV1.
1 p<0.001
T 23 - .l
2 :!: 25
-CJ CJ
~ 160 J2 -1.1.. (!)
~ 80 Ill
> Ill c Ill ... 1-
Tncuspid Valve Mitral Valve
Fetal Volume Flows in 18 Fetuses 26-30 Weeks Gestation
Fetal volume flows calculated in 18 fetuses at 26-30 weeks gestation (Group mean± SE). RA: right atrium, LA: left atrium, TC: tricuspid valve, MV: mitral valve. The dotted line shows annulus measurements of tricuspid and mitral valves. The mean ratio of tricuspid to mitral volume flow for the whole subgroup is 1.3:1. Each of these 18 fetuses had both TC and MV flows calculated.
91

Discussion
Fetal cardiac blood flow patterns differ from those in the neonate and the adult. Flow in the fetus results from simultaneous ejection from both right and left ventricles into the systemic circulation. Vena cava inflow in the fetus is split to either the left atrium through the patent foramen ovale and eventually into the ascending aorta, or to the tricuspid valve, into the right ventricle and pulmonary artery with most of the flow continuing across the ductus arteriosus into the descending aorta. Fetal cardiac function has been studied in the lamb, but the invasive nature of the methods used precludes studies in the human fetus. In our study, peak Doppler filling velocities across the tricuspid were higher than those across the mitral valve, and valve volume flow across the tricuspid valve was greater, consistent with the right heart dominance previously demonstrated in normal fetal animals studied by Rudolph (Rudolph and Heymann, 1971). It would be expected that pulmonary artery volume flow would be greater than aortic flow, and in our previous study of normal fetuses, the pulmonary artery (PA) diameter slightly exceeded the aortic (AO) diameter (PAl AO: 1.2/1) (Lange eta!, 1980). Despite increased preload volume to the right ventricle compared to the left, aortic peak velocity exceeded PA velocity. This may reflect a better mechanical performance of the left ventricle or a difference in afterload prenatally even though left ventricular stroke volume is less than right ventricular flow volume. There was, however, wide scatter and more angle correction in the aortic data which raises the possibility of overestimation of the angle-corrected aortic velocities. Doppler flow tracings in the atrioventricular valve inflow regions showed a dominant late diastolic component coincident with atrial systole. This may reflect the decreased diastolic compliance of the fetal heart (Romero eta!, 1971 ), and may explain the importance of atrial systole to normal cardiac function in the fetus. Both decreased compliance and right heart dominance might explain the phenomenon of development of right ventricular enlargement, ascites, and edema (hydrops) in the fetus with a cardiac malfunction, since the right heart of the fetus handles the major portion of the volume load induced by severe anemia or an abnormal cardiac rhythm (Kleinman eta!, 1982). A substantial amount of error is potentially present in the method of calculation of volume flow. Even though annular diameters varied only about I mm, this could still represent a 20% error in diameter measurement in some of the smaller fetuses and might induce a 30% change in cardiac flow, mainly resulting from a change in calculated flow orifice area. While we and others have validated a methodology for calculating volume flow across A V valves by using the valve annulus methods
92

(Lewis eta!, 1984; Meijboom et al, 1985), none of these validation studies involved hearts this small. We believe that Doppler studies may be useful in the elucidation of cardiac physiology in the human fetus and may be helpful as an adjunct to the diagnosis of congenital heart disease. This work provides a preliminary approach to defining normal velocities for application of Doppler techniques in the study of human fetal cardiac physiology.
93


Chapter VI
Discussion
Chapter I The assessment of volume flow in the human circulation is and has always been of clinical importance and therapeutical management decisions are based upon it. Until recently these measurements have been performed in an invasive fashion using indwelling arterial and/ or venous catheters with the inconvenience and the potential harm connected with these methods. The noninvasive technique described in the previous articles provides a method of obtaining information about the volume flow and lacks these risks. These advantages justify a serious effort to validate the technique and to evaluate its usefulness in the human population and the fetal setting.
The invasive techniques have been tested extensively in animal experiments, proven to be reliable and longstanding use in the clinical setting has taught the physician to rely on, work with and appreciate these techniques within their limitations. This all does not yet hold for quantitative two-dimensional Doppler. In this thesis Doppler flow methods are first evaluated in ideal circumstances, which are approached in the open chest animal model, using the EM flowmeter checked against a stopwatch and a calibrated cilinder as a gold standard, followed by small pilot studies in human subjects during cardiac catheterization. The results of such investigations can be expected to be better than results obtained in the normal clinical setting. The placing of the transducer direct on the heart takes away all the disturbances produced by tissue of chest wall and lungs as encountered in the clinical setting. Moreover it creates the smallest possible distance between the blood velocity to be measured and the transducer, minimizing the chance of aliasing. The two-dimensional image benefits of this direct apposition. The transducer can be manipulated more easily to obtain the optimal
95
image and the short distance between the transducer and the points to be measured improves the lateral resolution of the image. Finally, the respiration in an open-chested animal influences the volume flow through the heart to a much lesser extent than in the closed chest situation and therefore diminishes the variability of the measurements.
The choice in favour of a mechanical sector scanner and pulsed range gate Doppler was made inadvertently and dictated by the availability of that device at the moment of the study. This combination allows precise location of the Doppler sample volume by simultaneous cross-sectional imaging of the heart and at the same time it provides an accurate method for optimization of the angle of intercept. Continuous wave Doppler does not yield knowledge of the depth of measurement and in some individuals alignment of the interrogation sound beam may be more difficult because of the large transducer assembly.
The calculation of bloodflow is based upon the assumption that flow through valve orifices has a flat flow profile and that the area of flow at the atrioventricular valve orifices can be approached by assuming that these orifices have a circular shape and that thus by measuring the diameter of the orifices the diameter of flow can be calculated.
The assumption of a flat flow profile over the atrioventricular valve orifices is supported by radiographic studies (Lynch and Bove, 1968) and by Doppler studies, specifically over the mitral valve annulus (Brunet al, 1978). More recent colour-coded Doppler investigations are in agreement with this assumption (Sahn, 1985). Theoretical support was provided by work on the transition from flat flow profiles at the inlet to parabolic profiles further on in a tubular vessel and the calculation of the inlet length, which is the distance necessary for the transition (Angelsen, 1982; McDonald, 1960). Based on these studies the existence of flat flow pro flies at the atrioventricular orifices is assumed. The second assumption is that the atrioventricular orifices are of a circular shape. The most precise method to calculate the area is planimetry of the complete contour of the orifice cross-section in a frozen frame. Simplification of this calculation becomes possible if the countours are approximated by a circle or by an ellipse. This reduces the technique to the measurement of one or two axes, and the use of a simple formula. The result of the circular approximation of the valve orifices is shown in these studies and the results obtained were acceptable, but one should bear in mind that using the annulus diameter for calculating an area as if it were in fact an area of flow, is a hypothesis. The true area of flow is not really known and it may in fact just be a coincidence
96

that using the annulus diameter yields a reasonable estimate of flow as could be proven in the animal experiments.
Chapter ll The results of the simplified mitral valve orifice method study indicate that this method is useful as an auxiliary site for non-invasively measuring of the cardiac output especially in adults in whom a very clean short-axis view perpendicular to the mitral valve leaflet is difficult to obtain, or in fetuses in whom this may be totally impossible. The effects of respiration in this study did not significantly interfere with mean temporal velocities, which is contrary to findings in the tricuspid valve orifice method study. In the animal model this can be explained by the open chest which diminishes the effect of respiration. In the human pilot study the small number of patients prevented significant separation of the effects. In an extended amount of studied cardiac cycles, as in the reproducibility study the influence of respiration on the flow over the mitral valve orifice is clearly shown. The simplified mitral valve method appears to be slightly less acurate than the Fisher mitral orifice flow method. But especially in more difficult circumstances it is a useful tool.
In the tricuspid valve method distinct differences were noted in Doppler derived flow curves of the animal preparation during inspiration and expiration, in despite of the absence of negative intrathoracic pressure in the open chest dog. These flow differences might be explained by decrease in afterload resulting from a forced expansion of the lungs by the respirator. In these animals the electromagnetic flowmeter averaged inspiratory and expiratory events, but the Doppler studies recorded during inspiration had a slightly lower scatter and a closer correlation to the reference standard for systemic bloodflow than those Doppler values obtained in expiration. In the initial human studies no systematic difference in calculation of volume flow could be demonstrated, but the later and more extended reproducibility studies showed the effect of respiration on flow, even more pronounced than in the open chest animal modeL Other authors (Loeber et al, 1984) report in agreement that the tricuspid valve method is accurate and easy to perform. It has potential applications for estimating cardiac output or for noninvasive calculation of shunt size. It is an important addition to the growing body of Doppler echocardiographic methods applicable in clinical cardiology.
97

Chapter HI The same animal model with a variable sized left-to-right extracardiac shunt was used to evaluate possibilities of shunt measurements for ductuslike shunts. This animal model enabled us not only to obtain a variable and measurable shunt magnitude, but closely simulated flow patterns existing in a circulation where a patent ductus arteriosus or other arterial to pulmonary shunts are encountered in the clinical setting. In contrast to other shunts the systemic bloodflow cannot be measured in the ascending aorta neither by Doppler echocardiography nor by the electromagnetic flowmeter in the presence of extracardiac shunts distal to the take-off of the vessels to the head and the extremities, since the aorta carries the shunt flow later diverted into the pulmonary circulation. This necessitated the calculation of the systemic bloodflow by Doppler echocardiography as systemic venous return and the right ventricular outflow tract proximal to the pulmonary valve was chosen for this purpose. At this site peak flow velocities were never above the Nyquist limit of the machine and no increase in spectral width was encountered, which indicated no significant turbulence.
Measurement of the right ventricular outflow tract was obtained on the twodimensional echocardiographic images at a level just proximal to the pulmonary valve, because that is the area above the crista where little variation in size throughout the cardiac cycle occurs and the walls can easily be defined. The mitral valve orifice method used in this study has the advantage of finding a twodimensional echocardiographic image from which we _can measure cross~sectional area directly by planimetry, which proved to be slightly more accurate than using the diameter measurement in our previous study. The method of measurement demonstrated that left-to-right shunts can be quantitated by two-dimensional Doppler echocardiography. The initial pilot studies in young children suggest that the technique may prove clinically useful as a measurement of the overall magnitude of the left-to-right shunting.
Chapter IV In the previous chapters Doppler flow studies proved to be accurate when compared to standard methods as electromagnetic flow measurements and the calibrated roller pump in optimal setting like the experimental animal model. The small pilot studies on children in the cardiac catheterization laboratory suggest some optimism for the clinical use of this technique. However, the reproducibility or variability of the method when implicated in the clinical setting, was not included in these studies. The reproducibility of bloodflow measurement in 4 human subjects over a large number of cardiac cycles during inspiration, expiration, respiration and breath-
98

hold is studied in chapter IV. Significant differences in mean temporal velocity between inspiration and expiration create a large variability expressed in the standard deviation of the mean temporal velocity measurement during respiration. Therefore the use of a single arbitrary cycle or small number of cycles disregarding respiratory changes to obtain the mean temporal velocity diminishes the reproducibility of the measurement. Even the use of the average of a sequence of ten consecutive cardiac cycles, extending over several respiratory cycles, shows considerable scatter as expressed by the standard deviation. The study showed that improved reproducibility can be obtained by measuring a sequence of consecutive cardiac cycles during nonrespiration. Diameter measurement variability represents an even more important source of error in flow calculation, because the diameters are squared in the formula to obtain the cross-sectional flow area. To obtain the best reproducibility the valve annulus should be measured in the middiastolic part ofthe cardiac cycle when the percentage of standard deviation of the diameter for both mitral and tricuspid valve annulus are the smallest at about 5%. This still means an estimated percentage of standard deviation of 10.9% ofthe total outcome offlow measurement exclusively due to measured diameter variation. Variability of the angle of intercept measurement yielded little influence at the mitral valve calculations of flow. The angle is highly reproducible and close to zero degrees, the cosine therefore very close to unity. The tricuspid valve, however, showed a considerable angle during systole of the cardiac cycle, 25.5° with a cosine of 0.990 and a relatively large variation of reproducibility, 9.3%. This moment in systole should be omitted, especially since no flow is passing the orifice at that particular moment in time. The midpoint of diastole in the cardiac cycle is to be preferred for the angle of intercept measurement at the tricuspid valve orifice period. The physiologically expected variation of velocity between inspiration and expiration is clearly demonstrated in this study. The explanation of the lower velocities obtained during nonrespiration as compared to those during respiration is less obvious. Measurements of mean temporal velocity in orifice area will be influenced by beat-to-beat variation and inter-observer variation, which will be decreased when the number of measurements is increased. The results of our study reflecting an ideal situation for Doppler quantitation in co-operative normal adult subjects suggests that a single observer's reproducibility as expressed in the standard error of the mean is in the order of 6% when the mean temporal velocity parameter is based on three cycles during respiration, area is calculated from ten diameter measurements during the mid portion of the cardiac cycle and a single measurement of the angle of intercept is carried out in diastole.
99

In the proportion 3/10/1 for the different measurements the same order of magnitude of variability of each parameter is contributed to the reproducibility of the flow calculation.
ChapterV In chapter V Doppler flow studies are performed in human fetuses. Fetal cardiac bloodflow patterns differ from those in the neonate and the in the adult. Fetal cardiac function has been studied in the fetal lamb, but the invasive nature of the methods used prevented studies in the human fetus. Doppler techniques provides for the first time a method for the study of human fetal circulation. In this study peak Doppler filling velocities across the tricuspid valve are higher than those across the mitral valve and valve flow across the tricuspid valve was greater, consistent with the right heart dominance previously demonstrated in the fetal animal studies. The fetal Doppler study indicates that cardiac and great artery Doppler velocities can be recorded in normal human fetuses and normal values have been obtained. These values, however, show a wide range of scatter period. The late diastolic velocities during atrial systole are higher than the passive filling velocities in the human fetus, which might reflect the decreased compliance in the human fetal heart in early pregnancy. Right heart dimensions and flow velocities are higher than left heart dimensions and flow velocities indicating right heart dominance in the human fetus and we conclude that the Doppler studies are useful at elucidation of cardiac physiology in the human fetus and may be helpful as an adjunct to the diagnosis of congenital heart disease.
100

Chapter VII
Summary
Chapter I is an introductory chapter and deals with the initial description of the Doppler effect and its implementation in modem medical technology. The use of the Doppler effect in cardiology is discussed, emphasizing quantitative studies. The two equations used for this purpose are the simplified Bemouilli equation for measuring pressure gradients and the equation for measuring volume flow. When using this last equation, two assumptions are made: 1) the existence of a flat flow profile and, 2) the assumption that the area of flow (such as the atrioventricular valve orifices) is of circular shape, making it possible to calculate area from diameter measurements of cross·sectional echocardiograms. Also reviewed in this chapter are the measurement of the interception angles, use of pulsed-gated versus continuous-wave Doppler and future developments, like colour-coded Doppler echocardiography.
Chapter II consists of two articles in which quantitative Doppler flow measurements are validated in open chest animal models. In these studies, electromagnetic flow meters verified against a calibrated cylinder and stop watch are used as a gold standard for comparison. In the open chest animal model, a systemiC-to-pulmonary arterial shunt supported by a roller pump is interposed between the right femoral artery and the main pulmonary artery. Doppler frequency shift recordings and cross-sectional echocardiograms (obtained by direct apposition of the transducer on the apex of the heart) are used to calculate mean temporal velocity and area of flow. The simplified mitral valve method in the first article is also compared to a previously described method of flow measurements overthe mitral valve by Fisher et al (1983). Both methods. the tricuspid and the simplified mitral valve method, yielded a good correlation with data obtained by the electromagnetic flow meter
101

and the roller pump and the confidence limits were acceptable. Finally, both methods were compared to simultaneously obtained cardiac outputs by the thermodilution method in patients. These small studies again showed relatively good correlations but considerable width of confidence limits.
Chapter III reviews the quantitative Doppler echocardiographic methods in calculation of pulmonary and systemic blood flow in a canine model with variable-sized left-to-right extra-cardiac shunt. The Doppler flow measurements in this study were performed in the right ventricular outflow tract,just proximal to the pulmonary valve, to calculate systemic return flow. Since the existence of a ductus-like shunt prevented Doppler flow measurements in the pulmonary artery. due to the prevailing turbulence at this site, flow measurements were done just proximal to the valve, where the flow is laminar and the diameter of the area of flow can be easily obtained. The pulmonary flow is calculated as pulmonary return flow at the mitral valve orifice, as described by Fisher (1983). The results of this study showed a good correlation can be obtained between Doppler flow and electromagnetic flow measurements. The confidence limits for these measurements are acceptable. When comparing the QP/QS ratios obtained by the Doppler method with the electromagnetic flow meter. the correlation is less and confidence limits show a relatively wide margin. In the following small pilot study in II patients, where the method was compared to indicator dilution techniques, fairly acceptable results were obtained.
In chapter IV, the variability of the previously described methods of blood flow calculation at the mitral and tricuspid valve orifices is evaluated in 4 healthy subjects. These studies were performed during normal respiration and nonrespiration. Doppler shift recordings were integrated to obtain mean temporal velocity for each cardiac cycle separately. The mean temporal velocities during inspiration and expiration were compared, as were the mean temporal velocities of 20 consecutive cycles during respiration and non-respiration. The diameter of mitral and tricuspid valve orifices and the interception angles were measured in 10 consecutive cycles at 4 predetermined moments in the cardiac cycle. The mean temporal velocities were significantly higher during expiration than during inspiration for the mitral valve orifice and lower for the tricuspid valve orifice. The mean temporal velocity at both orifices showed a significantly smaller variability during non-respiration than during respiration. The diameter of the mitral and tricuspid orifice were significantly larger during diastole than during systole, while the standard error of the mean for both was the same. The interception angles measured at the mitral orifice were all close to 0° and show minimal variability, while at the tricuspid valve orifice the angle varied substantially in systole. In this
102

chapter we conclude that flow calculation data should be obtained while paying attentioh to the moment of respiration and are shown to be even better when obtained during non-respiration. Both temporal velocities and diameter measurements should be obtained from multiple cardiac cycles and a satisfactory number of measurements for flow calculation would be 3 cycles during nonrespiration for the mean temporal velocity, 10 cycles in mid diastole for the diameter and I cycle for the angle of interception during mid diastole.
Chapter V shows the use op Doppler cardiac flow studies in the normal human fetus between 18 and 40 weeks gestation. Fetal echocardiographic examination was performed using a four-chamber, short axis/ great vessel, long axis/left ventricular outflow tract and aortic arch views. Doppler instrumentation was used to obtain the flow velocity measurements in tricuspid, pulmonary outflow, mitral and aortic outflow regions. Calculation of cardiac output is performed by combining the information obtained in both the 2-D and the Doppler studies. The Doppler velocities were slightly greater through the tricupid than through the mitral valve region with a wide range of scatter but less than 15% variation in longitudinal studies of an individual fetus during gestation. Late diastolic velocities during atrial systole were higher than passive filling velocities, perhaps reflecting the increased compliance in human fetal heart. Fetal right heart dimensions and cardiac output were greater than the left heart dimension and cardiac output, indicating right heart dominance in the fetus.
Chapter VI stresses that the noninvasive techniques which are used in this study lack the risk on invasive techniques necessary to obtain the same data. This justifies a serious effort to validate the Doppler technique, as is done in the animal model, and to evaluate in a human population and the fetal setting. The very good results obtained in the animal experiments are a result of optimal circumstances, which will never be encountered in a clinical setting. Furthermore, the extremely good correlations as obtained in all previous studies are very promising but the relatively large confidence limits width clearly indicate the technique's limitations. The use of pulsed-gated instead of continuous-wave Doppler is discussed: the choice of pulsed-gated Doppler is dictated by the ready availability of these integrated devices. The assumption of flow profiles having a flat aspect is supported by previous studies but also by more recent colour-coded Doppler investigations. The assumption that the atrioventricular orifices are of circular shape is still a major consideration, but one should realize that using the annulus diameter for calculating an area as if it were an area of flow is hypothetical. The true area of flow is not really known and it may, in fact, be a coincidence that using the annulus
103

diameter yields a reasonable estimate of flow. The improvement of reproducibility of the measurements as has been shown to be considerable when effect of respiration and moment of the measurements in the cardiac cycle are taken into consideration. Finally, quantitative Doppler is a technique permitting noninvasive evaluation of fetal cardiac function, a realm not previously approachable.
104

Samenvatting
Hoofdstuk I is een introductiehoofdstuk en behandelt de initiele beschrijving van het Doppler effect en de toepassing van dit effect in de moderne medische technologic. Het gebruik van het Doppler effect in de cardiologic wordt besproken, waarbij de nadruk wordt gclegd op kwantitatieve toepassingen. De beide formules die gebruikt worden voor dit doe! zijn de vereenvoudigde Bernouilli formule, waarmee drukgradienten berekend kunnen worden en de formule gebruikt ter meting van het bloedstroom volume. Wanneer we deze laatste formule gebruiken, gaan we uit van twee aannames: 1) het bestaan van een vlak bloedstroom profiel en 2) de aanname dat het oppervlak waar de bloedstroom doorhcen gaat (zoals daar zijn de atrioventriculaire kleppen) circulair van vorm zijn. Dit maakt het namelijk mogelijk om het oppervlak te berekenen uit diameter metingen gedaan van twee-dimensionale echocardiogrammen. Verder wordt in dit hoofdstuk besproken het meten van de invalshoek, het gebruik van pulse gated vergclcken met continuous wave Doppler en tenslotte wordt aandacht besteedaan ontwikkelingen in de nabije toekomst, zoals de colour-coded Doppler echocardiografie.
Hoofdstuk II bestaat uit twee artikelen, waarin kwantitatieve Doppler blocdstroomberekeningen op hun waarde getoetst worden in het diermodel. In deze experimenten worden electromagnetische bloedstroommeters gebruikt die geijkt zijn met behulp van een gecalibreerde cylinder en een chronometer. Zij gelden als gouden standaards bij vergelijking van de methodieken. In het diermodel is een verbinding aangebracht tussen het arteriele en het pulmonale vaatsysteem; deze verbinding is aangebracht tussen de rechter femoraalarterie en de pulmonalis hoofdstam. De bloedstroom in deze verbinding wordt onderhouden door een pomp. Hct Doppler frekwentiesignaal en de twee-dimensionale echocardiogrammen (verkregen door de transducer direct op de apex van het hart tc plaatsen) zijn gebruikt om de 'mean temporal velocity' en hct bloedstroomoppervlak te berekenen. De vercenvoudigde mitraalklep methode in het eerste artikel is ook vergeleken met een tevoren beschreven methode van bloedstroomvolume bereke-
105

ning door Fisher en anderen (1983). Beide methodes, zowel de tricuspidalis als de vereenvoudigde mitraalklep methode leverden uitkomsten op die goed correleerden met de resultaten verkregen met de electromagnetische bloedstroommeter en de rolpomp; de betrouwbaarheidslimieten waren binnen acceptabele grenzen. Tenslotte worden beide methoden getoetst in patienten aan het tegelijkertijd met behulp van de therrnodilutie methode bepaalde hart minuut volume.
Hoofdstuk III beschrijft hoe de kwantitatieve Doppler echocardiograflsche methode gebruikt kan worden om onafhankelijk van elkaar de longbloedstroom en de systeembloedstroom te berekenen in een dierrnodel waarbij een extracardiale links-rechts shunt is aangebracht die in grootte gevarieerd kan worden. Omdat het bestaan van een links-rechts shunt, lijkend op die welke optreedt bij een persisterende ductus arteriosus, ons de mogelijkheid benam de bloedstroom in de pulmonaalarterie te meten, waar turbulentie optreedt in de bloedstroom, zijn deze metingen net voor de pulmonaalk!ep verricht, waar de bloedstroom nog wei een laminair karakter heeft en de diamater van het stroomoppervlak makkelijk verkregen kan worden. De longbloedstroom is in deze studie berekend als zijnde de bloedstroom terugkerend uit de longen. Deze berekening is verricht ter plekke van het mitraalostium volgens de methode zoals die beschreven is door Fisher (1983). De resultaten van dezestudie ton en aan dat een goede correlatie verkregen kan worden tussen de Doppler en electromagnetische bloedstroomberekeningen. De vertrouwenslirniet voor deze metingen zijn acceptabel. Wanneer de QP/QS ratio, verkregen volgens de Doppler methode en de electromagnetische flowmeter methode vergeleken worden, is de correlatie minder goed en liggen de betrouwbaarheidslimieten relatiefver van elkaar. Vervolgens is een klein onderzoek gedaan bij 11 patienten waar de methode vergeleken werd met indicator-verdunningstechnieken en redelijk acceptabele resultaten werden verkregen.
In hoofdstuk IV worden de tevoren beschreven methoden van bloedstroomvolume berekening over de mitraal- en tricuspidaalklep openingen geevalueerd in vier gezonde proefpersonen. De experimenten werden gedaan terwijl de proefpersonen normaal ademhaalden en tijdens ademstilstand. Doppler frekwentie signalen van deze experimenteD werden afzonderlijk gelntegreerd om de ~mean temporal velocity' van iedere hartcyclus afzonderlijk te kunnen berekenen. De mean temporal velocities werden vergeleken gedurende inspiratie en expiratie, terwijl ook vergeleken werden de mean temporal velocities gedurende 20 opeenvolgende hartcycli gedurende normaal ademhalen en gedurende ademstilstand. De diameter van de mitraalklep en tricuspidaalklep opening en de perceptiehoeken werden gemeten in 10 achtereenvolgende hartcycli op vier tevoren
106

bepaalde momenten in de hartcyclus. Het bleek, dat de mean temporal velocity significant hager was tijdens expiratie dan tijdens inspiratie in het mitraalklep ostium en dat het omgekeerde gold voor het tricuspidaalklep ostium. De mean temporal velocities gemeten over beide openingen, toonden duidelijk kleinere variabiliteit gedurende ademstilstand dan gedurende ademhaling. De diameter van de mitraal- en tricuspidaalklep openingen waren duidelijk groter gedurende diastole dan gedurende systole, standard error of the mean echter hetzelfde voor beide klepopeningen. De interceptiehoeken die gemeten werden met de mitraalklep opening, waren alle zeer dicht bij 0° en vertoonden een minimale variabiliteit gedurende de hartcyclus. De interceptiehoek gemeten in de tricuspidaalklep opening, echter, veranderde substantieel gedurende de systole. In dit hoofdstuk constateren we, dat de parameters benodigd voor de bloedstroom volume berekening verkregen moeten worden terwijl gelet wordt op het moment van de ademhaling en dat het eigenlijk beter is deze !evens te verkrijgen gedurende ademstilstand. Zowel de mean temporal velocity als de diameter metingen moeten verkregen worden van meerdere hartcycli en een voorwaarde om aanvaardbare meetresultaten te krijgen voor de bloedstroom volume berekening zou kunnen zijn 3 hartcycli gedurende ademstilstand om de mean temporal velocity te berekenen, 10 hartcycli gemeten in mid-diastole om de diameter te berekenen en 1 hartcyclus om de interceptiehoek te berekenen, verrnits dit gebeurt gedurende de mid-diastole.
Hoofdstuk V toont toepassing van Doppler bloedstroom volume metingen in de norrnale menselijke foetus bij 18 en 40 weken zwangerschapsduur. Foetale echocardiografie werd gedaan, waarbij een vierkamer doorsnede, een korte as/grote vaten doorsnede, een lange as/links ventriculair outflow tract en een aortaboog doorsnede gebruikt worden. De Doppler techniek werd gebruikt om de bloedstroomsnelheden te meten in de tricuspidaalklep, pulmonaalklep, mitraalklep en de aortaklep. Bij de berekening van het bloedstroom volume waren de verkregen gegevens gecombineerd met de Doppler bloedstroom snelheden in de tricuspidaalklep, hoger dan die gemeten in de mitraalklep, doch beide metingen vertonen een enorme spreiding, maar bij longitudinale onderzoeken zien we per foet dat de spreiding kleiner is dan 15%. Opmerkelijk was dat de laatste diastolische snelheden gedurende de atriale systole hoger waren dan de passieve vullingssnelheden. Mogelijkerwijs reflecteert dit de toename van de compliance in het menselijke foetale hart. De afmetingen van de foetale rechter hartshelft en het bloedstroomvolume daar waren groter dan die bij de linker hartshelft. Dit suggereert een dominantie van de rechterharthelft in de foet.
Hoofdstuk VI benadrukt nogmaals niet invasieve technieken zoals gebruikt in dit onderzoek minder risico met zich dragen dan de invasieve technieken nodig om
107

dezelfde gegevens te verkrijgen. Dit rechtvaardigt een serieuze paging om Doppler technieken op hun waarde te onderzoeken zoals gedaan is in het diermodel en om ze te evalueren in een menselijke populatie en de foetale situatie. Het is duidelijk dat de goede resultaten zoals die verkregen zijn bij de dierexperimenten het resultaat zijn van de optimale omstandigheden in zulk soort experimenten. Deze omstandigheden worden helaas nooit ontmoet in de klinische situatie. Daarnaast wordt aangegeven dat de goede correlaties zoals die gevonden zijn in de experimenten natuurlijk veelbelovend zijn, maar dat de ruime spreiding van de confiden~ tiegrenzen de beperkingen van de techniek aantonen. Het gebruik van pulsed Doppler in plaats van continuous wave Doppler wordt besproken. maar de keuze in dit onderzoek om pulsed Doppler te gebruiken is voornamelijk gedicteerd door de aanwezigheid van een echo-apparaat waarin zowel pulsed Doppler als tweedimensionale echo gelntegreerd waren. De aanname dat stroomprofielen inderdaad een vlak aspect hebben, wordt ondersteund door eerdere studies, maar ook door meer recente colour-coded Doppler onderzoeken. De aanname dat atrioventriculare openingen circulair van vorm zijn, vormt nog steeds een overweging, maar men moet zich realiseren dat gebruik van de klepopening diameter om het klepopeningsoppervlak uit te rekenen omdat dat het werkelijke bloedsstroom oppervlak is, een hypothetische aanname is. Het ware bloedstroom oppervlak is niet echt bekend en het zou een coincidentie kunnen zijn dat het gebruik van de diameter van klepopeningen een redelijke schatting van de flow daar doorheen oplevert. Een verbetering van de reproduceerbaarheid van de meting kan aanzienlijk zijn wanneer het effect van de ademhaling en het moment in de hartcyclus van de metingen in beschouwing worden genomen. Tenslotte zij opgemerkt dat kwantitatieve Doppler echocardiografie de enige techniek is die ons voorlopig een niet invasieve evaluatie van het foetale bloedstroom volume kan bieden.
108

References
Allan LD. Joseph MC, Boyd EGCA, Campbell S, Tynan M: M-mode echocardiography in the developing human fetus. Br Heart J 47:573, 1982
Angelsen B: In HadeL Angelsen B: Doppler ultrasound in cardiology. Physical and clinical applications. Philadelphia 1982. Lea & Febiger
Angelsen AJ, Brubakk AO: Transcutaneous measurement of blood velocity in the human aorta. Cardiovasc Res 10: 368, !976
Baker DW, Lorch G, Rubenstein S: Pulsed Doppler echocardiography. In Born N, editor: Echocardiography. The Hague, 1977. Martin us Nijhoff Publishers. p 207
Bellhouse BJ: Fluid mechanics of a model mitral valve and left ventrical. Cardiovasc Res 6: 199, 1972.
Boo JAJ de, Van Mill GJ. Van derWerfT: An improved non-invasive method to assess the ratio of pulmonary to systemic flow in adults using pulsed Doppler echocardiography. Eur Heart J 5; suppll:335, 1984
Brun P. Oddou C. Dantan P, Laporte JP. Laurent F, Perro P: Blood flow dynamics during human left ventricular filling phase. Proceedings Third International Conference on Cardiovascular dynamics. Leiden: 1978
Buys Ballot CMD: Akustische Versuche auf der niederUindischen Eisenbahn nebst gelegentlichen Bemerkungcn zurTheorie des Hrn. Prof. Doppler. Pogg Ann B 66: 321, 1845
Colocousis JS, Huntsman LL, Curreri PW: Estimation of stroke volume changes by ultrasonic Doppler. Circulation 56:914, 1977
Darsee JR. Mikolich RJ. Walter PF, Schlant RC: Transcutaneous method of measuring Doppler cardiac output. I. Comparison of transcutaneous and juxta-aortic Doppler velocity signals with catheter and cuff electromagnetic flowmeter measurements in closed and open chest dogs. Am J Cardiol46: 607. 1980
109

Darsee JR, Walter PF, Nutter DO: Transcutaneous Doppler method of measuring cardiac output. II. Noninvasive measurement by transcutaneous Doppler aortic blood velocity integration and M-mode echocardiography. Am J Cardiol46: 613, 1980
DeVore GR, Donnerstein RL, Kleinman CS, Platt LD, Hobbins JC: Fetal echocardiography I. Normal anatomy as determined by real-time-directed Mmode ultrasound. Am J Obstet Gynecoll44:249, 1982
DeVore GR, Donncrstein RL, Kleinman CS, Platt LD, Hobbins JC: Fetal echocardiography II. The diagnosis and significance of a pericardia} effusion in the fetus using real-time-directed M-mode ultrasound. Am J Obstet Gynecoll44:693, 1982
DeVore GR, Siassi B, Platt LD: Fetal echocardiography III. The diagnosis of cardiac arrhythmias using real-timedirected M-mode ultrasound. Am J Obstet Gynecoll64:792, 1983
DopplerJC: Ueber das farbige Licht der Doppelsterne und einiger anderer Gestirne des Himmels. Abhandlung der KOniglichen B6hmischen Gesellschaft der Wissenschaften; Ser 2:465, 1843
Fisher DC, Sahn DJ, Larson D, Valdes-CruzLM, Friedman MJ, Goldberg SJ, Allen HD. Horowitz$: Doppler determination of cardiac output using aorta, pulmonary artery and mitral valve orifice measurement site. Clin Res 30: 7a. 1982
Fisher DC, Friedman MJ, Sahn DJ, Larson D, Valdes-Cruz LM, Horowitz S, Goldberg SJ, Allen HD: The effect of variations of pulsed Doppler sampling site on calculation of cardiac output: an experimental study in open chest dogs. Circulation 67: 370. 1983
Fisher DC, Sahn DJ, Friedman JM, Larson D, Valdes-Cruz LM, Horowitz S, Goldberg SJ, Allen HD: The mitral valve orifice method for noninvasive two-dimensional echo Doppler determination of cardiac output. Circulation 67: 872, 1983
Friedman MJ, Sahn DJ, Larson D, Flint A: Two-dimensional echo-range gated Doppler measurements of cardiac output and stroke volume in open chest dogs. Circulation 62: III-101, 1980
Goldberg SJ, Sahn DJ, Allen HD, Valdes-Cruz LM, Hoenecke H, Carnahan Y: Evaluation of pulmonary and systemic blood flow by two-dimensional echo Doppler using fast Fourier transform spectral analysis. Am J Cardiol50: 1394, 1982
Gosling RG, Dunbar G, King D H, Newman D L, Slide CN, Woodcock JP, Fitzgerald DE, Keates JS, Macmillan D: The quantitative analysis of occlusive peripheral arterial disease by a nonintrusive ultrasonic technique. Angiology 22: 52, 1971
llO

Hatle L, Angelsen B: Doppler ultrasound in cardiology. Physical and clinical applications. Philadelphia 1982, Lea & Febiger, p 8
Holen J, Simonsen S: Determination of pressure gradient in mitral stenosis with Doppler echocardiography. Brit Heart J 41: 529, 1979
Kalmanson D, Toutain G, NovikoffN, Derai C, Cliche P, Cabrol C: Le cateterisme velocimetrique du coeur et des gros vaisseaux par sonde ultrasonique directionnelle a effet Doppler. Rapport preliminaire. Ann Med Int II: 685, 1969
Kleinman CS, Hobbins JC, Jaffe CC, Lynch DC, Talner NS: Echocardiographic studies of the human fetus: Prenatal diagnosis of congenital heart disease and cardiac dysrhythmias. Pediatrics 65:1059, 1980
Kleinman CS, Donnerstein RL, DeVore GR. Jaffe CC, Lynch DC, Berkowitz RL, Talner NS, Hobbins JC: Fetal echocardiographyfor evaluation of in utero congestive heart failure. N Engl J Med 306:568, 1982
Kleinman CS, Donnerstein RL, Jaffe CC, DeVore GR, Weinstein EM, Lynch DC, Talner NS, Berkowitz RL, Hobbins JC: Fetal echocardiography: A tool for evaluation of in utero cardiac arrhythmias and monitoring of in utero therapy: analysis of71 patients. Am J Cardiol51:237, 1983
Lange L W, Sahn DJ, Allen HD, Goldberg SJ, Anderson C, Giles H: Qualitative real-time cross-sectional echocardiographic imaging of the human fetus during the second half of pregnancy. Circulation 62:799, 1980
Lewis JF, Kuo LC, Nelson JG, Limacher MC, Quinones MA: Pulsed Doppler echocardiographic determination of stroke volume and cardiac output: clinical validation of two new methods using the apical window. Circulation 70:425, 1984
LightLH: Aortic blood velocity measurement by transcutaneous aortovelography and its clinical applications. In Born N, editor: Echocardiography. The Hague 1977. Martinus Nijhoff Publishers, p 233
Loeber CP, Goldberg SJ, Allen HD: Doppler echocardiographic comparison of flows distal to the four cardiac valves. JAm Coli Cardiol4:268, 1984
Lynch PR, Bove AA: . Patterns of bloodflow through the intact heart and valves. In Brewer LA, edttor: Prosthetic heart valves. Springfield, Ill., 1968. Thomas, p24
111

Magnin PA, StewartJA, Myers S, von Ramm 0, KissloJA: Combined Doppler and phased-array echocardiographic estimation of cardiac output. Circulation 63: 388, 1981
Martin R Rakowski H, Kleinman JH, Beaver W, London E, Popp R: Reliability and reproducibility of2D echo graphic measurements of stenotic mitral valve orifice area. Am J Cardio!43: 560, 1979
McDonald DA: Blood flow in arteries. Baltimore, 1960. William and Wilkins, p108
Meijboom EJ, Valdcs-Cruz LM, Horowitz S, Sahn DJ, Larson DJ, Young KA, Oliveira Lima C, Goldberg SJ, Allen HD: A two-dimensional Doppler echocardiographic method for calculation of pulmonary and systemic blood flow in a canine model with a variable-sized left-to-right extracardiac shunt. Circulation 68:437, 1983
Meijboom EJ, Horowitz S. Valdes-Cruz LM. Sahn DJ, Larson DE Oliveira Lima C: A Doppler cchocardiographic method for calculating volume flow across the tricuspid valve: correlating laboratory and clinical studies. Circulation 71:551. 1985
Ormiston JA, Shah PM, Tei C. Wong M: Size and motion of the mitral valve annulus in man. A two-dimensional echocardiographic method and findings in normal subjects. Circulation 64:113, 1981
Peronneau P, Xhaard M, Nowicki A, Pellet M, Delouche PH, Hinglais J: Pulsed Doppler ultrasonic flowmeter and flow patterns analysis. In Roberts D. editor: Blood flow measurement. London, 1972. Sector, p 24
Peronneau PA, Hinglais JR, Xhaard N, Delouce P, Philippa J: The effects of curvature and stenosis on pulsatile flow in vivo and in vitro. In Reneman RS, editor: Cardiovascular applications of ultrasound. Amsterdam. London/New York 1974. North Holland Pub! Co/ American Elsevier Pub! Co, Inc, p 203
Pourcelot L, Fourcade G, Guillaud C, George P: Dt:bit-mCtre sanguin a effet Doppler. Utilisation en t616mt:tric. Electronique Mt:dicale 41: 102, !967
Reneman RS, Clarke HF, Simmons N, Spencer MP: In vivo comparison of electromagnetic and Doppler flowmeters: with special attention to the processing of the analogue Doppler flow signal. Cardiovasc Res 7:557. 1973
Roberts WR. Sigel B, Gibson RJ, Williams J, Popky GL, Edelstein AL, Justin JR: Pulsed Doppler ultrasound detection of flow disturbances in arteriosclerosis. J Clin Ultrasound 4: 275, 1976
112

Roelandt J, Bredie P, Vletter W: Color-coded Doppler flow imaging: initial clinical experience. Ultrasonoor Bulletin. Abstracts of the 6th Symposium on Echocardiology Rotterdam: 74, 1985
Romero T. Covell J, Friedman WF: A comparison of pressure-volume relations of the fetal. newborn and adult heart. Am J Physiol222:1285, 1972
Rudolph AM. Heymann MA: Fetal and neonatal circulation and respiration. Annu Rev Physiol38:87, 1971
Sahn DJ. LangeL W, Allen HD, Goldberg SJ, Anderson C, Giles H, Haber K: Quantitative real-time cross-sectional echocardiography in the developing normal human fetus and newborn. Circulation 62:588, 1980
SabnDJ: Doppler flow mapping in pediatric cardiology. Ultrasonoor Bulletin Abstracts of the 6th Symposium on Echocardiology, Rotterdam: 70, 1985
Satomura S: Study of the flow patterns in peripheral arteries by ultrasonics. J Acoust Soc Am 2: 151, 1959
Shepard MJ, Richards VA, Berkowitz RL. WarsofSL, Hobbins JC: An evaluation of two equations for predicting fetal weight by ultrasound. Am J Obstet Gynecoll42:47, 1982
Steiingart RM, Meller J, Barovick J, Patterson R, Herman MV, Teichholz L: Pulsed Doppler echocardiography: measurement of beat to beat changes in stroke volume in dogs. Circulation 62: 542, 1980
Stevenson JG, Kawabori I: Noninvasive determination of pulmonic to systemic flow ratio by pulsed Doppler echoeardiography. Circulation 66:11-928. 1982
Stewart WJ. Pandian NG, Jiang L. Guerrero JL, Weyman AE: Comparison of quantitative Doppler measurement of aortic, mitral and pulmonic flow in an experimental model. Circulation 68: III-110, 1983
Strandness DE. Mccutcheon EP, Rushmer RF: Application of a transcutaneous Doppler flowmeter in evaluation of occlusive arterial disease. Surg Gynaec Obstet 122: 1030, 1960
Tandler J: Anatomic des Herzens. Jena 1913. Verlag von Gustav Fischer. p 114
113

Tei C, Pilgrim JP, Shah PM, Ormiston JA, Wong M: The tricuspid valve annulus: Study of size and motion in normal subjects and in patients with tricuspid regurgitation. Circulation 66:665. 1982
Valdes-Cruz LM, Sahn DJ: Two-dimensional echo Doppler for non-invasive quantitation of cardiac flow- a status report. Modern Concepts in Cardiovascular Disease 51:123. 1982
Valdes-Cruz LM, Mesel E, Horowitz S. Sahn DJ, Fisher DC, Larson D. Goldberg SJ, AllenHD: Validation of two-dimensional echo Doppler for measuring pulmonary and systemic flows in atrial and ventricular septal defects: a canine study. Circulation 66: II-231, 1982
Valdes-Cruz LM, Horowitz S. Mesel E. Sahn DJ, Fisher DC. Larson D. Goldberg SJ. AllenHD: A pulsed Doppler echocardiographic method for calculation of pulmonary and systemic flow: accuracy ina canine model with ventricular septal defect. Circulation 68:597, 1983
Vargas Barron J, Sahn DJ, Valdes-Cruz LM, Oliveira Lima C, Grenadier E. Allen HD, Goldberg SJ: Quantification of the ratio of pulmonary:systemic blood flow in patients with ventricular septal defect by two-dimensional range gated Doppler echocardiography. Circulation 66: !1-318, 1982
Walker AR, Phillips DJ, Powers JE: Evaluating Doppier devices using a moving string test target. J Clin Ultrasound 10: 25, 1982
Waters JS, Kwan OL, DeMaria AN: Sources of error in the measurement of cardiac output by Doppler techniques. Circulation 68: lll-229, 1983
Wladimiroff JW: Preliminary report on fetal cardiovascular dynamics in normal and hypertensive pregnancy. In Kurjak A, Rippmann ET editors: Current status ofEPHgestosis. Amsterdam 1980. Excerpta Medica, p 317
Yang SS, Bentivoglio LG, Maranhao V, Goldberg H: From cardiac catheterization data to hemodynamic parameters. ed 2. Philadelphia, 1978. F.A. Davis Co., p 219
114

Acknowledgements
I am indebted to:
David Jonathan Sahn, Professor in Pediatrics, Chairman of the Division of Pediatric Cardiology at the University of California San Diego who introduced me to the use of Doppler ultrasound in Pediatric Cardiology; who showed me how to research in this field and spent many evenings correcting and editing the various manuscripts; who has been a long- standing friend for me and has made my time in Tucson unforgettable by inviting me to live in his house.
Lilliam Valdes-Cruz, Associated Professor of Pediatrics, Division of Pediateric Cardiology, University of California San Diego, for her efforts and advice in preparing, conducting and evaluating the experiments. Her never-ending energy pulled the experiments and experimentators through the various difficulties we encountered during the project.
Dr. Ir. N. Born, Professor of Medical Technology, Erasmus University Rotterdam, who has spent much time outlining and designing the reproducibility study and correcting and editing the manuscript. He has taken ample time to explain to me many aspects of the physical background of quantitative Doppler.
Dr. J.R.T.C. Roelandt, Professor ofEchocardiography, Erasmus University Rotterdam, who has always been most generous with advice and help since I started to do research in Doppler echocardiography. With this thesis he once again has shown his willingness to help by agreeing to be one of my promoters.
Dr. K.K. Bossina, Professor of Pediatric Cardiology, University of Groningen, who advertised for someone to extend the use of echocardiography in his division. If it was not for this and subsequently his constant encouragement this thesis would not have been written.
115

Dr. J.W. Wladimiroff, Professor of Obstetrics, Erasmus University Rotterdam, for his advice concerning the fetal circulation and his positive criticism.
Dr. R.S. Reneman, Professor of Physics, University of Limburg, Maastricht, and Dr. 0. Daniels, pediatric cardiologist, St. Radboud-Ziekenhuis, Nijmegen, for agreeing to read the manuscript at very short notice, and their valuable comments which are included in this thesis.
Jr. H. Rijsterborgh, Physicist of the Interuniversity Cardiology Institute of the Netherlands, for his constant support in the analysis of the data.
Corrie Eefting, who, apart from her normal daily function as secretary for Experimental Echocardiography, Erasmus University Rotterdam, found it was not too much for her to retype the manuscript several times. Even towards the end with last minute corrections and deadlines to be met, she performed at the same standard of excellence.
Jr. H. Bot, Physicist of the Department of Cardiology, University of Amsterdam, for his help in obtaining the Doppler echocardiograms, the calculation of this recording and his structural criticism of Chapter IV.
Drs. J.A.J. de Boo, Resident in Cardiology, University of Utrecht, for his cooperation and criticism.
Finally I want to thank all those who have helped me in publishing the manuscript and preparing the thesis: Dr. Lindsey D. Allan (Guy's Hospital, London), Professor Thomas P. Graham (Vanderbilt University Nashville), Dr. John E. Deanfield, Richard Wise (Hospital for Sick Children, London), Suzanna Horowitz, Douglas Larson, Dr. Carlos Oliveira Lima, Kent A. Young, Dr. Katherine L. Reed, Sarah S. Scagnelli, Dr. Lewis Shenker (University of Arizona, Tucson) and especially Dr. Hugh D. Allen and Dr. Stanley J. Goldberg (University of Arizona, Tucson).
116

Curriculum vitae
Home address:
Office address:
Date of birth:
Place of birth:
Marital status:
Education:
Erik Jan Meijboom
206 Hawthorn Road Baltimore, Maryland 21210, U.S.A. Tel.(30 l )243-5844
Dept. of Pediatrics Division of Pediatric Cardiology University of Maryland Medical System 22 South Greene Street Baltimore, Maryland 21201, U.S.A. Tel.(301)528-6666
June 18, 1947
Rotterdam, the Netherlands
Married 1978 to Anna Maria Hubertha Wilhelmina van Laarhoven Daughter 1980 Bartje Ingrid Son 1983 Maurits Jacob
1959-1965 Calandlyceurn!Dalton-HBS, Rotterdam
1965-1966 Dental School University of Utrecht 1966-1973 Medical School University of Utrecht
117

Postgraduate training/ Fellowship appointments:
Staff appointments:
II8
I973-I977 Resident in Pediatrics (Prof. Dr. W.H.H. Tegelaers) University Hospital, University of Amsterdam, the Netherlands
I977-I978 Fellowship Pediatric Cardiology (Prof. Dr. G. Losekoot) University Hospital, University of Amsterdam, the Netherlands
I 978- I 980 Fellowship Pediatric Cardiology (S. Friedman M.D., W.J. Rashkind M.D.) Childrens Hospital of Philadelphia, University of Philadelphia Medical School, Philadelphia, Pennsylvania, U.S.A.
I982 Travelling Fellowship Doppler Echocardiography (D.J. Sahn M.D.; S.J.Goldberg M.D.), Health Science Centre, University of Arizona, Tucson, Arizona. U.S.A.
I984 Fellowship Doppler Echocardiography (Prof. Dr lr N. Born, Prof. Dr J.R.T.C. Roelandt), Thoraxcenter Erasmus University Rotterdam, the Netherlands
I985 Travelling Fellowship (Prof. F. Macartney M.D., J. Deanfield M.D.), Thoracic Unit, Hospital for Sick Children, Great Ormond Street, London, U.K.
I985 Honorary Fellow (Prof. S. Campbell, Ch. Rodeck), Dept. of Obstetrics, King's College School of Medicine and Dentistry, London, U.K.
I980-1984 Assistant Professor of Pediatric Cardiology (Prof. Dr. J. Fernandes, Prof. Dr. K.K. Bossina), Dept. of Pediatrics, Division of Pediatric Cardiology, University Hospital, University of Groningen, the Netherlands

Specialty Certification:
Licences:
Membership of professional and scientific organizations:
1985- present time Assistant Professor of Pediatrics and Obstetrics (M.A. Berman M.D.; M.C. Crenshaw M.D.), Dept. of Pediatrics and Obstetrics, University of Maryland Medical System, Baltimore, Maryland, U.S.A.
April 1978 (Dutch Board of Pediatrics)
The Netherlands (1973) United Kingdom (1985) No.2904065 ECFMG (No. 195-502-0) FLEX(l979) State of Pennsylvania (USA) (No. MD-038461-L) State of Maryland(USA) (No. D 32802)
Royal Dutch Medical Association (KNMG) Dutch Society of Pediatrics (section Pediatric Cardiology) American College of Cardiology American Academy of Pediatrics
119


Publications of the author
Abstracts:
1. Meijboom EJ. Gewitz MH. Wood DC. Fox WW: Contrast echocardiography in patients with persistent pulmonary hypertension of the newborn. Proceedings ASP/SPR:212, 1980
2. Becker AE, Meijboom EJ. Wilkinson J, Smith A, Anderson R: Tricuspid atresia is a form of univentricular heart: a concept supported by the anatomy of the atrioventricular conduction tissue. Proceedings Ass Europ Pediatr Card 13:45, 1977
3. Stephenson L W, Edmunds LH Jr, Friedman S, Meijboom EJ, Gewitz MH, Weinberg PM: Subclavian-left coronary arterial anastomosis (Meyer operation) for anomalous left coronary artery. Am Heart Ass 53rd Scientific Sessions; Miami, FA. Circulation 62:Ill-209, 1980
4. Meijboom EJ, Dijkstra I, Gewitz MH, Wood DC, Fox WW: Intracardiacright-to-left shunting in neonates evaluated by contrast echocardiography for qualitative and quantitative analysation of the shunt. Proceedings Ier Symposium International d'Echocardiologie foetale, Strasbourg: 262, 1982
5. De Langen CDJ, Meijboom EJ, Bink-Boelkens MThE, Bennekers JTh, Viersma JW, Kingma JH: Comparison of calcium channel blocking drugs on A V-nodal function of the porcine heart. Proceedings Fed Meeting of the Dutch Med Sc Society, Amsterdam, the Netherlands 1982:
6. Kingma JH, Meijboom EJ, De Langen CDJ: The different effects ofNifedipine and Verapamil on A V-nodal conduction and refractoriness in the porcine heart are maintained after B-adrenergic blockade. Proceedings Int Symposium on cardiac arrythmias, Marseille, France: 32, 1982
7. Meijboom EJ, GewitzMH. Wood DC. Fox WW: Diagnosis and evaluation of therapy in persistent fetal circulation syndrome by contrast echocardiography. Proceedings 8th Eur Congr of Perinatal Medicine, Brussels, Belgium: 304, 1982
121

8. Meijboom EJ. Visser GHA, Smit GPA, Fernandes J: Intra-uterine echocardiographic detection of myocardial hypertrophy as a sign of Pompe's disease. Proceedings 8th Eur Congr of Perinatal Medicine, Brussels, Belgium: 322, 1982
9. WoolfP, Stephenson L W, Meijboom EJ. Bavinck JH, GardnerTJ, Donahoo JS, Edie RN, Edmunds LH Jr: A comparison of the Blalock-Taussig, Waterston and Gore-tex shunts in cyanotic children less than a week of age. Am Heart Ass 55th Sc Sessions, Dallas. Texas. Circulation 66:11-32. 1982
10. Meijboom EJ, Valdes-Cruz LM, Sahn DJ: Two-dimensional Doppler echocardiographic methods for calculation of volume flows: pulmonary blood flow, systemic blood flow, and QP: Qs ratios. Ultrasonoor Bulletin, Abstracts of the 5th Symposium on Echocardiology, Rotterdam, the Netherlands: 95, 1983
11. Meijboom EJ, Val des-Cruz LM, Sahn DJ. Horowitz S. Larson DL. Oliveira Lima C. Bossina KK: Validation of a two-dimensional echo Doppler methodology for measuring pulmonary (Qp), systemic ( QJ bloodflow and QP: Os ratio in a canine model with a variable sized left-to-right ductus ateriosus like shunt. Proceedings of the XXth Annual Meeting AECP Bordeaux, France: 2, 1983
12. Meijboom EJ, Horowitz S, Valdes-Cruz LM, Sahn DJ, Larson DF, Oliveira Lima C. Allen HA, Goldberg SJ: Determination of flow over the tricuspid valve orifice by two-dimensional echo Doppler interrogation. Circulation 68: III-331, 1983
13. Reed KL. Meijboom EJ. Sahn DJ. Scagnelli S, Valdes-Cruz LM. Shenker L: Cardiac Doppler flow velocities in human fetuses. Circulation 68: III- 278, 1983
14. Meijboom EJ: Experimental tricuspid valve flow measurements. Proceedings Doppler Echocardiography Course. The Hague: 24. 1983
15. Ebels T, Meijboom EJ, Anderson RH, Lenstra D, Eygelaar A. Bossina KK, Homan van der Heide JN: Anatomical and functional obstruction of the outflow tract in atrioventricular septal defects with separate valVe orifices. Proceedings Eur Soc Ped Card. Vienna: 14, 1984
16. De Smedt MHC, Meijboom EJ, Visser GHA, Bossina KK, Huisjes HJ: De foetale circulatie in bet verloop van de graviditeit. Ultrasonoor Bulletin 12: 16, 1984
17. De Smedt MHC, Meijboom EJ, Visser GHA. Huisjes HJ. Bossina KK: Characterization of right and left ventricular filling and flow in the human fetus. Proceedings XI Annual Conference Soc for the Study of Fetal Physiology, Oxford U.K.: 22, 1984
18. Meijboom EJ, De Smedt MCH. Visser GHA, Bossina KK. Huisjes HJ: Crosssectional Doppler echocardiographic evaluation ofthe fetal cardiac output during lind and IIIrd trimester of pregnancy. A longitudinal study. Proceedings Int. Symposium Physiological Development of Fetus and Newborn, Oxford U.K.: C 52. 1984
122

19. Meijboom EJ, De Smedt MCH. Visser GHA. Jager W, Huisjes HJ: Cross- sectional Doppler echocardiographic evaluation of human fetal function in normal and pathophysiologic circumstances. Proceedings 105th Meeting Blair Bell Research Society. London, 1985
20. Ebels T, Meijboom EJ, Anderson RH, Schasfoort-van Leeuwen MJM. Eijgelaar A. Homan van der Heide JN: Anatomical correlations between left ventricular inflow and outflow tract in atrioventricular septal defect with separate valve orifices. Proceedings 2nd World Congress of Pediatric Cardiology, New York: 42, 1985
21. Meijboom EJ, De Smedt MCH. Visser GHA, Ebels T, Sahn DJ: 2D echo Doppler characterization of right and left ventricular filling and flow in human fetus. A serial study. Proceedings 2nd World Congress of Pediatric Cardiology. New York: 131. 1985
22. De Smedt MCH, Meijboom EJ, Visser GHA, Ebels T, Jager W: Ventricular filling patterns change gradually during pregnancy, but dramatically after birth. Proceedings 2nd World Congress of Pediatric Cardiology. New York: 10. 1985
23. Meijboom EJ, De Smedt MCH, VisserGHA,Jager W, Huisjes HJ, Campbell S: Fetal echocardiography; the view of the pediatric cardiologist. Ultrasonoor Bulletin, Abstracts of the 6th Symposium on Echocardiology Rotterdam: 43, J 985
24. Ebels T, Meijboom EJ, Anderson RH, Schasfoort-van Leeuwen MJM, Eijgelaar A. Homan van der Heide JN: Doppler echocardiographic evaluation of inflow- and outflow tract properties in postoperative atrioventricular septal defect with separate valve orifices ('ostium prim urn atrial septal defect'). Ultrasonoor Bulletin, Abstracts of the 6th Symposium on Echocardiology Rotterdam: 22, 1985
25. Visser GHA, Laurini RN, Jager W, De Smedt MCH, Meijboom EJ: Umbilical artery velocity waveforms in type I diabetic pregnancy. A longitudinal study. Abstracts of the XII Annual Meeting of the Soc for the Study of fetal physiology, Haifa: C-23, 1985
26. Ebels T. Ho SY, Anderson RH, Meijboom EJ, Eijgelaar A: The surgical anatomy of the left ventricular outflow tract in an atrioventricular septal defect: Implications for A V-valve replacement. Proceedings of the XVII World Congress of the International Society for Cardiovascular Surgery, Monte Carlo. J Cardiovasc Surg 26:5:121. 1985
27. Born N, Rijsterborgh H, Meijboom EJ: Problems in measuring cardiac Doppler values. Proceedings WFUMB'85. Sydney, 1985. Pergamon Press, p 374
28. Meijboom EJ, De Smedt MCH, Visser GHA. Fetal cardiac output in the course of gestation. 13th Annual Meeting of the Southern Perinatal Association, New Orleans, February 1986 (accepted)
29. Meijboom EJ, Ebels T, Wise RKH. Deanficld JE, Anderson RH: Regurgitation ofthe left atrioventricular valve after repair of the atrioventricular septal defect. An echo Doppler study. 58th American Heart Association (AHA) Scientific Sessions. Washington, November 1985 (accepted)
123

30. Ebe1s T, Ho SY, Anderson RH, Meijboom EJ, Eijge1aar A: The surgical anatomy of the left ventricular outflow tract in an atrioventricular septal defect. Submitted to the 35th Scientific Session of the Am Coil Cardiol. Atlanta, March 1986
3!. Meijboom EJ, De Smedt MCH, Visser GHA, Jager W, Nicolaides K. Campbell S. Fetal cardiac output measurements by Doppler echocardiography. Submitted to Society of Perinatal Obstetricians, San Antonio. January 1986
Papers:
I. Meijboom EJ: Landbezetting in Suriname. Haagse Post. Jrg 59 No.32: 14
2. Meijboom EJ, Gewitz MH, Wood DC, Fox WW: Evaluation of right-to-left intracardiac shunting in newborns by contrast echocardiography. In Rijsterborgh H, editor: Echocardiology. The Hague/Boston/London. 1981. Martinus Nijhoff Publishers. p 383
3. Stephenson L W, Edmunds LH Jr, Friedman S, Meijboom EJ, Gewitz MH. Weinberg PM: Subclavian left coronary arterial anastomoses (Meyer operation) for anomalous left coronary artery. Circulation 64:11-130. 1981
4. Meijboom EJ, Gewitz MH, Wood PC. Fox WW: Contrast echocardiography in persistent fetal circulation. In Meltzer RS. Roeland! J, editors: Contrast Echocardiography. The Hague/Boston/London, 1982. Martin us Nijhoff Publishers. p 203
5. Kingma JH. Meijboom EJ, De Langen CDJ: The different effects of nifedipine and verapamil on A V-nodal function in the porcine heart are maintained after Badrenergic blockade. In Levy S. Gerard R. editors: Recent advances in cardiac arrythmias. London, 1983. John Libbey, p 354
6. Meijboom EJ. Valdes-Cruz LM, Horowitz S. Sahn DJ, Larson DF. Young KA. Oliveira Lima C. Goldberg SJ, Allen HD: A two-dimensional Doppler echocardiographic method for calculation of pulmonary and systemic blood flow in a canine model with a variable-sized left-to-right extracardiac shunt. Circulation 68: 437. 1983
7. De Langen CDJ. Meijboom EJ, Kingma JH: Heart-rate dependent modulation of atrioventricular nodal conduction and its influence on the effect of calcium antagonists. Comparison of Verapamil and Nifedipine. J Cardiovasc Pharmacal 6;2: 267, 1984
8. Meijboom EJ, Bam bang Oetomo S, Schasfoort-van Leeuwen MJM. Cromme- Dijkhuis AH: De cvaluatie van de persisterende ductus arteriosus in de premature nconaat door middel van 2-dimcnsionale Doppler cchocardiografie. Nederlands Tijdschrift voor Geneeskunde 128:28: 1358, 1984
9. Ebels T. Meijboom EJ, Anderson RH, Schasfoort-van Leeuwen MJM, Lenstra D. Eijgelaar A, Bossina KK, Homan van der Heide JN: Anatomical and functional
124

obstruction of the outflow tract in atrioventricular septal defects with separate valve orifices. Am J Cardiol54:843. 1984
!0. WoolfP. Stephenson L W. Meijboom EJ. Bavinck JH. GardnerT J. Donahoo JS. Edie RN. Edmunds LH Jr: A comparison of the Blalock-Taussig, Waterston and Gore-tex shunts in cyanotic children less than a week of age. Ann Thorac Surg 38:26, 1984
11. Meijboom E.J .. Horowitz S, Valdes-Cruz L.M., Sahn D.J., Larson D.F., Oliveira Lima C. A Doppler echocardiographic method for calculating volume flow across the tricuspid valve: correlative laboratory and clinical studies. Circulation 71:551, 1985
12. Meijboom EJ: Noninvasive diagnosis in congenital heart disease (Editorial). Tnt J Cardiol9:l. 1985
13. Kragt H. Aarnoudse JG, Meijboom EJ, Laurini JL: Prenatal ultrasonic diagnosis and management of ectopia cordis. Eur J Obstet Gyn Reprod Biol20:177, 1985
14. Ebels T, Meijboom EJ, Anderson RH, Schasfoort-van Leeuwen MJM, Eijgelaar A, Homan van der Heide JN: Anatomical correlations between left ventricular inflow and outflow tract in atrioventricular septal defect with separate valve orifices. In Doyle EF, Engle MH, Gersony WM. Rashkind WJ, Talner NS, editors: Pediatric Cardiology. New York, 1985. Springer Verlag: (in press)
15. Meijboom EJ. De Smedt MCH. Visser GH. Ebels T. Sahn DJ: 2D echo Doppler characterization of right and left ventricular flow in the human fetus. In: Doyle EF, Engle MH, Gersony WM, Rashkind WJ, Talner NS, editors: Pediatric Cardiology. New York, 1985. Springer Verlag: (in press)
16. Meijboom EJ. De Smedt MCH. Visser GHA. Jager w. Bossina KK. Huisjes HJ: Cross-sectional Doppler echocardiographic evaluation of the fetal cardiac output during lind and IIIrd trimester of pregnancy. A longitudinal study. In Jones CT, Nathanielz PW, editors: Physiological development of fetus and neonate. London, 1985. Academic Press: (in press)
17. Meijboom EJ. Ebels T, Anderson H. Schasfoort-van Leeuwen MJM. Deanfield JE, Eijgelaar H, Homan van der Heide JN: The left atrioventricular valve after surgical repair in atrioventricular septal defect with separate valve orifices (ostium primum atrial septal defect). An echo Doppler study. Am J Cardiol (in press)
18. Reed KL. Meijboom EJ. Scagnelli SA. Valdes-Cruz LM. Sahn DJ. Shenker L: Cardiac Doppler flow velocities in human fetuses. Circulation (in press)
19. Ebels T, Anderson RH. Meijboom EJ, Eijgelaar A: Surgical anatomy of the left ventricular outflow tract in atrioventricular septal defects. Ann Thorac Surg (in press)
20. Meijboom EJ, Horowitz S, Valdes-Cruz LM. Larson DF, Born N, Rijsterborgh H. Sahn DJ. A simplified mitral valve method for 2D echo Doppler blood flow calculation: validation in an open chest canine model and initial clinical studies. J Am Coli Cardiol (submitted)
125

21. Ebels T, Eijgelaar A, Meijboom EJ, Anderson RH, Homan van der Heide JN: Left ventricular atrioventricular valve replacement with resection of the ventricular infundibular valves in atrioventricular septal defect. Ann Thorac Surg (submitted)
22. De Smedt MCH, Meijboom EJ, Visser GHA, Sahn DJ: Fetal cardiac output in the course of gestation. A longitudinal study by quantitative 2D Doppler echocardiography. Circulation (submitted)
23. Meijboom EJ, Rijsterborgh H, Bot H. De BooJAJ, RoelandtJRTC, Born N: Limits of reproducibility ofbloodflow measurements by Doppler echocardiography~ variability within the technique. JAm Cardiel (in preparation)
24. Meijboom EJ. Baker KR. Fetal Cardiology. Famous teachings in modern medicine (in preparation)
126