Quantification of Aortic Stenosis based on the …. Zahol J.H. Nagel! A.S. Agatstoo· Quantification...
6
T.P. Zahol J.H. Nagel! A. S. Agatstoo· Quantification of Aortic Stenosis based on the Morphology of Doppler Ultrasound Signals using Image Processing techniques ABSTRACT A method was developed to evaluate the morphologic structure of continuous wave Doppler ultrasound signals in order to quantify aortic valve stenosis in the human heart. The systolic peaks of the Doppler signal were assigned digital images and the stability of shape information was tested for patients with low stroke volume and ao1al fibrillation. The results inclicate that the shape of the signal peaks remains stable despite variations in amplitude and duration. The shape information was then used to quantify the severity of aortic stenosis by optimally matching Doppler peak images to selected templates representing typical diagnostic patterns. The developed software is capable of automatic extraction of shape information from Doppler ultrasound signals in order to suppon the clinical decision about valve functioning and replacemem. 1 Introduction Although known for more than a century. the Doppler effect has become useful for clinical practice only recently. Based on increased numerical power and highly efficient spectral analysis techniques Doppler Echocardiography has become widely accepted as an effective and noninvasive tool to assess valvular function in the human heart. Several groups [1-4] were able to demonstrate its ability to predict the transvalvular pressure gradient in comparison to angiographic data. Furthermore Doppler ultrasound has proven capable to render the pressure gradient based on the measurement of blood flow velocity across the valve. By employing the simplified Bernoulli Equation. = 4V'. the measured velocity v can easily be converted to the pressure difference. Mt. Sinai Medical Center. Miami Beach TechOical University of nmenau Biomedical Inf onnatics 422 Proc. of World Congress on Medical Physics and Biomedical Engineering, Rio de Janeiro, 1994, pp. 973-977
Transcript of Quantification of Aortic Stenosis based on the …. Zahol J.H. Nagel! A.S. Agatstoo· Quantification...

T.P. Zahol J.H. Nagel! A.S. Agatstoo·
Quantification of Aortic Stenosis based on the Morphology of Doppler Ultrasound Signals using Image Processing techniques
ABSTRACT
A method was developed to evaluate the morphologic structure of continuous wave Doppler ultrasound signals in order to quantify aortic valve stenosis in the human heart. The systolic peaks of the Doppler signal were assigned digital images and the stability of shape information was tested for patients with low stroke volume and ao1al fibrillation. The results inclicate that the shape of the signal peaks remains stable despite variations in amplitude and duration. The shape information was then used to quantify the severity of aortic stenosis by optimally matching Doppler peak images to selected templates representing typical diagnostic patterns. The developed software is capable of automatic extraction of shape information from Doppler ultrasound signals in order to suppon the clinical decision about valve functioning and replacemem.
1 Introduction
Although known for more than a century. the Doppler effect has become useful for clinical practice only recently . Based on increased numerical power and highly efficient spectral analysis techniques Doppler Echocardiography has become widely accepted as an effective and noninvasive tool to assess valvular function in the human heart. Several groups [1-4] were able to demonstrate its ability to predict the transvalvular pressure gradient in comparison to angiographic data. Furthermore Doppler ultrasound has proven capable to render the pressure gradient based on the measurement of blood flow velocity across the valve. By employing the simplified Bernoulli Equation. ~p = 4V'. the measured velocity v can easily be converted to the pressure difference.
Mt. Sinai Medical Center. Miami Beach
TechOical University of nmenau Biomedical Infonnatics
422
Proc. of World Congress on Medical Physics and Biomedical Engineering, Rio de Janeiro, 1994, pp. 973-977

For the purpose of this study. the evaluation of data derived from the aortic valve is of particular interest. Since the transaortic gradient primarily detennines the hemodynamic stress placed on the left ventricle. it remains the most important parameter for clinical decision on valve replacement [5] . The reliability of diagnosis is here of particular importance since surgical replacement as well as insufficient functioning of the aortic valve imposes an high risk to the patient. Despite the fact that continuous wave (eW) Doppler ultrasound is extensively applied in the noninvasive quantification of aortic insufficiency and stenosis. its reliability has been questioned especially in the elderly with systolic peak velocities between 3 and 4 mls [6]. In this major patient population. decreased structural visibility is often accompanied by abnormalities in left ventricular function. The resulting variations in RR interval and stroke volume (SV) are manifested as significant changes in amplitude and duration of the ew Doppler velocity spectrum. Displayed in Fig.l they are likely to become clinically misleading using traditional planimetric methods. As observed by Agatston et. al .[7]. the spectral morphology of the CW systolic velocity peak can be particularl y useful to quantify aortic stenosis in the elderly. Therefore it was the aim of this work to develop signal processing techniques. capable to extract and describe morphological features in excess to the proposed peak-to-peak!ejection-time ratio [6]. This way it will be possible
.. ..
to improve the diagnostic potential FigJ :Variarioll ill cw Doppler during AF of Doppler ultrasound by adding additional parameters. useful to quantify valve malfunctions. There are 2 questions to be answered: I . Does the overall shape of the CW spectrum remain stable during recording of patients with
poor left ventricular function and resulting variations in SV and RR Interval? 2. Is the morphology of the CW spectrum obtained at the aortic valve indicative to the
severity of aortic stenosis?
2 Method
The methodology of this study was to base the quantification of stenosis on the entire morphologic structure of the cw Doppler signal instead of extracting just a single gradient parameter as done so far. Therefore each systolic peak of the Doppler signal was considered a digital image.
2.1 Data Digitalization
The baseline here is to describe each point in a defmed region as a numerical pixel of given intensity. The first. and essential goal is. to transfer as much as possible of the information available into numerical fonnat. Ideally. there would be a direct conversion of spectral data from their analog fonnat inside the ultrasound equipment into digital pixels. For several reasons this was not possible during this study. The principle 'of signal assignment employed here is presented in Fig.2 .
423
Proc. of World Congress on Medical Physics and Biomedical Engineering, Rio de Janeiro, 1994, pp. 973-977

As can be seen, each systolic peak was separately assigned a 64 by 128 pixel image and extended to 128x 128 format in order to apply Fast Fourier Transformation (FFT) algorithms . The base of the grabbing frame was set at the 1 mJs mark and the time coordinate was uiggered by the ECG R-peak. Signals below 1 mts could be excluded from the image since they are assumed to carry no significant information about the conditions across the valve. Most of them are seen to originate from sound reflections along the way of the Doppler beam . Due to the present clinical constraints the digitalization was achieved by scanning paper hardcopies with 300 dpi (dots per inch) resolution. The resulting digital image was base for all of the performed calculations and will be referred to as "original " from here on.
2.2 Validation of Shape Stability
._-+-- , . /.
128
Fig.2: digiral image assignlllelll
To validate Agatston's observation of morphological significance [6] two major studies were done. The first one is designed to show, that regardless of effects influencing the absolute dimensions of the velocity peak, its overall shape remains stable for each subject. Apicella et al .[8] has recently presented a method, called "fast correlation matching" useful for the registration of multimodality images in MRI. The idea behind it is to transform digital images into a domain where translation effects disappear while rotation and global scaling become simple shifts . This theory was originally developed to compensate for the limited pattern recognition abilities of optical correlators [9][10] . In our study. the possibility of rotation could be excluded since the Doppler signal as time sequence of velocity spectra is straight vertical oriented in any case. This reduces the task to translation removal and optimal scaling. In distinction to Apicella's method and its modification by Cideciyan et al.[I I]. we cannot assume global scaling of the velocity peaks. Fig.3 displays the observation, that intrasubject peak shape variation seems to be limited to either ejection time prolongation (scale in x-direction) or acceleration of flow (scale in y-direction) . This does not imply a constant relation between the two scaling factors . Both will vary seemingly independent, since several physiological factors do influence them in a complex and hardly describable manner. For that reason, the transformation applied must prove capable of finding independent scaling factors for the x and y direction . The method to find the set of scaling factors resulting in the maximal degree of similarity between two images is from here on called "optimal matching" and contains the following steps:
lew Doppler I
IOCGI [ I: . It"-- ' : r----' -.. ___ . _______ -i ~ r- ' -/ , ....J : :. • • It · .. ',' ,. i I
Fig.3: dimensional varia/ions dllring AF
42 4
Proc. of World Congress on Medical Physics and Biomedical Engineering, Rio de Janeiro, 1994, pp. 973-977
I. Transform the 2 originals into the Fourier domain, 2. Calculate the power spectra and separate two consecutive sectors, 3. Transform each sector into the logarithmic domain, 4. Obtain the correlation function between the corresponding sectors of the 2 originals, Therefore, for each sector pair do:
A. Calculate the Fourier transformation for both images again, B. Multiply one image with the complex conjugate of the other one, C. Perform inverse Fourier transformation on the product,
S. Add the correlation functions of both sectors and search for the maximum, 6. Obtain the coordinates of the maximum and retransfer them into the spatial domain, 7. Scale the larger image toward the smaller one, 8. Calculate the correlation coefficient between the scaled originals .
2.3 Validation of Morphological Significance
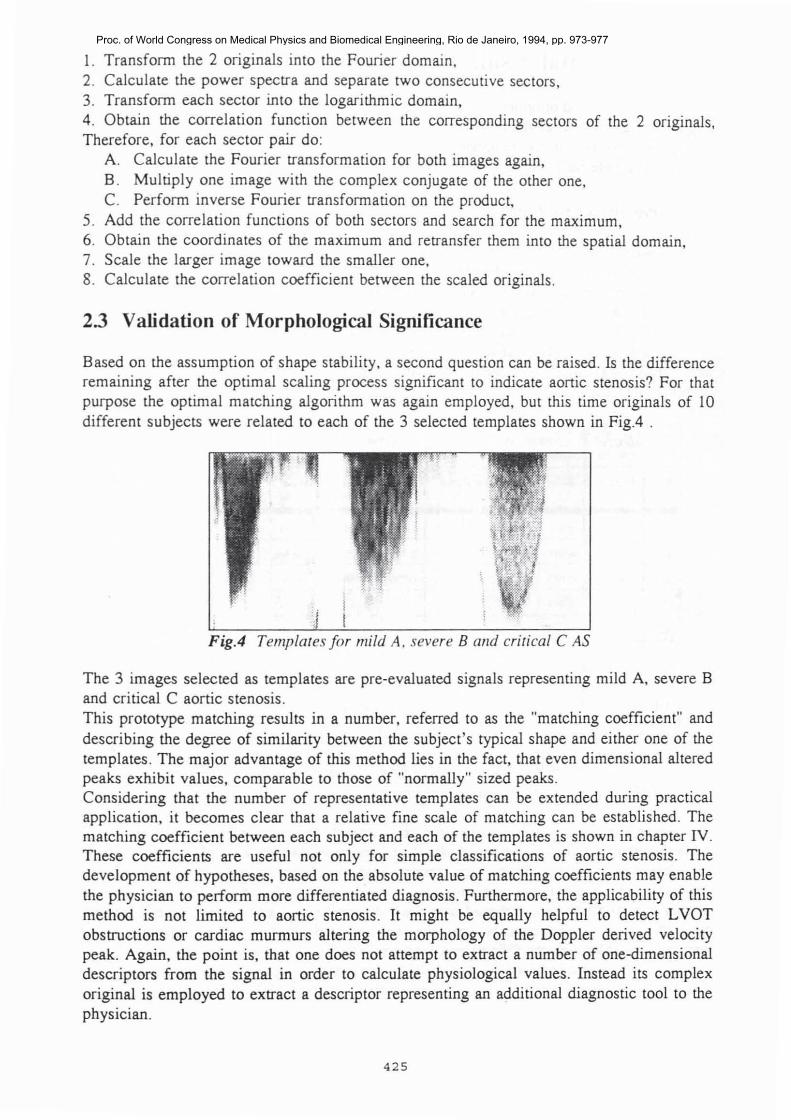
Based on the assumption of shape stability, a second question can be raised . Is the difference remaining after the optimal scaling process significant to indicate aonic stenosis? For that purpose the optimal matching algorithm was again employed, but this time originals of 10 different subjects were related to each of the 3 selected templates shown in Fig.4 .
FigA Templates for mild A, severe B alld crirical CAS
The 3 images selected as templates are pre-evaluated signals representing mild A, severe B and critical C aortic stenosis . This prototype matching results in a number, referred to as the "matching coefficient" and describing the degree of similarity between the SUbject 's typical shape and either one of the templates . The major advantage of this method lies in the fact, that even dimensional altered peaks exhibit values, comparable to those of "normally" sized peaks. Considering that the number of representative templates can be extended during practical application, it becomes clear that a relative fine scale of matching can be established. The matching coefficient between each subject and each of the templates is shown in chapter IV. These coefficients are useful not only for simple classifications of aortic stenosis. The development of hypotheses, based on the absolute value of matching coefficients may enable the physician to perform more differentiated diagnosis . Furthermore, the applicability of this method is not limited to aortic stenosis . It might be equally helpful to detect LVOT obstructions or cardiac murmurs altering the morphology of the Doppler derived velocity peak. Again, the point is, that one does not attempt to extract a number of one-dimensional descriptors from the signal in order to calculate physiological values. Instead its complex original is employed to extract a descriptor representing an additional diagnostic tool to the physician.
425
Proc. of World Congress on Medical Physics and Biomedical Engineering, Rio de Janeiro, 1994, pp. 973-977
3 Experimental results
The developed method of optimal matching was able to show the intrapatient stability and the diagnostic significance of the morphologic structure of cw Doppler signals. By employing appropriate sets of sample templates, reliable and fast quantification of aortic stenosis becomes available for patients with low and/or changing stroke volume.
3.1 Intrasubject matching
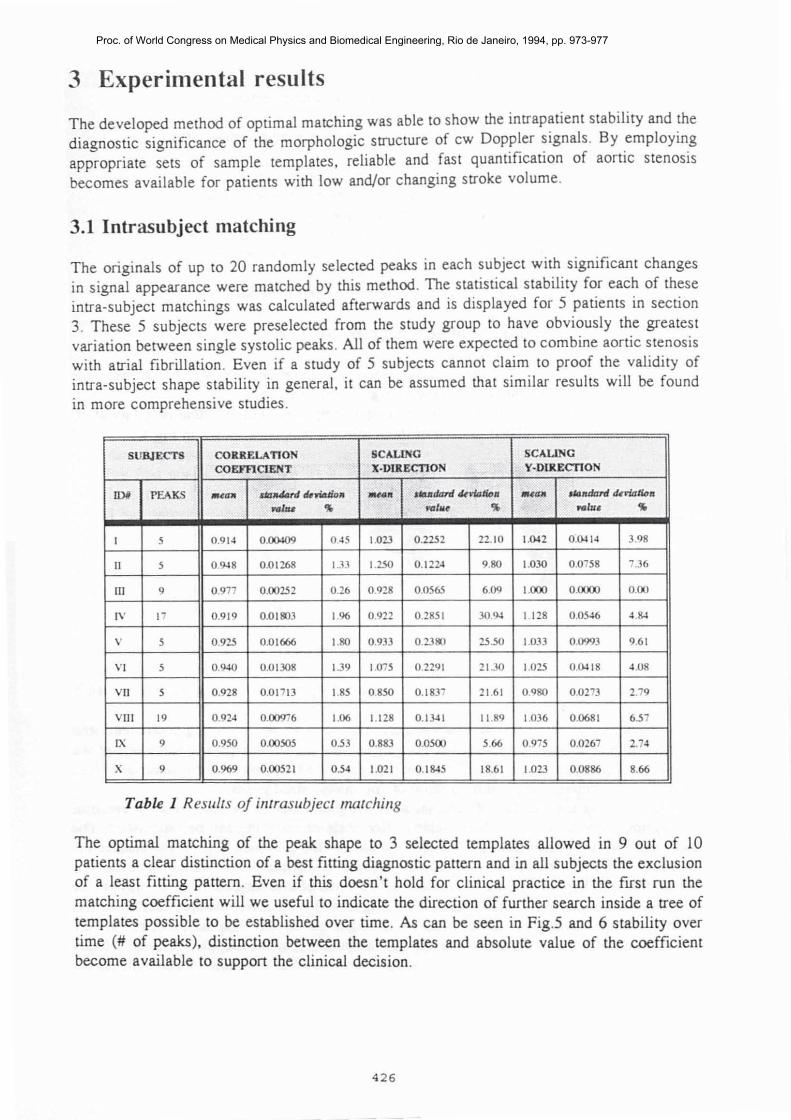
The originals of up to 20 randomly selected peaks in each subject with significant changes in signal appearance were matched by this method . The statistical stability for each of these intra-subject matchings was calculated afterwards and is displayed for 5 patients in section 3. These 5 subjects were preselected from the study group to have obviously the greatest variation berween single sys tolic peaks . All of them were expected to combine aortic stenosis with atrial fibrillation . Even if a study of 5 subjects cannot claim to proof the validi ty of intra-subject shape stability in general. it can be assumed that similar results will be found in more comprehensive studies .
SUBJECTS CORRELATION SClIoLING SClIoLING
COEFf1ClENT X·VUlECTION Y-DUlECTION
IDi PEAKS .... '" <ia7J40rd dmaJiD. -_. 'Udmd IkvWtioa .. .... ",,-_II<>" NI:u ')Ii 1dt",e ')Ii ... Illl' ')Ii
I 5 0 .914 0 .00109 0.5 1.023 0.2252 22.10 1.~2 O.~I. 3.98
II 5 0.~8 0.01268 1.J3 1.250 0 . 122-1 9.80 1.030 0 .0758 7.36
ill 9 0 .977 0.00252 0.26 0.928 0.0565 6.09 1.000 0 .0000 0 .00
IV 17 0.919 0.011103 1.96 0.922 0 .2851 3O.~ I 128 0.05~ •. s.
v 5 0.925 0 .01666 1.110 0.933 O.23*> 25.50 1.033 0 .0993 9.61
VI 5 0 .9-10 0.01308 139 1.075 0.2291 21.30 1.025 0.~18 • . 08
Vll 5 0.928 0.01713 1.85 0.850 0.1837 21 .61 0980 0 .0273 2.79
VIII 19 O.92.J 0.00976 1.06 1.128 O. I~I 11 .89 1036 0.0681 6.57
IX 9 0.950 0.00505 0.53 0.883 0 .0500 5.66 0.975 0 .0267 2.7'
X 9 0.969 0.00521 0.54 1.021 0.1S.5 18.61 1.023 0.0886 8.66
Table I Results of illtrasubject matcilillg
The optimal matching of the peak shape to 3 selected templates allowed in 9 out of 10 patients a clear distinction of a best fitting diagnostic pattern and in all subjects the exclusion of a least fitting pattern. Even if this doesn't hold for clinical practice in the first run the matching coefficient will we useful to indicate the direction of further search inside a tree of templates possible to be established over time. As can be seen in Fig.5 and 6 stability over time (# of peaks), distinction between the templates and absolute value of the coefficient become available to support the clinical decision.
426
Proc. of World Congress on Medical Physics and Biomedical Engineering, Rio de Janeiro, 1994, pp. 973-977

cc , . . , - .
-' -- -- ..... -•• . , . ,
o I 1 3 4 ~ , 1 II II 10 ' d ~.
Fig.S : Templare marching subjecr 3
cc , . ., • • .,
c •• .,
o I 2 J • $ 6 1 II Si 10 11 ' D' ~.
Fig 6: Templare marching slIbjecr 4
The developed method of optimal matching was able to show the intrapatient stability and the diagnostic significance of the morphologic structure of cw Doppler signals . By employing appropriate sets of sample templates, reliable and fast quantification of aortic stenosis becomes available for patients with low and/or changing stroke volume.
References [1] Goldmann DE, Huerter TF. Tabular data of the velocity and absorption of high
frequency sound in mammalian tissues . J Acoust Soc Am No.28:35, 1956. [2] Agatston AS, Chengot M, Rao A. Hildner F, Samet P. Doppler diagnosis of valvular
aortic stenosis in patients over 60 years of age. Am J Cardiol NO.56: 106-109, 1985. [3] Agatston AS . Doppler diagnosis of valvular aortic stenos is . Echocardiography:
A review of cardiovascular ultrasound Vol.3, No.1 , 1986. [4] Deviak RJ, Zrnic DS. Doppler radar and weather observations . Academic Press San
Diego, 1993. [5] Obeid AI. Echocardiography in clinical practice. J.B .Lippincott Company Philadelphia,
New York, London, Hagerstown, 1987 . [6] Hatle L. Noninvasive assessment and differentiation of left ventricular outflow
obstruction with doppler ultrasound. Circulation No.64:382-387, 1981. (7) Richter HS . Mitral valve area:measurement soon after cathederization. Circulation
No.28:451-454, 1963. [8) Apicella A, Kippenhan JS, Nagel JH. Fast multi-modality image matching.
Proc SPIE Vol.1092, Medical Imaging ill: Image Processing :252-263, Feb. 1989. [9] VanderLugt A. Signal detection by complex mtering. IEEE Trans . Inform.Theory,
No.IT-10(2):139,1964. [10] Weaver CS, Goodman JW. Technique for optically convolving two functions . Applied
Optics No.5: 1248-1249,1966. [11] Cideciyan AV, Jacobson SG, Kemp CM, Knighton RW, Nagel HJ. Registration of
high resolution images of the retina. SPIE Vo1.1652 Medical Imaging VI: Image Processing 310-322, 1992.
4 27
Proc. of World Congress on Medical Physics and Biomedical Engineering, Rio de Janeiro, 1994, pp. 973-977