Quanta Image Sensorimagesensors.org/wp-content/uploads/2016/03/2015-June-IISW-Multi... · Quanta...
35
-1- © E.R. Fossum 2015 Multi-bit Quanta Image Sensors Eric R. Fossum International Image Sensor Workshop (IISW) Vaals, Netherlands June 10, 2015
Transcript of Quanta Image Sensorimagesensors.org/wp-content/uploads/2016/03/2015-June-IISW-Multi... · Quanta...

-1- © E.R. Fossum 2015
Multi-bit Quanta Image Sensors
Eric R. Fossum
International Image Sensor Workshop (IISW)
Vaals, Netherlands
June 10, 2015
-2- © E.R. Fossum 2015
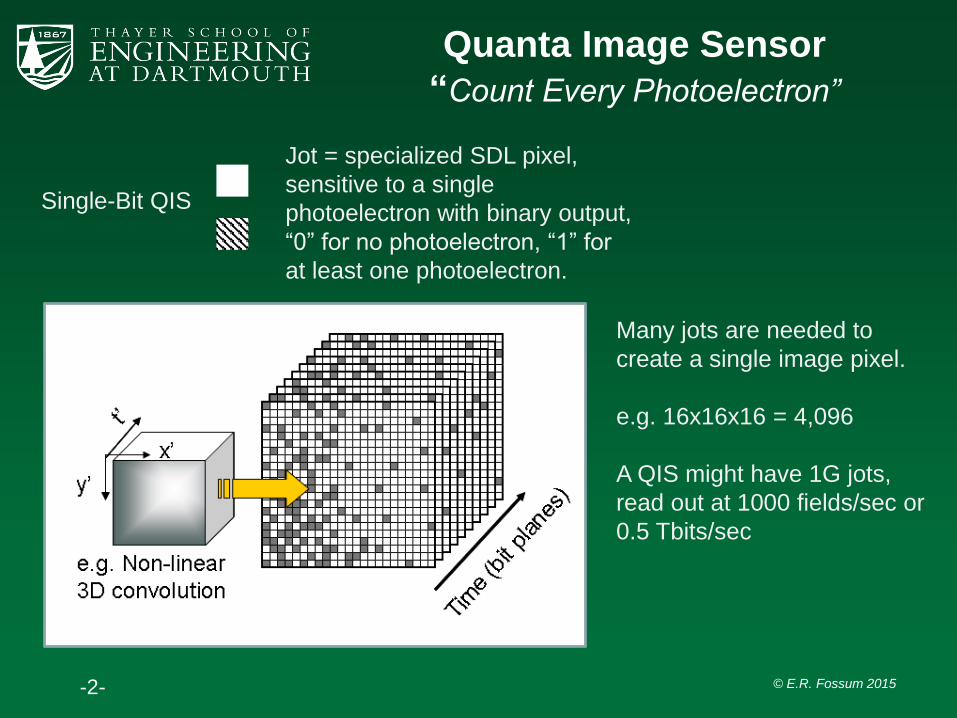
Quanta Image Sensor
“Count Every Photoelectron”
Jot = specialized SDL pixel,
sensitive to a single
photoelectron with binary output,
“0” for no photoelectron, “1” for
at least one photoelectron.
Many jots are needed to
create a single image pixel.
e.g. 16x16x16 = 4,096
A QIS might have 1G jots,
read out at 1000 fields/sec or
0.5 Tbits/sec
Single-Bit QIS
-3- © E.R. Fossum 2015
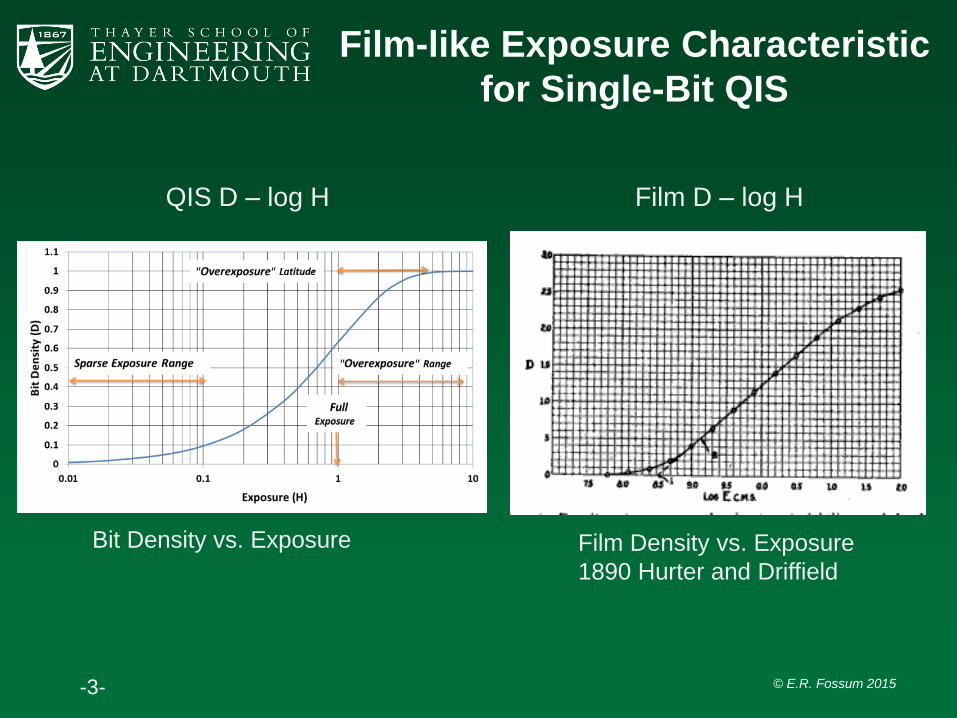
Film-like Exposure Characteristic
for Single-Bit QIS
Bit Density vs. Exposure Film Density vs. Exposure
1890 Hurter and Driffield
QIS D – log H Film D – log H

-4- © E.R. Fossum 2015
Figure of Merit:
Flux Capacity 𝜙𝑤
𝜙𝑤 = 𝑗𝑓𝑟/𝜎 𝛾
𝑗 = 𝑗𝑜𝑡 𝑑𝑒𝑛𝑠𝑖𝑡𝑦 (𝑝𝑒𝑟 𝑐𝑚2)
𝑓𝑟 = 𝑓𝑖𝑒𝑙𝑑 𝑟𝑒𝑎𝑑𝑜𝑢𝑡 𝑟𝑎𝑡𝑒 (𝑝𝑒𝑟 𝑠𝑒𝑐)
𝜎 = 𝑠ℎ𝑢𝑡𝑡𝑒𝑟 𝑑𝑢𝑡𝑦 𝑐𝑦𝑐𝑙𝑒
𝛾 = 𝑎𝑣𝑒𝑟𝑎𝑔𝑒 𝑞𝑢𝑎𝑛𝑡𝑢𝑚 𝑒𝑓𝑓𝑖𝑐𝑖𝑒𝑛𝑐𝑦
At the flux capacity, there is an
average of one photoelectron per jot
• At 500nm jot pitch, 1000fps, 100% duty cycle and 35% QE, 𝜙𝑤 ≅ 1012/𝑐𝑚2𝑠
• Corresponds to ~100lux (555nm, F/2.8, RT=80%)
Drives high jot density and field readout rate so can handle
normal lighting conditions
And improve SNR per sq. cm of sensor area.

-5- © E.R. Fossum 2015
Multi-bit Jot
Increases Flux Capacity
Single bit jot
0, 1 electrons
Multi-bit (2b) jot
0, 1, 2, 3 electrons
𝜙𝑤𝑛 = 𝑗𝑓𝑟 2𝑛 − 1 /𝜎 𝛾
At the flux capacity, there is an
average of 2𝑛 − 1 photoelectrons
per n-bit jot
Can increase flux capacity at same jot density and field readout rate
Or, relax field readout rate and/or jot density for same flux capacity
Little impact on detector and storage well. Little impact on FD CG or
voltage swing (e.g. 1mV/e -> 31mV swing for 5b jot.
-6- © E.R. Fossum 2015
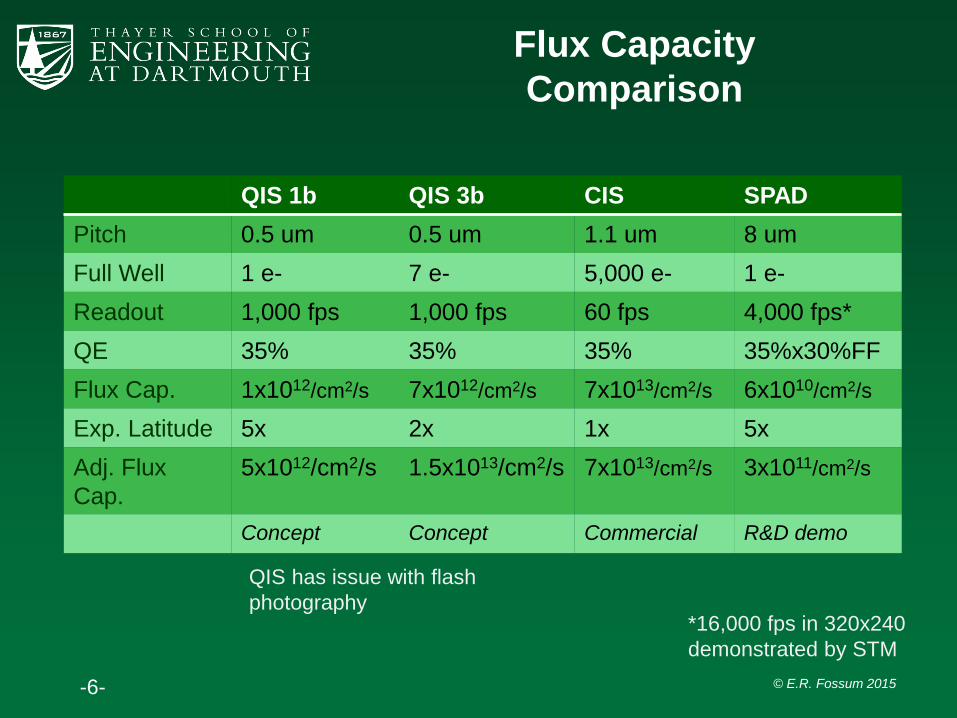
Flux Capacity
Comparison
QIS 1b QIS 3b CIS SPAD
Pitch 0.5 um 0.5 um 1.1 um 8 um
Full Well 1 e- 7 e- 5,000 e- 1 e-
Readout 1,000 fps 1,000 fps 60 fps 4,000 fps*
QE 35% 35% 35% 35%x30%FF
Flux Cap. 1x10¹²/cm2/s 7x10¹²/cm2/s 7x10¹³/cm2/s 6x10¹⁰/cm2/s
Exp. Latitude 5x 2x 1x 5x
Adj. Flux
Cap.
5x10¹²/cm2/s 1.5x10¹³/cm2/s 7x10¹³/cm2/s 3x10¹¹/cm2/s
Concept Concept Commercial R&D demo
*16,000 fps in 320x240
demonstrated by STM
QIS has issue with flash
photography
-7- © E.R. Fossum 2015
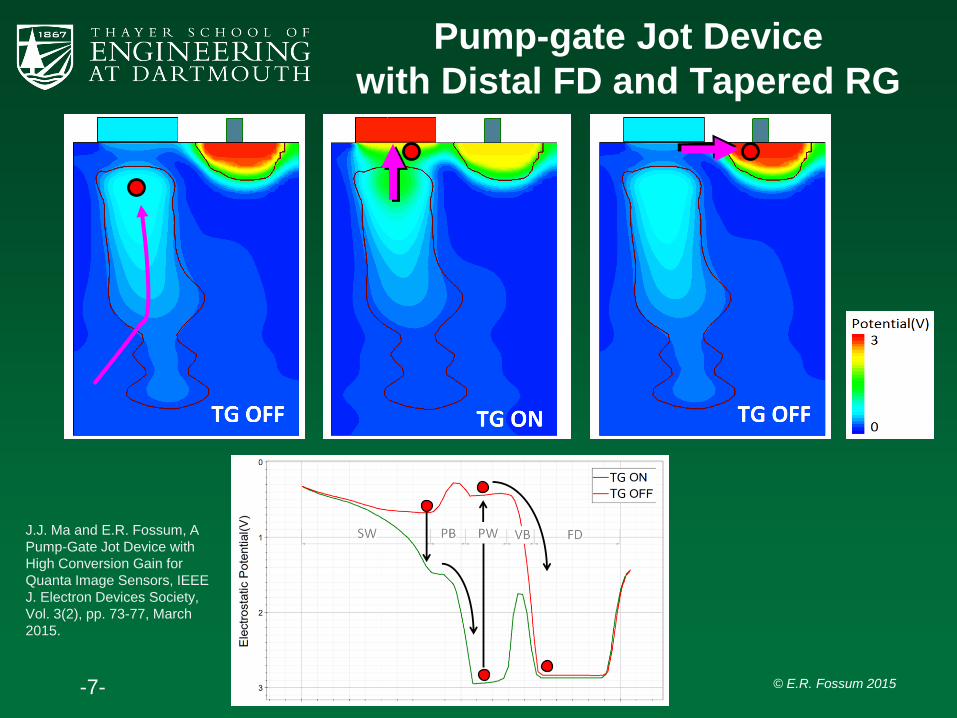
Pump-gate Jot Device
with Distal FD and Tapered RG
J.J. Ma and E.R. Fossum, A
Pump-Gate Jot Device with
High Conversion Gain for
Quanta Image Sensors, IEEE
J. Electron Devices Society,
Vol. 3(2), pp. 73-77, March
2015.
-8- © E.R. Fossum 2015
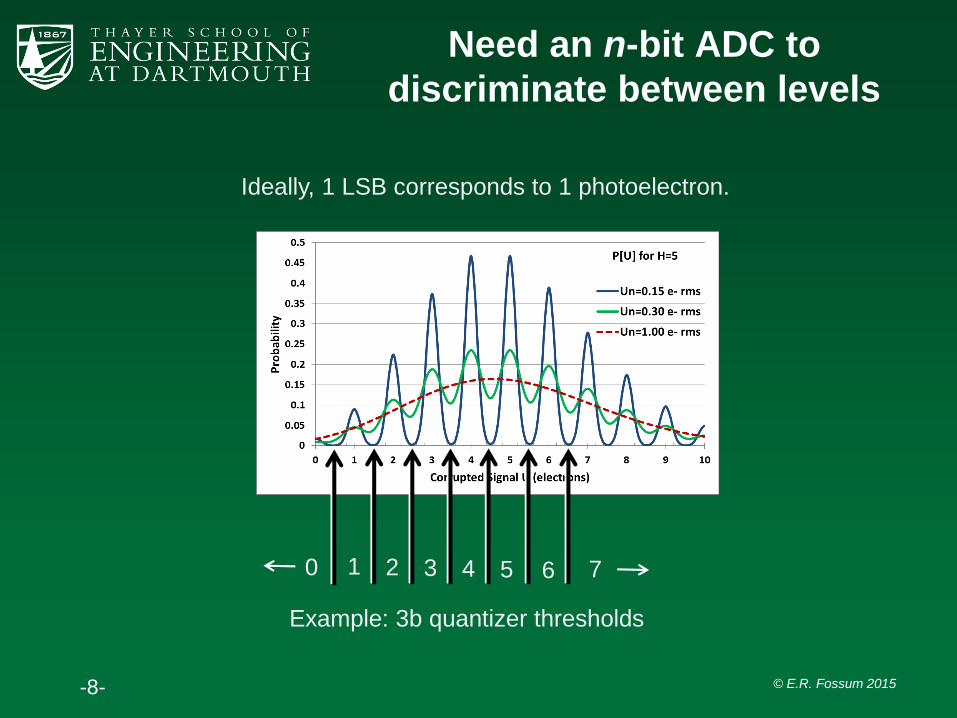
Need an n-bit ADC to
discriminate between levels
Ideally, 1 LSB corresponds to 1 photoelectron.
0 1 2 3 4 5 6 7
Example: 3b quantizer thresholds

-9- © E.R. Fossum 2015
MINI-PAPER IN A PAPER
Recent Results: Jiaju Ma and E.R. Fossum
-10- © E.R. Fossum 2015
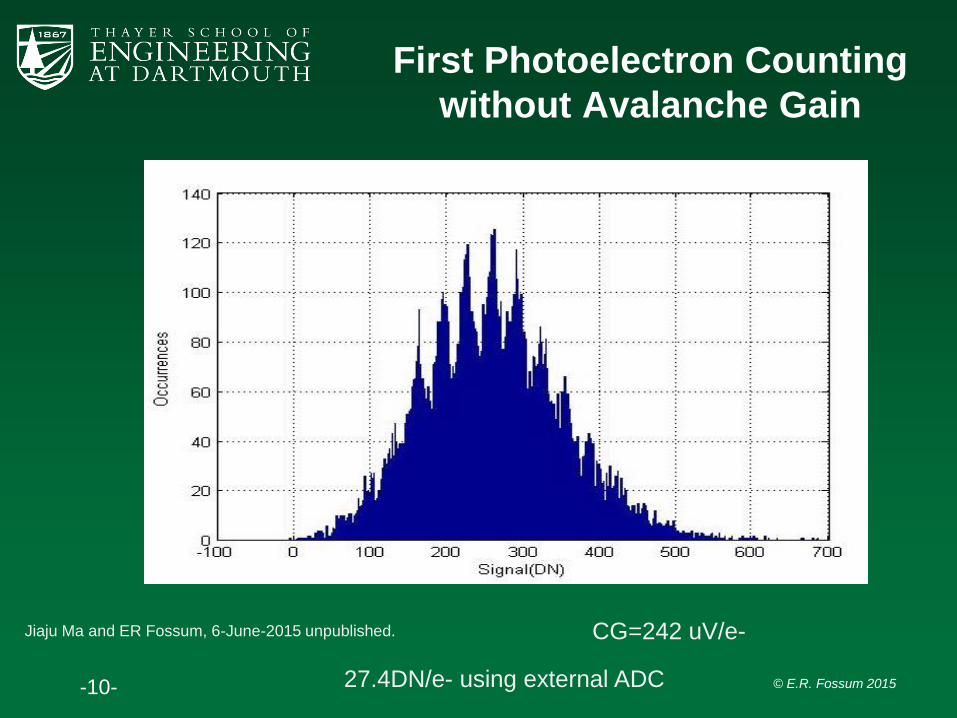
First Photoelectron Counting
without Avalanche Gain
Jiaju Ma and ER Fossum, 6-June-2015 unpublished. CG=242 uV/e-
27.4DN/e- using external ADC

-11- © E.R. Fossum 2015
Photoelectron Counting
Histogram (PCH) Model
This fit is quite good with mean of 8.2, std. of 2.86 e-, read noise of 0.32 e- rms.

-12- © E.R. Fossum 2015
Jiaju Ma and ER Fossum, 6-June-2015 unpublished. CG=242 uV/e-
Photoelectron Counting
Histogram (PCH) Model
-13- © E.R. Fossum 2015
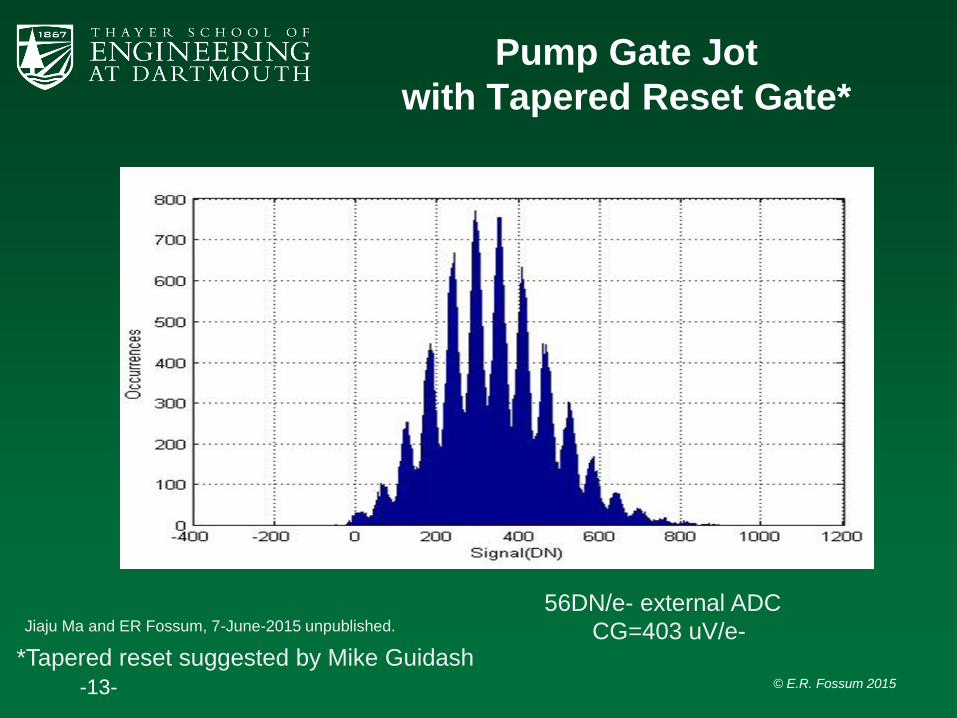
Pump Gate Jot
with Tapered Reset Gate*
CG=403 uV/e-Jiaju Ma and ER Fossum, 7-June-2015 unpublished.
56DN/e- external ADC
*Tapered reset suggested by Mike Guidash

-14- © E.R. Fossum 2015
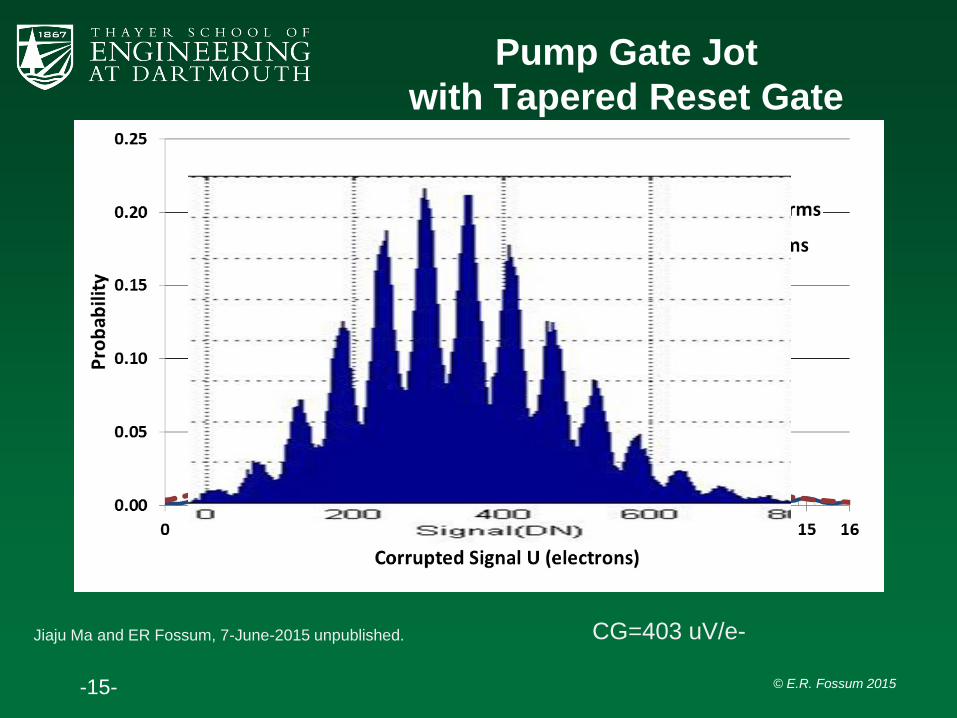
Pump Gate Jot
with Tapered Reset Gate
-15- © E.R. Fossum 2015
Pump Gate Jot
with Tapered Reset Gate
CG=403 uV/e-Jiaju Ma and ER Fossum, 7-June-2015 unpublished.
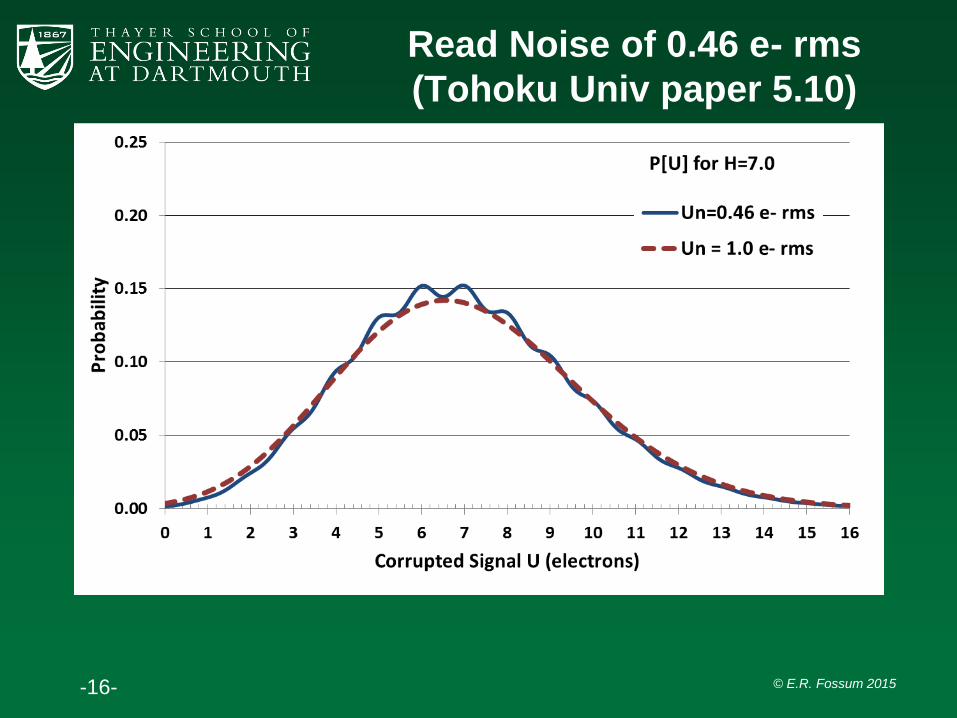
-16- © E.R. Fossum 2015
Read Noise of 0.46 e- rms
(Tohoku Univ paper 5.10)
-17- © E.R. Fossum 2015
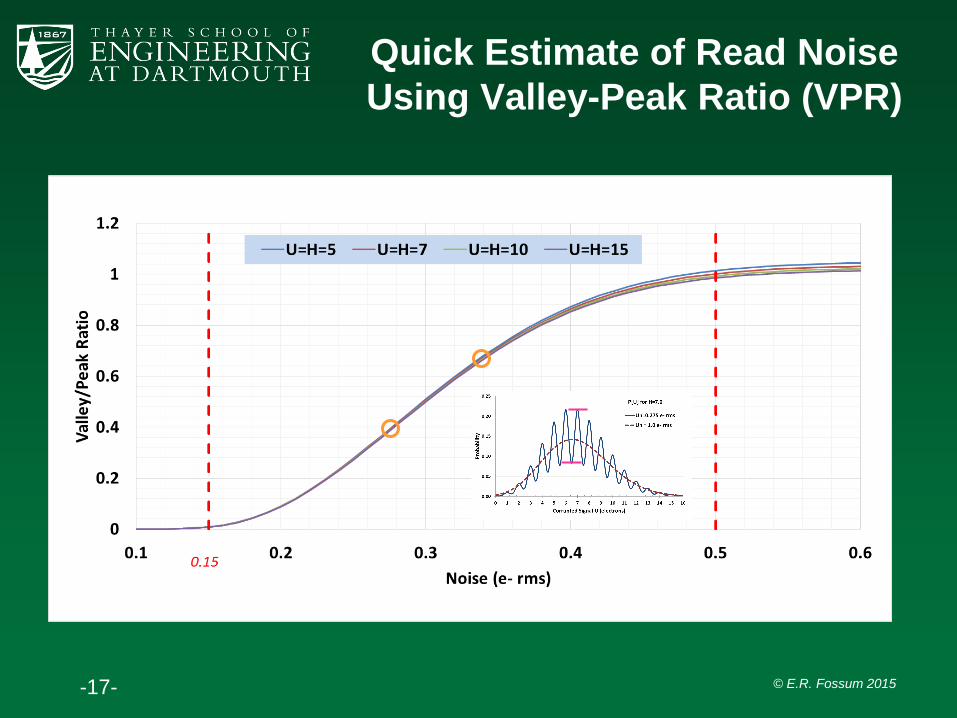
Quick Estimate of Read Noise
Using Valley-Peak Ratio (VPR)

-18- © E.R. Fossum 2015
Late News Summary
PG jot Tapered PG jot
Pitch Size 1.4μm 1.4μmPTC CG 241.7 μV/e- 403.0 μV/e-
Dark Read Noise 96.89 μV rms
(0.40e- rms)
136.9 μV rms
(0.34e- rms)
Jot SF Read Noise 96.06 μV rms 136.3 μV rms
PCH CG 255.8 μV/e- 426.2 μV/e-VPR Read Noise 0.32e- rms 0.28e- rms
Full Well Capacity 288e- 210e-
RT Dark Current <10e-/s <10e-/s
Col. Bias Current 416nA 416nA

-19- © E.R. Fossum 2015
End of Mini-Paper
-20- © E.R. Fossum 2015
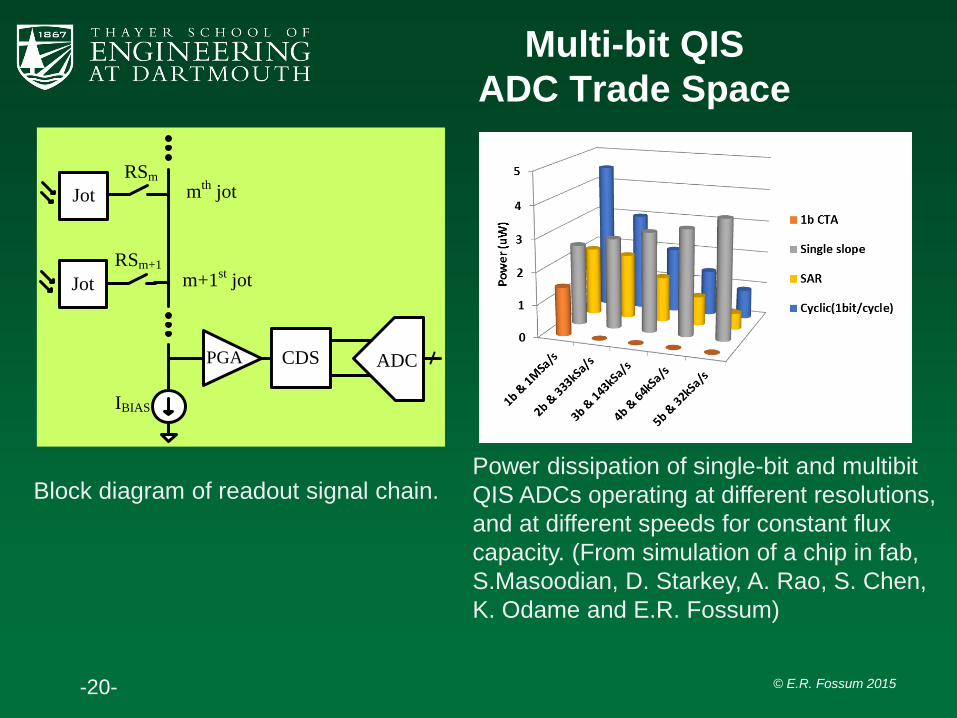
Multi-bit QIS
ADC Trade Space
Block diagram of readout signal chain.
mth jot
m+1st jot
RSm
RSm+1
Jot
Jot
IBIAS
CDS ADCPGA
Power dissipation of single-bit and multibit
QIS ADCs operating at different resolutions,
and at different speeds for constant flux
capacity. (From simulation of a chip in fab,
S.Masoodian, D. Starkey, A. Rao, S. Chen,
K. Odame and E.R. Fossum)
-21- © E.R. Fossum 2015
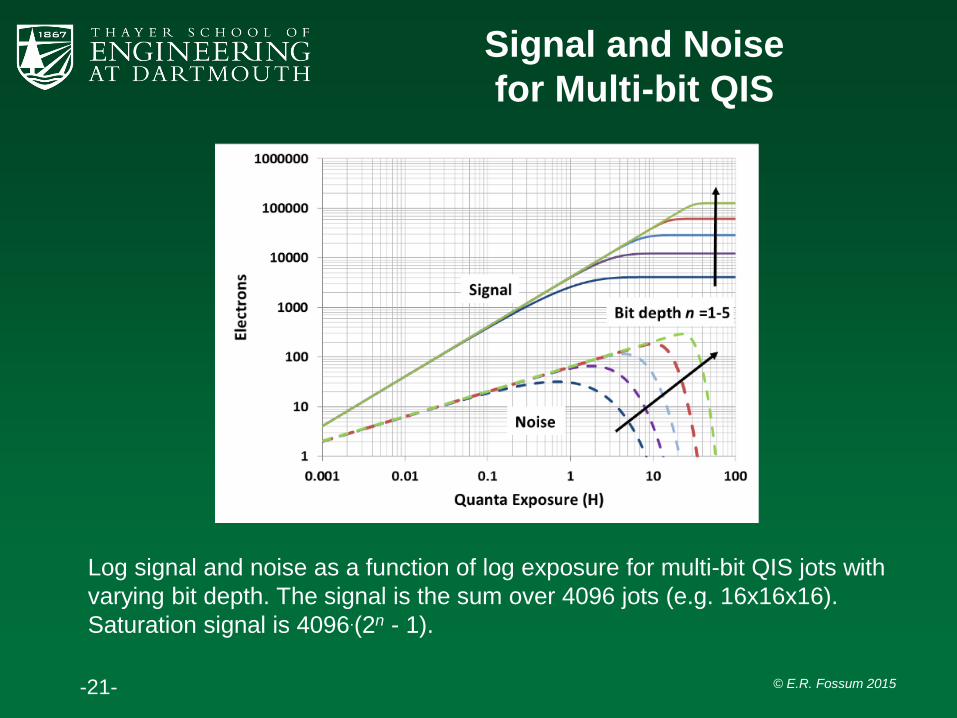
Signal and Noise
for Multi-bit QIS
Log signal and noise as a function of log exposure for multi-bit QIS jots with
varying bit depth. The signal is the sum over 4096 jots (e.g. 16x16x16).
Saturation signal is 4096.(2n - 1).
-22- © E.R. Fossum 2015
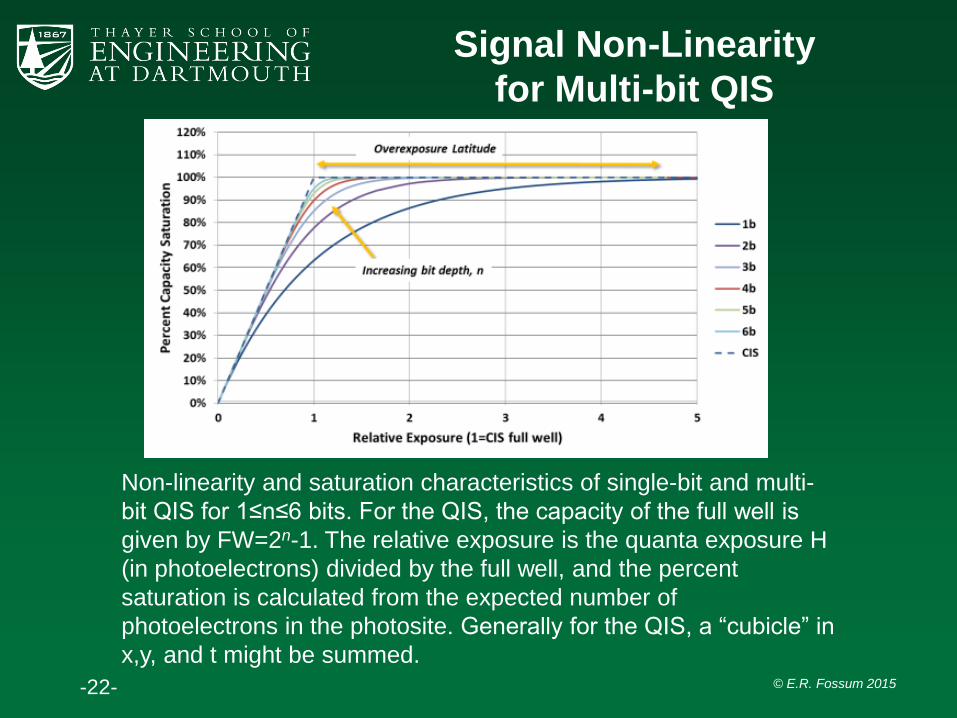
Signal Non-Linearity
for Multi-bit QIS
Non-linearity and saturation characteristics of single-bit and multi-
bit QIS for 1≤n≤6 bits. For the QIS, the capacity of the full well is
given by FW=2n-1. The relative exposure is the quanta exposure H
(in photoelectrons) divided by the full well, and the percent
saturation is calculated from the expected number of
photoelectrons in the photosite. Generally for the QIS, a “cubicle” in
x,y, and t might be summed.
-23- © E.R. Fossum 2015
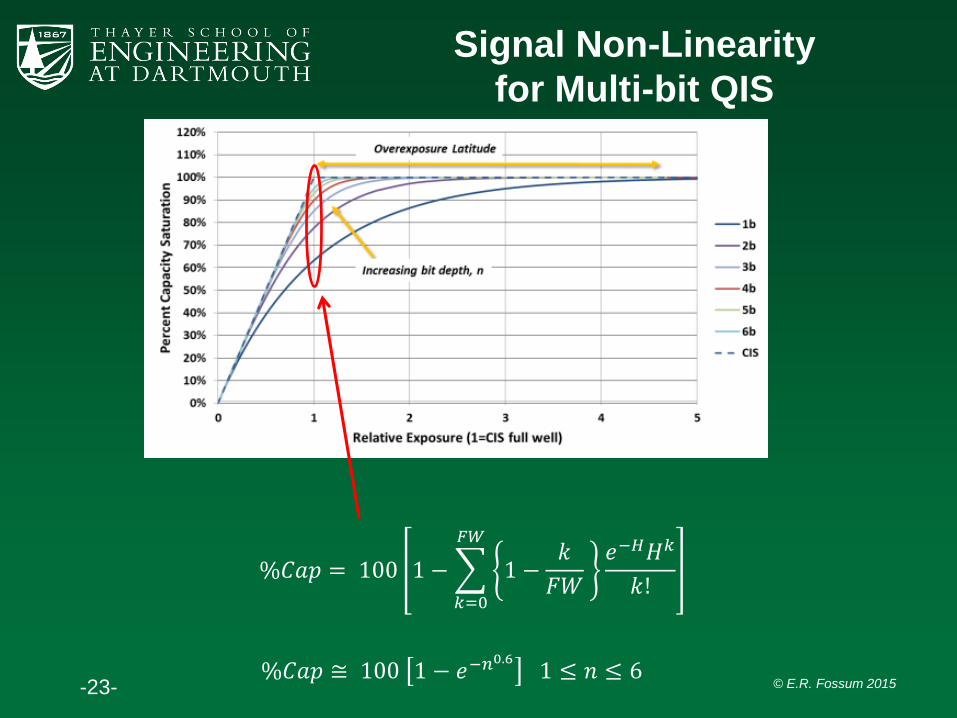
Signal Non-Linearity
for Multi-bit QIS
%𝐶𝑎𝑝 = 100 1 −
𝑘=0
𝐹𝑊
1 −𝑘
𝐹𝑊
𝑒−𝐻𝐻𝑘
𝑘!
%𝐶𝑎𝑝 ≅ 100 1 − 𝑒−𝑛0.61 ≤ 𝑛 ≤ 6
-24- © E.R. Fossum 2015
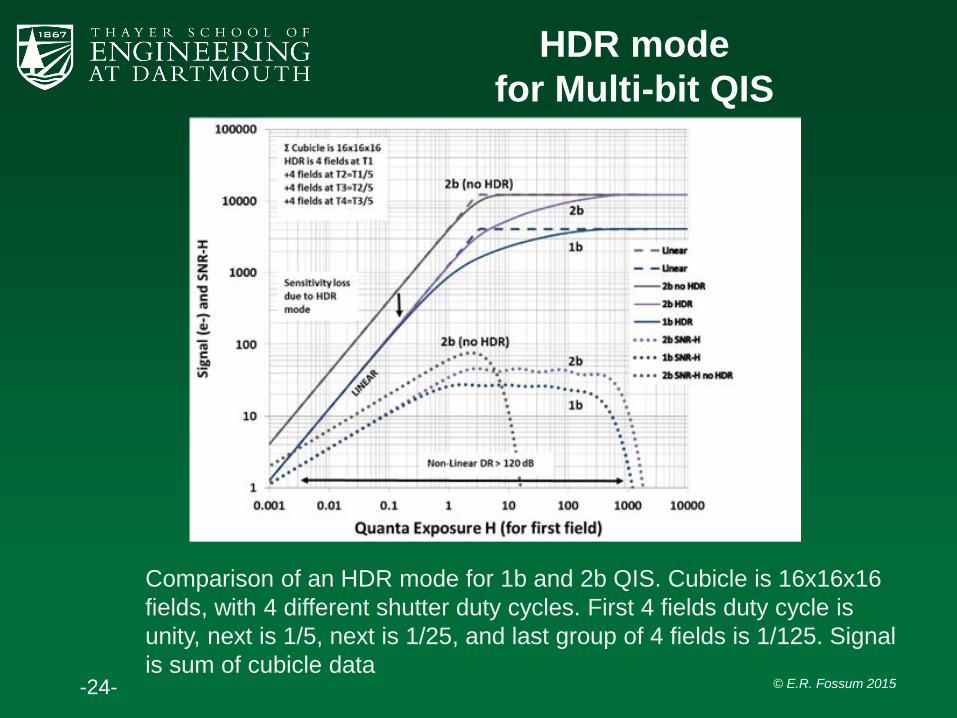
HDR mode
for Multi-bit QIS
Comparison of an HDR mode for 1b and 2b QIS. Cubicle is 16x16x16
fields, with 4 different shutter duty cycles. First 4 fields duty cycle is
unity, next is 1/5, next is 1/25, and last group of 4 fields is 1/125. Signal
is sum of cubicle data

-25- © E.R. Fossum 2015
Alternate HDR mode that improves low-light sensitivity at expense of reduced SNRH at higher
light levels. Note 10% of max signal change occurs over last 40 dB of DR. First 13 fields duty
cycle is unity, next field duty cycle is 1/5, next field is 1/25, and last is 1/125. The contribution
of each set of fields is also shown.
Alternate HDR mode
for Multi-bit QIS

-26- © E.R. Fossum 2015
Gain Variation
• To have count error < 1 e-, want gain variation 𝛿𝐺/𝐺 ≤ 1/(2𝑛 − 1). Example, for
𝑛 = 4 we want 𝛿𝐺/𝐺 ≲ 6.6%• For low BER, better to have 𝛿𝐺/𝐺 ≤ 1/2𝑛+3. For 𝑛 = 4 that is 1/128 = 0.8%
13
6.6%
0.8%
error
ok
14 15

-27- © E.R. Fossum 2015
Summary
QIS goal: “count every photoelectron” in the sensor.
“Flux capacity” as a figure of merit.
Non-linearity is a function of bit depth n.
Bit depth can be changed (downwards) during or after
capture, and thus change linearity.
First photoelectron counting without avalanche gain
demonstrated.
-28- © E.R. Fossum 2015
Discussion Points
Techniques and concepts such as high CG and digital
integration will be applicable to many sensors.
Concepts apply to larger jot/pixel sizes and slower
readout speeds. It is CIS or QIS?
How important is it, really, to discriminate accurately
between 14 and 15 electrons?
Combination with cascaded integration (or LOFIC) will
be interesting.
IoT will be light starved.

-29- © E.R. Fossum 2015
EXTRA SLIDES
-30- © E.R. Fossum 2015
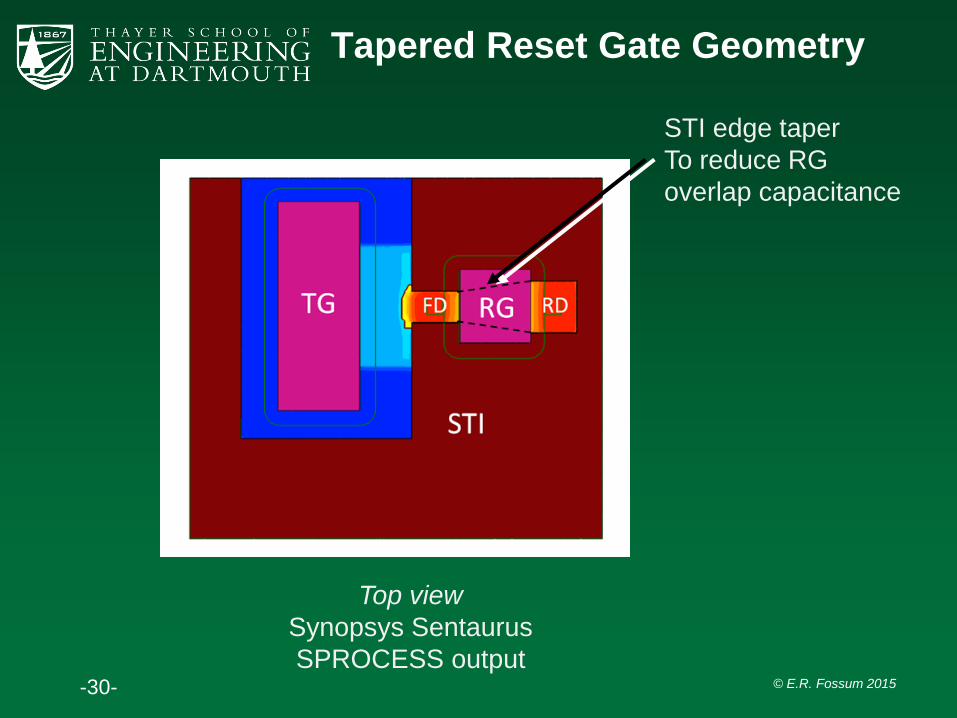
Tapered Reset Gate Geometry
STI edge taper
To reduce RG
overlap capacitance
Top view
Synopsys Sentaurus
SPROCESS output

-31- © E.R. Fossum 2015
Pump-gate Jot Device with
Distal FD and
4-Way Shared Readout
With distal FD, shared readout does
not increase FD capacitance due to
multiple TG overlaps
-32- © E.R. Fossum 2015
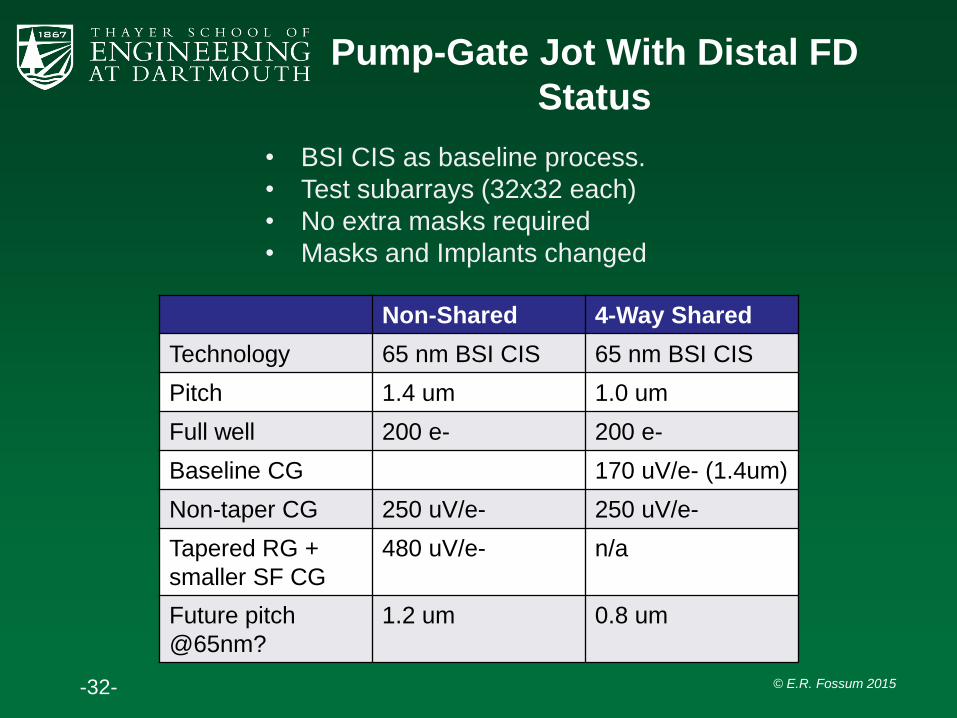
Pump-Gate Jot With Distal FD
Status
• BSI CIS as baseline process.
• Test subarrays (32x32 each)
• No extra masks required
• Masks and Implants changed
Non-Shared 4-Way Shared
Technology 65 nm BSI CIS 65 nm BSI CIS
Pitch 1.4 um 1.0 um
Full well 200 e- 200 e-
Baseline CG 170 uV/e- (1.4um)
Non-taper CG 250 uV/e- 250 uV/e-
Tapered RG +
smaller SF CG
480 uV/e- n/a
Future pitch
@65nm?
1.2 um 0.8 um

-33- © E.R. Fossum 2015
Histograms of Photoelectrons
-34- © E.R. Fossum 2015
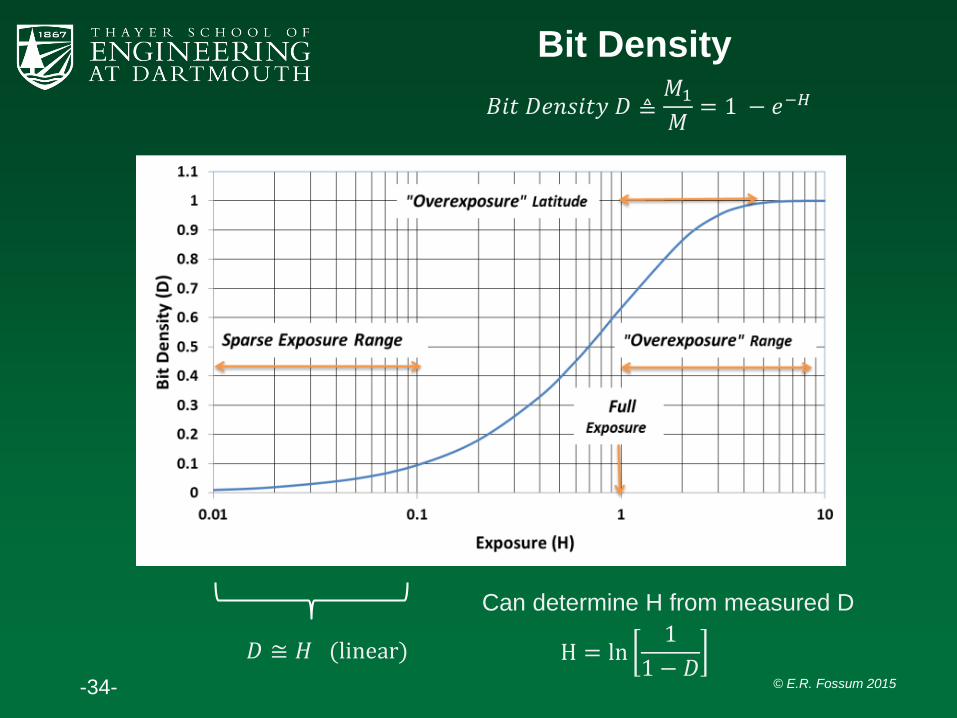
Bit Density
𝐵𝑖𝑡 𝐷𝑒𝑛𝑠𝑖𝑡𝑦 𝐷 ≜𝑀1𝑀= 1 − 𝑒−𝐻
𝐷 ≅ 𝐻 (linear) H = ln1
1 − 𝐷
Can determine H from measured D

-35- © E.R. Fossum 2015
Multi-Arrival Threshold
(Not QIS)
Binary output of sensor =“1” when # of arrivals 𝑘 ≥ 𝑘𝑇Results in reduced higher slope and less overexposure latitude


![IMAGE RECONSTRUCTION FOR QUANTA IMAGE SENSORS USING … · INTRODUCTION Quanta Image Sensor (QIS) is a new type of image sensor envisioned to supersede CMOS and CCD [1]. Having a](https://static.fdocuments.in/doc/165x107/601b455bae2e7d65d15541ff/image-reconstruction-for-quanta-image-sensors-using-introduction-quanta-image-sensor.jpg)