Quant Products for Equity clients - Natixis · Quant Products for Equity clients-Epsilon...
14
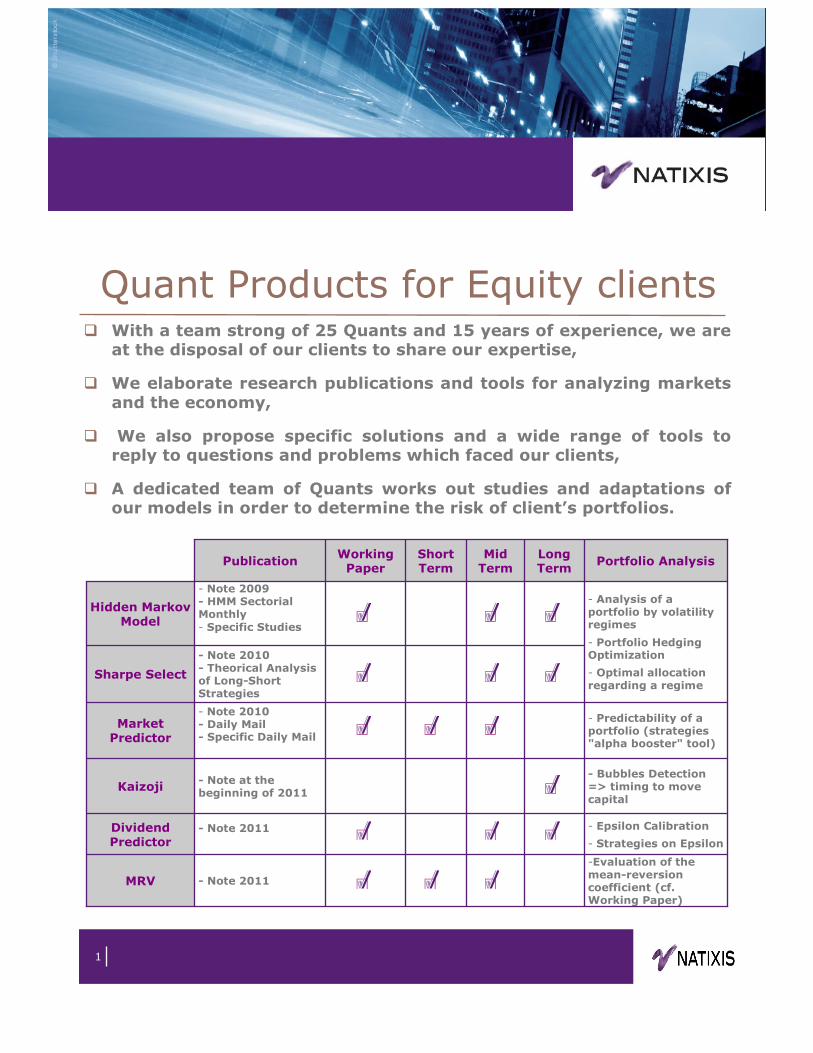
1 Seminar-EDA "Quant Product for Cash clients" With a team strong of 25 Quants and 15 years of experience, we are at the disposal of our clients to share our expertise, We elaborate research publications and tools for analyzing markets and the economy, We also propose specific solutions and a wide range of tools to reply to questions and problems which faced our clients, A dedicated team of Quants works out studies and adaptations of our models in order to determine the risk of client’s portfolios. Quant Products for Equity clients - Epsilon Calibration - Strategies on Epsilon - Note 2011 Dividend Predictor -Evaluation of the mean-reversion coefficient (cf. Working Paper) - Note 2011 MRV - Predictability of a portfolio (strategies "alpha booster" tool) - Note 2010 - Daily Mail - Specific Daily Mail Market Predictor - Note 2010 - Theorical Analysis of Long-Short Strategies Sharpe Select - Bubbles Detection => timing to move capital - Note at the beginning of 2011 Kaizoji - Analysis of a portfolio by volatility regimes - Portfolio Hedging Optimization - Optimal allocation regarding a regime - Note 2009 - HMM Sectorial Monthly - Specific Studies Hidden Markov Model Portfolio Analysis Long Term Mid Term Short Term Working Paper Publication
Transcript of Quant Products for Equity clients - Natixis · Quant Products for Equity clients-Epsilon...
1
Seminar-EDA"Quant Product for Cash clients"
� With a team strong of 25 Quants and 15 years of experience, we are at the disposal of our clients to share our expertise,
� We elaborate research publications and tools for analyzing markets and the economy,
� We also propose specific solutions and a wide range of tools toreply to questions and problems which faced our clients,
� A dedicated team of Quants works out studies and adaptations of our models in order to determine the risk of client’s portfolios.
Quant Products for Equity clients
- Epsilon Calibration
- Strategies on Epsilon- Note 2011Dividend
Predictor
-Evaluation of the mean-reversion coefficient (cf. Working Paper)
- Note 2011MRV
- Predictability of a portfolio (strategies "alpha booster" tool)
- Note 2010 - Daily Mail - Specific Daily Mail
Market Predictor
- Note 2010 - Theorical Analysis of Long-Short Strategies
Sharpe Select
- Bubbles Detection => timing to move capital
- Note at the beginning of 2011
Kaizoji
- Analysis of a portfolio by volatility regimes
- Portfolio Hedging Optimization
- Optimal allocation regarding a regime
- Note 2009 - HMM SectorialMonthly - Specific Studies
Hidden Markov Model
Portfolio AnalysisLong Term
Mid Term
Short Term
Working Paper
Publication

2
Market Regimes Discoverer : Hidden Markov Model
Keywords:Hidden Markov Model; EM algorithm; Maximum likelihood; Iterative method; Market Regimes; Prediction volatility characteristics; Diversification; Market timing; Risk perception indicator; Dynamic Asset Allocation; Conditional Back Testing; Proprietary indices; Conditional Bootstrap;
References: [1] M. Saidane & C. Lavergne “Factor Analysed Hidden Markov Models for Conditionally Heteroscedastic Financial Time Series” Rapport de Recherche INRIA, N°5862, Grenoble – France 2006.
[2] R.J. Elliott, L. Aggoun, J.B. Moore, “Hidden Markov Models: Estimation and Control” Springer, New York, 1995.
[3] Hamilton J. D. “A New Approach to the Economic Analysis of Nonstationary Time Series and the Business Cycle", Econometrica57, pp. 357-384, 1989.
[4] Hamilton J. D. “Analysis of Time Series Subject to Changes inRegimes", Journal of Econometrics 45, pp. 39-70, 1990.
[5] Hamilton J. D. “Speciation Testing in Markov-Switching Time-Series Models", Journal of Econometrics 70, pp. 127-157, 1996.
[6]S. Loulidi « Modélisation stochastique en finance, application à la construction d'un modèle à changement de régime avec des sauts » Ecole doctorale de Mathématiques et Informatique de Bordeaux 2008.
[7] S. Loulidi, A. Reghai, V. Treulet,“ How to predict volatility quantitatively” Natixis Securities 2009.
[8] S. Loulidi, A.Reghai, A.Yedder “Hidden Markov Model“, Natixis Road Show HMM présentation 2010.
Abstract
The term Hidden Markov Model (HMM) is now quite familiar in the speech of signal processing community and more and more accepted for communication systems. It is perhaps a little less daunting, and yet more mysterious than the term partially observed stochastic dynamical system model, which is a translation familiar to people in systems theory.
Why in finance?
As all financial practitioners know, financial markets go through different regimes. This knowledge is of utmost importance for pricing and hedging purposes. It can also be applied successfully to asset allocation.
The HMM applied to finance and more specifically to the VIX brings valuable information to investors.

3
Cash Services• Quant Web SiteAccess to HMM applied to VIX
• Recurrent PublicationsReceive dashboard up to date
• Cash StrategiesSector Select : allows a dynamic allocation based on mixed recommendations (fundamental and technical)
• Execution AlgorithmsMost execution algorithms depend on market ecology. HMM classifies performances based upon volatility regimes
Solutions : Products & Services
Asset Allocation
• Regime dependent asset allocation
• Sector strategy
• NXS Sharpe Multi AssetBloomberg Ticker: NXSHMA
• NXS Sharpe Euro EquityBloomberg Ticker: NXSHEE
Derivatives
• Timing Vanilla Derivatives
• VIX Futures and Options
• Volatility Derivatives
• Correlation Products
Quant Advisory
• Direct Quant Advisory
• Specific adaptation to proprietary portfolios
• One to One
Market Regimes Discoverer

4
AbstractWhen an investor has a vision of the market, he looks for the best investment regarding the Performance/Risk ratio. Several questions can be asked:
What is the best Product/Strategy which is optimizing the Risk Profile?
What is the best Equity Basket associated to this Product/Strategy?
Regarding the very important number of assets within the market, it’s impossible to back-test all the combinations of baskets for a given payoff/strategy. Thus, we have developed an Investment Support Tool which optimizes the basket selection using a full scale approach.
The Fundamental Research, Indicators and Market Statistics, Investor’s Experience are a part of the Market Views and Scenarios, and Regimes.
A profitable investment has the highest Sharpe Ratio for an Investor's Market View.
This solution can be described as follows:
• Selection of the Market: geographical areas, sectors, etc... which must appear in the baskets
• Definition of the investor’s market view: the investor can have a view for the entire market, for particular geographical areas, sectors, assets…
• Generation of random baskets and a reduction of the complexity
• Evaluation of the Sharpe Ratio in order to rank the baskets regarding their expected performance and risk.
Keywords:Risk/Performance Optimization; Lloyds Algorithm; Bootstrap; Investor’s Market View; Investment Support Tool; Sharpe Ratio; basket quantization; product evaluation
References:[1] A. Reghaï and al “Underlying Selection for Basket Optimisation”, Natixis–Equity Derivatives Quantitative Research 2007
[2] R. CHHAIBI, S. MIELNIK, “UN SYSTEME EXPERT DE CLASSIFICATION DE PANIERS D’ACTIFS “ Natixis internal paper 2009
[3] N. El Karoui “Couverture des risques dans les marchés financiers”
[4] S. Corlay, G. Pages “Functional quantization based stratified sampling methods” Natixis Equity Derivatives Quantitative Research, LPMA Paris 6, March 2010
[5] F. Black, R. Litterman “Global asset allocation with equities, bonds and currencies”, Fixed Income research. Goldman Sachs paper
Sharpe Select

5
Cash Services
• Recurrent publicationsReceive dashboard up to date
• Cash Strategies
• Market Behavior Scenario
Solutions : Products & Services
Asset Allocation
• “Delta-One” Strategies asset allocation
• Asset Allocation for structured products
• Diversification Opportunities
Derivatives
• Basket / Correlation products
• Singe-stock products
• Structured products
Quant Advisory
• Specific adaptation to proprietary portfolios
• One to One
Sharpe Select

6
Keywords:Market prediction; Optimization Lloyd algorithm; Product quantization; Genetic algorithm; Statistic; Cyclical market effect; Hedging strategies
References:[1] A. Reghaï, A. Ben Haj Yedder, M. Anane, “Market Predictor: Quantitative prediction of market trends” Natixis 2010
[2] S. Corlay, G. Pages “Functional Quantization Based Stratified Sampling Methods”, Natixis Equity Derivatives Quantitative Research, LPMA Paris 6, March 2010
[3] D., Dorigo, M. and Glover, F. (eds), “An Introduction to Differential Evolution” in Corne, New Ideas in Optimization, McGraw-Hill, London. Price, K.V. 1999
[4] A. Ben Haj Yedder “Optimisationnumérique et Contrôle optimal: Applications en chimie moléculaire”Ecole Nationale des Ponts des Chaussées, December 2002
Market Predictor
Abstract
In this project we propose an original mathematical model to predict equity market trends.
Market Predictor aims to detect the several market cyclical –psychological effects.
Mathematically, Market Predictor is based on the quantization technique combined with the generation of multidimensional Markov chains.
Learning is done in three steps:
•The mono-dimensional quantization of daily returns,
•The generation of multidimensional patterns,
•And finally the calculation of transition matrices.
Using those transition matrices, future returns can be easily predicted from the class of the current trajectory.
7
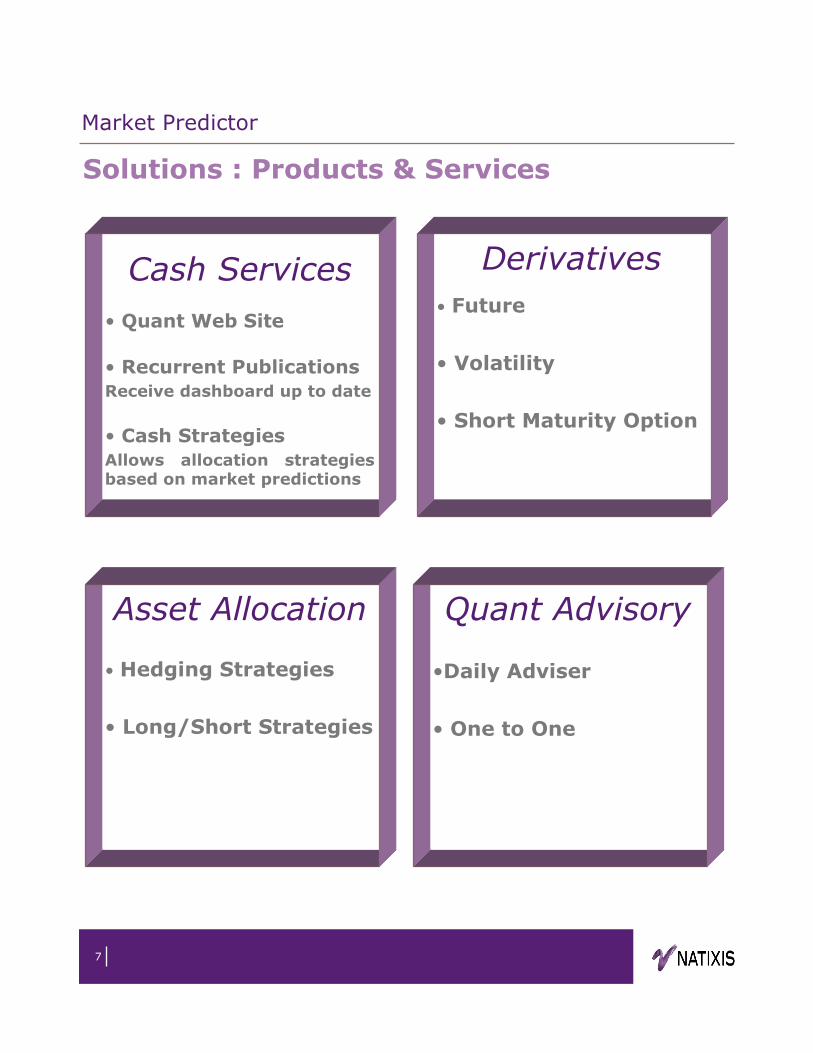
Cash Services
• Quant Web Site
• Recurrent PublicationsReceive dashboard up to date
• Cash StrategiesAllows allocation strategies based on market predictions
Solutions : Products & Services
Asset Allocation
• Hedging Strategies
• Long/Short Strategies
Derivatives
• Future
• Volatility
• Short Maturity Option
Quant Advisory
•Daily Adviser
• One to One
Market Predictor

8
AbstractWe study the features of a statistical tool made for detecting financial bubbles.
Some of the most famous bubbles (Internet 2000, Commodities 2008) are clearly identified.
We also highlight the relationship between this statistical indicator and the variance-covariance matrix of the universe of assets under consideration.
The statistic we use measures dispersion of performances with fixed starting date over a large universe of assets. It shows an explosive behavior when a bubble is building up and a dissipative behavior during market crashes.
Keywords:Financial Bubbles; Dispersion; Ensemble Statistics; Bubble Risk; Economic Cycles
References:
[1] Kaizoji, T. A precursor of market crashes: Empirical laws of Japan’s internet bubble. The European Physical Journal B 50, 5 pages, 2006
[2] F. Abergel & N. Huth “High frequency correlation modelling” Econophys-Kolkata V conference, Kolkata March 2010
[3] Lillo, F. & Mantegna, R.N. Variety and volatility in financial markets. Physical Review E 62, 6126, 2000
[4] Sornette, D. & Johansen, A. Significance of log-periodic precursors to financial crashes. Quantitative Finance 1, 452-471, 2001
[5] Borland, L. Statistical signatures in times of panic: Markets as a self-organizing system. Arxiv preprint arxiv: 0908.0111, 2009
[6] Kaizoji, T. & Kaizoji, M. Power-law of ensemble of stock prices. Physica A: Statistical Mechanics and its Applications 344, 240-243, 2004
Kaizoji
9
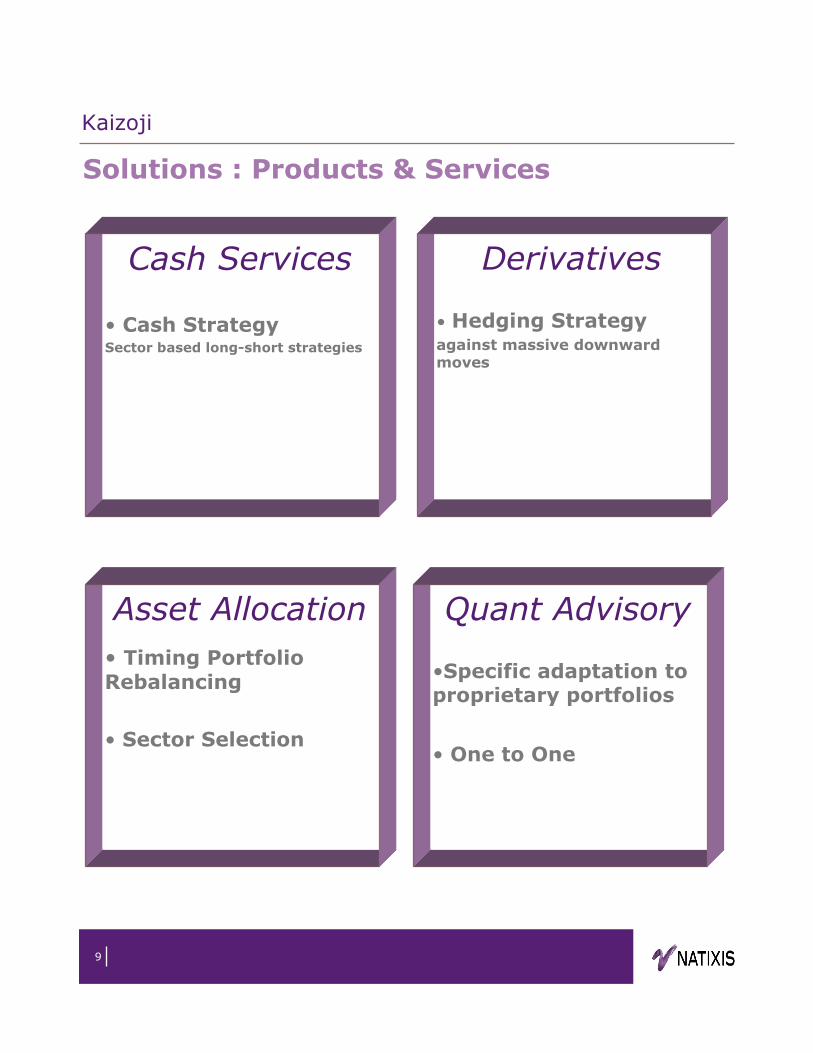
Cash Services
• Cash StrategySector based long-short strategies
Solutions : Products & Services
Asset Allocation
• Timing Portfolio Rebalancing
• Sector Selection
Derivatives
• Hedging Strategyagainst massive downward moves
Quant Advisory
•Specific adaptation to proprietary portfolios
• One to One
Kaizoji

10
Abstract
The popularity of Kalman filter is increasing in financial studies, notably to estimate diffusion processes. In this work, we show how we can use it to forecast the parameters of the mixed dividends model: cash dividends and proportional dividends, using historical data of Eurostoxx and dividend future.
Kalman Filter is an adaptive least square error filter that provides an efficient computational recursive solution for estimating a signal in presence of Gaussian noises. It is an algorithm which makes optimal use of imprecise data on a linear (or nearly linear) system with Gaussian errors to continuously update the best estimate of the system's current state.
The Dividend Predictor applied to the dividend index detects the different regimes for the dividends. Also, it allows the construction of a mean reverting position to take advantage of the dividend investment. We can predict levels but also propose a model for pricing options on dividends that show reasonable values.
Keywords:Kalman Filter; Dividend; Dividend Risk Prediction; Recursive Estimator; Epsilon Indicator, dividend Options
References:
[1] A. Reghai, M. Abdelhedi, A. Ben Haj Yedder « The dividend index through the Kalman filter » Natixis, Equity Derivatives Quantitative Research, 2009
[2] R. E. Kalman « A new Approach to Linear Filtering and Prediction Problems » Journal of Basic Engineering pp.35-45, March 1960.
[3] Harvey, A. C. “Forecasting, structural time series models and the Kalmanfilter”, Cambridge University Press, Cambridge, 1994.
Dividend Predictor
11
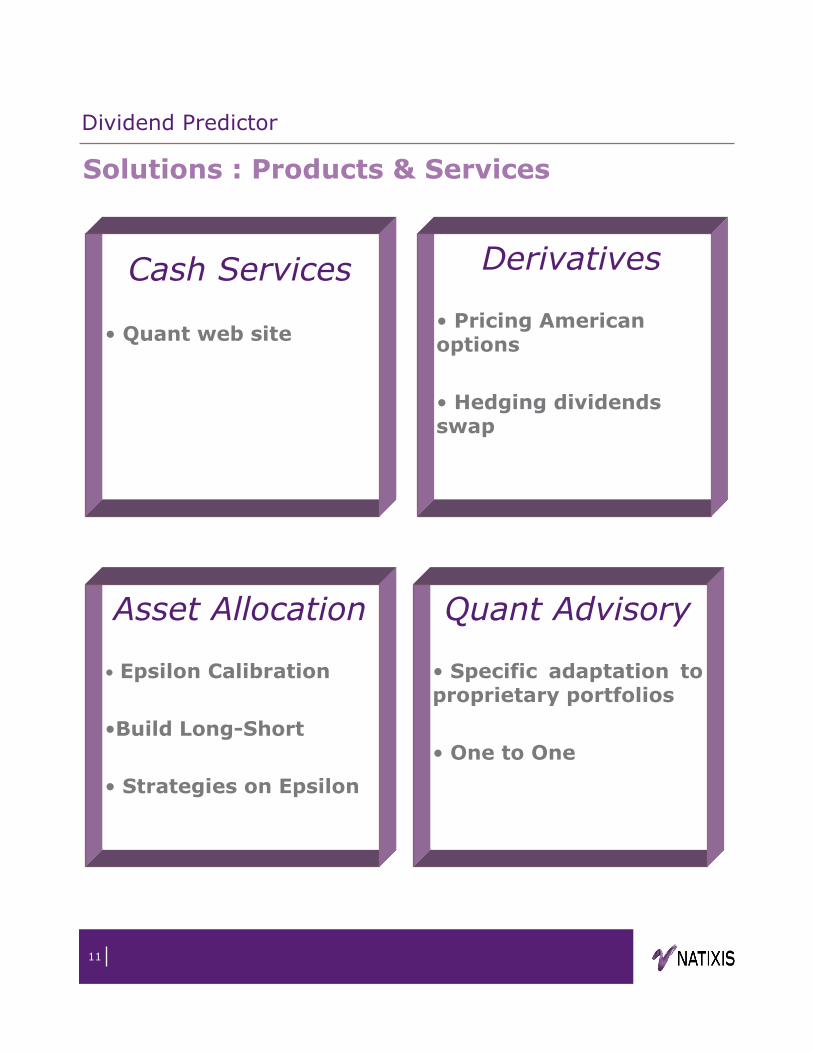
Cash Services
• Quant web site
Solutions : Products & Services
Asset Allocation
• Epsilon Calibration
•Build Long-Short
• Strategies on Epsilon
Derivatives
• Pricing American options
• Hedging dividends swap
Quant Advisory
• Specific adaptation to proprietary portfolios
• One to One
Dividend Predictor

12
Abstract
The market is never as efficient as we describe in classical theories. The non-zero autocorrelation may appear for some stocks returns, even for basket returns. The lead-lag phenomenon exists also for certain assets. We propose a multi-resolution volatility based method for the selection of pair basket in order to benefit from the presence of autocorrelation and inter-stocks lead-lag.
Keywords:Pair trading; portfolio selection; autocorrelation; lead-lag
References:
[1] Rama CONT, Empirical properties of asset returns: stylized facts and statistical issues (2001), Quantitative Finance, pages 223-236
[2] Robert F. ENGLE et W.J. GRANGER, Co-intégration and error correction : representation, estimation and testing (1987), Econometrica, Vol.55, NO.2, pages 251-276
[3]Alexandre D’ASPREMOND, Identifying Small Mean Reverting Portfolios (2008), ORFE, Princeton University,http://www.princeton.edu/~aspremon/MeanRevVec.pdf
MRV:Multi-Resolution Volatility

13
Cash Services
• Quant web site
Solutions : Products & Services
Asset Allocation
• Long-short arbitrage
•Mean-reversion portfolio selection
•Trend-Following portfolio selection
Derivatives
• Correlation product
• Single stock
Quant Advisory
• Specific adaptation to proprietary portfolios
• One to One
MRV: Multi-Resolution Volatility

14
Disclaimer
The information contained in these publications is exclusively intended for a client base consisting of professionals or qualified investors. It is sent to you by way of information and cannot be divulged to a third party without the prior consent of Natixis Securities. It cannot be considered under any circumstances as an offer to sell, or a solicitation of any offer to buy financial instruments. While all reasonable effort has been made to ensure that the information contained is not untrue or misleading at the time of publication, no representation is made as to its accuracy or completeness and it should not be relied upon as such. Past and simulated performances offer no guarantee as to future performances. Any opinions offered herein reflect our current judgement and may change without notice. Natixis Securities cannot be held responsible for the consequences of any decision made with regard to the information contained in this document. Natixis Securities is a subsidiary of Natixis. It is regulated by the CECEI, the Commission Bancaire and the Autorité des Marchés Financiers, and has set up due procedures for the separation of activities, notably in order to prevent conflicts of interest between the research activities and its other activities. Details of these ‘Chinese Walls’ are available on request from the head of compliance. On the date of this report, Natixis and/or one of its subsidiaries may be in a conflict of interest with the issuer mentioned herein. In particular, it may be that Natixis Securities or any person or company linked thereto, their respective directors and/or representatives and/or employees, have invested on their own account in, or act or intend to act, in the next twelve months, as an advisor, provider of liquidity, market maker, or corporate banker (and notably for underwriting transactions, placements or connected transactions), for a company discussed in this report.This research may be disseminated from the United Kingdom by Natixis, London Branch, which is authorised by the Comité des Établissements de Crédit et des Entreprises d’Investissement and subject to limited regulation by the Financial Services Authority. Details about the extent of regulation by the Financial Services Authority are available from the London Branch on request.
The transfer / distribution of this document in Germany is done by / under the responsibility of Natixis Zweigniederlassung Deutschland. US Distribution – Foreign Affiliate disclosuresNatixis, parent company of Natixis Securities (Paris), a foreign broker dealer, makes this research report available solely for distribution in the United States to major U.S. institutional investors. This document shall not be distributed to any other individual in the United States. All American institutional investors receiving this document shall undertake, under the terms of this act, not to distribute the original nor a copy thereof to any other person. Natixis Bleichroeder Inc. is an affiliate of Natixis. Natixis Securities (Paris) has no officers or employees in common Natixis Bleichroeder Inc. The address of Natixis Bleichroeder Inc. is 1345 Avenue of the Americas, New York, NY 10105. Natixis Bleichroeder Inc. has/had no involvement in the preparation of this research report. This research report has been prepared and reviewed by research analysts employed by Natixis Securities (Paris). These research analysts are not registered or qualified as research analysts with the NYSE and/or the NASD, and are not subject to the rules of the FINRA.
Contacts
Adil REGHAI
Natixis
47 Quai d'Austerlitz,75013 Paris France
Tel: +33(0)1.58.55.55.12
Sixte DE GASTINES
Natixis
47 Quai d'Austerlitz,
75013 Paris
France
Tel: +33(0)1.58.55.06.87
NATIXIS Banque de Financement et d’Investissement - 47, quai d’Austerlitz – BP 4 - 75060 Paris Cedex 02 www.natixis.com
Didier HIRSCH
Natixis
CANNON BRIDGE HOUSE
25 DOWGATE HILL
EC4R 2YA LONDON
ROYAUME-UNI
Tel:+44(0) 203 216 9201