QUALITY, TECHNOLOGY, AND GLOBAL MANUFACTURING
17
PRODUCTION AND OPERATIONS MANAGEMENT Vol. 6. No. 2, Summer I!%?7 Printed in U.S.A. QUALITY, TECHNOLOGY, AND GLOBAL MANUFACTURING* JOHN E. E’ITLIE University of Michigan Business School, University of Michigan, Ann Arbor, Michigan 48109-1234, USA It has been more than a decade since the quality movement was reborn in U.S. industry, and there is widespread dissatisfaction with the results of some of these programs. At the same time, product and service R&D is on the rise. These trends are incorporated here into an extension of the Utterback-Abernathy model to examine the quality, technology, and performance relationship. Six hundred durable goods firms in 20 countries were surveyed and it was found that technology significantly moderated the association of R&D intensity and total quality management (TQM) with market share, controlling for industry category. In high technology firms, R&D intensity was sig- nificantly associated with market share; in low technology firms, TQM was significantly associated with market share. R&D intensity and TQM were significantly and inversely related, while R&D intensity and computer-aided manufacturing (CAM) were significantly and directly related. (TITLE R&D, MARKET SHARE; INDUSTRY DIFFERENCES) In spite of early contributions (Deming 1950; Juran 1951; Feigenbaum 1956; Dodge 1969)) the quality movement has only been ablaze for slightly more than 10 years in the United States (e.g., Crosby 1979; Deming 1986). Results have been mixed. Although quality levels have improved in selected industries like automobiles, customer satisfaction is still higher with Japanese and European cars (Rechtin 1994). Total quality management (TQM) has been practiced since the 1980s in the United States (Dean and Evans 1994). Since the late 1980’s, the devaluation of the dollar has contributed as much as half the gain in competitiveness of American industry and there continue to be problems with balance of payments (Faltermayer 1994). Several recent surveys summarized by Buran ( 1994) indicate widespread dissatisfaction with the results of u .s . quality initiatives. Over 50% of surveyed companies report that quality programs have not led to better business performance. Less than one-third of u .s . Fortune 500 firms believe quality programs significantly impacted competitiveness. Over 85% of IS0 9000 registrants think it will take eight years or more to recover their costs. Quality programs appear to have failed to meet expectations in two-thirds of u .s . firms, primarily because they have not been related to customer outcomes (Buran 1994). Only a small number of companies qualify for the Malcolm Baldrige National Quality Award, but those that do tend to be able to forge the bond between customer orientation with operational performance. Areas of persistent weakness in Baldrige applications include * Received March 1995; revision received November 1995; accepted July 1996. 150 1059-1478/97/0602/0150$1.25 Copyright0 1997. Production and Operations Management Society
Transcript of QUALITY, TECHNOLOGY, AND GLOBAL MANUFACTURING

PRODUCTION AND OPERATIONS MANAGEMENT Vol. 6. No. 2, Summer I!%?7
Printed in U.S.A.
QUALITY, TECHNOLOGY, AND GLOBAL MANUFACTURING*
JOHN E. E’ITLIE University of Michigan Business School, University of Michigan,
Ann Arbor, Michigan 48109-1234, USA
It has been more than a decade since the quality movement was reborn in U.S. industry, and there is widespread dissatisfaction with the results of some of these programs. At the same time, product and service R&D is on the rise. These trends are incorporated here into an extension of the Utterback-Abernathy model to examine the quality, technology, and performance relationship. Six hundred durable goods firms in 20 countries were surveyed and it was found that technology significantly moderated the association of R&D intensity and total quality management (TQM) with market share, controlling for industry category. In high technology firms, R&D intensity was sig- nificantly associated with market share; in low technology firms, TQM was significantly associated with market share. R&D intensity and TQM were significantly and inversely related, while R&D
intensity and computer-aided manufacturing (CAM) were significantly and directly related. (TITLE R&D, MARKET SHARE; INDUSTRY DIFFERENCES)
In spite of early contributions (Deming 1950; Juran 1951; Feigenbaum 1956; Dodge 1969)) the quality movement has only been ablaze for slightly more than 10 years in the United States (e.g., Crosby 1979; Deming 1986). Results have been mixed. Although quality levels have improved in selected industries like automobiles, customer satisfaction is still higher with Japanese and European cars (Rechtin 1994). Total quality management (TQM) has been practiced since the 1980s in the United States (Dean and Evans 1994). Since the late 1980’s, the devaluation of the dollar has contributed as much as half the gain in competitiveness of American industry and there continue to be problems with balance of payments (Faltermayer 1994).
Several recent surveys summarized by Buran ( 1994) indicate widespread dissatisfaction with the results of u .s . quality initiatives. Over 50% of surveyed companies report that quality programs have not led to better business performance. Less than one-third of u .s . Fortune 500 firms believe quality programs significantly impacted competitiveness. Over 85% of IS0 9000 registrants think it will take eight years or more to recover their costs.
Quality programs appear to have failed to meet expectations in two-thirds of u .s . firms, primarily because they have not been related to customer outcomes (Buran 1994). Only a small number of companies qualify for the Malcolm Baldrige National Quality Award, but those that do tend to be able to forge the bond between customer orientation with operational performance. Areas of persistent weakness in Baldrige applications include
* Received March 1995; revision received November 1995; accepted July 1996.
150 1059-1478/97/0602/0150$1.25
Copyright0 1997. Production and Operations Management Society
QUALITY,TECHNOLOGY, AND GLOBAL MANUFACTURING 151
an unclear linkage between quality and strategy, lack of data and analysis, and partial systems that do not integrate information technology and quality (Reiman 1993).
Most R&D resources have historically focused on the development of new products and the trend continues. In a survey of Industrial Research Institute (IRI) members, Wolff ( 1994) reports that the proportion of R&D spending for new products increased from 39 to 44% during the four years from 1988 to 1992. R&D investments have been shown to pay off in a majority of industries, and especially in pharmaceuticals, consumer products, chemicals, and services (Waddock and Graves 1994). Therefore, it is not surprising that there has been considerable attention to strategies for successful new product development and introduction (Souder and Sherman 1994), but the increase in service R&D (Wolff 1994) also suggests that companies are introducing products faster but at the expense of quality, which has to be improved after a new product is introduced.
In this study, the global manufacturing investment pattern in R&D and new plant and equipment were evaluated. Results from 600 durable goods firms in 20 countries indicate that technology significantly moderates the association of R&D intensity and TQM with market share controlling for industry category. In high technology firms, R&D intensity was significantly associated with market share; in low technology firms, TQM was signif- icantly associated with market share. R&D intensity was significantly and inversely related to TQM . However, TQM and CAM are significantly and positively correlated, as predicted. Regional differences indicate that European and Scandinavian firms tended to have lower market share than Asia, North America, and South America.
Theories of Quality
In spite of the great movement toward quality programs around the world, beginning with the quality circles in Japan and in the United States 20 years ago or more, a widely accepted theory of quality has not emerged (Dean and Bowen 1994). There are any number of possible reasons for this state of affairs. There are at least two general ap- proaches to quality issues in organizations, which promotes confusion immediately.
Total quality and total quality management are often claimed to have their wellsprings as far back as the Scientific Management movement begun by Fredrick Taylor, a me- chanical engineer and father of industrial engineering (Romm 1994). His work in the early 1990’s separated planning and execution of tasks, which is essential to total quality philosophies (Goetsch and Davis 1995). Typical works in this category are Dean and Evans(1994),Imai(1986),Flood(1993),andGarvin(1988).
A second widely accepted approach to quality is based on statistical principles and is often called statistical quality control. Recent examples of this approach are Gitlow, Op- penheim and Oppenheim ( 1995), Bergman and Kleifsio ( 1994), and Famum ( 1994). To add to the confusion, many authors, including Deming’s later work, merge the two traditions (e.g., Evans and Linsay 1993; Vroman and Lushsinger 1994; Besterfield, Bes- terlield-Michna, Besterfield, and Besterfield-Sacre 1995). This is probably because stat- isticians often began with a strictly quantitatively bounded discipline approach to quality and then discovered that, at a minimum, the assumptions of these statistical models were often not satisfied (e.g., Taguchi’s design of experiments is an example).
The legacy of this historical development pattern of the quality movement has been a reign of confusion, made worse in some cultures like that of the United States, where the priority placed on problem solving has emphasized a “quick” fix to quality issues with little time for careful analysis and rigor. The methods of measuring the results of any intervention in organizations have also added to the problem. Accounting has its own rules for measuring performance, manufacturing other rules, and so on. The clash between continuous, incremental improvement in operations as opposed to radical interventions like business process reengineering has also been at stake. Romanelli and Tushman ( 1994)

152 JOHN E. El-I-LIE
show that most fundamental change in organizations comes as part of a radical, punctuated equilibrium shift rather than through the accumulation of incremental changes.
One recent attempt to advance theory in the area was published by Sitkin, Sutcliffe, and Schroeder ( 1994). This is a contingency model that suggests that TQM and associated practices should be matched appropriately to situational requirements. The authors con- trast a TQM approach, which emphasizes control, from a total quality learning (TQL) ap- proach. High uncertainty conditions would favor a TQL approach. Both principles and practices differ under these two approaches. For example, in contrasting management practices for capability enhancement, the authors make the distinctions summarized in following table (Sitkin, Sutcliffe, and Schroeder 1994, p. 548):
Practices Associated with Total Quality Control and Total Quality Learning
Management Practices Total Quality Control Total Quality Learning
Capability enhancement Enhanced exploitation of existing skills Increased efficiency in use of existing
resources Increased effectiveness in control over
processes, products, and services Increased performance reliability
Doing things right the first time
Enhanced exploration of new skills Increased availability of slack
resources Increased effectiveness in learning
and capacity enhancement Increased resilience in the face of
new and/or unexpected changes or requirements
Doing things that are likely to provide insight, but only have a moderate probability of succeeding
Source: Table 2, Sitkin, Sutcliffe, and Schroeder (1994)
This separation between TQC (control), e.g., increased efficiency, and TQL (learning), e.g., increased slack, has potential for incorporating technology issues in a quality-per- formance model. New technology is generally required in uncertain environments, and a life-cycle model, such as that discussed next section would be consistent with this ap- proach.
The Utterback-Abernathy Model
Utterback and Abernathy ( 1975) developed and tested an evolutionary model of the production process. The term “productive segment” originally used by Abernathy and Townsend (1975) was replaced by “production process,” which was defined as “the system of process equipment, work force, task-specifications, material inputs, work and information flows, etc., that are employed to produce a product or service” ( 1975, p. 641). These differences are summarized in Ettlie ( 1979). Although the earlier version concentrated on the evolution of the productive segment and its relationship with inno- vative capability and productivity, how the firm’s strategy for competition and growth is introduced more specifically, and the firm’s propensity to host product or process inno- vations’is discussed in the context of the evolutionary staging. Each stage includes not only a description of the state of evolution of the production process, but also the dominant competitive strategy. These stages are summarized below from Utterback and Aber- nathy ( 1975).
Stage I. Uncoordinated production process and product pe$ormance-maximizing strategy
The process is “composed largely of unstandardized and manual operations, or . . . general purpose equipment” (Utterback and Abernathy 1975, p. 641) and is relatively

QUALITY, TECHNOLOGY, AND GLOBAL MANUFACTURING 153
organic and flexible, responding easily to changes in an environment in which there is “great product diversity among competitors” ( 1975, p. 641). Although the process is initially inefficient, process and products change rapidly toward improvement with cor- responding market expansion and redefinition. The competitive strategy is characterized by rapid product change emphasizing product performance, and both product and process innovation respond to market need.
Stage II. Segmental production process and sales maximizing strategy
The process becomes more efficient, tasks more specialized and more integrated through automation, although some segments of the process remain essentially manual. The process is more rigid and further development is subject to maturing of a product group with increased sales. The competitive strategy is one of increasing visibility to the consumer; products become more varied and improved with new components at first and then more standardized as market uncertainty is reduced. Most innovations are stimulated by technological opportunities.
Stage III. Systemic production process and cost-minimizing strategy
The systemic production process is well integrated and most resistant to change of the three stages. It constitutes a major investment and even minor changes have costly con- sequences. Therefore, process changes come only slowly. The primary competitive strat- egy focuses on reducing product price in the face of reduced margins on standardized products. Because specification of the production process is now easier, the process seg- ment is likely to host innovations that will make the process more efficient, and therefore production and cost-related factors are likely to be the major stimuli for innovation.
In addition to refining the model with particular attention to predictions concerning the innovation process, Utterback and Abernathy ( 1975) used data from the study of suc- cessful industrial innovations reported by Myers and Marquis ( 1969) to support specific hypotheses derived from the model. Although limited to nominal data, the firm’s stages of product and process development were compared with categories based on the nature of the innovation and other variables.
This paper extends the Abernathy and Utterback model and an emerging theory of quality and technology is proposed. Instead of studying quality as a separate issue in an organization, a technology life-cycle approach is used to examine the quality, technology, performance relationship consistent with the Sitkin, Sutcliffe, and Schroeder (1994) model. This is taken up next.
Extending the Utterback-Abernathy Model
Utterback and Abernathy ( 1975 ) originally proposed that successful firms tend to invest heavily in product R&D early in the life-cycle of an industry or product group. As the dominant design of a new product emerges, investments shift to process technology and strategies switch to cost minimization as opposed to product feature variety. The basis of competition varies with the stage of maturity of the product-process core of a firm and an industry. Although there are problems with this model, e.g., contingencies required for successful performance can be explained independently of an evolutionary process (Ettlie 1979), it does serve as a framework to compare the results of investments in manufac- turing innovation. Therefore, the Utterback-Abernathy (U-A) model is explored as a way of reconciling the potential confusion about theories of quality.
Abernathy and Townsend ( 1975) originally hypothesized that the productive segment of a firm “tends to evolve and change over time” according to a “predictable profile,” and “that the state of development which a productive segment has reached along this profile will determine its propensity to host particular types of innovation” (1975, p.

154 JOHN E. El-l-LIE
381) . The profile was hypothesized as being common for different industries and is de- rived in part from the premise that “the factors which critically enable innovation are best described as patterns of conditions rather than in terms of single important vari- ables” (p. 381).
Abernathy and Townsend state that their unit of analysis is the technology user or the productive segment of a firm. They define the productive segment as “the overall pro- duction process which is employed to create a product, whether the product is goods or a service” and it includes “the physical product, the characteristics of input materials and the characteristics of the product demand that are incident on the process.” This definition was subsequently modified by Utterback and Abernathy ( 1975, p. 641) to include process equipment, work force, task specifications, and work and information flows.
Abernathy and Townsend ( 1975) reviewed studies of process, product, and technolog- ical change, concluding that there were similarities in the patterns of development of productive segments. Three states of development were identified as being common to the productive segments of firms regardless of industry: unconnected, segmental, and systemic. The definition and description of these stages were discussed earlier but this model was modified and refined in a later article by Utterback and Abernathy ( 1975), which is discussed below. In general, it is hypothesized that the productive segment moves at an unspecified, slow rate from a flexible, unstandardized, environmentally sensitive condition to a more rigid, integrated state that enjoys the benefits of high productivity but has a lower “innovative capability.” The desirability of the conditions imposed by a particular stage of development depends on the environment of the productive segment. Development to the systemic stage appears to be appropriate in a stable environment, but if the environment then begins to change at a more rapid rate or becomes unstable (e.g., competition of innovative products), management has two options: either move the pro- ductive segment to a foreign country or “backtrack along the traditional course of evo- lutionary process development to a more flexible state” (Abernathy and Townsend 1975, p. 892). Thus, it was illustrated that there is a trade-off between the productive segment’s capability for innovation and productivity improvement. In addition, Abernathy ( 1976) presented an in-depth historical study of the Ford Motor Company that tends to support this model.
The de-maturation of durable goods manufacturing, and emergence of economies of scope afforded by flexible manufacturing technologies (Ettlie and Penner-Hahn 1994) offer a significant alternative to scale economies, requiring a rethinking of earlier theories. Distinguishing between radical and incremental innovation (Ettlie, Bridges, and O’Keefe 1984) and punctuated equilibrium models (Anderson and Tushman 1991) do not suffi- ciently account for this trend. This de-maturation was originally addressed by Abernathy and Townsend ( 1975, p. 392) with the inclusion of the atavistic tendency of the productive segment to “backtrack” from the systemic or last stage of development to earlier stages when the environment became less stable. Abernathy and Townsend ( 1975, p. 395) go on to say that at times the best choice may be to “slow or reverse evolutionary progress or to remain in that particular stage which offers the best trade-off between conflicting objectives (of adaptability and innovativeness vs. higher productivity rates) .”
In building on the systems-oriented view of successful companies (Liker, Ettlie, and Ward 1995), several avenues of hypothesis generation are possible. One parsimonious approach, which combines both organizational learning perspectives as well as resource- based theory (Pete& 1993; Wemerfeld 1984) and loose coupling, is summarized by Cole ( 1994). In Cole’s model, the combined emphasis of individual and organizational learning is predicted to be most successful. u .s . companies have, until recently, emphasized in- dividual learning and seem to have mastered break-through innovation, especially in some high-technology industries, while Japanese manufacturing firms have mastered organi- zational learning and incremental innovation. Cole ( 1994) argues that successful global
QUALITY, TECHNOLOGY, AND GLOBAL MANUFACTURING 155
firms master both. Perhaps industry should be incorporated in these theories, as Imai (1986) and Scott (1987) have taken context into account.
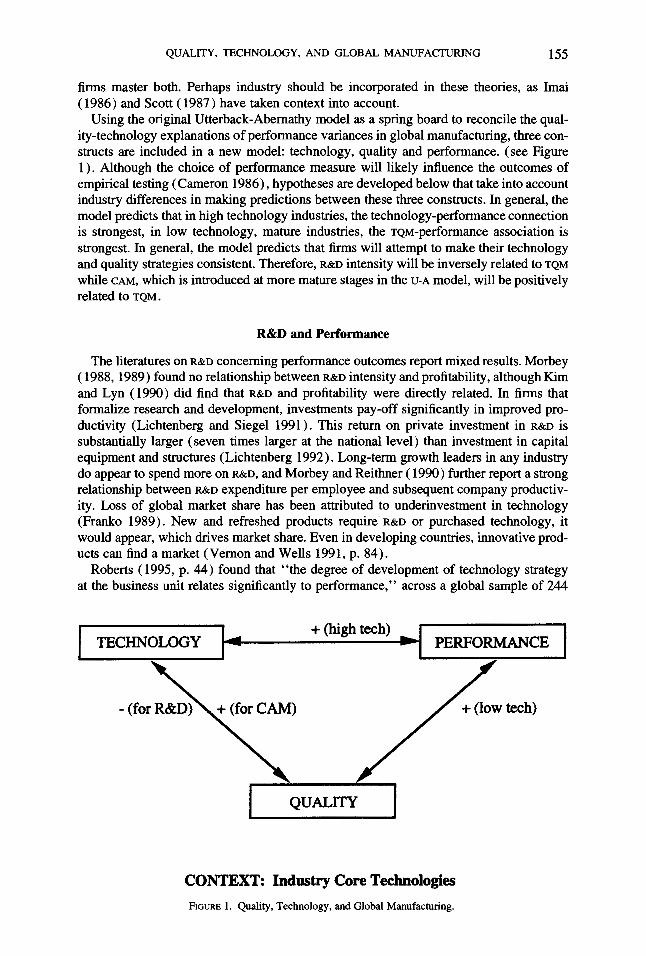
Using the original Utterback-Abernathy model as a spring board to reconcile the qual- ity-technology explanations of performance variances in global manufacturing, three con- structs are included in a new model: technology, quality and performance. (see Figure 1). Although the choice of performance measure will likely influence the outcomes of empirical testing (Cameron 1986)) hypotheses are developed below that take into account industry differences in making predictions between these three constructs. In general, the model predicts that in high technology industries, the technology-performance connection is strongest, in low technology, mature industries, the TQM-performance association is strongest. In general, the model predicts that firms will attempt to make their technology and quality strategies consistent. Therefore, R&D intensity will be inversely related to TQM
while CAM, which is introduced at more mature stages in the U-A model, will be positively related to TQM .
R&D and Performance
The literatures on R&D concerning performance outcomes report mixed results. Morbey ( 1988, 1989) found no relationship between R&D intensity and profitability, although Kim and Lyn ( 1990) did find that R&D and profitability were directly related. In firms that formalize research and development, investments pay-off significantly in improved pro- ductivity (Lichtenberg and Siegel 1991) . This return on private investment in R&D is substantially larger (seven times larger at the national level) than investment in capital equipment and structures (Lichtenberg 1992). Long-term growth leaders in any industry do appear to spend more on R&D, and Morbey and Reithner ( 1990) further report a strong relationship between R&D expenditure per employee and subsequent company productiv- ity. Loss of global market share has been attributed to underinvestment in technology (Frank0 1989). New and refreshed products require’ R&D or purchased technology, it would appear, which drives market share. Even in developing countries, innovative prod- ucts can find a market (Vernon and Wells 1991, p. 84).
Roberts ( 1995, p. 44) found that “the degree of development of technology strategy at the business unit relates significantly to performance,” across a global sample of 244
TECHNOLOGY + (high tech)
PERFORMANCE
T\\/ tech)
I QUALITY 1
CONTEXT: Industry Core Technologies
FIGURE 1. Quality, Technology, and Global Manufacturing.

156 JOHN E. ETI’LIE
R&D performing firms in the United States, Japan, and Western Europe, although there are industry differences in practices. Hoskisson and Hitt ( 1988) found that R&D intensity and market performance were negative for firms diversifying in related and unrelated business lines, as compared to dominant-business growth. Similar findings were reported by Billings, McGowan, and Alnajjar ( 1994). These results strongly support the resource- based view of strategy, which predicts that R&D tends to be directed at growth through leverage or convergence of core strength.
Hall, Mansfield, and Jaffe ( 1993) have reported that the decline in R&D productivity during the 1980’s was concentrated in several major manufacturing sectors such as elec- trical, instruments, computing, and electronics. Although there has been improvement in these statistics during the last half of the decade, some industries, such as electrical, large- scale computing, machinery, metals, and automobiles, still lag. R&D productivity can be enhanced if focused on new products.
Bean ( 1995) found a significant relationship between R&D intensity (again, R&D spend- ing as a percentage of sales) and growth in market share for 15 drug companies between 1971 and 1990. Further, total factor productivity of R&D performing firms was significantly and “directly related to investments in product . . . and process . . . development,” supported by basic research (Bean 1995, p. 29). Since firms spend more on new products, these results seem reasonable. As market share increases, profitability is likely to go up (Schendel and Patton 1978). Morbey ( 1988)) on the other hand, found no direct rela- tionship between R&D spending and profitability.
Fryxell ( 1990) found that increases in business-level process (as opposed to product) R&D intensity had quick and positive effects on ROI, which is consistent with the Utterback and Abernathy ( 1975) model of product and process innovation investment and payoffs. That is, process R&D is likely to lower costs, while product R&D promotes growth. Yet, the relationship between specific policies and practices has not been incorporated into these models.
Perhaps the strongest argument supporting the R&D-market share connection is the first- mover advantage theory. Firms that are first to market with new products or product improvements have to distinguish these new offerings from existing products, usually requiring innovative features and new technology (Ansoff and Stewart 1967; Foster 1986; Kerin, Varadarajan, and Peterson 1992). Odagiri ( 1983) also found this to be true among the innovating firms in a sample of 370 Japanese manufacturers. Firms that can borrow new technology from one product group and apply it to another have the additional ad- vantage of R&D efficiencies.
Hypotheses
Several hypotheses can be derived from using this model (Figure 1) of the circum- stances under which technology, quality, and performance are related. The Utterback- Abernathy model predicts product and then process innovation to be greatest during the early stages of growth of an industry. Therefore, it would be expected that in high tech- nology industries, performance would depend more on R&D than quality. In mature in- dustries, the opposite would be true. Firms generally evolve from containment to preven- tative quality investments (Crosby 1979; Deming 1986; Imai 1986). This is summarized by the first two hypotheses.
Hypothesis 1: In high technology industries, R&D intensity and market share are sig- nificantly associated.
Hypothesis 2: In low technology industries, TQM programs are significantly correlated with market share. The Utterback-Abernathy model does not inform directly on the industry-free relationship between quality and technology, but the general notion that consistency in corporate and

QUALITY,TECHNOLOGY, AND GLOBAL MANUFACTURING 157
functional strategies is associated with survival and growth in manufacturing is instructive in making predictions from the model Figure 1. However, the measure of technology matters here. Therefore, the relationship will vary by whether technology is measured by product R&D typical of stage I and process R&D (CAM) for stage II.
Hypothesis 3: TQM adoption is significantly and inversely associated with R&D intensity. Hypothesis 4: TQM adoption is significantly and directly associated with process CAM.
These four hypotheses were offered for testing, with market share taken as the dependent variable, and with two alternative measures of technology: R&D intensity and CAM. Re- gional differences are also explored.
Methodology
Mail survey data from 600 manufacturing managers and their durable goods manufac- turing companies in 20 countries was used for proposition testing in this research. The sample is summarized, in the Appendix. Data from the United States are typical of the 20 countries. In each country, one principal investigator each in a network of scholars was charged with data collection and follow-up for the study. These u .s . data are all durable goods manufacturers, with high-added value shipments and with strong market positions in their respective industries. The response rate was 32%, which is about the same as other surveys of this type (Tomaskovic-Devey Leiter and Thompson 1994). The response rate for the total sample of 600 firms in 20 countries was 44.7%, and ranged from a high of 100% in Denmark to a low of 17% in Norway. The sample is described in the Appendix. Response bias by SIC code was checked for frequency of returns resulting in an observed cm-square of 7.89 (df * 9) which is not significant. This indicates that industry and propensity to return a questionnaire were not related in the u .s . data.
Measures
In the Appendix sections of the mailed questionnaire are reproduced that dealt with TQM, investments in automation (general levels and highest level) and investments in R&D (e.g., R&D intensity), maintenance (validation purposes), and firm size (number of em- ployees). Cost of quality was represented in four categories: inspection costs, internal costs, preventive costs, and external costs. Actual cost of quality was not sought, only relative proportions. One performance measure was compiled: market share in the main product line, and market share was used in the regressions as the dependent variable.
TQM Measure and Validation
To validate scales, a procedure similar to that used most recently by Flynn, Schroeder, and Sakakibara ( 1994) to validate quality measures was used. That is, perceptual measures of adopted quality practices are correlated with performance measures.
In the case of this study, a scale was constructed from items in the manufacturing strategy section of the questionnaire on the degree of use (“no use” scored 1, to “sig- nificant use the last 2 years” scored 5) of various practices including quality initiatives. An SPSSx item analysis produced a five-item scale including a TQM program, a zero defects and Kaizen (continuous improvement) program, quality function deployment (QFD), and quality policy deployment (QPD). QPD, sometimes called hoshin planning, starts with senior managers establishing a vision and core objectives for a company and this is then negotiated with middle managers in terms of specific goals, strategies, and resources (Dean and Evans 1994, p. 269). The Cronbach alpha for the scale was 0.80 and the average inter-item correlation was 0.45 ( IZ = 3 17). This same scale was computed for just the u .S . data with similar results (Cronbach alpha = 0.76).

158 JOHN E. E’ITLIE
TABLE 1 Correlation Matrix and Descriptive Statistics
1 2 3 4 5
1. R&D intensity 2. CAM 3. TQM 4. Size (no. of employees) 5. Market share
Mean SD ??
1.0 0.16** 1.0
-0.19** 0.19** 1.0 -0.03 0.22** 0.11 1.0
0.13** -0.11 0.12* -0.07 1.0
4.85% 8.2 13.8 867 33.9% 6.84% 4.2 5.5 1843 23.6%
500 325 327 586 545
**p < 0.01; *p < 0.05.
This TQM scale was significantly correlated with the proportion of money spent on prevention maintenance, with r = 0.22 (p < 0.01, II = 304). Regardless of the region, the more companies adopt TQM programs, the more they also spend on prevention. The validity of this TQM measure appears to be quite good.
One-way analysis of variance was used to validate the industry context grouping as- sumption. It was found that only one industry grouping was significantly higher in R&D intensity (F = 4.95, p = 0.0007) than the others (SIC 36, electrical equipment, including computers, with mean R&D intensity = 7%).
Results
In Table 1, the correlation matrix of Pearson product-moment coefficients is presented for the variables of the study ( SPSSx) . Description statistics are also included.
In Table 2, the results of the moderated regression analysis are presented. Industry categories were included as dummy variables. The mean level of R&D intensity (4.85%) was used as the group cut-off, so two moderated regressions were evaluated against the ordinary least-squares ( OLS) model taking market share as dependent and R&D intensity,
TABLE 2 Moderated Regressions (Market Share is Dependent)
Indeoendent Variables All Cases
Group 1: High Tech
(R&D% 2 4.85%)
Group 2: Low Tech
(R&D% < 4.85)
1. R&D intensity 0.12** 0.27** 0.07 2. TQM 0.09* 0.04 0.13* 3. Size (no. of employees) -0.06 -0.06 -0.04 4. SIC 34 0.08 -0.57 0.28 5. SIC 35 0.002 -0.41 0.13 6. SIC 36 -0.002 -0.62 0.16 7. SIC 37 0.01 -0.28 0.17 8. SIC 38 0.07 -0.43 0.14
W R*(s) df
2 61** (0.008) 2.09 (0.04) 1.65 (0.011) 0:03 (0.02) 0.09 (0.05) 0.04 (0.02)
8,591 8,172 8,310
Mean substitution for missing data controlling for industry. Entries are standardized regression coefficients. When just complete data cases were used, F = 2.01, p = 0.11; TQM; (beta = 0.15, p = 0.0193), no. of employees (beta = -0.05, p = 0.37), and R&D% (beta = 0.02, p = 0.77), resulted with df = 3,263.
**p < 0.01; *p < 0.05.

QUALITY,TECHNOLOGY, AND GLOBAL MANUFACTURING 159
size number of employees), and TQM as independent. The OLS model results are presented with the dependent variable in Table 2 in each case. Mean substitution was used for missing data. For all cases, TQM (beta = 0.09, p < 0.05) and R&D intensity (beta = 0.12, p < 0.01) are significantly and positively associated with market share.
The results in Table 2 strongly support the first two hypotheses. In the high technology industries, only R&D intensity is significantly associated with market share (beta = 0.27, p < O.Ol), controlling for size of firm (beta = -0.03, n.s., and industry). In low tech- nology industries, TQM is the only significant predictor of market share (beta = 0.13, p < 0.05), again controlling for organization size and industry. R&D is positively associated with market share in low tech firms, but the relationship is nonsignificant (beta = 0.07, n.s.). TQM is positively related to market share in high tech industries, but again it is nonsignificant under those circumstances (beta = 0.04, n.s.) .
Examination of Table 1 also indicates support for hypotheses three and four. Industry and region notwithstanding, R&D intensity is significantly and inversely related to TQM, r = -0.19 (p < 0.01) . However, TQM and CAM are significantly and positively correlated, r = 0.19 (p < 0.01).
Discussion
The Utterback-Abernathy model of the evolution of the product segment of the firm was used to help reconcile the quality-technology issues of performance in global man- ufacturing. It was predicted that R&D intensity or TQM would be alternatively good pre- dictors of market share depending upon the technology of the firm (approximated by high and low technology groupings). This model was strongly supported, controlling for in- dustry type. High tech firms had significantly higher market share when they invested in R&D. Low technology firms had better market share when they invested in TQM programs. Not surprisingly, R&D intensity was inversely correlated with TQM efforts, and CAM was directly associated with TQM, as this evolutionary stage model of productive segment would predict.
These results help explain why quality programs appear to get mixed reviews in surveys. That is, payoffs (e.g., market share) from TQM may vary by technology type of the firm, and appear to be more suited to low technology settings, regardless of general industry category in durable goods. The cut-off used in this research (4.85% of sales spent on R&D) includes the majority of the firms (almost 2 to 1) , however, in the sample.
Given the significant empirical support of the model, it would be interesting to speculate on other quality-technology-performance relationships. Market share and ROI were sig- nificantly related for a sub-sample (r = 0.17, p < 0.01) (not shown). Perhaps some of these results can be generalized to other performance measures, although this would be a rare finding (Cameron 1986).
Although aggregations at levels above the product line have not shown any consistent relationship between customer satisfaction and organizational performance (i.e., market share) (Fomell 1995), results from AT&T do support this relationship when products are isolated (DeLean 1994). Others have even suggested (e.g., W. Ducker, personal com- munication) that employee satisfaction and customer satisfaction, and therefore, market share, are related. Results from this study would predict that all of these relationships would depend upon life-cycle issues concerning the productive segment of the firm.
There are fine-tuning issues that could be introduced in the model as well, independently of the various performance outcomes. How do the various types of processing innovation interact with quality programs? For example, CAM is broad enough to include both flexible assembly and flexible manufacturing. Earlier, results reported by others (Chen and Adams 199 1) indicated either a negative or no relationship between quality goals and flexibility in manufacturing.

160 JOHN E. El-l-LIE
Missing data problems prevented any extensive country or regional comparisons but this could be a logical extension. Earlier literature (Iami 1986; Cole 1990, 1994; Carrie 1991; Kono 1992) suggested strong cultural differences in quality and technology em- phasis between the u .s . and Japan. The CAM and TQM scales, in particular, had missing data problems, as well as the other performance measures (e.g., ROI).
In general, there appears to be sufficient preliminary evidence, albeit subject to differ- ences in performance measures and cultural differences, to suggest further exploration of the model of quality-technology integration. Cost of quality proportions and TQM program reports cannot completely substitute for actual cost of quality levels, which may be prod- uct- and culturally dependent, but the moderating effects of core technology and industry difference in these firms appear to be a clear empirical trend that supports the Utterback- Abernathy (U-A) model. In future research, this is one methodological refinement that needs to be included. Extensions to the service sector would be useful.
Finally, there is emergent case evidence to suggest a total quality natural environmental management movement beginning in the United States, Japan, Sweden, and Germany, to name just a few countries (e.g., Romm 1994). This is the application of TQM principles (e.g., minimize waste) to the natural environmental concerns of organizations (e.g., re- duce, reuse, recycle). Will proactive concern for the natural environment provide a needed link between quality, technology and performance measures not adequately described or predicted by the U-A model? The cases from Romm ( 1994) and others (e.g., 3M, AT&T, Compaq Computer, Dow Chemical, DuPont, Xerox, and Boeing) of pollution prevented through waste elimination or prevention are proactive and not adequately explained by earlier theory. ’
’ Work in this area was supported in part by the London Business School, Chamlers University and the International Manufacturing Strategy Survey (IMSS ) . The opinions in this paper are those of the author.

APPE
NDIX
A
Sum
ntnrv
of the
IM
SS
Surve
v
COU”
try
SOW
X.
Selec
tion
Collec
tion
Lang
uage
Re
spon
se
Conc
lusion
Arge
ntina
Austr
alia
Aush
ia
Indus
trial
Union
of
Arge
ntina
Ad
dress
lis
t ov
er 11
0 lar
gest
com
panie
s va
rious
so
urces
The
large
st fro
m
SIC
38
134
com
panie
s >
500
emplo
yees
Be
lgium
Br
azil
Fortu
ne
500
Cana
da
Own
datab
ase
Chile
Denm
ark
From
Da
nish
state
Engla
nd/G
reat
Kom
pass
Br
itain
Finlan
d Ow
n da
tabas
e
Germ
any
Hollan
d
Own
datab
ase
Hollan
d’s
Cham
ber
of Co
mm
erce
Italy
Dun
and
Brad
stree
t
Japa
n
Mexic
o No
rway
Portu
gal
Perso
nal
co”tr
acts/
ow”
datab
ase
Own
datab
ase
Mini
stry
of Ind
ustry
Spain
Th
ree
differ
ent
datab
ases
Swed
en
USA
Emplo
yers
Fede
ration
Conta
cts
of Un
iversi
ty of
Mich
igan
107
of 50
0 lar
gest
withi
n SI
C
Rand
om
sam
ple
from
SI
C 38
18
com
panie
s lar
ger
than
200
emplo
yees
wi
thin
SIC
200
com
panie
s
91
“nits
Sam
ple
from
18
00
com
panie
s 11
5 of
the
203
large
st co
mpa
nies
(with
>2
00
empl.
)
132
conta
cted,
75
acce
pted
40
com
panie
s
Initia
lly
60
com
panie
s, the
n ad
dition
al 58
Sa
mple
of
53
large
, 42
ac
cepte
d
to tho
se
that
acce
pted
Via
perso
nal
conta
cts
Via
Co
ntact
via
phon
e, lat
er
Inter
views
Sam
ple
in SI
C 38
of
150
Initia
l co
ntact
via
phon
e, lat
er
lar
gest,
86
ac
cepte
d an
d re
mind
ers
127
large
st,
of wh
ich
120
were
co
rrect
131
large
co
mpa
nies
(high
va
lue-ad
ded,
high
shipm
ents)
Initia
l ph
one
conta
ct the
n via
m
ail
Via
Via
inter
view.
51
se
lected
for
int
ervie
w,
41
acce
pted
Via
post
+ re
mind
ers
Telep
hone
co
ntact
and
ed
surve
y
Firs
t via
po
st,
later
als
o int
ervie
ws
Initia
l tel
epho
ne
conta
ct,
later
se
nt via
m
ail.
rem
inder
s
Inter
view
Initia
lly
via
, wi
th
rem
inder
s ov
er m
ail
and
phon
e Via
m
ail
and
rem
inder
s via
ph
one
Via
Firs
t tel
epho
ne
conta
ct,
then
via
Firs
t co
ntact
via
lette
r, the
n via
m
ail
Span
ish
Engli
sh
Engli
sh
Engli
sh
Portu
gues
e
Revis
ed
Engli
sh
versi
on
with
re
spec
t to
NAFT
A
Inter
view
base
d on
En
glish
qu
estio
nnair
e En
glish
Engli
sh
Germ
an
Engli
sh
Italia
n
Japa
nese
Engli
sh
Norw
egian
Portu
gues
e
Span
ish
Engli
sh
Engli
sh
41/51
=
80%
of
selec
tion.
Tota
l 41
. 29
/110
= 26
%
rate.
To
tal
29.
Tota
l 27
an
swer
s (20
%)
3 zL
s Po
st:
14/88
=
16%
. Int
ervie
w:
1509
=
79%
. To
tal:
27%
ra
te an
d 29
an
swer
s. Un
iform
dis
tributi
on
of 23
an
swer
s wi
thin
SIC
38
8 an
swer
s 10
0%
of sa
mple
, 17
%
of co
mpa
nies
large
r tha
n 20
0 em
ploye
es
37/20
0 =
18.5%
ra
te,
Tota
l 37
an
swer
s. 17
/91
= 19
%
rate.
To
tal
17
answ
ers.
24
answ
ers
57%
se
lected
, 13
%
answ
ered
, of
com
panie
s >
200
emplo
yees
. To
tal
27
answ
ers.
3 1%
of
total
sam
ple,
55%
of
those
ac
cepti
ng.
Tota
l 41
an
swer
s. 27
140
= 67
%
rate.
To
tal
27
answ
ers.
62
answ
ers
Tota
l 20
an
swer
s (17
%
rate)
79
%
of se
lected
co
mpa
nies.
Tota
l 42
an
swer
s. To
tal
29
answ
ers
(33.7%
ra
te)
Tota
l 61
an
swer
s (5
1%
rate)
To
tal
42
answ
ers
(32%
ra
te)
Repre
sents
lar
ger
com
panie
s, wi
th
bias
towar
ds
“bes
t pr
actic
e”
Repre
sents
lar
ger
com
panie
s
Repre
senta
tive
mate
rial
cove
ring
20%
of
selec
ted
indus
try
Few
answ
ers.
Not
repres
entat
ive
Repre
sents
lar
ger
com
panie
s, wi
th
bias
towar
ds
“bes
t pr
actic
e”
Repre
senta
tive
for
SIC
38
Few
answ
ers.
Not
repres
entat
ive
Repre
senta
tive
sam
ple
for
com
panie
s >
200
emplo
yees
Bias
towar
ds
small
/med
ium
com
panie
s
Lang
uage
pr
oblem
s, re
lative
ly fe
w an
swer
s, bu
t rea
sona
ble
pictur
e of
Finnis
h SI
C 38
ind
ustry
A
cross
-secti
onal
sam
ple.
Low
respo
nse
rate.
Re
prese
ntativ
e m
ateria
l
Repre
senta
tive
for
large
r co
mpa
nies
Repre
senta
tive
for
large
an
d m
edium
siz
ed
com
panie
s, bu
t no
t the
we
ll-kno
wn
Repre
senta
tive
mate
rial
Uncle
ar re
pres
entat
ivity
No
mult
inatio
nals.
Bia
s tow
ards
“b
est
prac
tice”
in
Portu
gal
Repre
senta
tive
for
large
an
d m
edium
siz
e co
mpa
nies.
Even
sp
lit m
ellan
na
tiona
l an
d m
ultina
tiona
l Re
prese
ntativ
e of
large
co
mpa
nies.
Repre
sents
lar
ger
com
panie
s, wi
th
small
bia
s tow
ards
“b
est
prac
tice”

162 JOHN E. E’l-ILIE
APPENDIX B: Mailed QoesUon~ire Items
Variable Item
R&D, Equipment and Trelning Intensity
Performance
Percentage of revenue that comes from new products1
Coat of Quality Proportione
Automation
Span of
During the last tbrce years, approximately what proportion of business unit turnover W&P spent on (average !b of total turnover):
- % Research and development - % Pmccss equipment - % Training and education
Fbr the dominant product line of your business, according to produced volume, what is your market share? -%
What is the Return on Investment (ROI) for the last fiscal year of your business? Please indicate net profit before taxes, total assets and/or ROI (which is profit divided by assets).
Net profit before taxes = = ROI =
Total assets =-
Please indicate the past and anticipated changes for your company in the following strategic market and product activities.
Actual figure for 1991 %changeoverthelastS B&hated % chmge over Ye= the next 5 years
-8 -% -%
What is, approximately, the m for the buslncss unit (adds up to loo%)? - % inspsction/control costs (due to unstable processes) - 96 internal costs of quality (e.g., scrap, losses)
% preventive costs (education, documentation. revisions. etc.) z % extemd quality costs (e.g.. warranty costs) Hloosb
Below is descrlbsd a hierarchy of machine automation (levels l-7) and a hierarchy of information systems integration (levels S-10). based on the span of computer control and integration. The degree of automation increases from simple machine automation, to very high level factory automation. Please indicate general (G) level of automation in your factory and the highest (R) level, e.g., test site.
computer G/H Level control Description of computerized control for level
- 1 None Instructions for machine control - 2 Stand alone machine
- 3 Machining center level 2 + Insttuctlons for changing tools 4 Machining cell level 3 + Multiple remaining control
- :
FMS-type1 level 4 + Scheduling - Fus-tyyc2 level 5 + LoadingAmloading, storage - 7 PMS-typc3 level 6 + Inspection, sorting - 8 Automated factory -1 level 7 + Compumrlsation of functional modules, e.g., MIS, MRP.
cm~,~ - 9 Automated factoty -2 level 8 + Lhtkagc of MIS, MRP, order processing, schcdullng, cost
analysis - 10 Automated factory -3 level 9 + Linkage of CAD, CAPP, CAR and CAM
1 A new product is defined as a product that inchales new technology or new application of technology.

QUALITY, TECHNOLOGY, AND GLOBAL MANUFACTURING 163
APPENDIX C Characteristics of Global Sample
Country Frequency %
Mexico 62 10.3 Sweden 61 10.2 Argentina 41 6.8 Italy 41 6.8 Portugal 41 6.8 USA 41 6.8 Great Britian 36 6.0 Austria 29 4.8 Spain 29 4.8 Brazil 28 4.7 Australia 27 4.5 Japan 27 4.5 Netherlands 27 4.5 Germany 24 4.0 Canada 23 3.8 Norway 20 3.3 Denmark 17 2.8 Finland 17 2.8 Chile 6 1.0 Belgium 3 .5
Total 600 100.0
Industry
Metal Fab Equipment Elec. equip. Transportation Instruments
Other Missing
Totals:
SIC Code
34 35 36 37 38
f %
187 31.2 85 14.2
123 20.5 84 14.0 50 8.3
7 1.2 64 10.7
600 100
SECTION C This section deals with the goals and activities the business unit plans to emphasize over the next two years,
and the relative payoff from activities undertaken within the last two years. 2. On the far left side, indicate if the activity has been undertaken within the last two years. On the second
left-hand scale, indicate the relative payoff from the activity. On the right-hand scale, indicate if the activity will be adopted within the coming two years (if it is not currently adopted),
Degree of use last 2 years
No High use use 1 2 3 4 5 1 2 3 4 5 1 2 3 4 5 1 2 3 4 5 1 2 3 4 5 1 2 3 4 5 1 2 3 4 5 1 2 3 4 5 1 2 3 4 5 1 2 3 4 5 1 2 3 4 5 1 2 3 4 5 1 2 3 4 5 1 2 3 4 5 1 2 3 4 5 1 2 3 4 5 I 2 3 4 5 1 2 3 4 5 1 2 3 4 5 1 2 3 4 5 1 2 3 4 5 1 2 3 4 5 1 2 3 4 5
Relative payoff
LOW High 1 2 3 4 5 1 2 3 4 5 1 2 3 4 5 1 2 3 4 5 1 2 3 4 5 1 2 3 4 5 1 2 3 4 5 1 2 3 4 5 1 2 3 4 5 1 2 3 4 5 1 2 3 4 5 1 2 3 4 5 1 2 3 4 5 1 2 3 4 5 1 2 3 4 5 1 2 3 4 5 1 2 3 4 5 1 2 3 4 5 1 2 3 4 5 1 2 3 4 5 1 2 3 4 5 1 2 3 4 5 1 2 3 4 5
Total Quality Management Program Statistical process control (WC) IS0 9ooo MRP MRPII Just-In-Time manufacturing, Lean Production Just-In-Time (frequent) deliveries to customers SMED (Single minute exchange of dies) Pull scheduling (e.g., Kanban) Zero defect programs CAM CAD Design for AssemblyA4anufacturing (DFA/DFM) Quality Function Deployment Value analyses/redesign of products Quality Policy Deployment Reorganize to “plant-within-a-plant” Defining a Manufacturing Strategy Simultaneous Engineering Activity Based Costing Implementing team approach (work groups) Benchmarking KAIZBN (continuous improvement)
Adopted within next two years
•1 0 q 0 0 0 0 0 0 0 0 0 0 0 0 0 0 cl 0 0 0 0 0

164 JOHN E. ElTLIE
SECTION C (Co&d)
Degree of use last 2 years
~ Relative payoff No High ~ Adopted witbin use use Low High next two years 1 2 3 4 5 1 2 3 4 5 Total Productive Maintenance cl 1 2 3 4 5 1 2 3 4 5 Energy conservation programs q 1 2 3 4 5 1 2 3 4 5 Environmental protection programs 0 1 2 3 4 5 1 2 3 4 5 Health and safety programs 0
References
ABERNATHY, W. J. (1976). ‘Production Process Structure and Technological Change,” Decision Sciences, 7, 4,607-619. AND P. L. TOWNSEND (1975), “Technology, Productivity, and Process Change,” Technological Fore-
casting and Social Change, 7, 379-396. ABO, T. ( 1994). Hybrid Factory: The Japanese Production System in the United States, Oxford University
Press, New York. ANSOFF, H. L. AND M. STEWART ( 1967), “Strategies for a Technology-Based Business,” Harvard Business
Review, 45, 6, 71-83. BEAN, A. S. (1995), “Why Some R&D Organizations are More Productive Than Others,” Research-Technology
Management, January-February, 1.25-29. BERGMAN, B. AND B. KLEFSJO (1994), Quality: From Customer Needs to Customer Satisfaction, McGraw-Hill,
London, UK. BESTERFIELD, D. H., C. BESTERFIELD-MICHNA, Cl. H. BESTERFIELD, AND M. BESTERFIELD-SACRE (1995), Total
Quality Management, Prentice-Hall, Englewood Cliffs, NJ. BILLINGS, B. A., J. MCGOWAN, AND F. AL NAJJAR (1994), “An Inter-Country Comparison of the Research and
Development Tax Credit,” Accounting Horizons, 8, 1, 19-34. BURAN, W. (1994). “The State-of-the-art on Process Re-engineering and Quality,” presented at the Quality
and Process Re-engineering Conference, Michigan Business School, Ann Arbor, Michigan, March 25. CAMERON, K. S. ( 1986), “Effectiveness as Paradox: Consensus and Conflict in Conceptions of Organizational
Effectiveness,” Management Science, 32,5,539-553. CHEN, F. F. AND E. ADAM (1991), “The Impact of Flexible Manufacturing Systems on Productivity and
Quality,” IEEE Transactions on Engineering Management, 38, 1, 33-45. COLE, R. E. (1994), “Reflections on Organizational Learning in U.S. and Japanese Industry,” in Engineered
in Japan, J. Liker, J. Ettlie, and J. Campbell (eds.), Oxford University Press, New York, ( 1995). - ( 1990), “U.S. Quality Improvement in the Auto Industry: Close but No Cigar,” California Management
Review, Summer, 71-85. CROSBY, PHILLIP B. (1979), Quality is Free, New American Library, New York. CURRIE, W. (1991)) “Managing Production Technology in Japanese Industry-An Investigation of Eight Com-
panies, Part 2,” Management Accounting-London, 69,7,36-38. DAFT, R. L. ( 1978). “A Dual-Core Model of Organizational Innovation,” Academy of Management Journal,
21,2, 193-210. DEAN, J. W. AND D. E. BOWEN (1994), “Management Theory and Total Quality: Improving Research and
Practice Through Theory Development,” Academy of Management Review, 19, 3, 1-27. - AND J. R. EVANS (1994), Total Quality, West Publishing, Minneapolis/St. Paul, MN. D~LEAN,.M. L. ( 1994), “AT&T’s Quality Journey: An Insider’s View on Bottom Line Improvement,” pre-
sented at the University of Michigan, School of Business Administration, December 14. DEMING, W. E. (1986), Out of the Crisis, Massachusetts Institute of Technology Center for Advanced Engi-
neering Study, Cambridge, MA. - ( 1950), Some Theory of Sampling, John Wiley and Sons, New York. DIMAGGIO, P. J. AND W. W. POWELL (1983), “The Iron Cage Revisited: Institutional Isomorpbism and Col-
lective Rationality in Organizational Fields,” American Sociological Review, 48, 147- 160. DODGE, H. F. (1969), “Notes on the Evolution of Acceptance Sampling Plans, Part II,” Journal of Quality
Technology, July, 155-56. ELLIS, D. ( 1992)) “Identification of Unique of Cultural Response Patterns by Means of Item Response Theory,”
Journal of Applied Psychology, 77,2, 177-184.

QUALITY, TECHNOLOGY, AND GLOBAL MANUFACTURING 165
ETTLIE, J. E. (1979), “Evolution of the Production Segment and Transportation Innovations,” Decision Sci- ences, 10, 3, 399-411.
AND J. PENNER-HAHN ( 1994), “Flexibility Ratios and Manufacturing Strategy,” Management Science, 40, 11,14441454.
AND E. M. REZA (1992), “Organizational Integration and Process Innovation,” Academy of Manage- ment Journal, 35,4, 795-827. , W. R. BRIDGES, AND R. O’KEEFE ( 1984), “Organizational Strategy and Structural Differences for Radical versus Incremental Innovation,” Management Science, 30,6,682-695.
EVANS, J. R. AND W. M. LINDSAY (1993), The Management and Control of Quality, 2nd. ed., West Publishing Company, Minneapolis/St. Paul, MN.
FALTERMAYER, E. (1994), “Competitiveness: How U.S. Companies Stack Up Now,” Forrune, April 18,52-64. FARNUM, N. R. ( 1994), Modem Sfutisfical Quality Control and Improvement, Duxbury Press, Belmont, Canada. FEDOTOWSKY, M. (1994). “Small Company Quality: Where Do We Stand?” Presented at the Seventh Annual
Quality Conference: Quality & Process Re-engineering, University of Michigan, Ann Arbor, Michigan, March 25.
FEIGENBAUM, A. V. ( 1956). “Total Quality Control,” Harvard Business Review, November-December, 94,98. FLOOD, R. L. (1993), Beyond TQM, New York, John Wiley & Sons. FLYNN, B. B., R. G. SCHROEDER, AND S. SAKAKIBARA ( 1994), “A Framework for Quality Management Research
and an Associated Measurement Instrument,” Journal of Operations Management, 11, 339-366. FORNELL, C. (1995), Personal Communication, February. FOSTER, R. N. ( 1986), Innovafion: The Attacker’s Advanrage, New York Summit Books. FRANKO, L. (1989), “Global Cotporate Competition: Who’s Winning, Who’s Losing, and the R&D Factor in
One Reason Why,” Srrategic Management Journal, 10,5, September/October, 449-474. FRYXELL, G. (1990). “Business-Level Process R&D: Patterns and Returns Under Different Generic Strategic
Orientations,” International Journal of Technology Management, 5, 1,41-63. GARUD, R. AND P. R. NAYYAR ( 1994), “Transformative Capacity: Continual Structuring by Intermodal Tech-
nology Transfer,” Strategic Management Journal, 15, 5, 365-385. GARVIN, D. A. (1988), Managing Qualiry, The Free Press, New York. GIBBONS, J. D. (1976), Nonparametric Methods for Quanntutive Analysis, Holt, Rinehart, and Winston, New
York. GITLOW, H., A. OPPENHEIM, AND R. OPPENHEIM ( 1995). Qualify Management: Tools and Methodsfor Improve-
ment, 2nd. ed., Irwin, Burr Ridge, IL. GOETSCH, D. L. AND S. DAVIS ( 1995), Total Quality, Prentice Hall, Englewood Cliffs, NJ. GRAVES, S. B. AND S. A. WADD~CK (1994), “Institutional Owners and Corporate Social Performance,” Acad-
emy of Management Journal, 37,4, 1034- 1046. HAGE, J. ( 1980), Theories of Organizafion, New York, Wiley. HEGARTY, W. H. AND R. C. HOFFMAN (1990), “The Relationship Between Strategic Planning and Performance
Among Three Cultures,” Proceedings, Academy ofMunagement, Miami Beach, FL, 106-l 10. HALL, B. H., E. MANSFIELD, AND A. B. JAFFE (1993), “Industrial Research During the 1980’s: Did the Rate of
Return Fall?’ Brookings Papers on Economic Activity, 2, 2, 289-343. HOSKISSON, R. AND M. HITT (1988), “Strategic Control Systems and Relative R&D Investment in Large Mul-
tiproduct Firms,” Strategic Management Journal, 9, 6, 605-621. IMAI, K. ( 1986), Kaizen: The Key to Japan’s Competitive Success, McGraw-Hill Publishing Co, New York. JAIKUMAR, R. ( 1986b). “Post-Industrial Manufacturing, ” Harvard Business Review, November-December, 69-
76. JURAN, J. M. (ed.) ( 1951), Quality Control Handbook McGraw-Hill, New York. KERIN, R. A., P. VARADARAJAN, P. RAJAN, AND R. A. PETERSON ( 1992), “First-Mover Advantage: A Synthesis,
Conceptual Framework, and Research Propositions,” Journal of Marketing, 56, 4, 33-52. KIM, W. AND E. LYN (1990), “FDI (Foreign Direct Investment) Theories and Performance of Foreign Multi-
nationals Operating in the U.S.,” Journal of International Business Studies, 21, 1,41-54. KONO, T. ( 1992), “Japanese Management Philosophy: Can it be Exported?” in Strategic Management in
Japanese Companies, T. Kono (ed.) , Pergamon Press, Oxford, UK. 1 l-23.
LICHTENBERG, F. ( 1992), “R&D Investment and International Productivity Differences,” NBER Working Paper No. 4164, National Bureau of Economic Research, Cambridge, MA.
- AND D. SIEGEL ( 1991), “The Impact of R&D Investment on Productivity-New Evidence Using Linked R&D-LRD Data,” Economic Inquiry, XXIX, April, 203-228.
LIKER, J. K., J. E. ET~LIE, AND A. C. WARD ( 1995), “Managing Technology Systematically: Common Themes,” in Engineered in Japan, J. Liker, J. Ettlie and J. Campbell (eds.), Oxford University Press, New York.
MANSFIELD, E. (1993). “The Diffusion of Flexible Manufacturing Systems in Japan, Europe and the United States,” Managemen? Science, 39,2, 149- 159.
MIMROM, P. AND J. ROBERT (1990), “The Economics of Modem Manufacturing: Technology, Strategy, and Organization,” American Economics Review, 80, 5 11-528.

166 JOHN E. ETTLIE
MORBEY, G. ( 1988), “R&D: Its Relationship to Company Performance,” Journal of Product Innovation Man- agement, 53, 191-200.
- (1989), “R&D Expenditures and Profit Growth,” Research-Technology Management, 32,3,20-23. -AND R. REITHNER (1990), “How R&D Affects Sales Growth, Productivity and Profitability,” Research-
Technology Management, 33, 3, 1 l- 14. MORGAN, J. ( 1993), “Building a World Class Supply Base from Scratch,” Purchasing, 115, 2, 56-61. MYERS, S. AND D. G. MARQUIS (1969), “Successful Industrial Innovations,” National Science Foundation, 69-
17. NELSON, R. R. (1993), “A Retrospective, ” in National Innovation Systems: A Comparative Analysis, R. R.
Nelson (ed.), Oxford University Press, New York, 505-523. ODAGIRI, H. (1983), “R&D Expenditures, Royality Payments, and Sales Growth in Japanese Manufacturing
Corporations,” The Journal of Industrial Economics, XxX11, 1, 61-7 1. ORTON, J. D. AND K. E. WEICK (1990), “Loosely Coupled Systems: A Reconceptualization,” Academy of
Management Review, 15,2,203-223. PAUL, H. AND B. SURESH (1991), “Manufacturing Strategy Through Planning and Control Techniques of Ad-
vanced Manufacturing Technology,” International Journal of Technology Management, 6, 3-4, 233- 242.
PETERAF, M. A. ( 1993), “The Cornerstones of Competitive Advantage: A Resource-Based View,” Strategic Management Journal, 14,3, 179-192.
PFEFFER, J. AND G. R. SALANCIK (1978). The External Control of Organizations: A Resource Dependence Perspective, Harper & Row, New York.
RECHTIN, M. ( 1994). “Europeans Roar into No. 2 in CSI,” Automotive News, 2, July 11, 59. REIMAN, C. (1993), “The Baldtige Award Criteria: A Dynamic Model for Integrating Business Management
Requirements-Focus on Quality and Productivity,” presented at the Production and Operations Man- agement Society, October 5, Boston, MA.
ROBERTS, E. B. (1995), “Benchmarking the Strategic Management of Technology-I,” Research-Technology Management, January-February, 44-56.
ROMANELLI, E. AND M. L. TUSHMAN ( 1994), “Organizational Transformation as Punctuated Equilibrium: An Empirical Test,” Academy of Management Journal, 37,5, 1141- 1166.
ROMM, JOSEPH J. (1994), Lean and Clean, Kadansha International, New York. SCHENDEL, D. AND G. R. PATTON (1978). “A Simultaneous Equation Model of Corporate Strategy,” Manage-
mentscience, 24, 15, 1611-1621. Scorr, W. R. ( 1987). “The Adolescence of Institutional Theory,” Administrative Science Quarterly, 34, 4,
493-511. SITKIN, S. B., K. M. SUTCLIFFE, AND R. G. SCHROEDER ( 1994). “Distinguishing Control from Learning in Total
Quality Management, A Contingency Perspective,” Academy of Management Review, 19,3,537-564. SOUDER, W. E. AND J. D. SHERMAN (1994). Managing New Technology Development, McGraw Hill, New York. UTTERBACK, J. M. AND W. J. ABERNATHY (1975)) “A Dynamic Model of Process and Product Innovation,”
Omega, 3,6,639-656. VERNON, R. AND L. T. WELLS (1991), The Economic Environment of International Business, 5th ed., Prentice
Hall, Englewood Cliffs, NJ. VIKERY, S. K. AND C. DROCE ( 1993), “Production Competence and Business Strategy: Do They Affect Business
Performance?’ Decision Sciences, 24, 2, 435-455. VROMAN, H. W. AND V. P. LUCHSINGER (1994), Managing Organization Quality, Irwin, Burr Ridge, IL. WADWCK, SANDRA A. AND SAMUEL B. GRAVES (1994), “Industry Performance and Investment in R&D and
Capital Goods,” Journal of High Technology Management Research, 5, 1, 1- 17. WARD, P. T., K. G. LEONG, AND K. K. BOYER (1994), “Manufacturing Proactiveness and Performance,”
Decision Sciences, 25, 3, 337-352. W~ICK, K. E. ( 1976), “Educational Organizations as Loosely Coupled Systems,” Administrative Science Quar-
terly, 21, 1, 1-19. WERNERFELT, B. (1984), “A Resource-based View of the Firm,” Strategic Management Journal, 5, 2, 171-
180. WOLFF, M. F. (1994), “Meet Your Competition: Data from the IRI R&D Survey,” Research Technology
Management, January-February, 1, 18-24. ZAIRI, M. ( 1993), “Competitive Manufacturing: Combining Total Quality with Advanced Technology,” Long
Range Planning, 26,3, 123-132.