QUALITY OF WATER COLORADO RIVER BASIN Progress Report … · QUALITY OF WATER COLORADO RIVER BASIN...
95
QUALITY OF WATER COLORADO RIVER BASIN Progress Report No. 21 U.S. Department of the Interior January 2003
Transcript of QUALITY OF WATER COLORADO RIVER BASIN Progress Report … · QUALITY OF WATER COLORADO RIVER BASIN...

QUALITY OF WATER
COLORADO RIVER BASIN
Progress Report No. 21
U.S. Department of the Interior
January 2003


TABLE OF CONTENTS
SUMMARY ...................................................................................................................................... 1
CHAPTER 1 - INTRODUCTION...................................................................................................... 3 AUTHORIZATION FOR REPORT .............................................................................................. 3 LEGAL ASPECTS ....................................................................................................................... 4
Water Quantity ........................................................................................................................ 4 Water Quality .......................................................................................................................... 5
CHAPTER 2 - DESCRIPTION OF BASIN....................................................................................... 8 CLIMATE..................................................................................................................................... 8 HYDROLOGY.............................................................................................................................. 8 RESERVOIR STORAGE........................................................................................................... 10 GEOLOGY AND SOILS ............................................................................................................ 11
CHAPTER 3 - CAUSES AND IMPACTS OF SALINITY ............................................................... 13 CAUSES OF SALINITY............................................................................................................. 13
Agricultural Sources of Salinity ............................................................................................. 13 Natural Sources of Salinity.................................................................................................... 15 Municipal and Industrial Sources of Salinity.......................................................................... 15 Consumptive Use of Water Increases Salinity...................................................................... 15 Energy Exploration and Development................................................................................... 17 Erosion .................................................................................................................................. 18
EFFECTS OF WATER QUALITY ON WATER USERS ........................................................... 20 Economic .............................................................................................................................. 20 Health.................................................................................................................................... 21
CHAPTER 4 – TITLE I SALINITY CONTROL PROGRAM .......................................................... 23 Coachella Canal Lining.............................................................................................................. 24 Protective and Regulatory Pumping .......................................................................................... 24 Yuma Desalting Plant ................................................................................................................ 25 Wellton-Mohawk Irrigation and Drainage District ...................................................................... 27
CHAPTER 5 - TITLE II SALINITY CONTROL PROGRAM .......................................................... 31 U.S. Bureau of Land Management............................................................................................ 32 U.S. Department of Agriculture ................................................................................................. 35 U.S. Bureau of Reclamation...................................................................................................... 36
Program Summary................................................................................................................ 36

Big Sandy River Unit ............................................................................................................. 42 Blue Springs Unit .................................................................................................................. 43 Colorado River Indian Reservation Unit................................................................................ 43 Dirty Devil River Unit ............................................................................................................. 44 Glenwood-Dotsero Springs Unit............................................................................................ 44 Grand Valley Unit .................................................................................................................. 45 Land Retirement.................................................................................................................... 47 La Verkin Springs Unit .......................................................................................................... 49 Las Vegas Wash Unit ........................................................................................................... 49 Lower Gunnison Basin Unit................................................................................................... 50 Lower Gunnison Basin Unit, North Fork Area....................................................................... 51 Lower Virgin River Unit ......................................................................................................... 52 Mancos Valley Unit................................................................................................................ 53 McElmo Creek Unit - Dolores Project ................................................................................... 53 Meeker Dome Unit ................................................................................................................ 54 Palo Verde Irrigation District ................................................................................................. 55 Paradox Valley Unit............................................................................................................... 56 Price-San Rafael Rivers Unit ................................................................................................ 58 San Juan River Unit .............................................................................................................. 60 Selenium Studies .................................................................................................................. 60 Sinbad Valley Unit ................................................................................................................. 62 Uinta Basin Unit .................................................................................................................... 63 Virgin Valley Unit ................................................................................................................... 64
CHAPTER 6 - SALINITY CONDITIONS ....................................................................................... 65 FACTORS INFLUENCING SALINITY....................................................................................... 65
Reservoir Storage ................................................................................................................. 66 Water Use by Agriculture and Municipal & Industrial Users ................................................. 67 Salinity Control ...................................................................................................................... 71
HISTORIC SALINITY CONDITIONS......................................................................................... 72 NATURAL VARIATION IN SALINITY........................................................................................ 72 COMPLIANCE WITH THE SALINITY STANDARDS................................................................ 73 SALINITY CONTROL NEEDS .................................................................................................. 74
REFERENCES CITED .................................................................................................................. 75
GENERAL REFERENCES............................................................................................................ 77
APPENDIX A – SALINITY DATA.................................................................................................. 83

TABLES Table 1 - Comparison of River Basin Drainage and Runoff .......................................................... 10 Table 2 - Quantified Sources of Salt Loading ................................................................................ 14 Table 3 - Average Annual Water Use 1981-90.............................................................................. 16 Table 4 - WMIDD Irrigation Efficiency ........................................................................................... 29 Table 5 - Salt Retained on BLM Lands (tons per year) ................................................................. 34 Table 6 - USDA Salinity Control Program Summary ..................................................................... 35 Table 7 - "Original" Bureau of Reclamation Salinity Control Units................................................. 40 Table 8 - "New" Bureau of Reclamation Basinwide Salinity Control Program............................... 41 Table 9 - Land Retirement Costs and Cost Effectiveness............................................................. 48 Table 10 - Selenium in the Colorado River Basin.......................................................................... 62 Table 11 - Upper Basin Depletion Projections (1000 af/yr) ........................................................... 69 Table 12 - Lower Basin Depletion Projections (1000 af/yr) ........................................................... 70 Table 13 - Salinity Control Requirements and Needs (2002 Triennial Review)............................. 74
FIGURES Figure 1 – Map of the Colorado River Basin.................................................................................... 9
Figure 2 - Colorado River Storage System.…………………………………………………………….10
Figure 3 - Sources of Salinity......................................................................................................... 13 Figure 4 - Historic and Projected Upper Colorado River Uses. ..................................................... 16
Figure 5 - Photo of a Coal Bed Methane Well …………………………………………………………18
Figure 6 - Salinity Damages........................................................................................................... 20 Figure 7 - Salinity Damage Curve.................................................................................................. 20 Figure 8 - Map of Title I Projects.................................................................................................... 23
Figure 9 - Aerial Photo of Yuma Desalting Plant ………………………………………………………25
Figure 10 - Map of Title II Salinity Control Project Areas............................................................... 31 Figure 11 - Schematic of Agricultural Salt Loading........................................................................ 45 Figure 12 - Photo of Canal Lining. ................................................................................................. 45
Figure 13 - Meeker Dome Plugging and Chloride Concentration...................................................55 Figure 14 - Photo of Paradox Valley. ............................................................................................. 57 Figure 15 - Schematic of Paradox Project..................................................................................... 57
Figure 16 - Change in Salt Load in Dolores River in Paradox Valley .……………………………....58
Figure 17 - Salinity from Canal Seepage....................................................................................... 58 Figure 18 - Price-San Rafael Irrigation Improvements. ................................................................. 59 Figure 19 - Unimproved Canal at Hammond Project..................................................................... 60 Figure 20 - Salinity in Uinta Basin Unit Area.................................................................................. 63

FIGURES (continued) Figure 21 - Effects of Glen Canyon Dam on Salinity. .................................................................... 66 Figure 22 - Historic and Projected Water Uses. ............................................................................ 68 Figure 23 - Salinity Control Program Progress…............................................................................71 Figure 24 - Mainstem Flow and Salinity......................................................................................... 72
Figure A1 - Colorado River water quality monitoring stations………………………………………...84
Figure A2 - Flow and TDS over Time for Stations 1-4 ………………………………………………..85
Figure A3 - Flow and TDS over Time for Stations 5-8………………………………………………...86
Figure A4 - Flow and TDS over Time for Stations 9-12 ………………………………………………87
Figure A5 - Flow and TDS over Time for Stations 13-16 .……………………………………………88
Figure A6 - Flow and TDS over Time for Stations 17-20 …………………………………………….89

1
SUMMARYSUMMARYSUMMARYSUMMARY
The Colorado River and its tributaries provide municipal and industrial water to about 27 million people and irrigation water to nearly 4 million acres of land in the United States. The river also serves about 2.3 million people and 500,000 acres in Mexico. The threat of salinity is a major concern in both the United States and Mexico. Salinity affects agricultural, municipal, and industrial water users. Damages in Mexico are unquantified, but damages in the United States are presently about $330 million per year. This biennial report on the quality of water in the Colorado River Basin is required by Public Laws 84-485, 87-483, and the Colorado River Basin Salinity Control Act (Salinity Control Act).
The Salinity Control Act (Public Law 93-320, as amended by Public Laws 98-569, 104-20, 104-127, and 106-459) authorizes the Secretaries of the U.S. Department of the Interior (Interior) and U.S. Department of Agriculture (USDA) to enhance and protect the quality of water available in the Colorado River for use in the United States and the Republic of Mexico. The Salinity Control Act also requires the Secretary of the Interior to report biennially on the progress of the program.
Title I of the Salinity Control Act authorized the construction and operation of a desalting plant, brine discharge canal, and other features to enable the United States to deliver water to Mexico having an average salinity no greater than 115 parts per million (ppm) plus or minus 30 ppm over the annual average salinity of the Colorado River at Imperial Dam. The Title I program (administered by the Bureau of Reclamation [Reclamation]) continues to meet the requirements of Minute No. 242 of the International Boundary and Water Commission, United States and Mexico.
Title II of the Salinity Control Act authorized several specific salinity control units in 1974 and 1984 to meet the objectives and standards set by the Clean Water Act. The cost effective portions of these units have all been completed. In 1995, Public Law 104-20 authorized an entirely new way of implementing salinity control. Reclamation’s Basinwide Salinity Control Program opens the program to competition through a “Request for
Salinity damages to municipal water pipe.
Salinity damages to crop production.

2
Proposal” process, which has greatly reduced the cost of salinity control. The average cost of salinity control measures has dropped from about $70 per ton to $30 per ton.
The Colorado River Basin Salinity Control Forum (Forum) in accordance with the requirements of the Clean Water Act, prepared the 2002 Review, Water Quality Standards for Salinity, Colorado River System (Review). In the Review the Forum reported that the Colorado River Basin Salinity Control Program (Program) has controlled a total of 800,000 tons per year of salt. In order to meet the target of 1.8 million tons per year of salinity control through 2020, it will be necessary to fund and implement potential new measures which ensure the removal of an additional 1,000,000 tons per year. The Forum stated that in order to achieve this level of salt reduction, the federal departments and agencies would require the following capital funding: Reclamation appropriation - $10.5 million per year (bringing the total Reclamation program to with cost-sharing to $15 million per year); and USDA EQIP appropriation - $13.8 million per year (bringing the total on-farm program to $19.7 million per year with Basin states parallel program). No new measures for the BLM were proposed in the Review. It is anticipated when measures are identified they will be included in the program.
The Review found that nearly 23,000 tons worth of new controls would need to be implemented each year to maintain the standards. This program goal is the combined target for the participating agencies within Interior and USDA. In Reclamation’s annual presentation to the Colorado River Basin Salinity Control Advisory Council (November 2001), Reclamation presented an analysis of the program’s overall progress. The analysis showed that the program has been able to meet or exceed its 23,000 ton-per-year target mainly because of the twofold increase in efficiency achieved by Reclamation’s new Basinwide Salinity Control Program.

3
Chapter 1 Chapter 1 Chapter 1 Chapter 1 ---- INTRODUCTION INTRODUCTION INTRODUCTION INTRODUCTION
The Bureau of Reclamation (Reclamation) of the U.S. Department of the Interior prepared this report in cooperation with State water resource agencies and other Federal agencies involved in the Colorado River Basin Salinity Control Program (Salinity Control Program). This Progress Report is the latest in a series of biennial reports that commenced in 1963.
AUTHORIZATION FOR REPORT
The directive for preparing this report is contained in four separate public laws.
Public Law 84-485 states:
Section 15 –“The Secretary of the Interior is directed to continue studies and make a report to the Congress and to the States of the Colorado River Basin on the quality of water of the Colorado River,”
Section 5 – “All revenues collected in connection with the operation of the Colorado storage project and participating projects shall be credited to the Basin Fund, and shall be available, without further appropriation, for (1) defraying the costs of operation. The ongoing water quality monitoring, studies, and report are considered part of the normal operation of the project and are funded by the Basin Fund.”
Public Law 87-483 states:
“The Secretary of the Interior is directed to continue his studies of the quality of water of the Colorado River System, to appraise its suitability for municipal, domestic, and industrial use and for irrigation in the various areas in the United States in which it is used or proposed to be used, to estimate the effect of additional developments involving its storage and use (whether heretofore authorized or contemplated for authorization) on the remaining water available for use in the United States, to study all possible means of improving the quality of such water and of alleviating the ill effects of water of poor quality, and to report the results of his studies and estimates to the 87th Congress and every 2 years thereafter.”
Public Law 87-590 stipulates that January 3 would be the submission date for the report.
Public Law 93-320 states:
“Commencing on January 1, 1975, and every 2 years thereafter, the Secretary shall submit, simultaneously, to the President, the Congress, and the Advisory Council created in Section 204(a) of this title, a report on the Colorado River Basin Salinity Control Program authorized by this title covering the progress of investigations, planning, and construction of salinity control units for the previous 2 fiscal years; the effectiveness of such units; anticipated work needed to be accomplished in the future to meet the objectives of this title, with emphasis on the needs during the 5 years immediately following the date of each report; and any special problems that may be impeding progress in attaining an effective salinity control program. Said report may

4
be included in the biennial report on the quality of water of the Colorado River Basin prepared by the Secretary pursuant to section 15 of the Colorado River Storage Project Act (70 Stat. 111; 43 U.S.C. 602n), section 15 of the Navajo Indian Irrigation Project (NIIP), the initial stage of the San Juan-Chama Project Act (76 Stat. 102), and section 6 of the Fryingpan-Arkansas Project Act (76 Stat. 393).”
LEGAL ASPECTS
Water Quantity
Colorado River water use was apportioned by the Colorado River Compact of 1922, the Boulder Canyon Project Act of 1928, the Water Treaty of 1944, the Upper Colorado River Basin Compact of 1948, and the United States Supreme Court (Arizona v. California et al., 1964).
The Colorado River Compact divided the Colorado River Basin between the Upper and Lower Basins at Lee Ferry (just below the confluence of the Paria River), apportioning to each use of 7.5 million acre-feet (maf) annually. In addition to this apportionment, the Lower Colorado River Basin was given the right to increase its beneficial consumptive use by 1 maf per year. The compact also contains provisions governing exportation and obligations to Indian Tribes. The Water Treaty of 1944 obligates the United States to deliver to Mexico 1.5 maf of Colorado River water annually.
Upper Colorado Use - The Upper Colorado River Basin Compact of 1948 divided and apportioned the water apportioned to the Upper Colorado River Basin by the Colorado River Compact, allocating to Arizona 50,000 acre-feet annually, with the remaining water allocated to Upper Colorado River Basin States as follows:
• Colorado 51.75 percent • New Mexico 11.25 percent • Utah 23 percent • Wyoming 14 percent
Lower Colorado Use - States of the Lower Colorado River Basin, however, did not agree to a compact for the apportionment of waters in the Lower Colorado River Basin; accordingly, a Supreme Court decree (Arizona v. California et al.) in 1964 allocated water from the mainstem of the Colorado River below Lee Ferry among California, Nevada, and Arizona, and the Gila River between Arizona and New Mexico.
From the mainstem of the Lower Colorado River:
• Nevada was apportioned 300,000 acre-feet annually plus 4 percent of the surplus water available,
• Arizona was apportioned 2,800,000 acre-feet annually plus 46 percent of the surplus water available,

5
• California was apportioned 4,400,000 acre-feet annually plus 50 percent of the surplus water available.
The decree also permitted the Secretary of the Interior (Secretary) to make water unused in one State available for use in another State and allowed Federal water projects and the development of Indian tribal lands to proceed.
It should be noted that nothing in this report is intended to interpret the provisions of the Colorado River Compact (45 Stat. 1057), the Upper Colorado River Basin Compact (63 Stat. 31), the Water Treaty of 1944 with the United Mexican States (Treaty Series 994; 59 Stat. 1219), the decree entered by the Supreme Court of the United States in Arizona v. California et al. (376 U.S.C. 340), the Boulder Canyon Project Act (45 Stat. 1057), the Boulder Canyon Project Adjustment Act (54 Stat. 774; 43 U.S.C. 618a), the Colorado River Storage Project Act (70 Stat. 105; 43 U.S.C. 620), or the Colorado River Basin Project Act (82 Stat. 885; 43 U.S.C. 1501).
Water Quality
Although a number of water-quality-related legislative actions have been taken on the State and Federal levels, several Federal acts are of special significance to the Colorado River Basin: the Water Quality Act of 1965 and related amendments, the Federal Water Pollution Control Act Amendments of 1972 (Public Law 92-500), the Colorado River Basin Salinity Control Act (Salinity Control Act) of 1974 as amended, and the Clean Water Act of 1977 as amended. Also, central to water quality issues are agreements with Mexico on Colorado River System waters entering that country.
The Water Quality Act of 1965 (Public Law 89-234) amended the Federal Water Pollution Control Act and established a Federal Water Pollution Control Administration (now Environmental Protection Agency [EPA]). Among other provisions, it required States to adopt water quality criteria for interstate waters inside their boundaries. The seven Basin States initially developed water quality standards that did not include numeric salinity criteria for the Colorado River primarily because of technical constraints. In 1972, the Basin States agreed to a policy that called for the maintenance of salinity concentrations in the Lower Colorado River System at or below existing levels, while the Upper Colorado River Basin States continued to develop their compact-apportioned waters. The Basin States suggested that Reclamation should have primary responsibility for investigating, planning, and implementing the proposed Salinity Control Program.
The enactment of the Federal Water Pollution Control Act Amendments of 1972 affected salinity control, in that it was interpreted by EPA to require numerical standards for salinity in the Colorado River. In response, the Basin States founded the Colorado River Basin Salinity Control Forum (Forum) to develop water quality standards, including numeric salinity criteria and a basinwide plan of implementation for salinity control. The Basin States held public meetings on the proposed standards as required by the enacting legislation. The Forum recommended that the individual Basin States adopt the report, Water Quality Standards for Salinity, Including Numeric Criteria and Plan of Implementation for Salinity Control, Colorado River System. The proposed water quality standards called for maintenance of flow-weighted average total dissolved solids concentrations of 723 milligrams per liter

6
(mg/L) below Hoover Dam, 747 mg/L below Parker Dam, and 879 mg/L at Imperial Dam. Included in the plan of implementation were four salinity control units and possibly additional units, the application of effluent limitations, industrial use of saline water, and future studies. The standards are to be reviewed at 3-year intervals. All of the Basin States adopted the 1975 Forum-recommended standards. EPA approved the standards.
The Salinity Control Act of 1974 (Public Law 93-320) provided the means to comply with the United States’ obligations to Mexico under Minute No. 242 of the International Boundary and Water Commission, United States and Mexico, which included, as a major feature, a desalting plant and brine discharge canal. These facilities enable the United States to deliver water to Mexico having an average salinity no greater than 115 parts per million (ppm) plus or minus 30 ppm (United States’ count) over the annual average salinity of the Colorado River at Imperial Dam. The act also authorized construction of 4 salinity control units and the expedited planning of 12 other salinity control projects above Imperial Dam as part of the basinwide salinity control plan.
In 1978, the Forum reviewed the salinity standards and recommended continuing construction of units identified in the 1974 act, placing of effluent limitations on industrial and municipal discharges, and reduction of the salt-loading effects of irrigation return flows. The review also called for the inclusion of water quality management plans to comply with section 208 provisions of the Clean Water Act. It also contemplated the use of saline water for industrial purposes and future salinity control.
Public Law 98-569, signed October 30, 1984, amends Public Law 93-320. The amendments to the Salinity Control Act authorized the U.S. Department of Agriculture (USDA) Colorado River Salinity Control Program. The amendments also authorized two new units for construction under the Reclamation program.
In 1993, the Inspector General concluded that the lengthy congressional authorization process for Reclamation projects was impeding the implementation of cost-effective measures. Consequently, a public review of the program was conducted in 1994. In 1995, Public Law 104-20 authorized Reclamation to implement a basinwide approach to salinity control and to manage its implementation. Reclamation completed solicitations in 1996, 1997, 1998,,and 2001, in which Reclamation requests proposals, ranks the proposals based on their cost and performance risk factors, and awards funds to the most highly ranked projects. The awards from the first three solicitations consumed the available appropriation ceiling of $75 million authorized by Congress to test the new program.
In 2000, Public Law 106-459 amended the Colorado River Basin Salinity Control Act to increase the appropriation ceiling for Reclamation’s basinwide approach by $100 million ($175 million total). This appropriation authority will allow Reclamation to continue to request new proposals under its Basinwide Salinity Control Program.
In 1996, Public Law 104-127 significantly changed the authorities provided to USDA. Rather than carry out a separate salinity control program, the Secretary of Agriculture was directed to carry out salinity control measures in the Colorado River Basin as part of the Environmental Quality Incentives Program established under the Food Security Act of 1985. Public Law 104-127 also authorized the Secretary to cost share salinity control activities from the basin funds in lieu of repayment. Cost sharing has been implemented for both

7
USDA and Reclamation programs. Under this new authority, each dollar appropriated by the Congress is matched by $0.43 in cost sharing.
In 2002, Public Law 107-171d reauthorized the USDA’s Environmental Quality Incentives Program (under which the Secretary of Agriculture carries out salinity control measures).
8
Chapter 2 Chapter 2 Chapter 2 Chapter 2 ---- DESCRIPTION OF BASIN DESCRIPTION OF BASIN DESCRIPTION OF BASIN DESCRIPTION OF BASIN
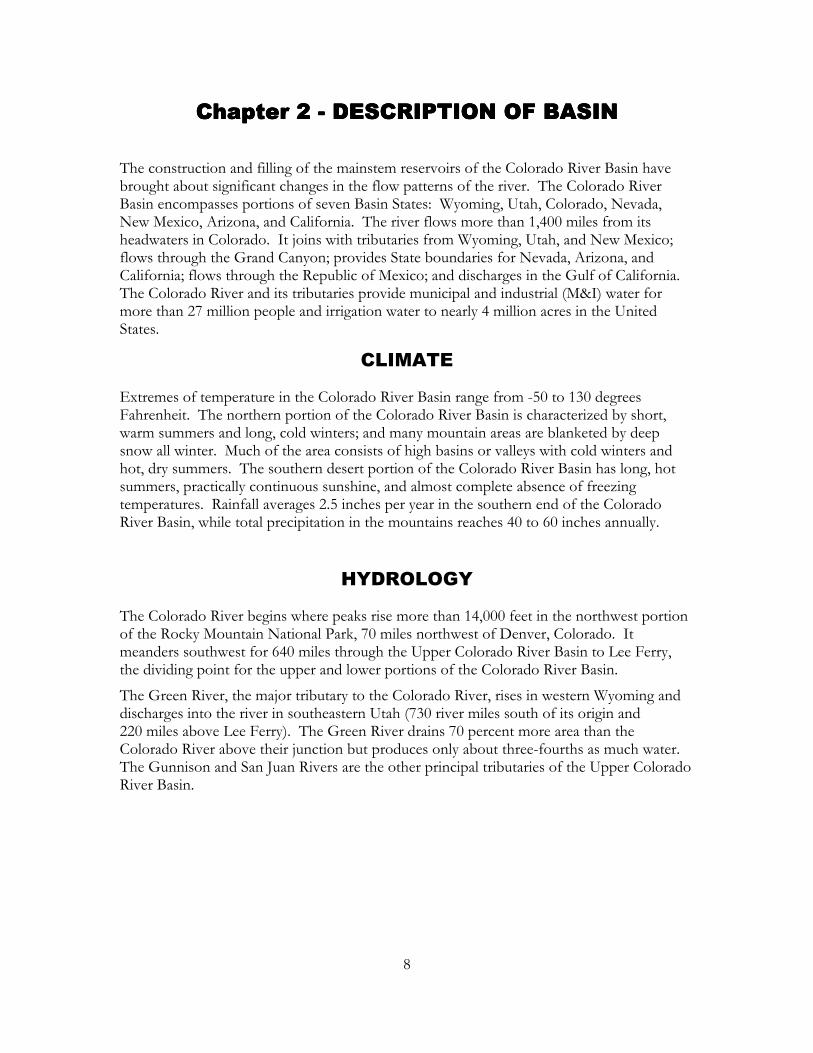
The construction and filling of the mainstem reservoirs of the Colorado River Basin have brought about significant changes in the flow patterns of the river. The Colorado River Basin encompasses portions of seven Basin States: Wyoming, Utah, Colorado, Nevada, New Mexico, Arizona, and California. The river flows more than 1,400 miles from its headwaters in Colorado. It joins with tributaries from Wyoming, Utah, and New Mexico; flows through the Grand Canyon; provides State boundaries for Nevada, Arizona, and California; flows through the Republic of Mexico; and discharges in the Gulf of California. The Colorado River and its tributaries provide municipal and industrial (M&I) water for more than 27 million people and irrigation water to nearly 4 million acres in the United States.
CLIMATE
Extremes of temperature in the Colorado River Basin range from -50 to 130 degrees Fahrenheit. The northern portion of the Colorado River Basin is characterized by short, warm summers and long, cold winters; and many mountain areas are blanketed by deep snow all winter. Much of the area consists of high basins or valleys with cold winters and hot, dry summers. The southern desert portion of the Colorado River Basin has long, hot summers, practically continuous sunshine, and almost complete absence of freezing temperatures. Rainfall averages 2.5 inches per year in the southern end of the Colorado River Basin, while total precipitation in the mountains reaches 40 to 60 inches annually.
HYDROLOGY
The Colorado River begins where peaks rise more than 14,000 feet in the northwest portion of the Rocky Mountain National Park, 70 miles northwest of Denver, Colorado. It meanders southwest for 640 miles through the Upper Colorado River Basin to Lee Ferry, the dividing point for the upper and lower portions of the Colorado River Basin.
The Green River, the major tributary to the Colorado River, rises in western Wyoming and discharges into the river in southeastern Utah (730 river miles south of its origin and 220 miles above Lee Ferry). The Green River drains 70 percent more area than the Colorado River above their junction but produces only about three-fourths as much water. The Gunnison and San Juan Rivers are the other principal tributaries of the Upper Colorado River Basin.
9
Figure 1 – Map of the Colorado River Basin.

10
The Colorado River Basin has a total area of approximately 244,000 square miles, carrying an average annual natural flow of about 15 million acre-feet (maf) at Lee Ferry. Of this flow, more than 5 maf per year are exported to the Arkansas and Missouri River basins, the Rio Grande basin, the Great Basin, and southern California. The Colorado River Basin is relatively arid. Compared to others, such as the Columbia River Basin that drains approximately the same area, it carries a much smaller flow. Table 1 shows that while the Colorado River Basin is one of the major drainage basins in the continental United States, its runoff is about equal to that of the Delaware River, which drains a much smaller area.
Table 1 - Comparison of River Basin Drainage and Runoff
River Basin
Area (square miles)
Runoff (million acre-feet per year)
Runoff (inches per year)
Colorado 244,000 15 1.2 Mississippi 1,234,000 440 6.7 Columbia 258,000 180 13.1 Delaware 12,000 14 20.9
The historic flows at various points in the Colorado River Basin are shown in appendix A. The records of flow depict wide fluctuations from month to month and considerable variations from year to year.
RESERVOIR STORAGE
Wet and dry cycles have played a significant role in bringing about the development of the Colorado River reservoir complex. Historic records show that the annual flow of the river has varied from less than 6 maf to more than 20 maf per year. The reservoir system allows sufficient storage (60 maf) to maintain the flows of the river to meet downstream needs during periods of low runoff.
In addition to the major reservoirs, numerous smaller reservoirs have been built on many of the tributaries. Major storage began with the filling of Lake Mead in the late 1930’s and concluded with the filling of Lake Powell in the early 1980’s. The Colorado River Basin
Figure 2 - Colorado River System Storage.
Colorado River System Storage
0
10
20
30
40
50
60
70
1960 1965 1970 1975 1980 1985 1990 1995 2000 2005
Sto
rage
MA
F

11
reservoirs now have a combined storage capacity equal to approximately four times the total average annual natural (undepleted and unregulated) flow of the Colorado River.
The flow of the San Juan River is controlled by Navajo Dam; the Green River by Fontenelle and Flaming Gorge Dams; and the Gunnison River by the Wayne N. Aspinall Unit Dams. Glen Canyon Dam is the only major dam on the mainstem of the Colorado River above Lee Ferry, but it regulates almost all the flow leaving the Upper Colorado River Basin.
Lake Mead, formed by Hoover Dam, supplies most of the storage and regulation in the Lower Colorado River Basin. Lake Mead provides water for irrigation, M&I uses, power generation, flood control, recreation, and many other beneficial uses.
Lake Mohave, the reservoir formed by Davis Dam, backs water upstream at high stages about 67 miles to the tailrace of Hoover Powerplant. Storage in Lake Mohave is used for some reregulation of releases from Hoover Dam, for meeting treaty requirements with Mexico, and for the production of electrical energy at Davis Powerplant. The river flows through a natural channel for about 10 miles below Davis Dam at which point the river enters the broad Mohave Valley 33 miles above the upper end of Lake Havasu.
Lake Havasu backs up behind Parker Dam for about 45 miles and serves as a forebay from which the Metropolitan Water District of Southern California pumps water into the Colorado River Aqueduct. Lake Havasu also serves as a forebay for the Central Arizona Project Havasu Pumping Plant, which pumps water into the Hayden Rhodes Aqueduct. Alamo Dam and Reservoir, on the Bill Williams River, is used to control floods originating above and below Alamo Dam.
Headgate Rock Dam, Palo Verde Diversion Dam, and Imperial Dam all serve as diversion structures with very little storage. Imperial Dam, located about 150 miles downstream from Parker Dam, is the major diversion structure for irrigation projects in the Imperial, Coachella, and Yuma areas. Water is diverted on the west bank to the All American Canal, which delivers water to the Yuma Project in Arizona and California and the Imperial and Coachella valleys in California. Water is diverted on the east bank to the Gila Gravity Main Canal.
Senator Wash Dam, an offstream storage facility, also affords regulation in the vicinity of Imperial Dam and assists in the delivery of water to Mexico. This facility is used for pumpback storage and recreation.
Morelos Dam, located just below the Northerly International Boundary with Mexico, is the last dam on the Colorado River. This small diversion dam diverts water into the Alamo Canal, which delivers water to northern Mexico.
GEOLOGY AND SOILS
The geology of the Colorado River Basin is highly varied. Igneous, metamorphic, and sedimentary rock types are present and range in age from more than 500 million years old to recent alluvial deposits. Structural features, including anticlines, domes, and faults, contribute to both the topographic relief and the geohydrology of the region.

12
Several of the sedimentary formations in the Colorado River Basin were deposited in marine or brackish water environments. Bedded and disseminated sodium chloride (halite) and calcium sulfate (gypsum) occur, as do clays with high contents of exchangeable sodium and magnesium.
The soils of the Colorado River Basin closely resemble the geologic formations from which they were derived. Residual soils derived from shales or sandstones are generally shallow. These soils can contain appreciable soluble mineral content due to residual and secondary mineral formation from the parent material. Upon weathering or irrigation, salts may accumulate on or near the surface due to evaporation or consumptive use by plants.
13
Chapter 3 Chapter 3 Chapter 3 Chapter 3 ---- CAUSES AND IMPACTS OF SALINITY CAUSES AND IMPACTS OF SALINITY CAUSES AND IMPACTS OF SALINITY CAUSES AND IMPACTS OF SALINITY CAUSES OF SALINITY
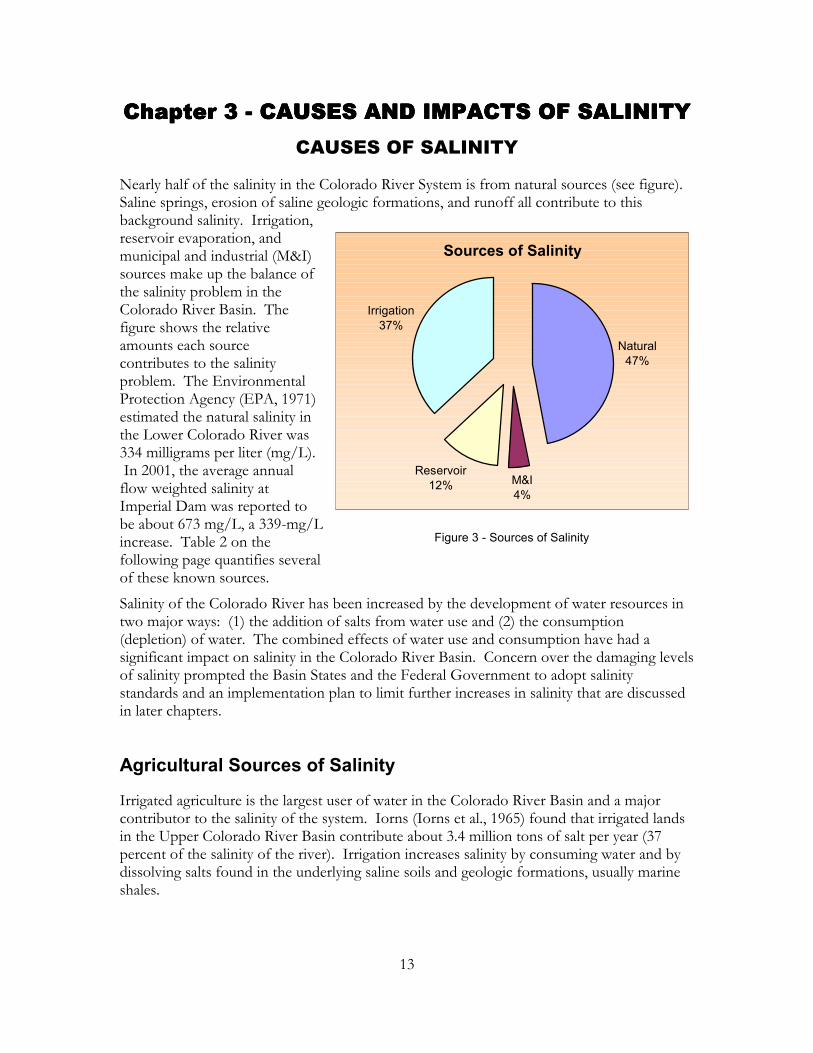
Nearly half of the salinity in the Colorado River System is from natural sources (see figure). Saline springs, erosion of saline geologic formations, and runoff all contribute to this background salinity. Irrigation, reservoir evaporation, and municipal and industrial (M&I) sources make up the balance of the salinity problem in the Colorado River Basin. The figure shows the relative amounts each source contributes to the salinity problem. The Environmental Protection Agency (EPA, 1971) estimated the natural salinity in the Lower Colorado River was 334 milligrams per liter (mg/L). In 2001, the average annual flow weighted salinity at Imperial Dam was reported to be about 673 mg/L, a 339-mg/L increase. Table 2 on the following page quantifies several of these known sources.
Salinity of the Colorado River has been increased by the development of water resources in two major ways: (1) the addition of salts from water use and (2) the consumption (depletion) of water. The combined effects of water use and consumption have had a significant impact on salinity in the Colorado River Basin. Concern over the damaging levels of salinity prompted the Basin States and the Federal Government to adopt salinity standards and an implementation plan to limit further increases in salinity that are discussed in later chapters.
Agricultural Sources of Salinity
Irrigated agriculture is the largest user of water in the Colorado River Basin and a major contributor to the salinity of the system. Iorns (Iorns et al., 1965) found that irrigated lands in the Upper Colorado River Basin contribute about 3.4 million tons of salt per year (37 percent of the salinity of the river). Irrigation increases salinity by consuming water and by dissolving salts found in the underlying saline soils and geologic formations, usually marine shales.
Figure 3 - Sources of Salinity
Sources of Salinity
Natural47%
M&I4%
Reservoir12%
Irrigation37%

14
Deep percolation mobilizes the salts found naturally in the soils, especially if the lands are over irrigated. Through salinity control practices, these contributions to the river system can be reduced significantly, helping maximize the future beneficial uses of the river.
Table 2 - Quantified Sources of Salt Loading
Source
Type of Source
Salt Loading (tons per year)
Paradox Springs springs 205,000
Dotsero Springs springs 182,600 Glenwood Springs springs 335,000 Steamboat Springs springs 8,500 Pagosa Springs springs 7,300 Sinbad Valley springs 6,500 Meeker Dome springs 57,000 Other minor springs in the Upper Basin springs 19,608 Blue Springs springs 550,000 La Verkin Springs springs 109,000 Grand Valley irrigation 580,000 Big Sandy irrigation 164,000 Uncompahgre Project irrigation 360,000 McElmo Creek irrigation 119,000 Price-San Rafael irrigation 258,000 Uinta Basin mostly irrigation 450,000 Dirty Devil River Area non-point 150,000 Price-San Rafael Area non-point 172,000 Total 3,733,508
Irrigation development in the Upper Colorado River Basin took place gradually from the beginning of settlement in about 1860, but was hastened by the purchase of land from the Indians in 1873. About 800,000 acres were being irrigated by 1905. Between 1905 and 1920, the development of irrigated land increased at a rapid rate, and by 1920, nearly 1.4 million acres were being irrigated. The Upper Colorado Region Comprehensive Framework Study, June 1971, reported that more than 1.6 million acres were in irrigation in 1965. Since that time, development of new agricultural lands has leveled off because of physical, environmental, and economic limitations. The Bureau of Reclamation’s (Reclamation) Colorado River System Consumptive Uses and Losses Report 1986-1990 estimated that 1.6 million acres were irrigated in the Upper Colorado River Basin in 1990.
Irrigation development in the Lower Colorado River Basin began at about the same time as in the Upper Colorado River Basin, but was slow due to the difficulty of diverting water from the Colorado River with its widely fluctuating flows. Development of the Gila area began in 1875 and the Palo Verde area in 1879. Construction of the Boulder Canyon Project in the 1930’s, and other downstream projects, has provided for a continued expansion of the irrigated area. In 1970, an additional 21,800 acres were irrigated by private

15
pumping either directly from the Colorado River or from wells in the flood plain. In 1980, nearly 400,000 acres were being irrigated along the Colorado River mainstem; total irrigated lands for the entire Lower Colorado River Basin were about 1.5 million acres.
Natural Sources of Salinity
Flow and quality records reveal that along certain reaches of the Colorado River, large increases in salt loads occur that cannot be attributed to irrigation or other development-related activities. These increases are mainly due to natural diffuse sources and saline springs. Natural diffuse sources of salt occur gradually over long reaches of the river system. Salt pickup occurs over large surface areas from underlying soils, geologic formations, and stream channels and banks. Salt pickup is difficult to identify, measure, or control; yet, diffuse sources contribute the largest overall share of the salts to the Colorado River. The natural salt load for the Colorado River at Lees Ferry, Arizona, was estimated to be about 5.3 million tons per year (Iorns, et al., 1965 and Mueller, et al., 1988). Natural point sources are saline springs where the contribution of salt and water is easily identified, issuing from single or concentrated sources. The Glenwood-Dotsero Springs Unit area (which contributes 440,000 tons per year) and the Paradox Valley Unit area (which contributes 205,000 tons per year) are two examples of point sources.
Municipal and Industrial Sources of Salinity
Salts contributed to the Colorado River System by M&I sources are generally minor, totaling about 1 percent of the Colorado River Basin salt load (or 3 percent of the salinity). Iorns estimates that M&I users increased salinity by about 100 tons per 1,000 people in the Colorado River Basin (Iorns, et al., 1965). The population reported for 1990 for the Upper Colorado River Basin was about 609,000 people, contributing about 61,000 tons per year of salt loading. At the present rate of population growth, M&I sources would increase salinity by approximately 133,000 tons per year by the year 2010. However, most municipal wastewater is relatively low in salt concentration in comparison to natural, industrial, and agricultural sources, and is not generally cost effective to control. Complete elimination of such waste discharges would be expensive when compared to other salinity control methods.
Consumptive Use of Water Increases Salinity
Addition of salts to the river system is not the only cause of increased salinity in the Colorado River Basin. The consumption (depletion) of water reduces the dilution of saline inflows to the river system, increasing the concentration of salinity. Water use is evaluated as part of Reclamation’s responsibilities in managing the river system. The Colorado River System, Consumptive Uses and Losses Report summarizes water use in the Colorado River Basin (Reclamation, 1991).

16
Table 3 shows average uses for the Colorado River Basin (including tributaries to the Colorado River in the Lower Colorado River Basin). Work has been recently completed updating the report through 1990.
With the exception of the Central Arizona Project (CAP), the Lower Colorado River Basin has already developed most of its water supply. The CAP is the last major development to deplete water from the Lower Colorado River. Agricultural use is the single largest source of depletions to the Colorado River. Exports, reservoir evaporation, and M&I uses also account for lesser but significant depletions.
Table 3 – Average Annual Water Use 1981-90
Most of the exports from the Upper Colorado River Basin are made at higher elevations where the salinity concentrations are very low. This loss of high quality water results in the remaining flows downstream becoming more concentrated. Water exported from the Upper Colorado River Basin during the period 1941-72 averaged about 360,000 acre-feet per year
Figure 4 - Historic and Projected Upper Colorado River Uses.
Estimated Beneficial Consumptive Uses and Losses in 1,000 acre-feet/year (Includes Lower Basin Tributaries)
State Reservoir
Evap. Irrigated
Agriculture1
Municipal and
Industrial2
Fish and Wildlife
Recreation
Export Outside System3
Export Within System
Un-Measured
Return Flow
Total
Arizona 248.2 4081.2 642.0 29.2 250.0 3.0 -141.7 5111.9
California 0.0 522.6 3.2 0.0 4267.3 0.0 -58.3 4734.8
Colorado 79.8 1424.1 43.4 0.0 499.0 0.0 0.0 2046.3
Nevada 8.6 104.1 281.4 1.1 0.0 -3.0 -78.5 313.7
New Mexico 40.8 201.1 59.3 0.9 89.0 0.0 0.0 391.1
Utah 69.3 599.9 57.4 0.0 88.3 0.0 0.0 814.9
Wyoming 34.1 322.6 50.4 0.0 10.2 0.0 0.0 417.3
Other4 1623.4 0.0 0.0 0.0 4598.2 0.0 0.0 6221.6
Total 2104.1 7255.6 1137.1 31.2 9802.0 0.0 -278.5 20051.6 1Irrigated agriculture includes livestock water use and stock pond evaporation. 2Municipal and Industrial includes water used for thermal electric power generation and mineral resources. 3Exports outside the system represent water passing to Mexico. 4Reservoir evaporation in the other category represents mainstem reservoir evaporation in the Upper and Lower Colorado River Basins and mainstem channel losses for the Lower Colorado River Basin.
Historic and Projected Upper Colorado River Basin Uses
01234567
1900 1950 2000 2050 2100
Use
s (m
af/y
r)

17
(af/yr). Completion of such large projects as the Colorado-Big Thompson, Duchesne Tunnel, Roberts Tunnel, and more recent projects increased exports to about 702,000 af/yr in 1990.
Energy Exploration and Development
Many of the geologic formations of the Colorado River Basin were deposited in marine (saline) or brackish water environments. Sulfates and sodium chloride are prevalent salts in most of these formations. Many of the formations were deposited in drier periods and are capable of transmitting water, but these aquifers are frequently sandwiched between hundreds or even thousands of feet of impermeable shales (aquicludes). These aquifers are, therefore, static and often saline. Many static and saline aquifers are present in the Colorado River Basin. When a path of flow is provided by drilling or mining, these aquifers are mobilized, and brackish or saline waters flow back to the surface.
The development of energy resources, specifically coal, oil, gas, oil shale, and coal bed methane, in the Colorado River Basin may contribute significant quantities of salt to the Colorado River. Salinity of surface waters can be increased by either mineral dissolution or uptake in surface runoff, mobilization of brackish groundwater, or consumption of good quality water. The location of fossil fuels is associated with marine-derived formations. Any disturbance of these saline materials will increase the contact surfaces, allowing for the dissolution of previously unavailable soluble minerals.
Salinity increases associated with mining coal can be attributed to leaching of coal spoil materials, discharge of saline groundwater, and increased erosion resulting from surface-disturbing activities. Spoil materials have a greater permeability than undisturbed overburden, allowing most of the rain falling on the spoils to infiltrate instead of running off. The water percolates through the spoils, dissolving soluble minerals.
Studies conducted on mining spoils in northwestern Colorado indicate that the resulting salinity of spoil-derived waters ranges from approximately 3,000 mg/L to 3,900 mg/L (Parker, et al., 1983; McWhorter, et al., 1979; and U.S. Department of the Interior, 1985). The variability in concentration depends on water residence time and the chemical and physical properties of the spoil.
Saline water is also a byproduct of oil and gas production in the Colorado River Basin. It is not uncommon to produce several times the amount of saline waters as oil. Oil and gas operators in Colorado produced approximately 25 million barrels of saline water during December 1985. The salinity of production waters varies greatly from location to location and depends upon the producing formation. Common disposal techniques include evaporation, injection, and discharge to local drainages.
The future development of the oil shale resources in Colorado, Utah, and Wyoming has the potential to increase salt loading to the Colorado River. Salt increases can be attributed to the consumptive use of good quality water, mine dewatering, and, if surface retorting is used, the leaching of spoil materials similar to those of surface coal mining.

18
Reclamation and others are attempting to identify abandoned exploration wells that are leaking and develop plans to control the leaks. The Meeker Dome Salinity Control Unit identified and plugged several abandoned wells along the White River to prevent a salt dome (a geologic formation) from discharging
saline water into the river.
Coal Bed Methane Development - The increase of the price of natural gas has led to an increase in the interest of developing the methane gas, which is found with coal, in the plentiful coal formations of the Upper Colorado River Basin. This coal bed methane (CBM) development could result in an increase in the salt loading of the Colorado River if the water associated with this type of drilling is discharged on the
ground surface and allowed to get into waterways.
In Utah, coal bed methane wells are located in Emery, Carbon, Duchesne, and Uinta counties. The State allows up to 4 wells per section. Most (99%) of existing product wastewater from the CBM wells is reinjected and 1percent is impounded for evaporation. No surface discharges have presently been permitted. It is projected that even with greater development of CBM wells, the handling of the produced wastewater will not change.
In Colorado, all the product water from CBM development in the San Juan Basin in southwest Colorado is presently, and in the foreseeable future will be, reinjected. New CBM wells are permitted in the northwest part of the State and in Moffat and Rio Blanco Counties, where new CBM developments are being considered. The State averages for product wastewater in the western part of the State are 90 percent reinjected, 9.5 percent impounded, and 0.5 percent surface discharged. Any surface discharged water has to meet the water quality criteria of no more that 1 ton/day salt.
In Wyoming, new CBM well development is beginning in the Little Snake River drainage (Carbon County) with only a handful of wells permitted. This CBM development has the potential to spread into the whole southwest corner of the State (Sweetwater, Uinta, and Lincoln Counties) if the price of natural gas stays high. This part of the State could have over 10,000 new CBM wells if development takes off as it has in the Powder River Basin. Presently, the State will allow surface discharge of up to 1 ton/day per operator (not per well). CBM development in the southwest part of the State will most likely involve reinjection of most if not all of the waste water since the quality of the groundwater found in these coal beds is highly saline and of poor quality.
Erosion
Several researchers have shown that erosion of saline shales and dissolution of efflorescence (surface salts) increase salinity during thunderstorms (Riley, et al., 1982; Uintex Corp., 1982; and Ponce, 1975). Low elevation snowmelt on saline geologic formations may also
Figure 5. Photo of a Coal Bed Methane Well.

19
contribute significantly to salinity. Analyses of the Green River near the Green River, Utah station indicate that salinity remains unusually high during peak flows associated with snowmelt runoff events.
Reclamation studies on the McElmo Creek Salinity Control Unit found that approximately 32 percent of the total salt load could be related to runoff events. Other studies by Reclamation show that 21 percent of the Price River salt load and 14 percent of the San Rafael River salt load are related to natural runoff events.
Studies conducted on Mancos Shale in the Upper Colorado River Basin have demonstrated a positive relationship between sediment yield and salt production (Schumm, et al., 1986). Sediment yield increases as a result of either upland erosion or streambank and gully erosion. Upland erosion is attributed to rill and inter-rill flow. Salt and sediment yields depend upon storm period, landform type, and the soluble mineral content of the geologic formation.
Studies conducted in the Price River basin have demonstrated that the highest salt and sediment concentrations occur in the first streamflow event following a long period of no discharge (U.S. Department of the Interior, 1984). The accumulation of salts in the channel is attributed to efflorescence resulting from the drying of the channel. Salt yields occurring after the initial flushing of the channel are similar to those found in the surrounding watershed soils.
Sediment and the resulting salt yield depend highly upon landform type. Three major landform types (badlands, pediments, and alluvial valleys) are associated with the Mancos Shale terrain.
Badlands are the most erosionally unstable, with sediment yields as high as 15 tons per acre (U.S. Department of Agriculture, 1976). Rilling accounts for approximately 80 percent of the erosion (U.S. Department of the Interior, 1984). Because salt production is closely related to sediment yield and the badland soils have not been leached of their soluble minerals, they produce the greatest amount of salt of the landform types.
Pediments are gently inclined planate erosion surfaces carved in bedrock and generally veneered with fluvial gravels. The surface slopes of pediments are gentle, making them relatively stable. Pediments have deeper soils and higher infiltration rates than badlands; thus, they support a greater vegetation cover and are less erosive.
Alluvial valleys are formed by a change in gradient and the deposition of sediment. They are stable except along the channel, where headcutting and gullying occur. Most of the salts have been leached from the alluvial deposits; thus, erosion of their landform type yields less salt per unit volume of sediment than for the other two landform types. However, channels incised into alluvium incorporate both sediment and salt from sloughed channel banks and salts from efflorescence at the alluvium-bedrock contacts (Schumm, et al., 1986).
The soluble mineral content of saline formations is variable and can be significantly different within one stratigraphic unit. The determination of the soluble mineral content of surficial soils depends highly upon the sampling and analytical methods used. The effects of contact time and sediment-to-water ratios on rate and extent of dissolution are extremely important. Since much of the salt loading depends upon sediment load, contact time and sediment-to-water ratio must be considered. Laronne recommends a sediment-to-water ratio of 1 percent. This ratio allows for greater dissolution of salts and a better estimate of salinity contributed from erosion (Laronne, 1977).
20
EFFECTS OF WATER QUALITY ON WATER USERS
Economic
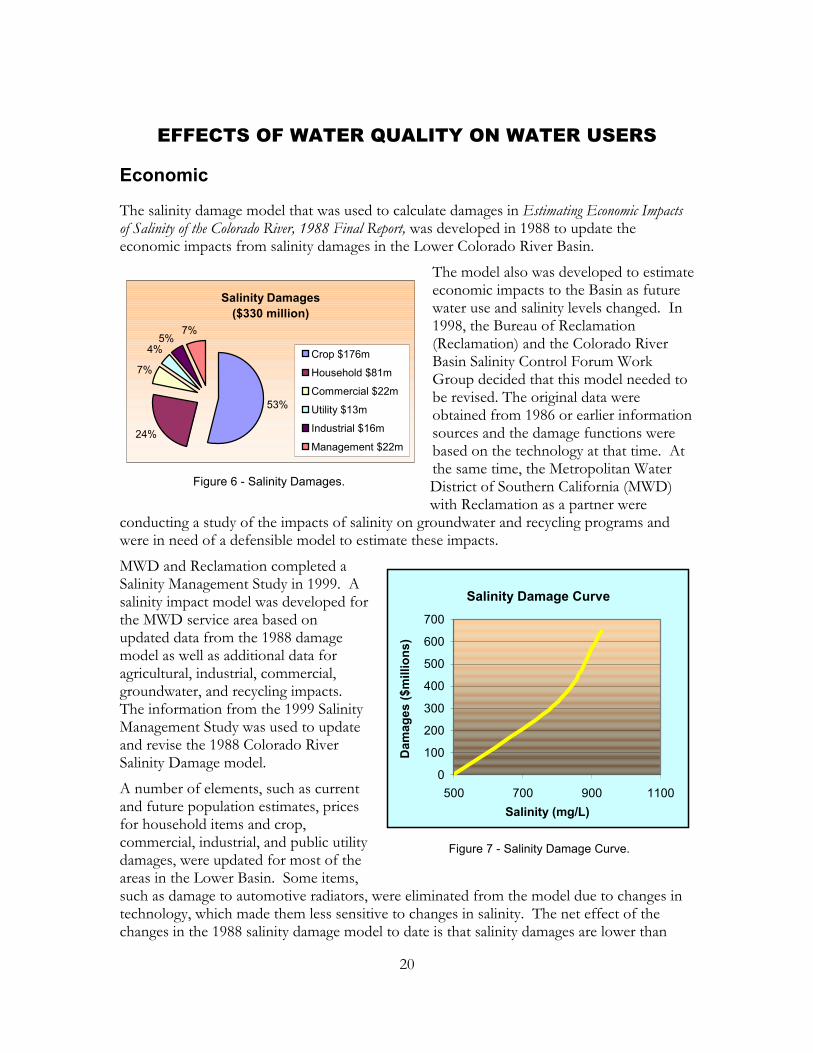
The salinity damage model that was used to calculate damages in Estimating Economic Impacts of Salinity of the Colorado River, 1988 Final Report, was developed in 1988 to update the economic impacts from salinity damages in the Lower Colorado River Basin.
The model also was developed to estimate economic impacts to the Basin as future water use and salinity levels changed. In 1998, the Bureau of Reclamation (Reclamation) and the Colorado River Basin Salinity Control Forum Work Group decided that this model needed to be revised. The original data were obtained from 1986 or earlier information sources and the damage functions were based on the technology at that time. At the same time, the Metropolitan Water District of Southern California (MWD) with Reclamation as a partner were
conducting a study of the impacts of salinity on groundwater and recycling programs and were in need of a defensible model to estimate these impacts.
MWD and Reclamation completed a Salinity Management Study in 1999. A salinity impact model was developed for the MWD service area based on updated data from the 1988 damage model as well as additional data for agricultural, industrial, commercial, groundwater, and recycling impacts. The information from the 1999 Salinity Management Study was used to update and revise the 1988 Colorado River Salinity Damage model.
A number of elements, such as current and future population estimates, prices for household items and crop, commercial, industrial, and public utility damages, were updated for most of the areas in the Lower Basin. Some items, such as damage to automotive radiators, were eliminated from the model due to changes in technology, which made them less sensitive to changes in salinity. The net effect of the changes in the 1988 salinity damage model to date is that salinity damages are lower than
Figure 6 - Salinity Damages.
Figure 7 - Salinity Damage Curve.
Salinity Damages($330 million)
53%
24%
7%
4%5%
7%
Crop $176m
Household $81m
Commercial $22m
Utility $13m
Industrial $16m
Management $22m
Salinity Damage Curve
0
100
200
300
400
500
600
700
500 700 900 1100Salinity (mg/L)
Dam
ages
($m
illio
ns)

21
previous estimates due to more blending of Colorado River water, more salt tolerant crops, improved radiator design in automobiles, and elimination of some items considered in the original model.
The revised model shows current economic damages in the Lower Basin States to be about $330 million per year. Using this estimate, salinity damages would be $122 per ton if uncontrolled. Or conversely, the present benefit of salinity control is $122 per ton, while the cost of salinity control is averaging about $30 per ton.
The impact assessment for the Nevada and Arizona areas will require more research. Currently, the data for Arizona has been collected and updated in the revised model. Work is planned to update and revise data on the urban areas of Clark County, Nevada. Additional research is planned to investigate potential increased costs due to salinity levels on commercial and industrial water use and in meeting water quality standards for recycled water and groundwater. Another research area that needs to be investigated is identifying the additional on-farm management costs that are related to salinity control.
Health
The EPA, Drinking Water Office, Health Impacts Laboratory sponsored a conference in 1984 on Inorganics in Drinking Water and Cardiovascular Disease. The conference was directed by Dr. Edward Calabrese, one of the original United States researchers in the realm of health impacts of sodium. It was the study by Drs. Calabrese and Tuthill concerning schoolchildren in two Massachusetts communities that sparked many similar studies around the world.
In the study by Drs. Calabrese and Tuthill, a difference of 2 to 5 millimeters mercury of blood pressure was found between third graders with a drinking water supply of about 10 mg/L sodium and others drinking water of about 102 mg/L sodium. Subsequent attempts by Drs. Calabrese and Tuthill to validate these results with other groups or by other methods (bottled water) have proven inconclusive. Studies reported from the Netherlands did support findings of slightly elevated blood pressure among schoolchildren consuming high sodium water, but most other studies were either inconclusive or showed that there was no effect.
Two areas of concern mentioned during the discussions were the use of zeolite water softeners on the kitchen coldwater faucet and cooking vegetables in high sodium water, as the vegetables can absorb large amounts of sodium during cooking. In most cases, avoiding these two actions would be more significant than any reduction in raw water concentration.
Other conference discussions on hard water versus soft water primarily concluded that soft water was not harmful, but hard water contains a beneficial property, possibly calcium, which reduced the ability of the body to absorb trace metals and; thus, lowered the overall exposure to such elements as cadmium and lead. Additionally, while water softeners help reduce pipe scaling and soap usage, several speakers stressed that a bypass should be placed on the kitchen cold water tap, the tap most used for drinking and cooking water, to maintain a certain level of hardness.

22
Other papers focused primarily on the health effects of cadmium, barium, and lead in drinking water. Studies seem to indicate that barium has no effect on cardiovascular disease below a level of about 10 mg/L, while cadmium and lead do have a definite adverse impact. None of these elements are present in any significant concentrations in the mainstem reaches of the Colorado River.
It appears from discussions at the conference that no adverse health impacts related to present sodium or hardness levels occur from drinking water from the Lower Colorado River Basin. Any health effect of a reduction in sodium and hardness expected from the Colorado River Basin Salinity Control Program (Salinity Control Program) would be negligible.

23
Chapter 4 Chapter 4 Chapter 4 Chapter 4 –––– TITLE I SALINITY CONTROL TITLE I SALINITY CONTROL TITLE I SALINITY CONTROL TITLE I SALINITY CONTROL PROGRAMPROGRAMPROGRAMPROGRAM
The Colorado River Basin Salinity Control Act (Salinity Control Act), Public Law 93-320, authorized the Secretary of the Interior (Secretary) to proceed with a program of works of improvement for the enhancement and protection of the quality of water available in the Colorado River for use in the United States and the Republic of Mexico. Title I enables the United States to comply with its obligation under the agreement with Mexico of August 30, 1973 (Minute No. 242 of the International Boundary and Water Commission, United States and Mexico [Minute No. 242]), which was concluded pursuant to the Treaty of February 3, 1944 (TS 994).
These facilities enable the United States to deliver water to Mexico with an average annual salinity concentration no greater than 115 parts per million (ppm) plus or minus 30 ppm (United States count) over the average annual salinity concentration of the Colorado River water at Imperial Dam.
Figure 8 - Map of Title I Projects.
Yuma Desalting Plant
Welton-Mohawk IDD
Protective Pumping
Coachella Canal Lining
NV UTCO
WY
AZ NMCA
Mexico

24
COACHELLA CANAL LINING
To assist in meeting the salinity control objectives of Title I, the Secretary was authorized to construct a concrete-lined parallel canal or to line the unlined initial 49 miles of the Coachella Canal in place. The act required that a contract be executed with the Coachella Valley Water District for partial repayment of the cost of the work over a 40-year period.
An estimated 141,000 acre-feet of Colorado River water were lost each year through seepage from this reach of the canal. It is estimated that the lined canal paralleling the old unlined canal reduced seepage losses to 9,000 acre-feet per year (af/yr), resulting in an annual savings of 132,000 acre- feet. The seepage losses saved are to be used during an interim period to substitute for the bypassed Wellton-Mohawk irrigation drainage waters and for the reject stream from the Yuma Desalting Plant. The interim period began when construction was completed in 1980 and ends the first year that the Secretary delivers less mainstream Colorado River water to California than requested by California agencies and Federal establishments with Colorado River water contracts in California.
PROTECTIVE AND REGULATORY PUMPING
Section 103(a) of Public Law 93-320 authorized the construction, operation, and maintenance of the Protective and Regulatory Pumping Unit (PRPU) by the Bureau of Reclamation (Reclamation) to manage and conserve United States groundwater for the benefit of the United States and for delivery to Mexico in partial satisfaction of the 1944 Treaty. The PRPU is located in a zone 5 miles wide paralleling the Southerly International Boundary between Arizona and Sonora, Mexico.
The PRPU was developed to intercept part of the groundwater underflow that moves southward from the Yuma Mesa in the United States into Mexico. Before the PRPU was constructed, this underflow was increasing because of groundwater pumping in the Sonora Mesa Well Field, immediately south of the Southerly International Boundary in Mexico and located near San Luis, Mexico. The Basin States expressed their concern about the pumping in their July 1973 letter to the President of the United States.
Currently, 21 of the 35 wells in the planned full complement of wells and associated conveyance and energy facilities have been constructed. The wells are connected by a 15.3-mile pipeline and open concrete-lined canal that carries water by gravity across to the Yuma Valley Main Drain where it crosses the Southerly International Boundary.
With 35 wells, the PRPU would be capable of producing about 125,000 acre-feet of water per year. Ultimately, 125,000 acre-feet of water from the PRPU, combined with 15,000 acre-feet of water from the East and West Main Canal Wasteways in the Yuma Valley, would furnish 140,000 acre-feet of Mexico’s 1.5-million-acre-foot annual entitlement. The water would be delivered at the Southerly International Boundary near San Luis, Arizona. In addition, 35,000 acre-feet could be withdrawn by private wells and/or Minute No. 242 wells for use on private land to equal the 160,000-acre-foot limit for pumping in the

25
5-mile zone. Currently, water from the East and West Main Canal Wasteways and the Yuma Valley Main Drain exceed 100,000 af/yr delivered to the Southerly International Boundary.
Should these wasteway and drain flows diminish in the future, wells would be added to the PRPU, as needed, to ensure that approximately 140,000 acre-feet can be delivered at the Southerly International Boundary at all times.
Additionally, as authorized by Title I, approximately 23,500 acres of private, State, and State-leased lands have been acquired within the 5-mile zone. The purpose of these acquisitions is to limit development and thus, limit United States groundwater pumping to 160,000 af/yr, as required by Minute No. 242. The acquisitions were completed in 1984.
Reclamation is in the final stages of developing a Resource Management Plan/Environmental Assessment (RMP/EA) for the 5-mile zone to provide direction for future management decisions according to currently recognized standards of proper land and water use. The RMP will help Reclamation achieve responsible stewardship of the lands and water within the study area. The EA will analyze the effects of implementing the alternatives considered in the RMP in compliance with the National Environmental Policy Act (NEPA). Reclamation expects to complete the RMP/EA by the end of Fiscal Year 2003.
YUMA DESALTING PLANT
The Yuma Desalting Plant (YDP) was built on a 60-acre tract of land 6 miles west of Yuma, Arizona. The purpose of the plant is to recover bypassed irrigation drainage water from the WMIDD so that it can be returned to the Colorado River and delivered to Mexico in partial satisfaction of the Mexican Water Treaty of 1944.
The operational design parameters set up for the plant determined that a reverse osmosis membrane desalting process was technically feasible and suitable for the YDP operation. The factors utilized in the plant design were projected volume and salinity of water to be delivered to Mexico at the Northerly International Boundary, the salinity differential required by Minute No. 242, the projected salinity of the Colorado River at Imperial Dam, the volume of WMIDD drainage water that was expected to be treated, the expected salinity of the WMIDD drainage water, a number of other factors related to the dilution of return flows below Imperial Dam, as well as plant operational factors.
A study completed in 1978 by the Advisory Committee on Improving Irrigation Efficiency in the WMIDD recommended onfarm irrigation improvement measures in the district.
Figure 9 – Aerial Photo of Yuma Desalting Plant.

26
These improvements were expected to reduce irrigation drain flow to about 108,000 af/yr. In addition, the Colorado River Basin Salinity Control Forum (Forum), representing the Basin States, established a numeric criterion at Imperial Dam of 879 milligrams per liter (mg/L). Using the desalting plant design criteria and a projected agricultural drainage flow of 108,000 af/yr from WMIDD at 3,200 ppm and a salinity level of about 840 ppm for flows arriving at Imperial Dam, it was determined that a desalting plant size of 73 million gallons per day would be required to treat the anticipated drainage flow from WMIDD.
The YDP was constructed to produce about 72.4 million gallons of desalinated (product) water per day when operated at full capacity. This would result in a delivery of about 68,500 acre-feet of product water per year. The product water would be blended with untreated drainage water to salvage an estimated 78,000 acre-feet each year for delivery to Mexico. The plant is currently being maintained in a ready reserve status because the requirements of Minute No. 242 are being met without its operation. (This is due to excess water available in the Colorado River System over the past several years, the construction of the bypass canal and dredging management in the Yuma area). While in ready reserve, the YDP could be placed in full operational status within 2-3 years, depending on the availability of funding.
Once operational, the YDP’s concentrate (brine) would be sent to the Cienega de Santa Clara in Mexico via a concrete-lined canal called the Bypass Drain. Because the YDP has been in a ready reserve condition for a number of years, the WMIDD agricultural drainage has been flowing into the Cienega. At issue are the effects of operation of the YDP on wetlands in the Cienega that have grown to cover an area of approximately 10,000 acres (450 acres of wetlands were present prior to construction of the Bypass Drain). The continued flow of the WMIDD agricultural drainage has caused the Cienega to become one of the most important habitats for waterfowl and marsh birds in Northern Mexico and is a remnant of a much larger wetland complex that disappeared because of total diversion of the Colorado River within the United States and at Mexico’s Morelos Dam during years of normal river operation. At present, this is the most stable and significant wetland area in the Colorado River delta. At least three federally listed endangered species, the Yuma Clapper Rail, Desert Pupfish, and Brown Pelican inhabit the Cienega. Some estimates suggest that at least 25 percent of the world’s population of Yuma Clapper Rail inhabit the marsh. Reclamation is in the process of gathering environmental information on the Cienega to provide baseline conditions to evaluate the effects of YDP operation and to develop measures to protect endangered species and wetland habitat. These baseline studies are a coordinated effort among Reclamation, Fish and Wildlife Service, Centro de Ecologica, Hermosillo, and Universidad Nacional Autonoma de Mexico, Mexico City.
Reclamation is also investigating low cost alternatives to operating the YDP. Once the interim period ends, a source of water will be needed to replace WMIDD drainage water that could have been used to partially meet treaty requirements to Mexico, if the YDP is not operated. Options currently being considered are banking Colorado River water (stored in underground aquifers) to help meet water deliveries to Mexico and fallowing agricultural land to conserve water. Banked water or water saved by fallowing could provide several years of water deliveries to offset drainage returns from WMIDD, thus delaying startup of the YDP. Use of banked water or water saved by fallowing will allow time to investigate operating the YDP to meet requirements of Minute 242 or to replace WMIDD pumped

27
drainage water. Another alternative to desalt Yuma Valley drainage water is also being investigated.
If alternatives to operating the YDP are not implemented, the plant may be brought back on-line as conditions demand, or when the interim period ends and the United States obligation to replace or desalt the drainage water from WMIDD begins.
WELLTON-MOHAWK IRRIGATION AND DRAINAGE DISTRICT
To prevent crop damage from high ground water levels, WMIDD has implemented irrigation drainage pumping of groundwater. This groundwater discharge has relatively high salinity concentrations and caused water quality problems in the river below Imperial Dam. The Title I Program, authorized by section 101(b) of the Salinity Control Act (Public Law 93-320), has reduced WMIDD irrigation drainage pumping by removing some lands requiring high water use from irrigation and by increasing irrigation efficiencies.
Acreage Reduction Program C Under this program, WMIDD irrigable lands were reduced from 75,000 to 65,000 acres. About 6,200 acres of land were purchased from 85 landowners. The remaining 3,800 acres were Federal lands from which irrigable status was withdrawn.
Approximately 4,600 of the irrigable acres purchased were in crop production. As a result of the land purchases, deep percolation was reduced by about 29,800 af/yr. This program was completed in 1978.
In addition, the Salt River Pima-Maricopa Indian Community Water Rights Settlement Act of 1988 removed 2,225 acres of land from irrigation as part of an agreement to reduce diversions in WMIDD to make water available to the Pima Maricopa Indian community near Phoenix, Arizona. Approximately 22,000 acre-feet was transferred to the Indian community, reducing drainage flow from the WMIDD by about 11,000 af/yr and reducing the WMIDD=s consumptive use entitlement for Colorado River water from 300,000 af/yr to 278,000 af/yr.
In 1993, the Gila River flood severely damaged about 3,000 acres of land near the river channel. The WMIDD purchased most of this land and, initially, wanted to transfer the water use from this agricultural land to municipal and industrial uses. However, WMIDD has since started development of 3,000 acres of additional farmland elsewhere in the district to bring them up to their allotted farmable acreage of about 62,775 acres.
Wellton-Mohawk Irrigation Efficiency Improvement Program C Several entities cooperated on this program, including WMIDD and its farmers, several Government agencies (Reclamation, Soil Conservation Service [SCS], U.S. Salinity Lab, and the Agricultural Research Service), and the University of Arizona Cooperative Extension Service. Individual measures are discussed in the following sections.
Onfarm Improvements Program C The objective of this program was to increase onfarm irrigation efficiencies by improving onfarm irrigation systems and management practices.

28
SCS provided design, installation, and management assistance for approximately 48,000 acres of land. Significant accomplishments included lining 263 miles of onfarm canals; leveling 44,415 acres of land; making soil improvements on more than 3,000 acres; and installing 10 drip irrigation systems and 10,600 onfarm water-control and measurement structures. The Federal Government contributed 75 percent of the costs; farm cooperators contributed the other 25 percent. The farm cooperators were under contract to maintain specific irrigation efficiency lands for 2 years after onfarm improvements were installed.
Irrigation Management Services Program C Reclamation provided technical assistance through the Irrigation Management Services (IMS) Program, which, in turn, provided onfarm, field-by-field irrigation scheduling assistance. From 1977 through 1986, irrigation scheduling information was furnished for about 49,000 acres of crops each year. However, the WMIDD completely dropped the irrigation-scheduling program in 1994 as fewer than 4,000 acres were still participating. WMIDD decided that with the few acres participating, the benefits no longer warranted the costs of continuing the program. Farmers participating in the Onfarm Improvements Program were required to participate in the IMS Program for two years following installation of onfarm improvements.
Reclamation provided technical expertise, training, and funding for the program. WMIDD provided one district employee and office facilities at the district. Reclamation funding for the IMS program ended in 1987.
Research and Demonstration Program C Six projects were funded under this program, which provided information on cultural practices, equipment, and economic considerations that could lead to improved irrigation efficiencies. Projects included monitoring soil salinity, studying emitter clogging in trickle irrigation systems, managing pressure irrigation systems for citrus crops, managing dead-level irrigation, automating surface irrigation, and evaluating alternative irrigation systems. All projects were completed by 1980.
Education and Information Program C The objectives of this program, conducted by the University of Arizona Cooperative Extension Service, were to (1) provide liaison among the various irrigation efficiency programs and (2) educate and encourage growers to adopt recommended irrigation efficiency improvement techniques and practices. Program information was provided through publications, television, and radio. With grower cooperation, field trials were held to demonstrate water management benefits, and field days were conducted on topics such as automated irrigation systems, irrigation scheduling and efficiency, and crop consumptive use. This program was discontinued in the late 1980’s.
Results C Before the irrigation efficiency program, WMIDD irrigation efficiency was 56 percent. While the program was active, overall WMIDD irrigation efficiencies exceeded 72 percent, the level estimated to reduce irrigation drainage to 108,000 af/yr. An overall peak irrigation efficiency of 77 percent was reached in 1985, and irrigation drainage dropped from 220,000 acre-feet to a low of 118,500 af/yr. While the program demonstrated an overall positive effect, a cause-and-effect relationship for individual measures has never been established.
Status C All permanent measures implemented by WMIDD are still in use, although the Federal program has been discontinued. Total crop acres have remained relatively stable since the early 1970’s because more acreage is double-cropped than when the program was initiated. In particular, more vegetable crops are being grown in the district than in the past.

29
More recent irrigation efficiency levels and return flow levels for 1990-99 are shown on this page.
Reclamation believes that the impacts of Gila River flows in 1992, 1993, and 1995 make irrigation efficiency and return flow data from the district questionable for 1992, 1993, 1994, 1995, and 1996. In 1993, the Gila River flood destroyed much of the WMIDD Main Conveyance Channel; so most of the drainage pumping went into the Gila River during 1993 and 1994 until these facilities could be repaired. Data from the district will not be valid until the impacts of the Gila River flood on groundwater levels are removed and the diversions at Imperial Dam and operations at WMIDD return to normal.
Table 4 - WMIDD Irrigation Efficiency
Year
Pumped Drainage
Return Flow (acre-feet)
Irrigation Efficiency
(percent) 1990 1991 1992 1993 1994 1995 1996 1997 1998 1999
138,200 144,900 116,200
8,970 49,820
121,500 119,600
91,695 98,972 94,869
69 69 70 69 65 64 60 61 62 na
Note: Irrigation Efficiency not adjusted for effective rainfall
Irrigation drainage pumping has varied since 1990 partly due to a change in the cropping (larger acreage in vegetable crops) and partly due to the impacts on the groundwater as a result of Gila River flows through the district. In 1997, WMIDD conducted a test to determine how much pumping of groundwater was needed to maintain existing groundwater levels. The district obtained a surplus water contract to allow them to conduct the test so they could stay within their consumptive use entitlement for calendar year 1997. The testing continued through use of surplus water contracts for calendar years 1998, 1999, and 2000. The district was able to pump only 91,695 acre-feet in 1997, 98,972 acre-feet in 1998, and 94,869 acre-feet in 1999. As a result, WMIDD was capable of pumping less than 100,000 acre-feet a year while maintaining static groundwater levels.
Reclamation continues to investigate means to reduce irrigation drainage pumping in the WMIDD. In 1998, WMIDD requested transfer of title to their facilities from the United States Government to WMIDD. As part of the title transfer agreement, the WMIDD has committed to diligently pursue a goal of permanently reducing irrigation drainage pumping to 108,000 acre-feet or less per year from the district. In their water conservation plan, WMIDD set a time frame of 5 years to accomplish this goal.
One of the options WMIDD is pursuing is to combine Gila Project water entitlements to allow the district to utilize part of the excess return flows from other districts in the Gila Project. Use of this excess return flow would allow the district to offset their need to mine

30
groundwater to meet their consumptive use requirements. This means WMIDD could pump less than 100,000 acre-feet per year and reduce the obligation of the United States to replace WMIDD pumped drainage once the interim period ends. A Yuma Area Water Resource Management Group (YAWRMG) has been developed to look at ways to more effectively manage groundwater resources in the Yuma Area. This includes procedures to reduce drainage return flows from WMIDD, which could benefit the United States by reducing the obligation to replace drainage returns from WMIDD. However, significant reductions in the bypass flow to the Cienega de Santa Clara may have impacts on that habitat.

31
Chapter 5 Chapter 5 Chapter 5 Chapter 5 ---- TITLE II SALINITY CONTROL TITLE II SALINITY CONTROL TITLE II SALINITY CONTROL TITLE II SALINITY CONTROL PROGRAMPROGRAMPROGRAMPROGRAM
Title II of the Salinity Control Act authorizes the Secretary of the Interior (Secretary) and the Secretary of Agriculture to implement a broad range of specific and general salinity control measures in an ongoing effort to prevent further degradation of water quality in the United States. These efforts are shown on the map below. The report is to include the effectiveness of the units, anticipated work to be accomplished to meet the objectives of Title II with emphasis on the needs during the 5 years immediately following the date of each report, and any special problems that may be impeding an effective salinity control program. Title II also provides that this report may be included in the biennial Quality of Water Colorado River Basin, Progress Report.
Figure 10 - Map of Title II Salinity Control Project Areas.
Big Sandy
Muddy Creek
Meeker Dome
Uinta Basin
Sagers Wash
Moapa Valley
Las Vegas Wash
San Juan River
Dolores/McElmo
Lower Gunnison
Grand Valley
Glenwood-Dotsero
Paradox Valley
Pariette Wash
NV UTCO
WY
AZ NMCA
Mexico
Price-San Rafael

32
U.S. BUREAU OF LAND MANAGEMENT
Public Law 98-569 directed the Secretary to develop a comprehensive program for minimizing salt contributions from lands administered by the Bureau of Land Management (BLM) and to provide a report on this program to the Congress and the Advisory Council. A report entitled Salinity Control on BLM-Administered Public Lands in the Colorado River Basin was completed for the Congress and the Advisory Council in 1987. The report discussed this ongoing program; outlined BLM’s implementation actions; and quantified, classified, and mapped the saline soils on lands administered by BLM. The BLM’s strategy is to provide the best management of the basic resource base. Successes with the resource base will translate to improved vegetation cover, better use of onsite precipitation, and stronger plant root systems. In turn, a more stable runoff regime and reduced soil loss should result; thus, benefiting water quality of the Colorado River.
The BLM administers 48 million acres in the Colorado River Basin above Imperial Dam, or 40 percent of the Colorado River Basin’s area. Of the 48 million, approximately 7.2 million acres, or about 15 percent, contain saline soils (slightly, moderate, and strongly saline soils). Soil salinity is usually greatest where surface geology reflects saline marine shales and annual precipitation averages less than 12 inches. In depositional settings, soil salinity may also be high, even where the underlying geology is relatively non-saline.
Salt enters the Colorado River and its tributaries from ground-water flows, surface runoff, and from point sources such as saline springs and flowing wells. Dissolution of evaporite deposits in the Upper Colorado River Basin results in highly saline ground water that ultimately contributes the largest amount of salt to the Colorado River System. The natural salt load for the Colorado River at Lees Ferry, Arizona, is estimated to be about 5.2 million tons per year. Contributions from BLM lands are included in this estimate. Surface runoff from BLM-administered lands above Lees Ferry is estimated to contribute about 700,000 tons per year, or about 14 percent. The remaining 4.5 million tons are contributed primarily by ground-water inflow and saline springs, and runoff from other Federal, Tribal, State, and private land.
Planning and Public Involvement C BLM has traditionally used its land-use planning process, the Resource Management Plan (RMP), as the primary vehicle for carrying forward the solutions to salt-loading problems. For example, since 1983, RMP’s have been implemented in BLM by means of various activity plans, which generally consist of smaller-scale resource projects and/or land-use adjustments with the potential of reducing runoff and erosion on saline soils. Beginning in FY2001, BLM initiated a significant multi-year effort at updating 162 land-use plans, some of which incorporate lands within the Colorado River Basin.
Over the past several years, BLM has been adopting a more holistic, systems-based framework for managing the public lands in recognition of budget considerations and also in recognition of some fundamental changes affecting the Western States. Some cornerstones to this more integrated approach are: interdisciplinary analysis of the best available scientific information; public involvement and coordination with all landowners; watershed rehabilitation; and, recognition of the natural interconnectedness between uplands, riparian areas, and ground water. The landscape-based approach to resource condition is accompanied by a de-emphasis of the traditional singular resource inventory (e.g., the soil

33
survey that emphasizes only a single resource). Focused interdisciplinary monitoring and assessment activities are favored over single-purpose efforts, and investing in resources at risk, such as rangeland at risk from accelerated soil loss.
Public involvement has been given emphasis recently by the Secretary and through the BLM Headquarters Office emphasizing communication, consultation and cooperation in support of conservation of our natural resources. It is BLM policy that any interested party with a high degree of interest in shaping objectives for the public lands, planning courses of action, and evaluating results should have an opportunity for involvement. The Congress has acknowledged this interest and makes provisions for it in the Federal Land Management and Policy Act, the National Environmental Policy Act, the Federal Advisory Council Act, and the Administrative Procedures Act. Public Law 106-459, approved November 7, 2000, requires the preparation of a report on the status of implementation of the comprehensive program for minimizing salt contributions to the Colorado River from lands administered by the BLM. The report, which is in the final stage of preparation, will be transmitted to the Committee on Energy and Natural Resources of the Senate and the Committee on Resources of the House of Representatives, following Department of the Interior approval.
BLM is in the process of establishing a Salinity Coordinator position to coordinate salinity-control activities in the 5 Basin states that receive funding for salinity control on public land. There will be a particular emphasis on determining better estimates of salt retained on BLM lands from projects in the Basin. The BLM Salinity Coordinator will work closely with BLM managers, BOR’s Salinity Program Manager, USDA/NRCS’ Salinity Coordinator, and the CRBSC Forum to create the best program possible to minimize salt loading within the Colorado River Basin.
Nonpoint Source Control C Controlling salinity in rangeland surface runoff is closely related to controlling soil erosion, which is an objective of the Soil, Water, and Air program. Vegetation cover is usually the most important management variable influencing runoff and erosion rates on rangelands. On systematically targeted watersheds, the payoff for salinity control is that decreased sediment yields and moderated flood flow energies should combine to transport less salt from the uplands, as well as from gullies and established channels.
Vegetation management, either indirectly through the design and implementation of livestock grazing plans or directly through vegetation manipulation, is an important erosion and salinity control technique. For example, BLM uses tebuthiuron to thin big sagebrush by inhibiting photosynthesis. Perennial grasses and forbs are then able to increase with the water in the soil that is no longer transpired by sage. Reduced runoff and erosion combine to achieve reductions in the amount of salt that moves off site.
Proper land use, including the objectives of grazing systems that incorporate increased cover, appropriate seasons of use, and riparian protection, is a preferred salinity control technique, as is minimizing activities that disturb the surface. However, on the most highly saline sites, maximum potential plant cover is usually inadequate to provide leverage for significant control of surface runoff, erosion, and associated salt mobilization. In those cases where watershed condition is so severely degraded that recovery will be ineffective under normal land management practices, mechanical land treatments and structural alternatives may be the only effective salinity control options. Land treatments involve soil tillage techniques such as contour furrowing, ripping, and rangeland pitting. Structural features include rangeland dikes, retention and gully plugs, and retention and detention reservoirs.

34
BLM manages riparian-wetland and aquatic zones to achieve healthy and productive conditions for long-term benefits and values and, in Utah and Colorado, salt controls have been created by establishing riparian pasture and off-channel livestock watering practices. Cottonwood and willow tree poles have been planted on several ephemeral drainages. The planting areas are protected until the poles are well established. Soil-vegetation ecological site surveys continue to be an important baseline information source to understand from where, and by what processes, salts are transported to surface or groundwater.
Point Source Control C Many point sources of saline water exist on the public lands as either wells or springs. Close cooperation with the State is required for plugging of orphaned wells, and good field-level coordination with the private entities operating in oil and gas fields has led to additional point source control accomplishments. BLM has developed a water source inventory to identify and characterize water uses and respective sources on the public lands. Saline springs are identified through the program. Control of saline springs is analyzed through BLM’s land-use planning process with major sources being brought to Reclamation’s attention.
Estimating Salinity Control C It is difficult to estimate the actual reduction in the salinity of the Colorado River that may be attributed to BLM management activities. There are many physical, chemical, and biological processes that affect the movement of salt from an upland project area to the Colorado River or a perennial tributary to the Colorado. As the distance between a project and the nearest perennial flow increases, it quickly becomes impossible to quantify the amount of salt that would reach the perennial flow and the amount of time required for the salt to arrive at the perennial flow. For these reasons, BLM prefers to estimate the amount of salt that is retained on the project site by management actions. It is assumed that the salt retained would have been moved off site by surface runoff if the project had not been implemented. Table 1 shows salt retained by BLM management in the Basin. Arizona had a substantial increase in salt retained beginning in 2001 due to repair of the Flat Top dam in the Arizona Strip District. Colorado also had a substantial increase in salt retained beginning in 2001 due to previously unreported project maintenance in western Colorado.
BLM=s salt retention target is 90,000 tons per year by 2015. Current projections indicate that BLM will substantially exceed this target value.
Table 5 – Salt Retained on BLM Lands (tons per year)
State Thru 1996 1997 1998 1999 2000 2001 2002
Arizona na 40 50 50 70 1360 1,400 Colorado na 670 810 840 1,350 4,140 4,140 Nevada na 10 30 60 70 70 70 New Mexico na 380 420 900 920 960 980 Utah na 1,370 1,650 1,830 1,910 2,090 2,140 Wyoming na 380 410 1,220 1,300 1,360 1,400 Totals 36,170 2,850 3,370 4,900 5,620 9,980 10,130
Cumulative Total 36,170 39,020 42,390 47,290 52,910 62,890 73,020
Note: Rounded to the nearest 10 tons.

35
U.S. DEPARTMENT OF AGRICULTURE
Public Law 98-569 provides a separate authority for implementation of U.S. Department of Agriculture (USDA) Colorado River Salinity Control projects. The initial funds for implementation were appropriated in 1987. Public Law 98-569 authorized the Secretary of Agriculture to (1) identify salt source areas and develop project plans for salinity control; (2) provide financial and technical assistance to land users to plan, install, and maintain salinity reduction practices, including voluntary replacement of incidental fish and wildlife values foregone; (3) conduct research, demonstration, and education activities; and (4) monitor and evaluate program effectiveness.
To date, USDA implementation plans have been prepared for the Uinta Basin, Uinta Basin Expansion, Grand Valley, Lower Gunnison Basin, McElmo Creek, Mancos Valley, Virgin Valley, and Big Sandy River salinity control projects. The USDA and Reclamation have prepared a joint salinity control plan for the Price-San Rafael Rivers area in Utah. Some preliminary investigations have been completed in the San Juan Basin of New Mexico.
Current USDA implementation efforts are concentrated in the Grand Valley, Uinta Basin, Lower Gunnison Basin, Big Sandy River, and McElmo Creek Projects (see table 5 on next page). The USDA implementation schedule was controlled by annual appropriations for the Colorado River Salinity Control Program. Funding was allocated to the Grand Valley and Uinta Projects in 1987 and each year thereafter. In 1988, the first Colorado River Salinity Control Program funds were allocated to the Lower Gunnison Basin and Big Sandy River Projects, and, in 1990, funds were allocated to the McElmo Creek Project. The implementation schedule for USDA projects is based upon projected salt-load reduction needs, cost-effectiveness analysis, the probability of Federal funding, and the Basin Fund repayment capability.
Table 6 - USDA Salinity Control Program Summary
Unit
Salt Removed Thru FY02 (tons/year)
Potential Salt
Removal (tons/year)
Expenditure Thru FY02
Projected1 Total Cost
Cost2 Effectiveness
Thru FY02 ($/ton)
McElmo Creek, CO 18,806 46,000 $10,769,000 $26,342,800 48
L. Gunnison, CO 62,465 186,000 $33,036,900 $98,372,900 44 Grand Valley, CO 87,070 132,000 $40,345,400 $61,164,500 38 Uinta Basin, UT 121,011 140,500 $54,709,800 $63,882,600 38 Big Sandy, WY 40,375 52,900 $12,378,200 $16,218,100 33 Price/San Rafael, UT 27,401 146,900 $5,304,400 $28,452,900 16
TOTALS 357,128 704,300 $156,544,700 $294,433,800 36 1Projected costs were estimated using expenditures and removal rates. 2Cost effectiveness computed using 6.625% planning interest rate over 25-year life.
Public Law 98-569 directs the Secretary of Agriculture to carry out a monitoring and evaluation program to evaluate the effectiveness of USDA’s Colorado River Salinity Control

36
Program. In 1987, the Technical Policy Coordinating Committee of SCS and Reclamation published the Monitoring and Evaluation of Salinity Control Projects Interim Guide for the Colorado River Basin Salinity Control Program. In August 1991, SCS published the Framework Plan for Monitoring and Evaluating the Colorado River Salinity Control Program. This publication provides detailed instructions for all monitoring and evaluation (M&E) activities carried out by USDA. The three general purposes of the M&E effort are to (1) collect salinity control data; (2) evaluate the effect of salinity reduction practices on salt reduction; and (3) verify costs, project effectiveness, economic benefits, and impacts on wildlife habitat.
Monitoring and evaluating USDA=s Colorado River Salinity Control Program is under way in the Uinta Basin, Grand Valley, Big Sandy River, McElmo Creek, and Lower Gunnison Basin Projects. Annual reports are being published.
Information and educational support activities are being provided through the Cooperative Extension Service in each of the active salinity project areas. Cooperative Extension Service specialists provide full-time information and education assistance for program implementation. This extension support plays a valuable and important role in project visibility, local understanding, and local acceptance.
Research is necessary to develop new salinity control technologies. The Agricultural Research Service (ARS), Cooperative Research Service, and the State Agricultural Experiment Stations conduct research funded from State and Federal sources.
Some of the salinity research activities being conducted by ARS at the U.S. Salinity Laboratory, Riverside, California, and at the Northern Plains Area Natural Resources Research Center, Fort Collins, Colorado, include:
• Soil salinity measuring, mapping, and monitoring instrumentation • Water quality models for salt-affected soils • Mapping salinity of irrigated areas • Crop water use from high, saline water tables • Salt movement under level basin irrigation • Salinity assessment by rainfall simulation of runoff from rangelands
U.S. BUREAU OF RECLAMATION
Program Summary
Background -- The Bureau of Reclamation involvement in the Colorado River Basin Salinity Control Program dates back to the early 1960’s when salinity levels in the river started to rise. In 1968, Reclamation initiated a cooperative reconnaissance study in the Upper Colorado Basin. Study objectives were to identify feasible control measures and estimate their costs. This investigation evolved into a number of several salinity control units. In 1974, Public Law 93-320 authorized the construction of the Grand Valley, Paradox, Crystal Geyser, Las Vegas Wash Units. In 1984, Public Law 98-569 authorized the construction of the Lower Gunnison and McElmo Creek Units.

37
By 1993, Reclamation had gained 20 years of experience with the program and identified new and innovative opportunities to control salinity, including cooperative efforts with USDA, BLM, and private interests, which would be very cost effective. However, these opportunities could not be implemented because the Congress did not specifically authorize them. The Inspector General’s audit report (1993) noted the Salinity Control Act directed that “the Secretary shall give preference to implementing practices which reduce salinity at the least cost per unit of salinity reduction.” The Inspector General concluded that the congressional authorization process for Reclamation projects impedes the implementation of cost-effective measures by restricting the program to specific, authorized units (specific areas).
The Inspector General recommended that Reclamation seek changes in the Salinity Control Act to simplify the process for obtaining congressional approval of new, cost-effective salinity control projects. Specifically, the Inspector General recommended Reclamation seek authorities similar to those provided to USDA in the 1984 amendments to the act, wherein USDA was empowered with programmatic planning and construction authority. At the time, USDA had only to submit a report to the Congress and wait 60 days before it could proceed if the Congress did not object. In contrast, Reclamation was required to seek approval of its projects through legislation. This had proved to be a cumbersome way to manage the program. With broader authorities, Reclamation would be able to take advantage of opportunities as they presented themselves, thus reducing costs.
Reclamation agreed with the Inspector General and wanted to explore any other innovative ideas, which would help improve the effectiveness of its program and take advantage of opportunities that were not envisioned 20 years ago. With most of the cost-effective portions of the authorized program nearing completion, this was a pivotal moment for the program. It would either be reauthorized or end in 1998 due to appropriation ceiling limits. From Reclamation=s point of view, it seemed a very appropriate time to reassess the direction of the program.
Public Review -- In 1994, Reclamation initiated a public review of the Salinity Control Program. The goal of the public review was to completely reexamine the program and its authorities, to gather a broad range of new ideas, to review the lessons of past experiences, to formulate new guidelines and methodologies, and to draft new salinity control legislation to bring this program into the next century.
The public review began on March 24, 1994, with a news release and individual notices mailed to more than 400 entities including congressional representatives; members of the Forum; local, State, and Federal agencies; environmental organizations; and other interested parties. The notices stated Reclamation’s purpose in conducting the review, provided background on the salinity problem in the Colorado River Basin, and the current program for addressing those problems. The notices then suggested several options regarding the Salinity Control Program.
Reclamation received responses from private individuals and local, State, and Federal agencies. The majority of the comments were from local and State agencies expressing support for Reclamation=s leadership role in the program, having found that the old program could be improved in several ways.

38
The public review of the program found that in the future, the program should: • Consider alternatives to Government planned projects • Allow non-Federal construction • Consider proposals to control salinity anywhere in the Colorado River Basin • Consider non-traditional methods • Be competitive (consider cost and performance risk in its ranking criteria) • Continue to be voluntary (rather than regulatory)
The comments supported implementing the Inspector General’s recommendation (to seek broader authorities for Reclamation). In 1994, Reclamation and the Basin States developed legislation to broaden Reclamation=s authorities so that it could completely manage the implementation of the program without further congressional approval. This legislation was introduced in the Congress late in 1994 and was approved and signed into law (Public Law 104-20) in 1995. The Congress will retain its fiscal oversight, but will leave the program=s management to Reclamation. The 1995 amendments to the Salinity Control Act authorized Reclamation to pursue salinity control throughout the Colorado River Basin and required Reclamation to develop guidelines on how it would implement this new, basinwide approach to the Program.
Guidelines -- Reclamation has prepared guidelines for its new Basinwide Salinity Control Program, which implements the recommendations made in the review of the program. As an alternative to adopting new, specific regulations, Reclamation administers the program through existing procurement techniques and established Federal regulations. Since February 1996, the program has been made available to the general public through this annual competitive process.
In 1984, Public Law 98-569 directed the Secretary to give preference to those projects which reduce salinity at the least cost per ton of salinity control. Since that time, cost effectiveness (cost per ton of salt removed) has been used to prioritize the implementation of salinity controls. However, cost effectiveness is only an estimate (prediction) of the project=s cost and effectiveness at controlling salinity. Depending upon the project, there can be a degree of uncertainty in either of these values. Given the diversity of proposals that Reclamation may receive, an evaluation of the proposal=s risks has been included in the current selection process.
All proposals (including those studied by Reclamation) will be first ranked on their cost per ton of salt removed. This ranking is then adjusted for risk factors that might affect the project’s performance. The performance risk evaluation considers both financial and effectiveness risks. For example, the Government is interested in limiting its risk of cost overruns. One way that performance risk could be reduced would be for the proponent to accept some risk through contractual limits on the Government=s payments. Another method of limiting the costs would be to have the work bonded through a private bonding agency. The other major area of performance risk is in the amount of salinity control realized versus projected. Some types of salinity control are inherently more predictable or consistent than others. For example, industrial processes might have very little salinity control performance risk if the payments were based on a measurable product. On the other hand, the effectiveness of water management is often highly variable from farmer to farmer. Automation would be one way a farmer might propose to reduce this type of risk.

39
Ultimately, there is a tradeoff between risk and cost. In the end, eliminating risk may cost more than accepting some risk. A ranking committee is assembled to evaluate the tradeoffs between cost effectiveness and performance risks. The ranking committee is made up of representatives from the two cost-sharing partners, the Basin States and Reclamation. After the committee ranks the proposals, Reclamation will attempt to negotiate the final terms of an agreement with the most highly ranked proponents. The first awards under this new process began in FY97.
Performance Review -- Past projects (Grand Valley, Paradox, Lower Gunnison, Dolores) have averaged slightly over $70 per ton. For a number of reasons, the new projects are much more cost effective, ranging between $20 and $35 per ton (see tables 7 and 8).
One of the greatest advantages of the new program comes from the integration of Reclamation=s program with USDA=s program. Water conservation within irrigation projects on saline soils is the single most effective salinity control measure found in the past 30 years of investigations. By integrating USDA=s onfarm irrigation improvements with Reclamation=s off-farm improvements, extremely high efficiencies can be obtained. If the landscape permits, pressure from piped delivery systems (laterals) may be used to drive sprinkler irrigation systems at efficiency rates far better than those normally obtained by flood systems. The new authorities allow Reclamation much greater flexibility (in both timing and funding) to work with USDA to develop these types of projects.
The new authorities also allow Reclamation to respond to opportunities that are time-sensitive. Cost-sharing partners (State and Federal agencies) often have funds available at very specific times. Under its old methods of planning, authorization, funding, and construction, it would often take decades for Reclamation to be ready to proceed with a project. None of Reclamation=s past projects were able to attract cost sharing because of this. For example, the Ashley Project (a joint effort by Utah, Reclamation, and the Environmental Protection Agency [EPA]) will eliminate 9,000 tons of salt per year. Reclamation=s Basinwide Salinity Control Program is a relatively minor, but important part of the project ($3 million in a $18 million project). Once Reclamation had committed to fund its part of the project, funds were included in EPA=s budget by the Congress to complete the partnership.
Another significant advantage of the program is that projects are “owned” by the proponent, not Reclamation. The proponent is responsible to perform on its proposal. Costs paid by Reclamation are controlled and limited by an agreement. Yet, unforeseen cost overruns can occur. The proponent has several options, the project may be terminated or the proponent may choose to cover the overruns with their own funds or borrow funds from State programs. The proponent may also choose to reformulate the project costs and recompete the project through the entire award process.
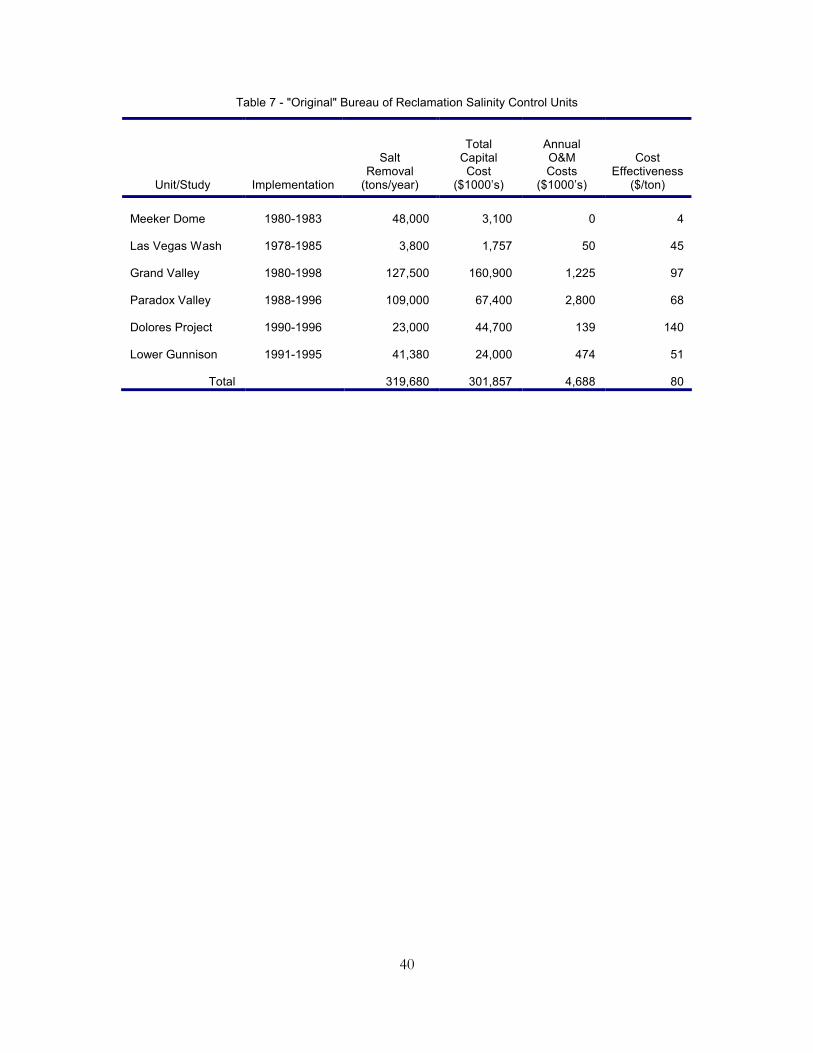
40
Table 7 - "Original" Bureau of Reclamation Salinity Control Units
Unit/Study
Implementation
Salt Removal
(tons/year)
Total
Capital Cost
($1000’s)
Annual O&M Costs
($1000’s)
Cost Effectiveness
($/ton)
Meeker Dome
1980-1983
48,000
3,100
0
4
Las Vegas Wash
1978-1985
3,800
1,757
50
45
Grand Valley
1980-1998
127,500
160,900
1,225
97
Paradox Valley
1988-1996
109,000
67,400
2,800
68
Dolores Project
1990-1996
23,000
44,700
139
140
Lower Gunnison
1991-1995
41,380
24,000
474
51
Total
319,680
301,857
4,688
80

41
Table 8 – “New” Bureau of Reclamation Basinwide Salinity Control Program
Basinwide
Projects Implementation
Total
Control
(tons/yr)
Estimated
USDA
Capital
Cost
Reclamation
Contract
Cost
(Awarded)
Cost
Per
Ton
Hammond 1996-2002 48,130 $0 $13,016,430 $21
Uncompahgre Demo 1998-2000 2,295 $0 $889,600 $31
Ashley 1999-2005 9,000 $0 $3,269,000 $29
Tropic & East Fork/FN Na 3,100 $1,060,000 $27
PRICE-SAN RAFAEL UNIT Allen Lateral 2000 8,125 $894,600 $2,412,096 $32
North Carbon 2000-2001 7,684 $630,000 $3,499,908 $43
Cottonwood 1998-2002 8,506 $0 $2,100,000 $20
Ferron 1998-2004 47,407 $5,939,213 $10,802,744 $28
Seeley-Collard 2000-2001 905 $102,900 $179,751 $25
Moore Group 2000 17,587 $1,936,200 $4,733,160 $30
Wellington 1999-2000 17,688 $0 $4,810,000 $22
Lawrence South/H 2002 5,217 $438,060 $1,440,792 $29
UINTA BASIN UNIT Burns Bench 2000-2001 21,468 $1,876,000 $4,905,514 $25
BIA - Ute Tribe 2001-2005 53,344 $0 $19,788,373 $29
Duchesne County 2001 20,417 $0 $9,127,221 $35
Farnsworth 2000-2003 9,557 $0 $3,250,000 $27
L. Brush Cr. (Sunshine) 2000 2,763 $259,000 $858,280 $32
Western Uintah 2000-2004 25,710 $2,373,700 $6,875,082 $28
South Lateral 2002-2003 1,250 $300,977 $19
River Canal/H 2002-2003 4,060 $1,241,171 $24
Union Canal/H 2003 5,255 $1,607,675 $24
Hicken/H 2002-2003 3,578 $1,105,905 $24
Dry Gulch E/H 2002-2004 12,973 $4,059,181 $25
Dry Gulch C/H 2002-2003 15,324 $5,136,539 $27
Ouray Park Irr Co/H 2002-2004 10,131 $3,684,640 $29
Duchesne WCD 2003-2005 42,800 $15,763,336 $29
Total 404,275 $14,449,673 $125,917,376 $27
Note: Cost effectiveness computed using 25-year life and 6.125 percent interest
For example, pipeline bedding and materials costs for the Ferron Project were underestimated in the proposal and subsequent construction cooperative agreement. The

42
proponent was denied permission to award materials contracts for the pipeline, since the costs were beyond those contained in the agreement. After months of negotiations and analysis, the proponents elected to terminate the project, reformulate it, and recompete against other proposals the following year. Their project was found to be competitive at the reformulated cost and was allowed to proceed. Since this project ran into difficulties, none of the other projects have shown any problems.
In 1998, Reclamation received a record number of proposals. Many are well within the competitive range awarded in 1997. This last round of proposals included a proposal to improve the efficiency of Reclamation=s deep well injection project (Paradox Valley Unit), an extension of a project awarded in 1997, one reformulated project awarded in 1997, an industrial use proposal, a cost-shared selenium control demonstration project, and several irrigation improvement projects. No new projects were awarded in 1999/2000 due to appropriation ceiling limits in P.L. 104-20. With the additional $100 million provided by recent legislation, P.L. 106-459, Reclamation reopened its request for proposal process in 2001 to select additional projects.
Big Sandy River Unit
Reclamation --The Big Sandy River Unit is located near Farson and Eden in Sweetwater County in southwestern Wyoming. The purpose of the Big Sandy River Unit investigation was to determine the feasibility of lowering the salt inflow to the Big Sandy River. The study was specifically directed toward reducing salt pickup from seeps and springs along a 26-mile reach of the Big Sandy River west of Eden, Wyoming. Feasibility planning was authorized by the Colorado River Basin Salinity Control Act (Public Law 93-320) of 1974 and the Water Resource Developments Feasibility Investigations Act (Public Law 96-375) of October 1980.
Investigations indicate that seeps, which surface in the Bone Draw and Big Bend areas, produce saline water at a rate of about 27 cubic feet per second (ft3/s). The salinity here varies from 1,000 to 6,000 milligrams per liter (mg/L) along the Big Sandy River, with a total annual contribution of more than 164,000 tons of salt. Indications are that salt is picked up by water contacting the shale of the Green River Formation beneath the surface and eventually seeping into the river. Irrigation was identified as a significant contributor to the water source recharging the springs.
Reclamation has studied alternatives to intercept the springs and seeps and then transport, treat and use, or dispose of the saline water. In the irrigated area, off-farm solutions such as selective lining of canals and laterals were studied.
Studies conducted in cooperation with USDA indicated that control of onfarm irrigation is the most cost-effective alternative for controlling salinity from the Big Sandy River Unit. Because of past selective lining programs, the canals and laterals showed relatively low seepage rates, offering little room for improvement.
USDA -- The USDA Big Sandy Salinity Control Program Final Environmental Impact Statement was published in September 1987, and the salinity control plan was released in February 1988. The plan recommends converting the existing surface irrigation systems on 15,700 acres to low-pressure sprinkler and other improved irrigation systems. Implementation of this plan will result in a reduction of 52,900 tons of salt.

43
In 1988, a USDA office was established in Farson, Wyoming, and implementation of the Colorado River Salinity Control Program began. Participation by farmers in the program has been outstanding.
Blue Springs Unit
The Blue Springs Unit area is located on the Little Colorado River within the Navajo Hopi Indian Reservation in north-central Arizona. The springs flow at an average of 160,000 af/yr, with an average salinity of 2,500 mg/L and a total salt load of about 550,000 tons per year.
The lower portion of the Little Colorado River flows through a meandering canyon, which is about a mile wide, and a half-mile deep. The walls of this rugged gorge are a series of nearly vertical cliffs of massive limestone and sandstone separated by steep slopes or benches of shale, siltstone, or thin-bedded sandstone. The bottom can be reached near Blue Springs only by a rugged foot trail from the rim or by helicopter. The springs originate from groundwater that moves into the area from the east and south and emerges as spring flow where the canyon has penetrated the Redwall and Mauve limestones below the regional water table. There are many spring openings along two relatively well-defined reaches.
A full-scale feasibility study of the project is not planned due to the high capital cost of building the project and environmental problems resulting from the significant historical and religious value of the area to the Hopi Indians.
Colorado River Indian Reservation Unit
Reclamation -- The Colorado River Indian Reservation is located in the Lower Colorado River Basin below Parker Dam in La Paz County, Arizona, and the eastern part of San Bernardino and Riverside Counties, California.
The United States Supreme Court allocated water to irrigate 107,588 acres, of which 99,374 acres are in Arizona and 8,213 acres are in California. The allocation of the court also provided for a maximum diversion of 717,148 acre-feet. In 1978, 75,405 acres were irrigated with Colorado River water diverted at Headgate Rock Dam. About 200 miles of canals and laterals delivered water to irrigate this acreage. Irrigation return flows were collected in a 100-mile drainage system and are returned to the river.
The purpose of the Colorado River Indian Reservation Unit investigation was to formulate a plan to reduce the salt loading to the Colorado River from irrigation on the reservation. An analysis of the diversions to and the drainage from the reservation indicated that the reservation did not make a net salt contribution to the river. Consequently, the investigation was terminated and a concluding report released in October 1979.
USDA -- The USDA published a cooperative river basin study for the Colorado River Indian Reservation. Data available from this study support the hypothesis that a minimal amount of salt is picked up on the reservation and that long-term benefits of better irrigation systems and practices appear to have a relatively small effect on downstream salinity. The final USDA report, Water Conservation and Resource Development, Colorado River Indian Reservation,
44
which did not identify a recommended plan, was published and distributed under authority of Section 6 of the Watershed Protection and Flood Prevention Act (Public Law 83-566).
Dirty Devil River Unit
The Dirty Devil River Unit is located in Emery and Wayne Counties in southern Utah. The study area included Muddy Creek, Fremont and Dirty Devil Rivers, and the tributaries of Muddy Creek, Hanksville Salt Wash, and Emery South Salt Wash. The Dirty Devil River drainage contributes approximately 150,000 tons of salt each year to the Colorado River. The Muddy Creek tributary contributes an average of 86,000 tons of salt annually. No significant sources of salt or potential alternatives were identified on the Fremont River or its tributaries. Approximately 28 percent of the Muddy Creek salt load (24,200 tons per year) comes from springs in Hanksville Salt Wash and Emery South Salt Wash.
The geologic formations in the area consist primarily of sedimentary deposits, about 60 percent of which are mudstones, claystones, and shales. The Carmel Formation of Jurassic age and the Mancos Shale Formations of Cretaceous age are major contributors of dissolved solids. Irrigation of alluvial soils derived from shales increases the contribution of dissolved solids to the streams.
Reclamation’s plan was designed to reduce the salinity of the Dirty Devil and Colorado Rivers by collecting saline spring water in Hanksville Salt Wash and Emery South Salt Wash and disposing of it by deep well injection. Collection would be accomplished by pumping surface and alluvial water from shallow wells. This water would be filtered, chemically stabilized, and injected into a deeply buried geologic formation, the Coconino Sandstone, where it would be stored indefinitely and isolated from any freshwater aquifer now in use. This means of disposal would reduce the salt contribution to the Colorado River by 20,900 tons annually. Reclamation completed a planning report in May 1987. The unit has not been implemented due to its marginal cost effectiveness.
Glenwood-Dotsero Springs Unit
The Glenwood-Dotsero Springs Unit is located along the Colorado River in Eagle, Garfield, and Mesa Counties in west-central Colorado. The purpose of this Reclamation unit is to reduce the salt contribution to the Colorado River from mineral springs in two areas, one near the town of Glenwood Springs and the other near the rural community of Dotsero. The combined annual discharge of the springs is 25,000 acre-feet of water that contain about 440,000 tons of salt. About half of the salt contribution comes from 20 surface springs; the remainder enters as seeps and underwater springs within the river channel.
Reclamation started detailed planning investigations in 1980. Technical work included the measurement and chemical analysis of springs and groundwater in the two areas and a detailed technical study of the salt-loading mechanism. Plans were then formulated with the aid of public input. More than 33 alternatives were generated. The most cost-effective plan at the time consisted of collecting both surface and subsurface salt water at Dotsero and transporting the salt water in a gravity flow pressure line to Glenwood Springs where additional surface and subsurface salt water would be collected and added to the Dotsero

45
salt water. The water would then be piped to evaporation ponds at the Colorado-Utah border.
At $126 per ton, this plan could not compete with alternatives available in other units. Plans were deferred until a more cost-effective alternative, possibly an industrial use, could be found. A planning report concluding the evaporation pond alternative was completed in February 1986. Cogeneration and privatized desalting alternatives have been investigated under cooperative agreements with private industry. These have not proved to be competitive with other alternatives available to the program.
Grand Valley Unit
The Grand Valley Unit is located in west-central Colorado along the Colorado River near Grand Junction. The unit was authorized for construction by the Colorado River Basin Salinity Control Act (Public Law 93-320) of 1974. Public Law 98-569, enacted in 1984, amended Title II provisions of that act and authorized the USDA Colorado River Salinity Control Program.
The purpose of the Grand Valley Unit is to reduce the estimated 580,000 tons per year of salt added to the Colorado River from the valley as a result of conveyance system seepage and agricultural practices.
Studies indicate that salt loading to the Colorado River in the Grand Valley occurs when conveyance system seepage and irrigation return flows pass through highly saline soils and the underlying Mancos Shale Formation. By reducing the amount of groundwater percolating through these saline soils, this unit is reducing salt loading to the Colorado River.
Reclamation has completed an irrigation delivery systems improvement program to reduce off-farm seepage and salt loading. The USDA is upgrading onfarm irrigation systems and improving irrigation management to reduce deep percolation from farm operations.
Reclamation -- The Grand Valley Unit construction was staged. Stage One (approximately 10 percent of the valley) was used as a test area to
Figure 11 - Schematic of Agricultural Salt Loading.
Figure 12 - Photo of Canal Lining.

46
refine analysis and construction techniques used on the balance of the project (Stage Two). Following environmental studies in 1978, Stage One construction began in October 1980. As part of the development, 6.8 miles of the Government Highline Canal were lined with concrete, and 13 unlined laterals were consolidated into 12 piped laterals. Construction of Stage One was essentially completed in April 1983.
Monitoring of the Stage One area began in 1976 and continued through 1984. Under the monitoring program, flow and salinity measurements were taken in the Reed Wash study area, a hydrologically isolated basin within the Stage One area. The data were used to evaluate the effects of the Stage One improvements on groundwater, surface flows, and quality. Analysis of the monitoring data indicated that canal and lateral seepage was decreased by approximately 5,700 acre-feet and that salt loading to the Colorado River decreased by approximately 21,900 tons, supporting recommendations for initiating construction of Stage Two.
Beginning in November 1981, Stage Two investigations included re-evaluating various alternatives and analyzing salinity control measures other than concrete lining of the canals and laterals, since nonlining options were minimally studied before authorization. The Grand Valley Project, Final Environmental Impact Statement describes alternatives for the construction and operation of the Grand Valley Unit. The report was filed with EPA on May 23, 1986.
Stage Two of the Grand Valley Unit covers most of the remaining canal and lateral systems in the valley. The recommended plan included piping and lining selected portions of the private and Federal irrigation systems to reduce seepage into the groundwater system. Construction started in 1986 and was essentially completed in 1998.
USDA -- The USDA report, On-farm Program for Salinity Control, was published in December 1977, and a supplement to the report was prepared in March 1980. The supplement added off-farm lateral improvements that are necessary for proper functioning of the onfarm salinity reduction practices. The overall objectives of the USDA Grand Valley Salinity Control Program are to reduce salt loading caused by onfarm irrigation activities and seepage from small group laterals. The goal is to reduce salt loading by 132,000 tons per year by assisting farmers in applying salinity reduction practices and in improving off-farm laterals. Implementation was initiated in 1979 under ongoing USDA programs. Between 1987 and 1996, the program was implemented and funded under the authorities of the USDA Colorado River Salinity Control Program contained in Public Law 98-569. In 1996, Public Law 104-127 combined the USDA Colorado River Salinity Control Program and other programs into the Environmental Quality Incentives Program.
The application of salinity reduction practices continues with farmers installing underground pipelines, gated pipe, concrete-lined ditches, land leveling, drip systems, and a variety of other practices.
Verification Studies -- In 1994, the U.S. Geological Survey (USGS) and Reclamation executed a cooperative agreement to monitor the main river system and evaluate the effectiveness of the salinity control improvements in the Grand Valley Unit. USGS published the first review of the project’s effectiveness in 1995 as a Water-Resources Investigation Report (No. 95-4274). The analysis shows downward trends in salinity, suggesting that the salinity control program is decreasing salinity. However, the study was limited by the availability of post-project data. Although some small improvements were

47
made in the 1980’s for the Phase I (testing) program, major funding and construction of USDA and Reclamation improvements did not begin until about 1990. Reclamation’s portion of the project was completed in 1998. USDA’s portion of the project will likely go beyond the year 2010. Reclamation and USGS plan to continue to monitor the system and update the analysis about every 5 years. USGS has conducted studies within the washes draining the area. Results from this analysis indicate significant downward trends in salinity are occurring in these washes.
Land Retirement
Inefficient irrigation causes problems with salinity when the excess water returns to the river through saline geologic formations. Land retirement is usually evaluated in the early stages of planning but has been eliminated from further consideration and detailed study due to its relatively poor cost effectiveness and adverse local impacts.
Based on overall cost effectiveness, land retirement was not found to be very competitive with water conservation programs. State and Federal costs were comparable with other alternatives, but local economic and wildlife impacts would be very high, driving the cost effectiveness well over $200 per ton.
Beyond its cost, a serious problem with land retirement is that it will not be effective at controlling salinity if the Asaved@ water is used by other farmers (new or existing). Under existing water law and absent specific arrangements, Asaved@ water returns to the appropriation system and will be used. Water-short water users are likely to take advantage of the Asaved@ water, reducing or eliminating the effectiveness of the program.
The Salinity Control Act directs that units be implemented giving priority based on cost effectiveness. For comparison, the water conservation (irrigation system improvements) proposed for the Price-San Rafael Rivers or San Juan River Units are both about $40 per ton. Any land retirement option would have to compete with these and other low-cost alternatives. Table 8 presents land retirement costs and cost effectiveness.
Irrigation supports an unusual variety of wildlife habitat in areas that are normally extremely dry, making them extremely valuable for wildlife. The acreages can be substantial. For example, 60,000 acres of irrigation in the Grand Valley supports about 20,000 acres of wildlife habitat. Reclamation’s policy is to attempt to avoid wildlife/wetland impacts and, if this is not possible, fully mitigate the project’s impacts.
In some cases, land retirement would adversely affect flows in the river system. For example, retiring land in the Grand Valley would cause serious problems in the Colorado River. Existing water use in the upper reaches of the Colorado River would almost dewater the river except that the Grand Valley calls water down through the river system because of its senior rights. If Grand Valley land were retired, it is likely that the water would be fully depleted by transbasin diversions to Denver, Colorado, aggravating the endangered fish problem in the river.
There will be opportunities to integrate land retirement options into existing and future salinity control projects. Land retirement is especially effective as mitigation for wildlife impacts from water conservation and irrigation improvements made by salinity control. It

48
may also be useful to retire lands on the ends of long, leaky irrigation systems rather than improve the delivery system.
Table 9 - Land Retirement Costs and Cost Effectiveness
Item Unit cost ($/acre) Cost per ton($/ton)
Program costs (State and Federal):
Land and water purchase 2,500 48
Wetland replacement cost 1,100 21
Annual operation and maintenance of habitat 28 7
Subtotal 76
Local costs (city and county):
Lost annual property taxes 25 6
Lost annual sales (direct plus indirect) 489 116
Lost annual income (direct plus indirect) 251 60
Subtotal 182
Total costs (program cost plus local cost) 258
Note: Land prices have increased 2x to 3x since this study was conducted.
Land retirement would be competitive with other salinity control alternatives except for its costly impact to wildlife and local economies. The local cost of $182 per ton by itself exceeds the total costs of any salinity control practice ever installed. At costs of $258 per ton, land retirement would not have a very favorable cost/benefit ratio. The benefit of salinity control is estimated at $340 per ton. Cooperative programs with USDA and water conservation alternatives at $40 to $70 per ton would be much more beneficial to the Nation.
Land retirement may be very effective as a way to replace wildlife habitat losses. For example, in the Grand Valley Unit’s Horsethief Canyon Wildlife Area, irrigated cropland is being converted to irrigated wildlife habitat to replace habitat losses associated with the project. This type of habitat replacement does not increase salinity by creating new wetlands because the land was already under irrigation.
Saved water cannot be protected from use under existing prior appropriation laws. Use by other, water-short water users would greatly reduce the effectiveness of the program. This may change as States enact water conservation/marketing laws. Opportunities to implement land retirement alternatives that would be voluntary and supported by local and State Governments may be limited. Ultimately, many different treatments should be combined in each project area to take advantage of the strengths of each. The option to retire small farms on the end of long, leaky delivery systems may be available.

49
La Verkin Springs Unit
The La Verkin Springs Unit is located on the Virgin River in southwestern Utah. The springs flow at a rate of 11.5 ft3/s with a salinity of 9,650 mg/L. The springs contribute an estimated 109,000 tons of salt per year. Reclamation has evaluated several alternatives for the unit, but has not yet found a feasible method of salinity control.
In 1981, Reclamation suspended further studies and prepared a concluding report on the unit. Simultaneously, with the development and submittal of the concluding report, the Washington County Water Conservancy District and the State of Utah were approached with a proposal from a private consultant that indicated total evaporation with clay-lined ponds might make the La Verkin Springs Project cost effective. Based on the information from the private consultant, the project was reinitiated in 1983.
Alternatives developed within the La Verkin Springs Unit 1981 Concluding Report were re-analyzed along with new alternatives. The re-analysis was based on geologic data from 1983 field studies, updated and refined hydrologic data, and feasibility grade designs prepared during the previous study. A preliminary findings report was prepared in 1984 and recommended the study be discontinued because of poor cost effectiveness.
Las Vegas Wash Unit
The Las Vegas Wash is a natural drainage channel providing the only surface water outlet for the entire 2,193 square miles of the Las Vegas Valley. The Las Vegas Wash Unit conveys storm runoff and wastewater from Las Vegas Valley to Las Vegas Bay, an arm of Lake Mead. Located in Clark County in southern Nevada, the Las Vegas Valley contains the largest population center in the State. Studies evaluating salinity contributed by the Las Vegas Wash are concerned mainly with the 10-mile reach upstream of Las Vegas Bay.
Before urban water development in the valley, the Las Vegas Wash was a generally barren, sandy channel, which contained discharge only during brief periods of major storm runoff. Growth of communities in the valley contributed increasing amounts of wastewater discharge to the Las Vegas Wash until the flow became perennial. Return flows to the Las Vegas Wash include sewage treatment plant effluent, industrial cooling water, and urban irrigation. Solute load (tons) of this wastewater has been increasing as discharge continues to increase.
Construction of an interception facility to collect saline groundwater was begun in 1977, but delayed in 1978 to allow time to re-evaluate changing groundwater conditions. Several salinity control strategies were addressed during the re-evaluation period. One strategy would have prevented seepage of wastewater and minor storm runoff by placing it in a bypass channel running parallel to the Las Vegas Wash for about 4 miles, circumventing salt deposits in the Las Vegas Wash alluvium. Some local entities viewed the bypass channel as being in conflict with nutrient control and wildlife habitat improvement objectives, and a consensus of local support was not obtained.
In order to test the salinity removal effectiveness of separating wastewater discharge from highly saline soils, a pipeline was constructed to divert industrial return flow from an open, unlined ditch into a pipeline approximately 4 miles long. Called the Pittman Bypass Pipeline,

50
this facility has reduced groundwater flow and consequent pickup of salts leached from the soil, resulting in an estimated decline in salt loading to the Colorado River of 3,800 tons per year.
Another strategy for salinity control Reclamation studied was reducing groundwater flow by constructing detention dikes across the Las Vegas Wash. The hypothesis was that groundwater detained behind the dikes would stratify, with relatively high quality water collecting at the top. This higher quality water would then spill to the Las Vegas Wash channel. However, simulation of the concept by USGS using computer models indicated that stratification would not occur, and the groundwater detention strategy would not be effective in reducing salinity in the Las Vegas Wash.
Reclamation has discontinued efforts for developing and implementing further salt-reduction strategies for the Las Vegas Wash Unit. A strategy is apparently not available that is cost effective, technically feasible, and publicly acceptable at this time. A final report was published in September 1989. Quarterly water quality monitoring is continuing. Salinity levels appear to be increasing in the Wash.
Lower Gunnison Basin Unit
The Lower Gunnison Basin Unit is located in west-central Colorado in Delta and Montrose Counties. The unit was authorized for investigation by the Colorado River Basin Salinity Control Act (Public Law 93-320) of 1974. An amendment to the act, Public Law 98-569, later authorized portions of the unit for construction in 1984.
An estimated 360,000 tons of salt is added to the Colorado River from the Uncompahgre Project, a Reclamation irrigation project built in the early 1900’s. Studies indicate that salt loading occurs when irrigation conveyance system seepage and irrigation return flows pass through highly saline soils and the underlying Mancos Shale Formation. By reducing the amount of groundwater percolating through these saline soils, salt loading to the Colorado River is being reduced.
With Reclamation funding, the water districts have completed the winter water facilities. Reclamation has completed plans for local improvements to the irrigation delivery systems. USDA is implementing onfarm improvements, including upgrading irrigation systems and improving irrigation management.
Reclamation -- The Uncompahgre Project is a Federal development constructed in the early 1900’s for irrigation of approximately 86,000 acres. Approximately 34 percent of the total 86,000 irrigated acres are on Mancos-Shale-derived soils. These soils are naturally high in both salt and selenium. Reclamation and USDA have implemented various salinity control measures in the area.
The Salinity Control Act authorizes the construction of winter water replacement facilities in the Uncompahgre River Valley and irrigation delivery system improvements on the more saline, east side of the valley. The plan of development includes the winter water replacement and lateral lining programs. Although authorized for construction, canal lining is not competitive with other, lower cost alternatives within the Salinity Control Program. The canal lining construction program remains in a deferred status.

51
The objective of the winter water replacement program is to eliminate winter livestock watering from the unlined canal and lateral system. Water is made available for livestock through an expansion of the existing culinary water system using relatively small, 2- to 6-inch polyvinyl chloride pipe. This modification reduces canal seepage during the non-irrigation season, reducing salinity from the system by about 50 percent. Work on this portion of the unit was completed in 1995.
The remaining portion of the project, the East Side Lateral portion, will compete for funding in Reclamation’s Basinwide Salinity Control Program under the authorities of Public Law 104-20. In FY98, Reclamation solicited proposals for salinity control efforts under its basinwide authorities. The Uncompahgre Valley Water Users Association (UVWUA) submitted a proposal for a project which would cost share salinity control activities with the Department of the Interior=s National Irrigation Water Quality Program (NIWQP). Cost sharing from the NIWQP enabled this project to be competitive with other projects. The project was recommended for implementation by Reclamation=s salinity control evaluation committee. The project will reduce salinity in the Colorado River by about 2,300 tons of salt per year. The Salinity Control Program has contributed $890,000. The NIWQP has contributed $730,000. Environmental compliance for this project was completed in 1995 as part of Reclamation=s Lower Gunnison Basin Unit, Environmental Assessment/Finding of No Significant Impact. The UVWUA will replace approximately 7.5 miles of existing unlined earthen irrigation laterals with buried pipe in the Uncompahgre Project=s South Canal system. Construction of this portion of the project was completed in 2000. A report titled Effects of Piping Irrigation Laterals on Selenium and Salt Loads, Montrose Arroyo, Western Colorado, WRI Report 01-4204 by the USGS shows the project reducing both salinity and selenium. Joint projects will be pursued between the two programs.
USDA -- The USDA salinity control plan for the Lower Gunnison Basin was prepared in 1981. The environmental impact statement was published in 1982. The USDA plan calls for treatment of approximately 135,000 acres of irrigated land and improvements of off-farm laterals.
Implementation was initiated in 1988 by targeting funds into the Tongue Creek subarea in Delta County. Since that time, funding has been allocated to the other subareas, and implementation is now under way in all of the Lower Gunnison Basin Unit. The major practices being installed are underground pipelines, ditch lining, land leveling, irrigation water control structures, sprinkler systems, gated pipe, and surge irrigation systems.
Lower Gunnison Basin Unit, North Fork Area
The Lower Gunnison Basin Unit, North Fork study area, is located in Delta and Ouray Counties of west-central Colorado. It includes irrigated areas on the North Fork of the Gunnison River, along the Uncompahgre River south of Colona, Colorado, and north and east of the city of Delta along the Gunnison River. (That portion of the Lower Gunnison Basin Unit served by the Uncompahgre Project has been investigated in a separate study.)
Reclamation studied off-farm salinity contributions from saline springs and seepage from unlined canals and laterals. Areas north of Delta and southeast of Hotchkiss contribute large

52
amounts of salt. The total off-farm salt contribution from the North Fork area was estimated to be approximately 148,000 tons per year.
Emphasis was placed on identifying and quantifying off-farm sources of salinity and formulating alternative solutions to diminish the salt loading to the river system. Preliminary findings indicated that selective lining of canals and laterals and winter water replacement might be viable; however, a more detailed study showed the cost of these improvements prohibitive.
Lower Virgin River Unit
This unit is located along the lower Virgin River in northeastern Clark County, Nevada, and northwestern Mohave County, Arizona. The unit includes natural saline springs averaging 2,900 mg/L near Littlefield, Arizona, and 3,500 acres of irrigated land along the Virgin River between the springs and Lake Mead.
Investigations by Reclamation began in 1972 as the Littlefield Springs Unit. The initial approach was to study a series of saline springs along the river at Littlefield Springs near the USGS gauge, AVirgin River at Littlefield, Arizona.@ The object of that investigation was to determine the best method of collecting and disposing of the water and returning the freshwater to the river or disposing of the saline water from the springs by evaporation. This project was strenuously opposed locally because the springs are the only reliable water supply for irrigation at Mesquite, Bunkerville, and Riverside, Nevada, during the summer. The Littlefield Springs study was, therefore, terminated.
In 1977, another study was started to determine the feasibility of extracting the saline subsurface water flowing under the Virgin River bed downstream of the irrigated area. Information on surface flows indicated that less salt was leaving the area than was entering. It was, therefore, postulated that salt was leaving the reach in underflow. The results of the study found the subsurface water concentration (3,000 mg/L) was too low for collection, extraction, and evaporation. A concluding report was published in November 1981.
In January 1984, Reclamation reinitiated the Lower Virgin River Unit study to determine if a dual-purpose water supply and salinity control project would be feasible. Saline underflow of the Virgin River would be intercepted by wells and piped 41 miles to the proposed Harry Allen Powerplant where it would be used for cooling water. The Nevada Power Company proposed to construct the powerplant for a 1997 startup. The 1,000-megawatt powerplant would need a water supply of about 14,000 af/yr. In 1987, the investigation was suspended because the schedule for the powerplant construction became uncertain.
In 1991, the Las Vegas Valley Water District and Reclamation began a cost-shared study to evaluate using the Virgin River as a water supply for Las Vegas. The objective of the study was to determine the technical, environmental, and institutional feasibility of a dual-purpose salinity control and water supply project on the lower Virgin River in Nevada. The study found the proposal was not cost effective.

53
Mancos Valley Unit
The Mancos Valley Unit is a 9,200-acre-irrigated area along the Mancos River, a tributary to the San Juan River. The area is very saline (mancos shales) and should respond well to joint Reclamation/USDA irrigation efficiency improvements similar to those being implemented in Utah. Planning studies of this unit began in 2002.
McElmo Creek Unit - Dolores Project
The McElmo Creek Basin is located in southwestern Colorado and covers approximately 720 square miles. About 150 square miles of the basin, mostly in the east, are agricultural land. Early studies show that salt loading results from both irrigation and diffuse sources, with irrigation being the main contributor.
The total irrigation diversion into the area averages 105,200 af/yr. The average salt load contributed by the McElmo Creek Basin was estimated at 119,000 tons per year. The Montezuma Valley Irrigation Company diverts water from the Dolores River to serve irrigation in the McElmo Creek Basin. The salinity of the diversion averages 130 mg/L. Return flows from agriculture increase the salinity in McElmo Creek to about 2,600 mg/L at the Colorado-Utah State line.
Reclamation -- The study included testing canal seepage, developing a hydrosalinity budget, and evaluating salinity control alternatives. The study tested canal seepage at 15 sites along 115 miles of canals. Groundwater monitoring included 125 wells for water table elevation, salinity, and hydraulic conductivity. Irrigation research was done on seven test farms representing various soil types, farm sizes, irrigation methods, and farm management.
Results indicate seepage rates for most of the Montezuma Valley Irrigation Company distribution system are low to moderate except for locations where canal sections have been cut through shale. The plan was to improve three sections of Montezuma Valley Irrigation Company canals, two on the Lone Pine lateral and one on the Upper Hermana lateral, and to install laterals from the Towaoc-Highline Canal to serve the Rocky Ford Ditch service area. The Rocky Ford Ditch would then be abandoned as part of the plan, and its flows would be combined into the Towaoc-Highline Canal. The plan will reduce groundwater seepage from canals by 4,060 acre-feet a year and reduce the amount of salt returned to McElmo Creek.
The McElmo Creek Unit was authorized for construction by Public Law 98-596 in October 1984 as part of the Dolores Project, a participating project of the Colorado River Storage Project. Included in the project were seepage control from the Towaoc-Highline Canal, Rocky Ford laterals, Lone Pine lateral, and the Upper Hermana lateral. The improvements have been completed.
USDA -- The McElmo Creek USDA salinity control report was published in 1983, with the final environmental impact statement released in 1989. The recommended plan calls for treatment of about 21,550 acres with sprinkler irrigation systems and about 270 miles of onfarm ditch and lateral lining.

54
Implementation of the USDA program has been underway in this area since 1990. The major salinity reduction practices being installed are side-roll sprinkler systems, underground pipelines, and gated pipe. A fully coordinated implementation effort is underway, so design and installation of the laterals by Reclamation complement the onfarm irrigation systems. Joint planning actions with Reclamation have made it possible to install gravity pressure sprinkler systems on an additional 9,000 acres.
Verification Studies -- Reclamation is maintaining a gauge in McElmo Creek to monitor the outflow from the unit area, but because of the unit’s relatively small size and the concurrent construction of the Dolores Project (irrigation), the effects of canal and lateral lining will probably be masked. Irrigation efficiency improvements in other project areas have been shown to be effective.
Meeker Dome Unit
Meeker Dome, the site of several abandoned oil and gas exploratory wells, is a local anticlinal uplift in northwestern Colorado, 3 miles east of the town of Meeker and on the right bank of the White River. The Meeker Well, originally drilled for oil exploration purposes and abandoned in the 1920’s, was identified as a significant point source of salinity in the Colorado River System. Before the well was plugged to a depth below 550 feet in 1968, it was flowing at a rate of about 3 ft3/s, and its highly saline water (19,200 mg/L) was increasing the salt load of the Colorado River by about 57,000 tons per year.
In February 1969, two abandoned wells 2 miles north of the Meeker Well also were reported to be flowing saline water and were plugged 8 months later. Further seepage appeared in the same year in four areas within a mile radius of the plugged Meeker Well.
Feasibility investigations were initiated in early 1979 by a multidisciplinary planning team of interested local, State, and Federal agencies, as well as special interest groups and private citizens. These investigations were designed to gain a better understanding of the quantity, sources, and mechanisms by which saline water enters the White River and then to identify alternatives that would eliminate or greatly reduce the salt contribution to the river.
Reclamation conducted technical investigations through a professional services contract with CH2M Hill, a water resources consulting firm. The results of the study indicated that, of the eight oil and gas exploratory wells drilled on the dome, four were adequately plugged. The other four were believed to be unplugged or inadequately plugged and acting as conduits allowing saline water from deep geological formations to flow through shallower groundwater aquifers and pollute surface waters of the White River. To verify this theory, a program was initiated to clean, test, and plug the James, Marland, Meeker, and Scott Wells. A network of observation wells and seep measurement stations were installed to monitor the effects of the verification program.
The bores of the James and Scott Wells were cleaned, tested, and successfully plugged. Major difficulties were encountered with the Marland Well. An adjacent intercept hole was drilled and used to plug it by using pressure cementing from the intercept hole. This was apparently successful in stopping the last source of seepage from the dome and eliminating the need for replugging the Meeker Well.

55
Groundwater levels in observation wells and flows from saline springs have decreased significantly from the conditions existing at the time of the verification well plugging. This information appears to confirm the hypothesis that the wells acted as conduits for saline water. In September 1984, salt loading from the dome had decreased from the preplugging level of about 26,000 tons per year to about 7,000 tons per year. At the end of FY85, monitoring of seeps and wells was terminated. Water levels in the observation wells had stabilized, and springs and seeps remained dry or filled with standing water, indicating the well plugs remained intact. A Planning Report Concluding the Meeker Dome Unit study was published in July 1985.
Verification Studies -- In 1994, Reclamation executed a cooperative agreement with USGS to visit the site and confirm whether or not the unit is still preventing salt from entering the White River. Water-Resources Investigations Report 95-427, Trend Analysis of Selected Water Quality Data Associated with Salinity-Control Projects in the Grand Valley, in the Lower Gunnison River Basin, and at Meeker Dome, Western Colorado, found evidence that salinity levels in the main river channels dropped significantly in these project areas. Because of the unique chemistry of the Meeker Dome seepage (sodium chloride), the Meeker Dome evaluation was able to positively conclude that the well-plugging project continues to be very effective.
Dissolved Chloride
0
5
10
15
20
25
30
35
40
45
50
05/25/1979 02/18/1982 11/14/1984 08/11/1987 05/07/1990 01/31/1993 10/28/1995 07/24/1998 04/19/2001
Con
cent
ratio
n, m
illig
ram
s pe
r lite
r
09304200 White River above Coal Creek near Meeker 09304800 White River below Meeker
Recompletion of wells in Meeker Dome area, April 1982.Data for 1979-83WY furnished by the Bureau of Reclamation.
Standard = 250 milligrams per liter
Palo Verde Irrigation District
The Palo Verde Irrigation District (PVID) is a privately developed district located in Riverside and Imperial Counties, California. Water for irrigation is diverted from the Colorado River at the Palo Verde Diversion Dam and is conveyed through 253 miles of main canals and laterals to serve approximately 90,000 acres of cultivated land. The
Figure 13. Meeker well plugging and chloride concentration.

56
irrigation return flows are collected in a 149-mile drainage system and returned to the Colorado River.
A record of water and salt for PVID since 1951 shows that for most years the return flow carried about 10 percent more salt to the river than was diverted from the river. Because the drainage flow is so large (about 500 ft3/s), no alternative beneficial use for the water has been apparent. Consequently, investigations have focused on ways to minimize the increment of salt load that the drainage carries in excess of the salt load diverted with the irrigation water.
The most recent land brought into production is in the southern end of Palo Verde Valley and drains there collect water with the highest salinity concentrations. This land has been under irrigation for only 20 to 30 years, a relatively short time in comparison to the irrigation history of the valley that began about 1880.
In 1984, an 18-month study was initiated to determine the salinity mechanism responsible for salt loading at PVID. Analysis of the data collected during the study showed that salt loading is due to flushing of saline water from the southern portion of the district. There was no indication of saline water entering the district either from the Palo Verde Mesa to the west or from the underlying Bouse Formation. Neither salt beds nor salt-laden materials were found.
Analyses of water samples taken from the outfall drain show a downward trend in salinity concentration since 1966. This indicates that salts are being gradually flushed from the aquifer. This trend and the high cost of measures to control salinity led Reclamation to conclude that salinity control would not be cost effective. Therefore, in January 1988, Reclamation terminated the planning investigation for the PVID Unit. However, water samples are collected from the main drains and analyzed annually.
Paradox Valley Unit
The Paradox Valley Unit was authorized for investigation and construction by the Salinity Control Act (Public Law 93-320) of 1974. The unit is located in southwestern Colorado along the Dolores River in the Paradox Valley, formed by a collapsed salt dome. Groundwater in the valley comes into contact with the top of the salt formation where it becomes nearly saturated with sodium chloride. Salinities have been measured in excess of 250,000 mg/L, by far the most concentrated source of salt in the Colorado River Basin. Groundwater then surfaces in the Dolores River. Studies conducted by Reclamation show the river picks up more than 205,000 tons of salt annually as it passes through the Paradox Valley.
In its definite plan report (September 1978), Reclamation recommended that a series of wells be drilled on both sides of the Dolores River to intercept the brine before it reached the river. The brine would then be pumped to an evaporation pond in Dry Creek Basin. A draft environmental statement was prepared for this plan and made public on May 11, 1978; a final statement was filed with EPA on March 20, 1979. Due to the potential for environmental impacts, EPA recommended that Reclamation investigate deep-well injection as an alternative method of disposal.

57
A private consulting firm completed a feasibility study of deep-well injection and concluded it to be technically, economically, and environmentally feasible. Reclamation then contracted with a second consulting firm to do a more detailed study of injection and to design the disposal system including injection well and surface facilities. A final design for the test injection well was completed in August 1985.
Facilities have been installed and mechanical tests performed. Numerous mechanical and electrical problems with the facilities have been identified and solved. Several new technologies were developed to overcome the extremely high pressures created by the injection pumps.
In fiscal year 2000, the Paradox Valley Seismic Network (PVSN) showed activity at the injection site reached levels and frequencies that were unacceptably high. Restricting the maximum injection rate to 230 gpm in July 2000 has reduced seismic activity, but has also reduced the effectiveness of the injection facility to about 76,000 tons per year. In January 2002, a test to inject 100 percent brine was implemented after temperature logs of the well showed that the area around the well bore and injection zone had cooled sufficiently to prevent precipitation problems near the well bore. Since January, facility disposal has increased by approximately 35,000 tons per year and there is no indication of apparent adverse effects from 100 percent brine injection. Reclamation will continue to carefully
monitor injection pressures for buildups that might suggest plugging of the aquifer near the well bore. Seismic activity remained low during fiscal year 2002. Verification Studies C The brine collection field has been fully tested by gauging the Dolores River above and below the brine inflow area. When the pumps are turned on, salt gains in the reach drop immediately. Beginning in 1999, Reclamation contracted with USGS to conduct verification studies. Like the Meeker Dome Unit (another sodium
Figure 14 - Photo of Paradox Valley.
Figure 15 - Schematic of Paradox Project.
COLLECTIONWELLS
INJECTIONWELL
DoloresRiver
SALINE GROUNDWATER
Paradox Valley Unit

58
chloride source), monitoring should be able to accurately measure the effectiveness of the Unit.
Price-San Rafael Rivers Unit
The Price-San Rafael Rivers Unit is located in east-central Utah, 120 miles southeast of Salt Lake City, encompassing Carbon and Emery Counties. Agriculture and energy development (primarily coal mining) make up the principal economic base in the area. Both the Price and San Rafael Rivers drain into the Colorado River via the Green River.
Salinity contributed to the Colorado River from the Price River and San Rafael River basins occurs principally as a result of the dissolution of soluble salts in the soil and substrata. Return flows from irrigation and runoff from precipitation transport
Figure 16. Change in Salt Load in Dolores River, in Paradox Valley.
Figure 17 - Salinity from Canal Seepage.

59
salts to natural drains and eventually into the streams and rivers. An estimated 430,000 tons of salt per year reach the Colorado River from these two river basins. Of this amount, approximately 60 percent is attributed to agriculture.
Reclamation has evaluated five alternative plans. These alternatives involve improving irrigation systems; using drain water for powerplant cooling; collecting saline water and disposing of it through deep-well injection, evaporation ponds, or a desalting plant; using saline water for energy development (coal washing, tar sands, or coal slurry pipeline); and retiring land from irrigation. Of these, the irrigation systems improvement alternative passed the four tests of viability (completeness, effectiveness, efficiency, and acceptability).
The selected plan being implemented combines the Reclamation and USDA programs of irrigation improvements. Water pressure developed by piped laterals is being used to run sprinkler irrigation systems. The plan also eliminates winter water from the canal system by installing a rural domestic water distribution system. This method is similar to the winter water program in the Lower Gunnison Basin Unit.
The unit will ultimately include installing 97 miles of pipe for off-farm delivery of irrigation water; 26,000 acres of improved systems; 10,040 acres of improved surface systems; 36,050 acres of improved irrigation water management; lining 83 stock ponds; adding 213 connections to culinary systems to provide winter livestock water; and installing 10.6 miles of pipe to improve the Cottonwood Creek livestock water system. Through its new competitive Basinwide Program, Reclamation is funding local water districts to install pipeline systems and winter water facilities. Local landowners then install onfarm sprinkler systems with technical and financial assistance from USDA. A joint Reclamation/USDA planning report and final environmental impact statement was completed in December 1993.
Reclamation has a total of eight ongoing projects in the Price-San Rafael Rivers Unit area. The projects are being funded by Reclamation’s Basinwide Program and cost sharing from the Basin States. The water conservation based projects include the Ferron, Wellington, Cottonwood, Allen Projects, North Carbon, Moore, Seeley-Collard, and Lawrence South. Six of the projects are completed, the Ferron project is nearing completion, and Lawrence South funding began in fiscal year 2002 for completion in fiscal year 2003. These projects will reduce salinity by improving the efficiency of existing irrigation projects by piping selected canals and laterals to gain pressure to run sprinkler irrigation systems.
Figure 18 - Price-San Rafael Irrigation Improvements.

60
San Juan River Unit
Reclamation -- The San Juan River Unit area includes the entire 23,000-square-mile watershed from the San Juan River’s headwaters in south-central Colorado to its mouth at
Lake Powell. The drainage contributes approximately 1 million tons of salt annually to the Colorado River Basin. Early reconnaissance shows significant salt loading in the San Juan River between Shiprock, New Mexico, and the Four Corners area. At Bluff, Utah, the annual flow of 2,047,000 acre-feet of water contains 1,165,000 tons of salt. About 18 percent of this salt loading occurs between Shiprock and Bluff, but only 7 percent of the water is added in this reach.
The Hammond Project, Navajo Indian Irrigation Project (NIIP), and the Hogback Irrigation Project (also a Navajo Indian project) are the principal irrigation sources of salt in the San Juan River Basin. Reclamation has focused its planning efforts in the San Juan River Unit by preparing a planning report/environmental assessment for the Hammond area. A final report and finding of no significant impact was published in December 1994.
The Hammond Project was awarded a contract late in 1996 under Reclamation=s Basinwide Salinity Control Program. The project will replace unlined canals and laterals, which are extremely leaky due to sandy soils. The local water district is constructing the project. The district retained Reclamation to design the facilities. The district awarded a contract, and construction started in FY98 and is essentially complete.
USDA – USDA completed salinity investigations in the San Juan River Basin east of the Hogback. It was determined that a USDA onfarm salinity control program is not feasible in this area. In 1992, investigations were initiated in the San Juan River Basin west of the Hogback to determine if an onfarm program might be feasible. The study area lies within the boundaries of the Navajo Indian Nation. This study was completed in 1993. The report recommended that further study be done in the area.
Selenium Studies
Selenium is an essential nutrient and potential aquatic life toxin, especially when bioaccumulated in a complex food chain. Chemically selenium is closely tied to sulfur, and thus the major sulfate salinity sources within the Colorado River Basin may also be selenium sources. Selenium standards range from 2 to 5 parts per billion (ppb) to protect wildlife in the Colorado River Basin States, with the more conservative standards in the lower basin. The Colorado River from the Colorado/Utah boundary generally exceeds 2 ppb as shown in Table 10. In the lower Colorado River Basin irrigation generally concentrates selenium in agricultural drainwater to about 8-14 ppb. Documentation of selenium toxic affects to
Figure 19 - Unimproved Canal at Hammond Project.

61
wildlife in the mainstem Colorado River or in the lower basin is generally lacking, even though many fish exceed body burdens shown to be toxic in other environments. The Gunnison River Basin and Grand Valley area of the Colorado River are by far the largest source areas of selenium (50-60%) found in the mainstem Colorado River (Table 10). Once selenium enters the Colorado River, it moves rather conservatively downstream (Table 10).
Studies of wildlife problems at the Salton Sea have shown that selenium comes into the irrigation district at about 2.4 ppb, is frequently between about 8-14 ppb in agricultural drainwater, but is only 1 ppb is the Salton Sea. The anoxic sediments in the Salton Sea are acting as a sink for selenium in very insoluble forms. Salton Sea wildlife problems include DDT and other chemicals, salinity, and eutrophication. Selenium is also frequently listed as a potential problem, but is not as high a priority as the others.
A number of selenium studies within the Colorado River Basin have been undertaken and coordinated by the Department of the Interior’s National Irrigation Water Quality Program (NIWQP) and the Upper Colorado Region of the Bureau of Reclamation. A pilot project was cost shared in the Gunnison River Basin by NIWQP, the salinity control program, and local irrigators. This study was specifically designed to determine if lateral piping to stop irrigation conveyance system water looses directly into sulfurous/seleniferous Mancos shale and soil derivatives would yield proportionate selenium reductions to sulfate salt loading reductions. The study determined that selenium loading reductions where slightly greater than sulfate salt loading reductions. However, another joint study between Reclamation’s UC-Region and USGS in Utah determined that there is a sharp geochemical demarcation between sulfur and selenium in deeper soil/river alluvium aquifers near Jensen, Utah. The forms of selenium in these ground water alluvial materials may suggest that they are more of a selenium sink than a source.
As a result of these two studies it is generally concluded that water efficiency improvement projects will effectively reduce selenium as well as salt loading in shallow soils overlying Cretaceous shale. However, it is much more difficult to conclude that selenium loading would be significantly reduced in deeper (20-80 feet) river alluvial materials with geochemically complex ground water systems.
At least two projects partially funded for salinity control; the Gunnison Pilot study already sited, and replacement of the leaking Ashley Valley Sewer Lagoons near Vernal, Utah; have the potential of reducing annual selenium loading by about 1,200 to 1,400 pounds per year(1-2% of the dissolved selenium loading).
The Upper Colorado Region- Bureau of Reclamation will summarize all the ongoing studies into a basinwide selenium report during 2003. Reclamation has contracts with USGS-Water Resources Division for a geochemical study (essentially complete), and a basin wide selenium risk assessment with BRD-USGS which should be in draft form in 2003. In addition, Reclamation will look at future potential salinity control projects and estimate those with the greatest potential to also reduce selenium loading. Some future projections of concurrent salinity and selenium reductions may also be possible. However, reducing selenium in the mainstem Colorado River from just above the 2 ppb standard to just below it will still leave lower basin irrigation drainwater with 5-10 ppb selenium. It is difficult to document that the current selenium concentrations are producing a biological affect, and it not anticipated that a difference in selenium hazard can be quantified if the river concentration is reduced to less than 2 ppb.

62
The Colorado River Salinity Forum has determined to formulate a selenium sub-committee beginning in 2003. Scientists from the various agencies who have been involved in selenium and salinity research in the Colorado River Basin will be serving as technical consultants to this selenium sub-committee.
Table 10 - Selenium in the Colorado River Basin
Location
Average Dissolved Selenium (µg/L)
Average Dissolved Selenium (lb/yr)
Number of Selenium Samples
Gunnison River Basin
4.4
22,000
142
Colorado River above the Gunnison River
<1.0
5,300
40
Dolores River Basin
1.9
2,600
63
Colorado River above the Green River (Cisco)
4.1
47,000
106
Green River Basin
1.4
15,100
111
San Rafael River Basin
2.0
90
12
San Juan River Basin
1.7
6,800
100
Combined inflow to Lake Powell
2.3
69,000
--
Colorado River below Glen Canyon Dam (Lake Powell)
2.2
72,500
141
Colorado River below Hoover Dam (Lake Mead)
2.3
61,800
65
Colorado River below Parker Dam (Lake Havasu)
2.3
62,400
124
Note: Provisional data subject to change.
Sinbad Valley Unit
The Sinbad Valley Unit is located in western Colorado, south of the town of Gateway. Salt Creek drains Sinbad Valley and has been identified by BLM as a point source of saline groundwater contributing an estimated 5,000 to 8,000 tons of salts per year to the Colorado River System. Saline groundwater discharges from the Paradox member of the Hermosa Formation into the alluvium in Salt Creek through a series of springs and seeps near the mouth of the Sinbad Valley. BLM initiated a study for the interception and disposal of these saline waters in 1982 and completed a report on Sinbad Valley in April 1983. This report recommended that Reclamation assume lead responsibility and funding.
The Sinbad Valley study indicates that additional information is needed before final selection can be made among the various alternatives. First, additional discharge and conductivity measurements are required to define salt loads of high flows; second, onsite evaporation data are needed to further refine the sizing of evaporation ponds (a pan evaporation station should be established and operated in Sinbad Valley for at least 1 year); third, the abandoned wildcat well, No. 1 Sinbad Unit, should be evaluated for injection suitability. Other questions that need to be resolved include water rights and the compatibility of the project with existing land uses.

63
Before a preferred alternative can be selected, an environmental assessment will need to be completed. Sewemup Mesa, located immediately east of Sinbad Valley, is a BLM wilderness study area and is also proposed as an outstanding natural area in the resource management plan. The area has high visual sensitivity, both onsite and along a powerline alignment, and has peregrine falcons nesting in it. Reclamation has suspended study of this area for salinity control because of the project’s small size, potential environmental impacts, and marginal cost effectiveness.
Uinta Basin Unit
The Uinta Basin Unit is located in northeastern Utah. The area includes portions of Duchesne and Uinta Counties and is situated between the Uinta Mountains on the north and the Tavaputs Plateau on the south. The principal communities within the area are Duchesne, Roosevelt, and Vernal.
Reclamation has conducted extensive studies in the area. Most of the salt pickup from the unit area is from the dissolution of salts from the soil and subsurface materials, principally from soils of marine origin that underlie most of the Uinta Basin. Seepage from conveyance systems and deep percolation resulting from irrigation are the primary processes that dissolve salts from the soils and shales and convey the salts through the groundwater system to natural drainages and ultimately to the Colorado River. The Uinta Basin contributes an estimated 450,000 tons of salt per year to the Colorado River.
Reclamation -- Reclamation has a total of 14 projects in the Uinta Basin Unit area. The projects are funded jointly by Reclamation’s Basinwide Program and cost sharing from the Basin States. The water conservation based projects include the Burns Bench, BIA-Ute Tribe, Duchesne County, Farnsworth, Lower Brush Creek, Western Uintah, South Lateral, River Canal, Union Canal, Hicken, Dry Gulch Class E, Dry Gulch Class C, Ouray Park, and Duchesne Water Conservancy District projects. These projects will reduce salinity by improving the efficiency of existing irrigation projects. Several will pipe selected canals and laterals to gain pressure to run high-efficiency sprinkler irrigation systems
USDA -- The USDA Uinta Basin Salinity Control Plan was prepared in 1979 and amended in 1987 to include off-farm lateral improvements. In 1992, the plan was expanded to bring in 20,000 acres of adjoining irrigated lands that were not included in the original plan. The total salt-load reduction goal for this area is 140,500 tons per year.
Figure 20 - Salinity in Uinta Basin Unit Area.

64
Since 1987, implementation has been accomplished under the authorities of the USDA Colorado River Salinity Control Program. The application of salinity reduction practices continues at an increasing rate. The major practices installed are wheel-line sprinkler systems, improved surface systems, under ground pipelines and gated pipe. In this area, many groups of farmers are replacing leaking earthen laterals with pipelines that provide gravity pressure for onfarm sprinkler systems.
Verification Studies -- In their National Water Summary 1990-91, Water Supply Paper 2400, the USGS reported a downward trend in dissolved solids concentration (salinity) in the Duchesne River, immediately downstream of the project area. They pointed out that much of the base flow of the river was from irrigation return flows. Salinity discharge has dropped from 206,000 tons in 1981 when USDA first started irrigation improvements to 169,000 tons in 1993 -- a 37,000-ton reduction. Based on the amount of irrigation improvements installed, USDA estimates that irrigation improvements through 1992 have reduced the salinity discharge by about 55,500 tons per year (1993 Joint Evaluation Report). Recent studies have also shown a downward shift in the salt/flow relationship (for a given flow, salinity is lower). These data support the theory that onfarm irrigation practices can be effective at reducing salt loading. Monitoring and analysis will continue.
Virgin Valley Unit
The USDA report for the Virgin Valley was published in March 1982. This area is located where the Virgin River flows through the States of Arizona, Nevada, and Utah. The area consists of about 5,000 acres of irrigated land owned by 50 individuals and involves 4 irrigation companies or districts. Rapid urbanization is occurring in much of the lower Virgin Valley. Salt loading could be reduced from this area by about 37,200 tons per year with improvements to canals, laterals, and onfarm irrigation systems. USDA plans to reevaluate areas for salt control opportunities in 2003 and beyond.

65
Chapter 6 Chapter 6 Chapter 6 Chapter 6 ---- SALINITY CONDITIONS SALINITY CONDITIONS SALINITY CONDITIONS SALINITY CONDITIONS
The Colorado River System is naturally very saline. More than 9 million tons of salt are carried down the river every year. The flow of the river dilutes this salt, and depending upon the quantity of flow, salinity can be relatively dilute or concentrated. Since climatic conditions directly affect the flow in the river, salinity in any one year may double (or halve) due to extremes in runoff. Because this natural variability is virtually uncontrollable, the seven Basin States adopted a non-degradation water quality standard, which is unique to this river system.
Salts have few, if any, negative health effects. Their main impact is economic. Present economic damages are about $330 million per year, primarily due to agricultural damages, corrosion, and plugging of pipes and water fixtures. The seven Basin States have agreed to limit this impact and adopted numeric criteria, which require that salinity concentrations not increase (from the 1972 levels) due to future water development. Salinity levels measured in the river may be low or high due to climatic conditions, but the goal of the Water Quality Standards for the Colorado River Basin and the Colorado River Basin Salinity Control Program (Salinity Control Program) is to offset (eliminate) the salinity effects of additional water development.
The Bureau of Reclamation (Reclamation) and the U.S. Geological Survey (USGS) continuously monitor the flow and salinity of the river system through a network of 20 gauging stations. Reclamation evaluates the data collected as part of its progress reports using hydrologic and computer techniques to determine if sufficient salinity control is in place to offset the impact of water development. In 2001, the actual salinities in the Colorado River Basin were below the numeric criteria. However, as the impacts of recent and future basin developments work their way through the hydrologic system, salinity would increase without salinity control to prevent further degradation of the river system.
FACTORS INFLUENCING SALINITY
Reservoir storage, water resource development, salinity control, climatic conditions, and natural runoff directly influence salinity in the Colorado River Basin. Before any water development, the salinity of spring runoff was often below 200 milligrams per liter (mg/L) throughout the Colorado River Basin. But salinity in the lower mainstem was often well above 1,000 mg/L during the low flow months (most of the year), since no reservoirs existed to catch and store the spring runoff. Water storage has all but eliminated seasonal swings in salinity.
Although seasonal swings in salinity have been greatly reduced, wide annual fluctuations in salinity are still observed. Natural, climatic variations in rainfall and snowmelt runoff continue to cause large year-to-year differences in both flow and salinity - in some cases, nearly doubling the salinity in the river.
A century of water resource use and development has also had some serious negative impacts. Although peak salinities have been greatly reduced, average salinities have more
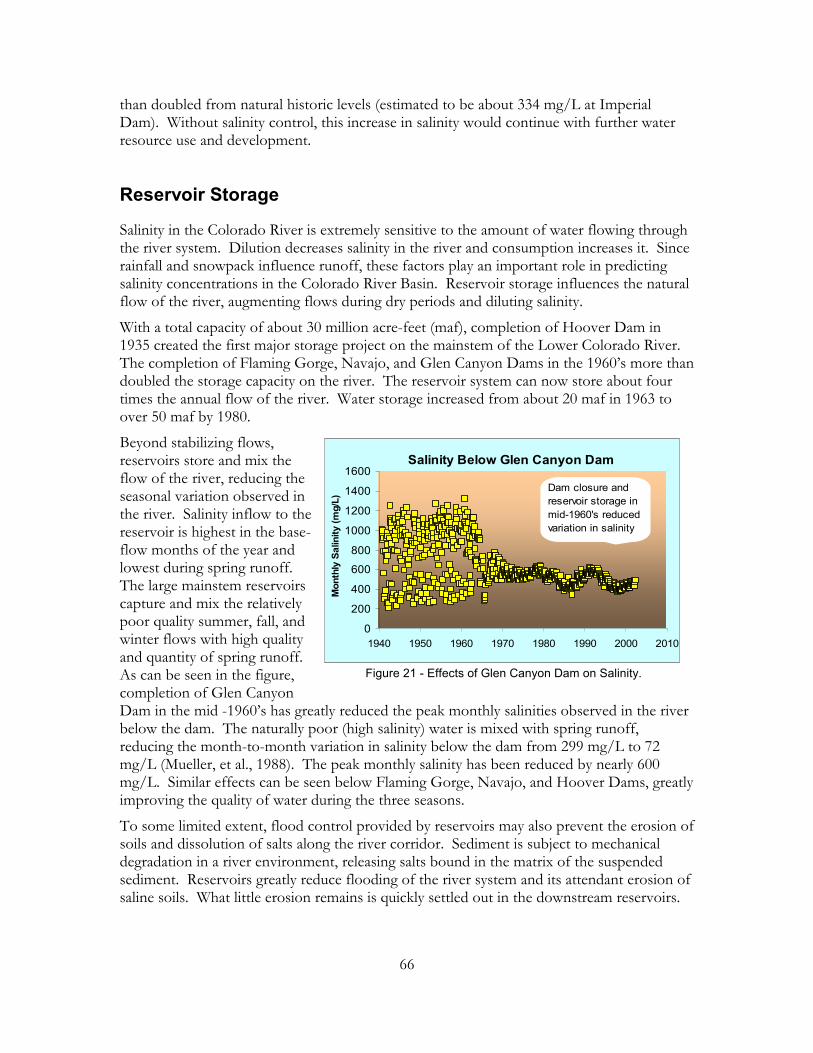
66
Salinity Below Glen Canyon Dam
0
200
400
600
800
1000
1200
1400
1600
1940 1950 1960 1970 1980 1990 2000 2010
Mon
thly
Sal
inity
(mg/
L)
Dam closure and reservoir storage in mid-1960's reduced variation in salinity
than doubled from natural historic levels (estimated to be about 334 mg/L at Imperial Dam). Without salinity control, this increase in salinity would continue with further water resource use and development.
Reservoir Storage
Salinity in the Colorado River is extremely sensitive to the amount of water flowing through the river system. Dilution decreases salinity in the river and consumption increases it. Since rainfall and snowpack influence runoff, these factors play an important role in predicting salinity concentrations in the Colorado River Basin. Reservoir storage influences the natural flow of the river, augmenting flows during dry periods and diluting salinity.
With a total capacity of about 30 million acre-feet (maf), completion of Hoover Dam in 1935 created the first major storage project on the mainstem of the Lower Colorado River. The completion of Flaming Gorge, Navajo, and Glen Canyon Dams in the 1960’s more than doubled the storage capacity on the river. The reservoir system can now store about four times the annual flow of the river. Water storage increased from about 20 maf in 1963 to over 50 maf by 1980.
Beyond stabilizing flows, reservoirs store and mix the flow of the river, reducing the seasonal variation observed in the river. Salinity inflow to the reservoir is highest in the base-flow months of the year and lowest during spring runoff. The large mainstem reservoirs capture and mix the relatively poor quality summer, fall, and winter flows with high quality and quantity of spring runoff. As can be seen in the figure, completion of Glen Canyon Dam in the mid -1960’s has greatly reduced the peak monthly salinities observed in the river below the dam. The naturally poor (high salinity) water is mixed with spring runoff, reducing the month-to-month variation in salinity below the dam from 299 mg/L to 72 mg/L (Mueller, et al., 1988). The peak monthly salinity has been reduced by nearly 600 mg/L. Similar effects can be seen below Flaming Gorge, Navajo, and Hoover Dams, greatly improving the quality of water during the three seasons.
To some limited extent, flood control provided by reservoirs may also prevent the erosion of soils and dissolution of salts along the river corridor. Sediment is subject to mechanical degradation in a river environment, releasing salts bound in the matrix of the suspended sediment. Reservoirs greatly reduce flooding of the river system and its attendant erosion of saline soils. What little erosion remains is quickly settled out in the downstream reservoirs.
Figure 21 - Effects of Glen Canyon Dam on Salinity.
67
Chemical precipitation in reservoirs was found to have a negligible impact on salinity. This potential loss in salinity was investigated by Reclamation for the two largest storage reservoirs in the Colorado River Basin, Lakes Powell and Mead. A thermal-hydrodynamic reservoir model, which incorporated chemical equilibrium, was applied to each of the two reservoirs. The estimated potential for calcite precipitation (the salt that precipitates from solution first) was found to be relatively small (about 20,000 tons per year for Lake Powell and 40,000 tons per year for Lake Mead). These estimates represent the upper limit of potential precipitation, as it assumes that there are sufficient nuclei for the calcium carbonate crystallization and that reaction rate kinetics do not limit the precipitation. The combined maximum precipitation is less than 1 percent of the annual salt load passing through the reservoirs (about 9 million tons per year) and is significantly less than previous estimates that were based on inflow-outflow budgets using rather incomplete or inadequate data.
Water Use by Agriculture and Municipal & Industrial Users
The depletion (consumption) of water flowing in the river system and by salt loading, directly influence salinity. Agriculture increases salinity by consuming water through evapotranspiration and leaching salts from saline soils. Municipal and industrial (M&I) use increases salinity by the consumption of the water, thus reducing the dilution of salts in the river. These two types of uses are critical in predicting future salinity levels in the basin.
Reclamation continues to monitor water use and adjust its future salinity control needs as water development plans have been postponed, delayed, or canceled. The depletion schedules used to project salinity conditions have been updated so that the implementation needs for the Salinity Control Program can be planned to offset the impacts of water development. Transbasin diversions and increased reservoir evaporation account for most of the increased water use; however, no additional salt pickup or loading occurred with these types of depletions.
The large amounts of water use for steampower generation, coal gasification, oil shale, and mineral development have not yet occurred due to the relatively low cost of energy. The few coal-fired powerplants that have been constructed recently have obtained their water from existing agricultural rights rather than from developing additional water. This conversion of use reduces the salt loading to the Colorado River by eliminating the pickup of salt from canal seepage and deep percolation.
Most of the irrigation projects that deplete water and increase salt pickup to the river were in place before 1965. Moreover, like the newly inundated soils in reservoirs, newly irrigated lands are subject to a leach-out period. In cases where lands with poor drainage stored salt, these areas were taken out of production. In addition, irrigation practices changed significantly with the introduction of canal and lateral lining, sprinkling systems, gated pipe, and trickle systems. These changes should result in reduced return flows and salt pickup.
Future Water Development -- Table 10 and 11 on the next two pages summarize the projected depletions used by Reclamation to evaluate the effects of water use and depletions for this progress report. These water use estimates were compiled as the first step in the evaluation process. Table 10 summarizes the estimated depletion of water through full basin development for the mainstem Upper Colorado River Basin. The projections were made in

68
consultation with individual States within the Colorado River Basin and the Upper Colorado River Commission; however, the States do not necessarily concur with the projections adopted by Reclamation for planning purposes.
The Upper Colorado River Basin Compact provides that the States of Arizona, Colorado, New Mexico, Utah, and Wyoming will share in the consumptive use of water available in the
Upper Colorado River Basin in the following proportions: Arizona, 50,000 acre-feet; Colorado, 51.75 percent of the remainder; New Mexico, 11.25 percent of the remainder; Utah, 23.00 percent of the remainder; and Wyoming, 14.00 percent of the remainder. Each Upper Colorado River Basin State is charged a proportionate share of the total evaporation.
Reclamation’s most recent hydrologic determination of water
available to the Upper Colorado River Basin is 6.0 maf rather than the
7.5 maf anticipated by the 1922 Colorado River Compact. While the Upper Colorado River Basin States do not share Reclamation’s view of water available to the Upper Colorado River Basin States, they have acquiesced to Reclamation’s views for planning purposes only.
The depletions for the Lower Colorado River shown in table 11 include only mainstem use of the Colorado River in the Lower Colorado River Basin. Reclamation=s river simulation model does not model consumptive uses of the Lower Colorado River Basin tributaries. Fixed inflow values are used for the tributaries. Colorado River Basin use data (including tributary use) may be found in Reclamation=s Colorado River System Consumptive Uses and Losses Reports or on the web at www.uc.usbr.gov/special/crs/crs.html . Estimates of future consumptive use by the Lower Colorado River Basin States of mainstem Colorado River water were derived from historical use and apportionment of 7.5 maf in the Lower Colorado River Basin and in accordance with the decree of the Supreme Court of the United States in Arizona v. California et al. (March 9, 1964). Rates of development have been estimated by each State in those cases where a particular use is not yet fully developed. Certain other existing uses are presumed to be curtailed when the Central Arizona Project becomes fully operational. In California, the Seven Party Agreement (August 18, 1931) also serves as a basis for estimates of future use within that State.
Figure 22 - Historic and Projected Water Uses.
Historic and Projected Upper Colorado River Basin Uses
01234567
1960 1980 2000 2020 2040 2060 2080
Use
s (m
af/y
r)
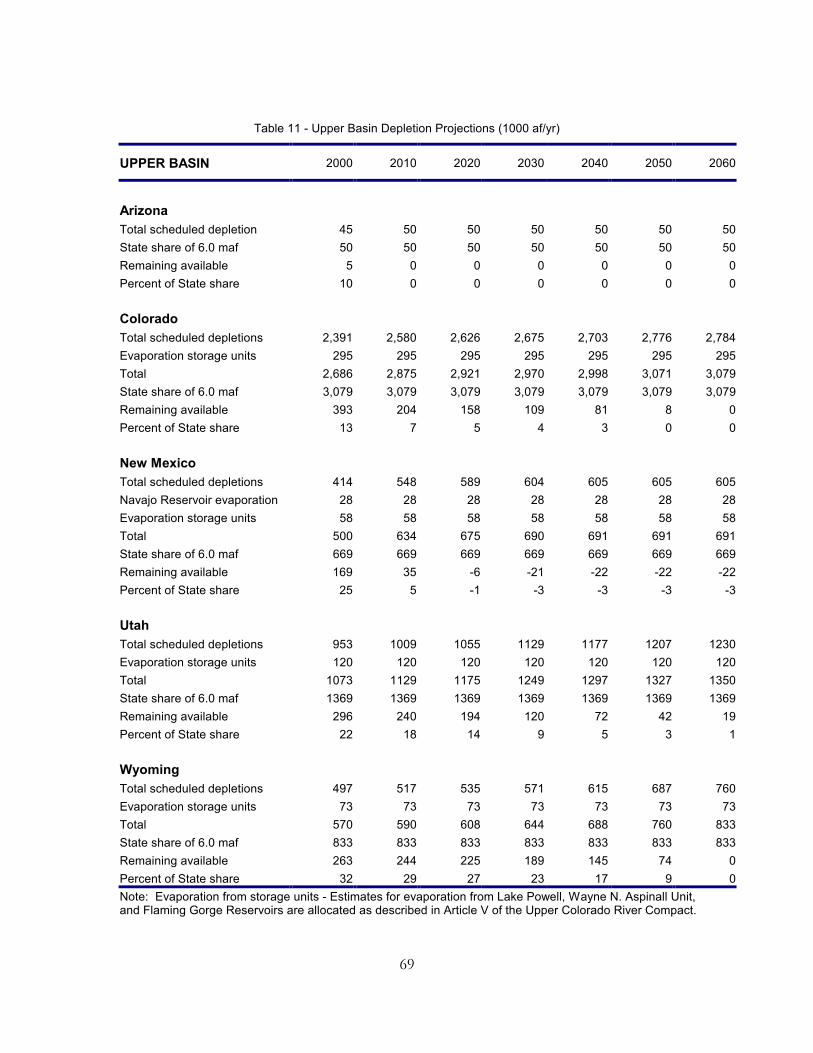
69
Table 11 - Upper Basin Depletion Projections (1000 af/yr)
UPPER BASIN 2000 2010 2020 2030 2040 2050 2060
Arizona Total scheduled depletion 45 50 50 50 50 50 50State share of 6.0 maf 50 50 50 50 50 50 50Remaining available 5 0 0 0 0 0 0Percent of State share 10 0 0 0 0 0 0 Colorado Total scheduled depletions 2,391 2,580 2,626 2,675 2,703 2,776 2,784Evaporation storage units 295 295 295 295 295 295 295Total 2,686 2,875 2,921 2,970 2,998 3,071 3,079State share of 6.0 maf 3,079 3,079 3,079 3,079 3,079 3,079 3,079Remaining available 393 204 158 109 81 8 0Percent of State share 13 7 5 4 3 0 0 New Mexico Total scheduled depletions 414 548 589 604 605 605 605Navajo Reservoir evaporation 28 28 28 28 28 28 28Evaporation storage units 58 58 58 58 58 58 58Total 500 634 675 690 691 691 691State share of 6.0 maf 669 669 669 669 669 669 669Remaining available 169 35 -6 -21 -22 -22 -22Percent of State share 25 5 -1 -3 -3 -3 -3 Utah Total scheduled depletions 953 1009 1055 1129 1177 1207 1230Evaporation storage units 120 120 120 120 120 120 120Total 1073 1129 1175 1249 1297 1327 1350State share of 6.0 maf 1369 1369 1369 1369 1369 1369 1369Remaining available 296 240 194 120 72 42 19Percent of State share 22 18 14 9 5 3 1 Wyoming Total scheduled depletions 497 517 535 571 615 687 760Evaporation storage units 73 73 73 73 73 73 73Total 570 590 608 644 688 760 833State share of 6.0 maf 833 833 833 833 833 833 833Remaining available 263 244 225 189 145 74 0Percent of State share 32 29 27 23 17 9 0Note: Evaporation from storage units - Estimates for evaporation from Lake Powell, Wayne N. Aspinall Unit, and Flaming Gorge Reservoirs are allocated as described in Article V of the Upper Colorado River Compact.

70
Table 12 - Lower Basin Depletion Projections (1000 af/yr)
LOWER MAINSTEM 2000 2002 2010 2020 2030 2040 2050 2060
Nevada Robert B. Griffith Water Project 297 270 264 264 280 280 280 280Other users above Hoover Dam 21 7 7 7 7 7 7 7Southern California Edison 13 16 16 16 0 0 0 0Ft. Mohave Indian Reservation 5 6 9 9 9 9 9 9Laughlin and users below Hoover Dam 2 4 4 4 4 4 4 4Total 338 303 300 300 300 300 300 300 Arizona Imperial Wildlife Refuge 4 9 10 9 10 10 10 10Lake Havasu Wildlife Refuge 4 5 5 5 5 5 5 5Fort Mohave Indian Reservation 35 46 73 73 73 73 73 73City of Kingman 0 0 0 0 0 0 0 0Mohave Valley I&D District 20 25 23 17 17 17 17 17Bullhead City and other M&I 9 4 4 5 6 6 6 6Cibola Valley I&DD, Parker and others 22 18 24 27 30 32 34 34Lake Havasu I&D District 9 14 13 12 12 12 12 12Central Arizona Project 1424 1458 1425 1419 1406 1398 1395 1395Colorado River Indian Reservation 351 343 414 463 463 463 463 463Cibola Wildlife Refuge 4 6 8 8 16 16 16 16Gila Project 485 549 505 477 476 476 476 476City of Yuma 18 25 27 30 35 41 41 41Yuma Project - Valley Division 245 267 248 234 229 229 230 230Cocopah Indian Reservation 6 13 12 12 12 12 12 12Other users below Imperial Dam 11 8 9 9 10 10 10 10Total 2647 2790 2800 2800 2800 2800 2800 2800 California City of Needles 1 1 1 1 1 1 1 1Metropolitan Water District 1300 645 855 852 852 852 802 802Fort Mohave Indian Reservation 12 14 12 12 12 12 12 12Chemehuevi Indian Reservation 1 2 5 8 8 8 8 8Colorado River Indian Reservation 6 5 19 39 39 39 39 39Palo Verde Irrigation District 457 383 373 366 366 366 366 366Yuma Project Reservation Division 28 37 47 54 54 54 54 54Imperial Irrigation District 3113 2959 2711 2641 2611 2611 2661 2661Coachella Valley Water District 343 360 376 426 456 456 456 456Other uses Davis to Parker Dam 1 2 1 1 1 1 1 1Other uses below Imperial Dam 12 0 0 0 0 0 0 0Total 5274 4408 4400 4400 4400 4400 4400 4400 Unassigned Fish, wildlife, and recreation 515 515 515 515 515 515 515 515Yuma Desalting Plant 120 120 120 120 52 52 52 52M&I (Harry Allen Powerplant) 0 0 0 0 0 0 0 0Total 635 635 635 635 567 567 567 567Note: In the LC Basin, depletions are from mainstem diversions of the Colorado River only. Does not include depletions from diversions of Colorado River tributaries or evaporation from mainstem reservoirs. The figures represent measured diversions less measured and estimated, unmeasured return flow that can be assigned to a specific project.
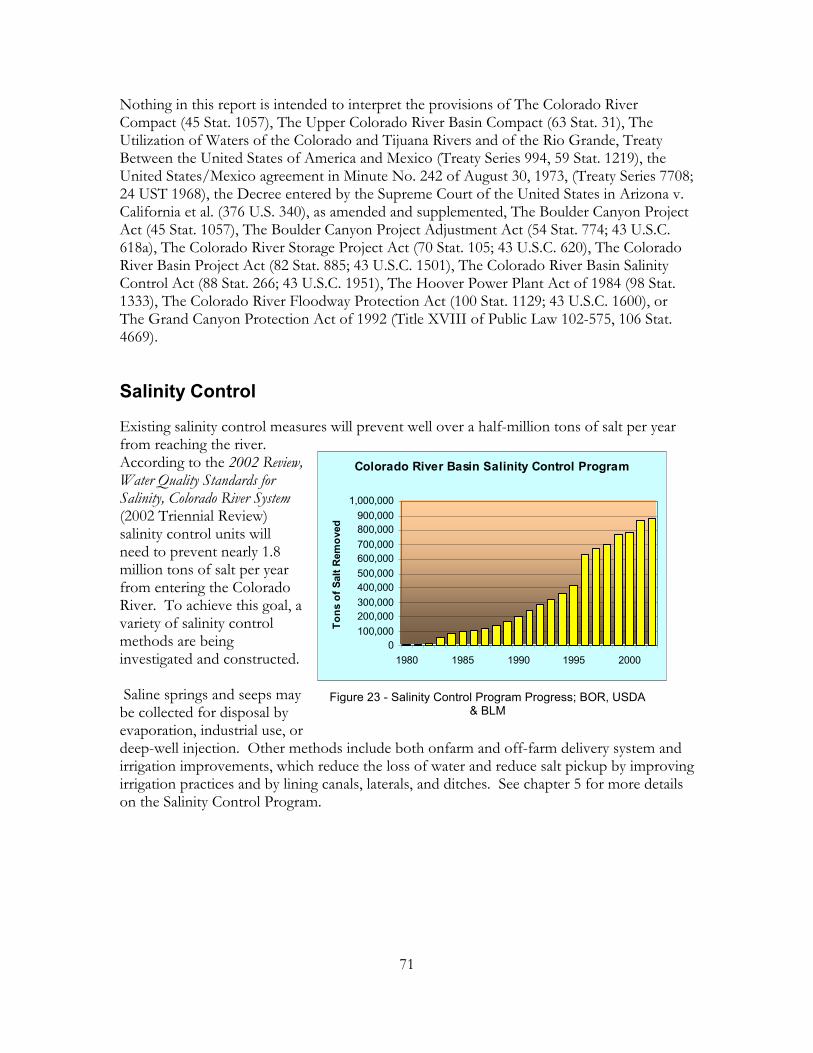
71
Colorado River Basin Salinity Control Program
0100,000200,000300,000400,000500,000600,000700,000800,000900,000
1,000,000
1980 1985 1990 1995 2000
Tons
of S
alt R
emov
ed
Nothing in this report is intended to interpret the provisions of The Colorado River Compact (45 Stat. 1057), The Upper Colorado River Basin Compact (63 Stat. 31), The Utilization of Waters of the Colorado and Tijuana Rivers and of the Rio Grande, Treaty Between the United States of America and Mexico (Treaty Series 994, 59 Stat. 1219), the United States/Mexico agreement in Minute No. 242 of August 30, 1973, (Treaty Series 7708; 24 UST 1968), the Decree entered by the Supreme Court of the United States in Arizona v. California et al. (376 U.S. 340), as amended and supplemented, The Boulder Canyon Project Act (45 Stat. 1057), The Boulder Canyon Project Adjustment Act (54 Stat. 774; 43 U.S.C. 618a), The Colorado River Storage Project Act (70 Stat. 105; 43 U.S.C. 620), The Colorado River Basin Project Act (82 Stat. 885; 43 U.S.C. 1501), The Colorado River Basin Salinity Control Act (88 Stat. 266; 43 U.S.C. 1951), The Hoover Power Plant Act of 1984 (98 Stat. 1333), The Colorado River Floodway Protection Act (100 Stat. 1129; 43 U.S.C. 1600), or The Grand Canyon Protection Act of 1992 (Title XVIII of Public Law 102-575, 106 Stat. 4669).
Salinity Control
Existing salinity control measures will prevent well over a half-million tons of salt per year from reaching the river. According to the 2002 Review, Water Quality Standards for Salinity, Colorado River System (2002 Triennial Review) salinity control units will need to prevent nearly 1.8 million tons of salt per year from entering the Colorado River. To achieve this goal, a variety of salinity control methods are being investigated and constructed.
Saline springs and seeps may be collected for disposal by evaporation, industrial use, or deep-well injection. Other methods include both onfarm and off-farm delivery system and irrigation improvements, which reduce the loss of water and reduce salt pickup by improving irrigation practices and by lining canals, laterals, and ditches. See chapter 5 for more details on the Salinity Control Program.
Figure 23 - Salinity Control Program Progress; BOR, USDA & BLM
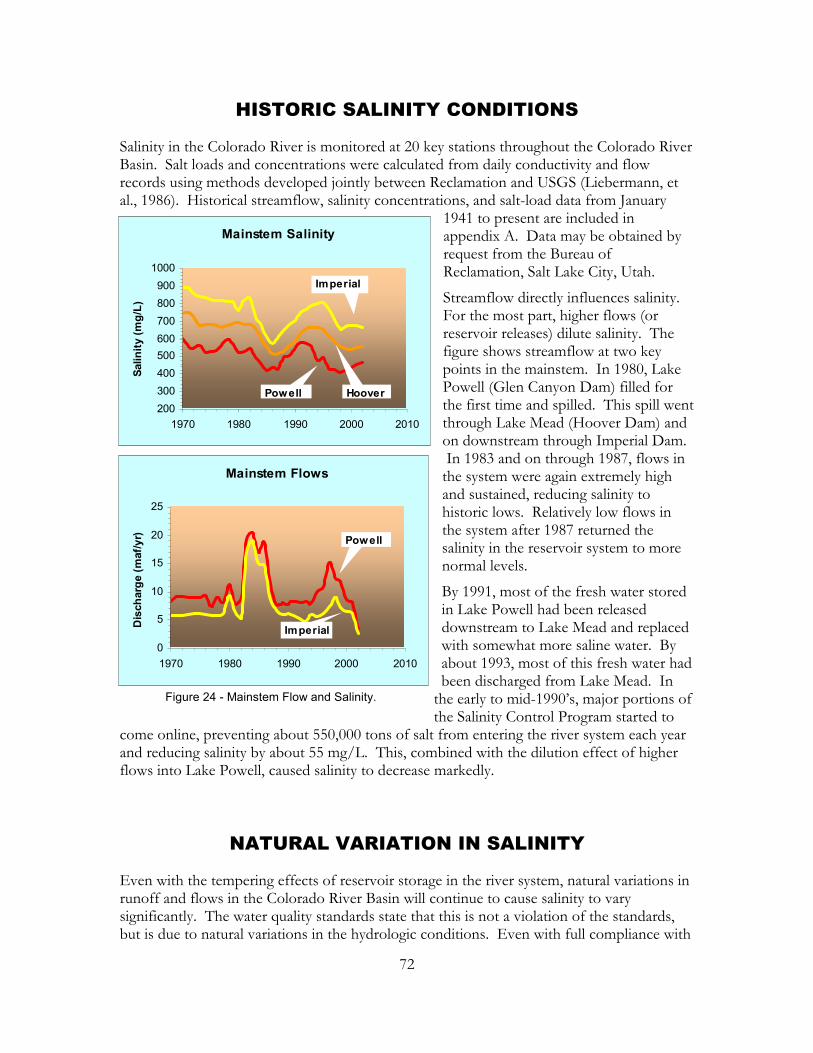
72
Mainstem Salinity
200300400500600700800900
1000
1970 1980 1990 2000 2010
Salin
ity (m
g/L)
HooverPowell
Imperial
Mainstem Flows
0
5
10
15
20
25
1970 1980 1990 2000 2010
Dis
char
ge (m
af/y
r) Powell
Imperial
HISTORIC SALINITY CONDITIONS
Salinity in the Colorado River is monitored at 20 key stations throughout the Colorado River Basin. Salt loads and concentrations were calculated from daily conductivity and flow records using methods developed jointly between Reclamation and USGS (Liebermann, et al., 1986). Historical streamflow, salinity concentrations, and salt-load data from January
1941 to present are included in appendix A. Data may be obtained by request from the Bureau of Reclamation, Salt Lake City, Utah.
Streamflow directly influences salinity. For the most part, higher flows (or reservoir releases) dilute salinity. The figure shows streamflow at two key points in the mainstem. In 1980, Lake Powell (Glen Canyon Dam) filled for the first time and spilled. This spill went through Lake Mead (Hoover Dam) and on downstream through Imperial Dam. In 1983 and on through 1987, flows in the system were again extremely high and sustained, reducing salinity to historic lows. Relatively low flows in the system after 1987 returned the salinity in the reservoir system to more normal levels.
By 1991, most of the fresh water stored in Lake Powell had been released downstream to Lake Mead and replaced with somewhat more saline water. By about 1993, most of this fresh water had been discharged from Lake Mead. In
the early to mid-1990’s, major portions of the Salinity Control Program started to
come online, preventing about 550,000 tons of salt from entering the river system each year and reducing salinity by about 55 mg/L. This, combined with the dilution effect of higher flows into Lake Powell, caused salinity to decrease markedly.
NATURAL VARIATION IN SALINITY
Even with the tempering effects of reservoir storage in the river system, natural variations in runoff and flows in the Colorado River Basin will continue to cause salinity to vary significantly. The water quality standards state that this is not a violation of the standards, but is due to natural variations in the hydrologic conditions. Even with full compliance with
Figure 24 - Mainstem Flow and Salinity.

73
the standards, the actual salinities at Imperial Dam (and elsewhere in the Colorado River Basin) will continue to fluctuate with hydrologic conditions in the future. The Salinity Control Program is designed to offset the effects of development, even as salinity varies from year to year in response to the climatic and hydrologic conditions. Assuming continued salinity control and full compliance with the standards, the potential range of annual salinities that might be observed in the future at Imperial Dam is quite wide. With reservoir storage tempering the natural variability of the system, the range of variation has dropped to about 450 mg/L.
COMPLIANCE WITH THE SALINITY STANDARDS
Reclamation and the Basin States conducted salt-routing studies for the 2002 Triennial Review of the Water Quality Standards for Salinity, Colorado River Basin. As part of the triennial review process, Reclamation uses its mass-balance model of the river system to evaluate whether sufficient salinity control measures are in place to offset the effects of development. The information provided in the next two sections of the report were used to evaluate compliance with the water quality standards.
In response to the Clean Water Act, the States have adopted water quality (salinity) standards for the Colorado River Basin and the Environmental Protection Agency (EPA) has approved them at all three locations in the Lower Colorado River Basin. The standards call for maintenance of flow-weighted average annual salinity concentrations (numeric criteria) in the lower mainstem of the Colorado River and a plan of implementation for future controls.
The water quality standards are based on the Water Quality Standards for Salinity, Including Numeric Criteria and Plan of Implementation for Salinity Control, Colorado River System, prepared by the Colorado River Basin Salinity Control Forum, June 1975. The document was adopted by each of the Basin States and approved by EPA. In summary, the report states:
The numeric criteria for the Colorado River System are to be established at levels corresponding to the flow-weighted average annual concentrations in the lower mainstem during calendar year 1972. The flow-weighted average annual salinity for the year 1972 was used. Reclamation determined these values from daily flow and salinity data collected by the USGS and the Bureau of Reclamation. Based on this analysis, the numeric criteria are 723 mg/L below Hoover Dam, 747 mg/L below Parker Dam, and 879 mg/L at Imperial Dam.
It should be recognized that the river system is subject to highly variable annual flow. The frequency, duration, and availability of carryover storage greatly affect the salinity of the lower mainstem; and, therefore, it is probable that salinity levels will exceed the numeric criteria in some years and be well below the criteria in others. However, under the above assumptions, the average salinity will be maintained at or below 1972 levels.
Periodic increases above the criteria as a result of reservoir conditions or periods of below normal long-time average annual flow also will be in conformance with the standards. With satisfactory reservoir conditions and when river flows return to the long-time average annual flow or above, concentrations are expected to be at or below the criteria level.
The standards provide for temporary increases above the 1972 levels if control measures are included in the plan. Should water development projects be completed before control
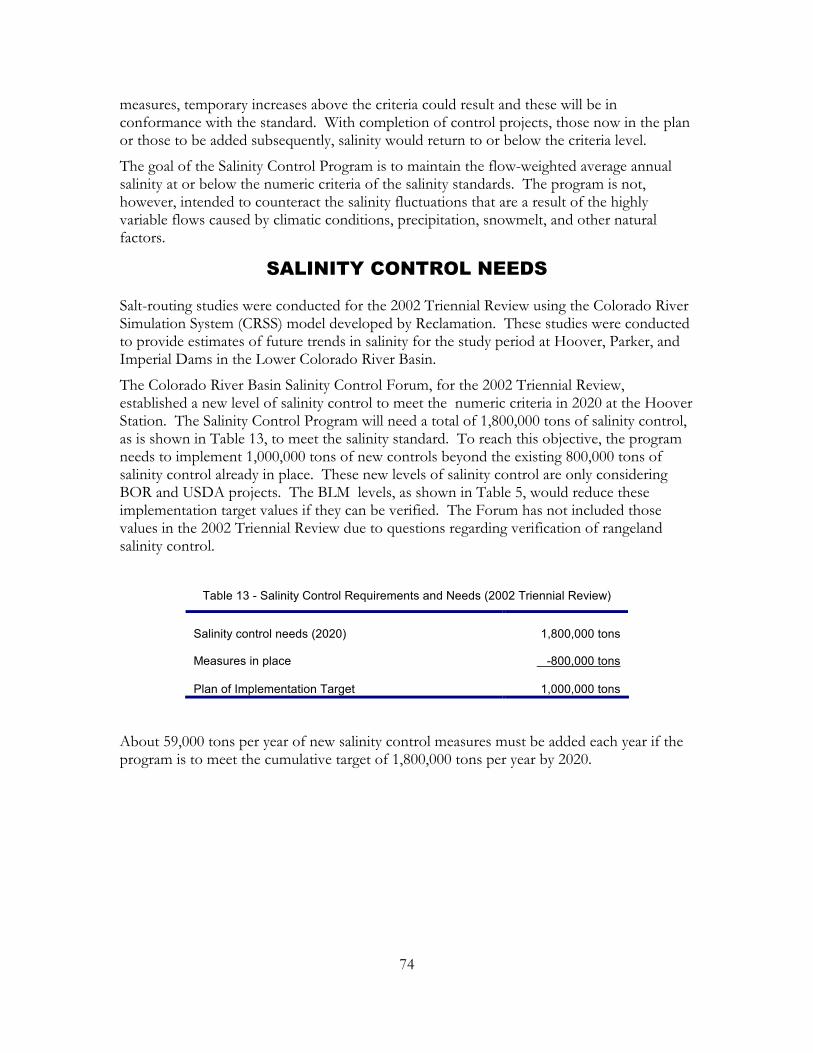
74
measures, temporary increases above the criteria could result and these will be in conformance with the standard. With completion of control projects, those now in the plan or those to be added subsequently, salinity would return to or below the criteria level.
The goal of the Salinity Control Program is to maintain the flow-weighted average annual salinity at or below the numeric criteria of the salinity standards. The program is not, however, intended to counteract the salinity fluctuations that are a result of the highly variable flows caused by climatic conditions, precipitation, snowmelt, and other natural factors.
SALINITY CONTROL NEEDS
Salt-routing studies were conducted for the 2002 Triennial Review using the Colorado River Simulation System (CRSS) model developed by Reclamation. These studies were conducted to provide estimates of future trends in salinity for the study period at Hoover, Parker, and Imperial Dams in the Lower Colorado River Basin.
The Colorado River Basin Salinity Control Forum, for the 2002 Triennial Review, established a new level of salinity control to meet the numeric criteria in 2020 at the Hoover Station. The Salinity Control Program will need a total of 1,800,000 tons of salinity control, as is shown in Table 13, to meet the salinity standard. To reach this objective, the program needs to implement 1,000,000 tons of new controls beyond the existing 800,000 tons of salinity control already in place. These new levels of salinity control are only considering BOR and USDA projects. The BLM levels, as shown in Table 5, would reduce these implementation target values if they can be verified. The Forum has not included those values in the 2002 Triennial Review due to questions regarding verification of rangeland salinity control.
Table 13 - Salinity Control Requirements and Needs (2002 Triennial Review)
Salinity control needs (2020)
1,800,000 tons
Measures in place
-800,000 tons
Plan of Implementation Target
1,000,000 tons
About 59,000 tons per year of new salinity control measures must be added each year if the program is to meet the cumulative target of 1,800,000 tons per year by 2020.
75
REFERENCES CITEDREFERENCES CITEDREFERENCES CITEDREFERENCES CITED
Anderson, J.C., and A.P. Kleinman. 1978. Salinity Management Options for the Colorado River. Water Resources Series Planning Report No. P-78-003, Utah Water Resources Laboratory, Logan, Utah.
Bureau of Reclamation. 1991. Colorado River System Consumptive Uses and Losses Report 1981-1985. Upper Colorado Regional Office, Salt Lake City, Utah.
Iorns, W.V., C.H. Hembree, and G.L. Oakland. 1965. Water Resources of the Upper Colorado River Basin - Technical Report. U.S. Geological Survey, Professional Paper 441.
Kleinman, A.P., and B.F. Brown. December 1980. Colorado River Salinity, Economic Impacts on Agricultural, Municipal, and Industrial Users. Bureau of Reclamation, Engineering and Research Center, Colorado River Water Quality Office, Denver, Colorado.
Laronne, J.B. 1977. Dissolution Potential of Surficial Mancos Shale and Alluvium. Unpublished Ph.D. dissertation, Department of Earth Resources, Colorado State University.
Liebermann, T.D., and B.D. Nordlund. 1986. Estimates of Dissolved Solid and Major Constituents for 70 Streamflow-Gaging Stations in the Upper Colorado River Basin. U.S. Geological Survey draft report.
Lohman, L.C., et al. 1988. Economic Impacts of Salinity of the Colorado River. Bureau of Reclamation, Denver, Colorado.
McWhorter, D.B., J.W. Rowe, et al. 1979. Surface and Subsurface Water Quality Hydrology in Surface Mined Watersheds, Part I. Text Interagency Energy/Environment R&D Program Report, EPA-600/7-79-193.
Mueller, D.K., and L.L. Osen. 1988. Estimation of Natural Dissolved-Solids Discharge in the Upper Colorado River Basin, Western United States. U.S. Geological Survey, Water Resources Investigation Report 87-4069.
Mueller, D.K., and T.D. Liebermann. 1988. Extension of Streamflow and Dissolved Solids Records at Selected Sites in the Colorado River Basin: Arizona, California, Colorado, Nevada, New Mexico, Utah, and Wyoming, 1940-83. U.S. Geological Survey, Water Resources Investigations Report 87-4203.
Parker, R.S., and J.M. Norris. 1983. Simulated Effects of Anticipated Coal Mining on Dissolved Solids in Selected Tributaries of the Yampa River, Northwestern Colorado. U.S. Geological Survey, Water Resources Investigation Report 83-4084, Lakewood, Colorado.
Ponce, S.L. 1975. Examination of a Non-Point Source Loading Function for the Mancos Shale Wildlands of the Price River Basin, Utah. Ph.D. Thesis, Utah State University, Logan, Utah.
Riley, J.P., et al. 1982. Potential of Water and Salt Yields from Surface Runoff on Public Lands in the Price River Basin. Water Resources Planning Series UWRL/P-82/01, Utah Water Research Laboratory, Logan, Utah, 94 pp.

76
Riley, J.P., et al. 1982. Salt Uptake in Natural Channels Traversing Mancos Shales in the Price River Basin, Utah. Water Resources Planning Series UWRL/P-82/02, Utah Water Research Laboratory, Logan, Utah, 194 pp.
Schumm, S.A., and D.I. Gregory. 1986. Diffuse-Source Salinity: Mancos Shale Terrain. U.S. Department of the Interior, Bureau of Land Management, Technical Note No. 373, Denver Service Center, Denver, Colorado.
Uintex Corp. 1982. A Study of Runoff and Water Quality Associated with the Wildlands of the Price River Basin, Utah. Bureau of Land Management Contract No. YA553-CT1-1064.
U.S. Department of Agriculture. 1976. Grand Valley Salinity Study, Investigation of Sediment and Salt Yields in Diffuse Areas. Soil Conservation Service, Memorandum, March 5, 1976. Mesa County, Colorado.
U.S. Department of the Interior. 1984. Status Report, Bureau of Land Management, Technical Note No. 364, Denver Service Center, Denver, Colorado.
U.S. Department of the Interior. 1985. Draft Environmental Impact Statement, James Creek Coal, Preference Right Lease Application. Bureau of Land Management, Craig District, Colorado.
U.S. Department of the Interior. 1990. Colorado River Damage Estimate Program. Bureau of Reclamation, Chief, Analysis, Contracts, and Lands Division, Denver Office, Memorandum, October 25, 1990, Denver, Colorado.
U.S. Environmental Protection Agency. 1971. The Mineral Quality Problem in the Colorado River Basin, Summary Report, EPA Regions VIII and IX.

77
GENERAL REFERENCESGENERAL REFERENCESGENERAL REFERENCESGENERAL REFERENCES
Agricultural Research Service. 1982. Minimizing Salt in Return Flow Through Irrigation Management. Report No. PUB-744; EPA-600/2-82-073, 181 pp.
Battelle Pacific Northwest Labs. 1982. Western Oil-Shale Development: A Technological Assessment. Vol. 6: Oil-Shale Development in the Piceance Creek Basin and Potential Water- Quality Changes. Department of Energy, Report No. PNL-3830-VO2.6, 22 pp.
Bentley, R.G., K.O. Eggleston, and E.B. Janes. 1980. Salinity Status Report, 1978-79, Control of Salinity from Point Sources Yielding Groundwater Discharge and from Diffuse Surface Runoff in the Upper Colorado River Basin. Report No. BLM-YA-TR-80-01, Bureau of Land Management, Denver Service Center, Denver, Colorado, 37 pp.
Bowles, D.S., et al. 1982. Salt Loading From Efflorescence and Suspended Sediments in the Price River Basin. Water Resources Planning Series UWRL/P-82/05, Utah Water Research Laboratory, Logan, Utah, 142 pp.
Brenniman, G.R. 1981. Relationship Between High Sodium Levels in Municipally Softened Drinking Water and Elevated Blood Pressures. Water Resources Center, Illinois University, Research Report 158, NTIS PB81-212615, 27 pp.
Bulke, E.L., and K.M. Waddell. 1975. Chemical Quality and Temperature of Water in Flaming Gorge Reservoir, Wyoming and Utah, and the Effect of the Reservoir on the Green River. U.S. Geological Survey, Water Supply Paper 2039-A.
Burdge, Irelan. 1971. Salinity of Surface Water in the Lower Colorado River, Salton Sea Area. U.S. Geological Survey, Professional Paper 486-E.
Bureau of Land Management. 1978. The Effects of Surface Disturbance on the Salinity of Public Lands in the Upper Colorado River Basin, 1977 Status Report. U.S. Department of the Interior, Denver Service Center, Denver, Colorado, 208 pp.
Bureau of Reclamation. 1981. Saline Water Use and Disposal Opportunities: Colorado River Water Quality Improvement Program. Special Report, Bureau of Reclamation, Denver, Colorado, 167 pp.
Bureau of Reclamation. 1981. Water Assessment for the Lower Colorado River Region, Emerging Energy Technology Development. Bureau of Reclamation, Boulder City, Nevada, 170 pp.
Bureau of Reclamation. 1984. Colorado River System Consumptive Uses and Losses Report 1976- 1980. Upper Colorado Region, Salt Lake City, Utah.
Bureau of Reclamation. 1984. Development, Verification, and Use of Methods to Model Chemical and Thermal Processes for Lakes Powell and Mead. Engineering and Research Center, Colorado River Water Quality Office, Denver, Colorado.
Bureau of Reclamation. May 1985. Colorado River Simulation System Documentation System Overview. USBR Engineering and Research Center, Denver, Colorado.

78
Bureau of Reclamation. 1986. Etiwanda Ion-Exchange Pilot-Plant Testing. Denver, Colorado. CH2M Hill. 1982. Salinity Investigation of the Price-San Rafael River Unit, Colorado River Water Quality Improvement Program. Bureau of Reclamation, Contract No. 1-07-40-51637, Utah Projects Office, Provo, Utah.
Cissell, Jeffery A., V. Dean Adams, Joel E. Fletcher, Daniel S. Filip, and Dennis B. George. 1982. Water Requirements and Pollutant Potential in the Gasification of Carbonaceous Shales. Report Nos. UWRL/Q-82/04; W83-02211; OWRT-A-043-UT(1), Utah Water Research Laboratory, Logan, Utah, 68 pp.
Colorado Water Resources Research Institute. 1981. A Five Year Plan for Water Research in Colorado. Office of Water Research and Technology, Report No. W82-05531, 133 pp.
Cowan, Michael S., R. Wayne Cheney, and Jeffrey C. Addiego. 1981. Colorado River Simulation System: An Executive Summary. Bureau of Reclamation, Engineering and Research Center, Denver, Colorado, 19 pp.
Dean, A.V. and Lamarra, V.A. (editors). 1981. Aquatic Resources Management of the Colorado River Ecosystem (Proceedings of the Symposium). Ann Arbor Science Publication, Ann Arbor, Michigan, 697 pp.
DeLon, L.L. 1982. Water Quality of Streams and Springs, Green River Basin, Wyoming. U.S. Geological Survey, Water Resources Investigations Report 82-4008.
Eisenhauer, R.J. 1983. Characterization of Glenwood Springs and Dotsero Springs Water. Bureau of Reclamation, Engineering and Research Center, Report No. 83-10, Denver, Colorado, 58 pp.
Eisenhauer, R.J. 1986. Characterization of Glenwood Springs and Dotsero Springs Source Aquifers. Bureau of Reclamation, REC-ERC-86-1, Denver, Colorado.
Eisenhauer, R.J. 1987. Characteristics of Big Sandy River Drainage Basin Water and of Salty Aquifer Water. Bureau of Reclamation, REC-ERC-87-2, Denver, Colorado.
Evans, R.G., W.R. Walker, and G.V. Skogerboe. 1982. Defining Cost-Effective Salinity Control Programs. Journal of the Irrigation and Drainage Division, Proceedings of the American Society of Civil Engineers, vol. 108, No. 4, pp. 265-272.
French, Richard H. (Ed.). 1984. Salinity in Watercourses and Reservoirs. Proceedings of the 1983 International Symposium on State-of-the-Art Control of Salinity, July 13-15, 1983, Salt Lake City, Utah, Butterworth Publishers, Stoneham, Massachusetts.
Gloss, S., and D.E. Kidd. Application of the Nutrient Loading Concept and Effects of Nutrient Perturbations on Phytoplankton Productivity. Lake Powell Research Project, Bulletin No. 59.
Green, S.L. 1981. Water Resources Investigations of the U.S. Geological Survey in Wyoming, Fiscal Year 1980. U.S. Geological Survey, Open-File Report 81-201, 118 pp.
Haselhoff, Donald A. 1983. Water for Las Vegas Metropolitan Area, Journal of Environmental Engineering, vol. 109, No. 3, pp. 700-715.
Holburt, M.B. 1982. Colorado River Water Allocation. Water Supply and Management, vol. 6, No. 1-2, pp. 63-73.

79
Howells, L., et al. 1987. Base of Moderately Saline Groundwater in the Uinta Basin, Utah. U.S. Geological Survey, Open-File Report 87-397.
Hyatt, M.L., J.P. Riley, M.L. McKee, and E.K. Israelson. 1970. Computer Simulation of the Hydrologic-Salinity Flow System Within the Upper Colorado River Basin. PRWG54-1. Utah Water Research Laboratory, Utah State University, Logan, Utah, 255 pp.
Israelsen, C. E., et al. 1980. Use of Saline Water in Energy Development. Water Resources Planning Series UWRL/P-80/04, Utah Water Research Laboratory, Logan, Utah, 128 pp.
Jackson, W.L., R.G. Bentley, and S. Fisher. 1984. Results of BLM Studies on Public Lands in the Upper Colorado River Basin. BLM Technical Note YA-PT-84-008-4340, Bureau of Land Management, Denver Service Center, Denver, Colorado.
Johnson, D.H., C.M. Leboeuf, and D. Waddington. 1981. Solar Pond-Driven Distillation and Power Production System. Solar Energy Research Institute, Report No. SERI/TR-631-1248, Department of Energy, Golden, Colorado, 24 pp.
Johnson, R.K., and S.A. Schumm. 1982. Geomorphic and Lithologic Controls of Diffuse-Source Salinity, Grand Valley, Western Colorado. National Technical Information Service, PB82-256587, 99 pp.
Kidd, D.E., E. Hansmann, and S. Gloss. Trophic Status Investigations at Lake Powell Reservoir. Lake Powell Research Project Bulletin No. 60.
Koch, R.W., T.G. Sanders, and H.S. Morel-Seytoux. 1982. Regional Detection of Change in Water Quality Variables. Water Resources Bulletin, vol. 18, No. 5, pp. 815-821.
Laronne, J.B., and S.A. Schumm. l977. Evaluation of the Storage of Diffuse Sources of Salinity in the Upper Colorado River Basin. Environmental Resources Center, Colorado State University, Completion Report Series No. 79, 111 pp.
Laughlin, J.K. 1984. Appraisal Study of Saline Water Use Equipment for Power Plant Cooling. Bureau of Reclamation, Denver, Colorado.
Laughlin, J.K. 1985. Final Report - Study of Saline Water Use at Jim Bridger Power Plant. Bureau of Reclamation, Denver, Colorado.
Laughlin, J.K. 1986. Final Report - Study of Saline Water Use at Harry Allen Generating Station. Bureau of Reclamation, Denver, Colorado.
Laughlin, J.K. 1987. Final Report - Study of Saline Water Use at the Etiwanda Generating Station. Bureau of Reclamation, Denver, Colorado.
Law, J.P., Jr., and A.G. Hornsby. 1982. The Colorado River Salinity Problem. Water Supply and Management, vol. 6, No. 1-2, pp. 87-104.
Liebermann, T.D., et al. 1987. User’s Manual for Estimation of Dissolved-Solids Concentrations and Loads in Surface Water. U.S. Geological Survey, Water Resources Investigations Report 86-4124.
Liebermann, T.D., D.K. Mueller, J.E. Kircher, A.F. Choquette, and R.A. Bell. 1986. Characteristics and Trends of Dissolved Solids in the Upper Colorado River Basin, Arizona, Colorado, New Mexico, Utah, and Wyoming. U.S. Geological Survey, Open-File Report 87-568.

80
Lindskov, K.L., and B.A. Kimball. Quantity and Quality of Streamflow in Southeastern Uinta Basin, Utah and Colorado. U.S. Geological Survey, Water Supply Paper 2224.
Martin, R.G., and R.H. Stroud. 1973. Influence of Reservoir Discharge Location on Water Quality, Biology, and Sport Fisheries of Reservoirs and Tailwaters, 1968-71. U.S. Army Corps of Engineers, Waterway Experiment Station, Contract No. DACW31-67-C-0083.
Mayer, L.M. 1977. The Effect of Lake Powell On Dissolved Silica Cycling in the Colorado River. Lake Powell Research Project Bulletin No. 42.
Maynard, D.P., and Caputo, R. 1982. Assessment of Saline Water Use in Coal Transport and Multipurpose Systems. Jet Propulsion Laboratory, Report No. JPL-D-425, Pasadena, California, Bureau of Reclamation, Engineering and Research Center, Denver, Colorado, 156 pp.
Merritt, D. and Johnson, N. 1977. Advective Circulation in Lake Powell, Utah-Arizona. Lake Powell Research Project Bulletin No. 61, Institute of Geophysics and Planetary Physics, University of California, Los Angeles, California, 72 pp.
Miffin, M.D. 1983. Reuse Versus Return Flows: Considerations for Selecting a Water Supply Strategy. University of Nevada, Desert Research Institute, Reno, Nevada.
Miller, J.B., D.L. Wegner, and D.R. Bruemmer. 1980. Salinity and Phosphorus Routing Through the Colorado River/Reservoir System. Bureau of Reclamation, Salt Lake City, Utah.
Moody, C.D., and D.K. Mueller. 1984. Water Quality of the Colorado System: Historical Trends in Concentration, Load, and Mass Fraction of Inorganic Solutes. Bureau of Reclamation, Report No. EC-ERC-84-9. Mueller, D.K., and L.L. Osen. 1988. Estimation of Natural Dissolved Solids Discharge in the Upper Colorado River Basin, Western United States. U.S. Geological Survey, Water Resources Investigations Report 87-4069.
Mundorff, J.C. 1972. Reconnaissance of Chemical Quality of Surface Water and Fluvial Sediment in the Price River Basin, Utah. Utah Department of Natural Resources Technical Publication 39.
Mundorff, J.C., and K.R. Thompson. 1980. Reconnaissance of the Quality of Surface Water in the San Rafael River Basin, Utah. U.S. Geological Survey, Open-File Report 80-574.
Narayanan, R., and D.R. Franklin. 1982. An Evaluation of Water Conservancy Techniques in the Upper Colorado River Basin. Water Resources Planning Series UWRL/P-82/07, Utah Water Research Laboratory, Logan, Utah.
Paulson, L.J. 1981. Nutrient Management with Hydroelectric Dams on the Colorado River System. Technical Report No. 8, Lake Mead Limnological Research Center, University of Nevada, Las Vegas, Nevada, 39 pp.
Paulson, L.J., and J.R. Baker. 1981. The Effects of Impoundments on Salinity in the Colorado River: Proceedings of the Symposium on the Aquatic Resources Management of the Colorado River Ecosystem, November 16-19, 1981, Las Vegas, Nevada. Ann Arbor Science, Ann Arbor, Michigan.
Paulson, L.J., and J.R. Baker. 1983. The Limnology in Reservoirs on the Colorado River. Technical Report No. 11, Lake Mead Limnological Research Center, University of Nevada, Las Vegas, Nevada.

81
Paulson, L.J., J.R. Baker, and J.E. Deacon. 1980. The Limnological Status of Lake Mead and Lake Mohave Under Present and Future Powerplant Operation of Hoover Dam. Technical Report No. 1, Lake Mead Limnological Research Center, University of Nevada, Las Vegas, Nevada.
Prentki, R.T., L.J. Paulson, and J.R. Baker. 1981. Chemical and Biological Structure of Lake Mead Sediments. Technical Report No. 6, Lake Mead Limnological Research Center, University of Nevada, Las Vegas, Nevada, 89 pp.
Rittmaster, R.L., and D.K. Mueller. 1985. Solute Loading Sources in the Dirty Devil River Basin, Utah. Bureau of Reclamation, REC-ERC-85-5, Denver, Colorado.
Robson, S.G., and G.J. Saulnier, Jr. 1981. Hydrogeochemistry and Simulated Solute Transport, Piceance Basin, Northwestern Colorado. U.S. Geological Survey, Professional Paper 1196, 65 pp.
Sandberg, G.W., and L.G. Sutlz. 1985. Reconnaissance of the Quality of Surface Water in the Upper Virgin River Basin, Utah, Arizona, and Nevada, 1981-82. Utah Department of Natural Resources, Technical Publication No. 83. Schumm, S.A., and D.I. Gregory. 1986. Diffuse-Source Salinity: Mancos Shale Terrain. U.S. Department of the Interior, Bureau of Land Management, Technical Note 373, Denver Service Center, Denver, Colorado.
Seiler, R.L., and R.L. Baskin. 1987. Hydrology of Alkali Creek and Castle Valley Ridge Coal-Lease Tracts, Central Utah, and Potential Effects of Coal Mining. U.S. Geological Survey, Water Resources Investigations Report 87-4186.
Shacklette, H.T., and J.G. Boerngen. 1984. Element Concentrations in Soils and Other Surficial Materials of the Conterminous United States. U.S. Geological Survey, Professional Paper 1270.
Shen, H.W., et al. 1981. Role of Sediment in Non-Point Source Salt Loading Within the Upper Colorado River Basin. Colorado Water Resources Research Institute Completion Report No. 107, 213 pp.
Skogerboe, G.V., and G.E. Radosevich. 1982. Future Water Development Policies. Water Supply and Management, vol. 6, No. 1-2, pp. 221-232.
Skogerboe, G.V., W.R. Walker, and R.G. Evans. 1982. Salinity Control Measures for Grand Valley. Water Supply and Management, vol. 6, No. 1-2, pp. 129-167.
Trueman, D.P. 1998. Colorado River Basin Salinity Control Program, 1998 Review. Proceedings of the Shared Rivers Conference, U.S. Committee on Irrigation and Drainage, Park City, Utah.
U.S. Department of the Interior. 1984. Aquatrain Corridor Study Report. Bureau of Reclamation, Denver, Colorado.
U.S. Environmental Protection Agency. l971. The Mineral Quality Problem in the Colorado River Basin. Summary Report. Regions VIII and IX, 65 pp.
Warner, J.W., and F.J. Heimes. 1979. A Preliminary Evaluation of Groundwater Contributions to Salinity of Streams in the Upper Colorado Basin in Colorado and Adjacent Parts of Wyoming and Utah. U.S. Geological Survey, Denver, Colorado, contract to Bureau of Land Management.
Water Resources Council. 1981. Synthetic Fuels Development in the Upper Colorado Region: Section 13(a) Water Assessment Report. Technical Report, 138 pp.

82
Whittig, L.D., et al. 1983. Salinity Investigations in West Salt Creek, Colorado. California Water Resources Center Completion Report, University of California, Davis, California, 161 pp.
Yahnke, J. 1982. Fryingpan River and Rued Reservoir Water Quality Studies. Part I, Bureau of Reclamation, Working Paper, Engineering and Research Center, Denver, Colorado.

83
APPENDIX A APPENDIX A APPENDIX A APPENDIX A –––– SALINITY DATA SALINITY DATA SALINITY DATA SALINITY DATA
The historical flow and quality of water data have been calculated using the U.S. Geological Survey (USGS) database and computer techniques developed jointly by the Bureau of Reclamation (Reclamation) and USGS. The purpose of the analysis was to develop a consistent, documented methodology for the calculation of monthly salt loads in the Colorado River Basin.
The salinity computation method was originally developed for the trend studies conducted by Reclamation and USGS (Liebermann, et al., 1986). Several procedures were evaluated. A 3-year moving regression was determined to be the best overall method in terms of providing the most complete record, preserving short-term fluctuations, and being insensitive to minor errors in the data. Using this method, daily salt load (L) was computed from discharge (Q) and when available, conductivity (S): L = aQbSc. For days without specific conductivity data, a slight variation of the equation for load as a function of discharge was used: L = a’Qb’.
The coefficients a, b, and c for each year of record were typically estimated by regression analysis using data from a 3-year period surrounding the year of interest. For example, coefficients for 1990 were derived with data from l989 through 1991. The last year of salinity data computed for this report uses 2 years of data for obvious reasons. It is subject to change and will be updated in the next report as data become available to complete the analysis for that year.
Daily loads were added to yield the monthly values given. Monthly values were then added to yield annual values. All values shown are rounded but were computed using un-rounded values.
For this analysis, salt-load data were based on total dissolved solids (TDS) as the sum of constituents, whenever possible. Sum of constituents was defined to include calcium, magnesium, sodium, chloride, sulfate, a measure of the carbonate equivalent of alkalinity and, if measured, silica and potassium. If a sum-of-constituents value could not be computed, TDS as residue on evaporation (at 180 degrees Celsius) was substituted.
Extensive error analyses were performed on the data. Suspect values were corrected according to published records or deleted. The resultant data set is considered by Reclamation and USGS to be the best available for stations in the Colorado River Basin. Annual values based on the new method were compared to values in previous Quality of Water Colorado River Basin Progress Reports for selected stations. The observed differences were between plus or minus 5 percent, with mean differences approximately zero. Changes in the progress report database can, therefore, be considered generally insignificant and unbiased.

84
Figure A-1. Colorado River Water Quality Monitoring Stations.

85 Figure A-2. Flow and TDS over time for sites 1-4. Site locations shown in figure A-1.
Green River near Green River, WyomingSite # 1
150
250
350
450
550
1940 1950 1960 1970 1980 1990 2000
TDS
(mg/
L)
0
3,000
6,000
9,000
12,000
Flow
1,0
00 (a
c-ft)
TDSFlow
Green River near Greendale, UtahSite # 2
200
300
400
500
600
1940 1950 1960 1970 1980 1990 2000
TDS
(mg/
L)
0
2,000
4,000
6,000
8,000
Flow
1,0
00 (a
c-ft)
TDSFlow
Yampa River near Maybell, ColoradoSite # 3
100
150
200
250
300
1940 1950 1960 1970 1980 1990 2000
TDS
(mg/
L)
0
3,000
6,000
9,000
12,000Fl
ow 1
,000
(ac-
ft)
TDSFlow
Duchesne River near Randlett, UtahSite # 4
0
300
600
900
1200
1500
1940 1950 1960 1970 1980 1990 2000
TDS
(mg/
L)
0
1500
3000
4500
6000
7500
Flow
1,0
00 (a
c-ft)
TDSFlow

86
White River near Watson, UtahSite # 5
250
350
450
550
650
1940 1950 1960 1970 1980 1990 2000
TDS
(mg/
L)
0
1000
2000
3000
4000
Flow
1,0
00 (a
c-ft)
TDSFlow
Green River at Green River, UtahSite # 6
250
350
450
550
650
1940 1950 1960 1970 1980 1990 2000
TDS
(mg/
L)
0
8,000
16,000
24,000
32,000
Flow
1,0
00 (a
c-ft)
TDSFlow
San Rafael River near Green River, UtahSite # 7
0
500
1,000
1,500
2,000
2,500
3,000
3,500
1940 1950 1960 1970 1980 1990 2000
TDS
(mg/
L)
0
300
600
900
1200
1500
1800
2100Fl
ow 1
,000
(ac-
ft)TDSFlow
Colorado R. near Glenw ood Springs, COSite # 8
50
150
250
350
450
1940 1950 1960 1970 1980 1990 2000
TDS
(mg/
L)
0
3,000
6,000
9,000
12,000
Flow
1,0
00 (a
c-ft)
TDSFlow
Figure A-3. Flow and TDS over time for sites 5-8. Site locations shown in figure A-1.

87
Colorado River near Cameo, Colorado
Site # 9
150
250
350
450
550
650
1940 1950 1960 1970 1980 1990 2000
TDS
(mg/
L)
0
5,000
10,000
15,000
20,000
25,000
Flow
1,0
00 (a
c-ft)
TDS Flow
Gunnison River near Grand Junction, ColoradoSite # 10
100
300
500
700
900
1100
1300
1940 1950 1960 1970 1980 1990 2001
TDS
(mg/
L)
0
4,000
8,000
12,000
16,000
20,000
24,000
Flow
1,0
00 (a
c-ft)
TDSFlow
Dolores River near Cisco, UtahSite # 11
0
500
1000
1500
2000
2500
1940 1950 1960 1970 1980 1990 2001
TDS
(mg/
L)
0
3,000
6,000
9,000
12,000
15,000Fl
ow 1
,000
(ac-
ft)TDSFlow
Colorado River near Cisco, UtahSite # 12
100
400
700
1000
1300
1940 1950 1960 1970 1980 1990 2000
TDS
(mg/
L)
0
15,000
30,000
45,000
60,000
Flow
1,0
00 (a
c-ft)
TDS Flow
Figure A-4. Flow and TDS over time for sites 9-12. Site locations shown in figure A-1.

88
San Juan River near Archuleta, New MexicoSite # 13
0
50
100
150
200
250
1940 1950 1960 1970 1980 1990 2000
TDS
(mg/
L)
0
1,000
2,000
3,000
4,000
5,000
Flow
1,0
00 (a
c-ft)
TDSFlow
San Juan River near Bluff , UtahSite # 14
0
200
400
600
800
1940 1950 1960 1970 1980 1990 2000
TDS
(mg/
L)
0
4,000
8,000
12,000
16,000
Flow
1,0
00 (a
c-ft)
TDSFlow
Colorado River at Lees Ferry, ArizonaSite # 15
200
400
600
800
1000
1940 1950 1960 1970 1980 1990 2000
TDS
(mg/
L)
0
20,000
40,000
60,000
80,000Fl
ow 1
,000
(ac-
ft)TDSFlow
Colorado River near Grand Canyon, ArizonaSite # 16
200
400
600
800
1000
1200
1940 1950 1960 1970 1980 1990 2000
TDS
(mg/
L)
0
20,000
40,000
60,000
80,000
100,000
Flow
1,0
00 (a
c-ft)
TDSFlow
Figure A-5. Flow and TDS over time for sites 13-16. Site locations shown in figure A-1.
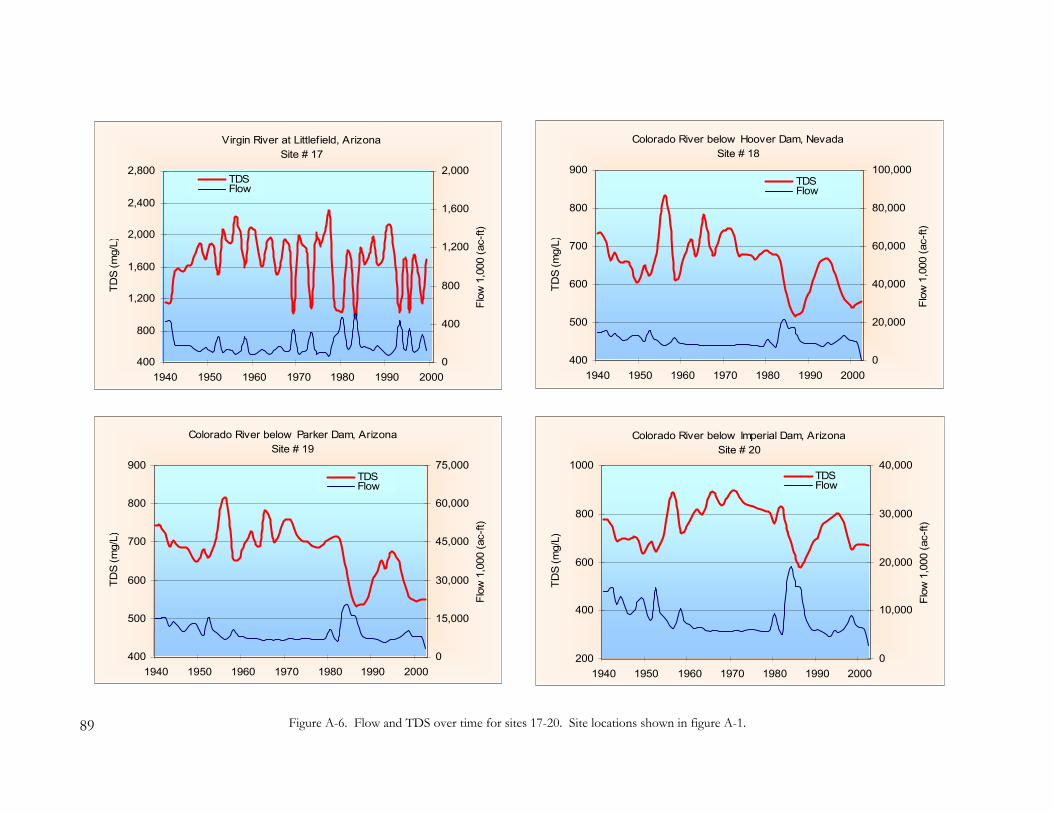
89
Virgin River at Littlefield, ArizonaSite # 17
400
800
1,200
1,600
2,000
2,400
2,800
1940 1950 1960 1970 1980 1990 2000
TDS
(mg/
L)
0
400
800
1,200
1,600
2,000
Flow
1,0
00 (a
c-ft)
TDSFlow
Colorado River below Hoover Dam, NevadaSite # 18
400
500
600
700
800
900
1940 1950 1960 1970 1980 1990 2000
TDS
(mg/
L)
0
20,000
40,000
60,000
80,000
100,000
Flow
1,0
00 (a
c-ft)
TDSFlow
Colorado River below Parker Dam, ArizonaSite # 19
400
500
600
700
800
900
1940 1950 1960 1970 1980 1990 2000
TDS
(mg/
L)
0
15,000
30,000
45,000
60,000
75,000Fl
ow 1
,000
(ac-
ft)TDSFlow
Colorado River below Imperial Dam, ArizonaSite # 20
200
400
600
800
1000
1940 1950 1960 1970 1980 1990 2000
TDS
(mg/
L)
0
10,000
20,000
30,000
40,000
Flow
1,0
00 (a
c-ft)
TDSFlow
Figure A-6. Flow and TDS over time for sites 17-20. Site locations shown in figure A-1.