Quality of Service Report: Gauteng -...
19
0 | Page Dr SS Mncube (Chairperson), NA Batyi, WH Currie, JM Lebooa, TLV Makhakhe, N Ndhlovu, FK Sibanda, Dr MM Socikwa, WF Stucke (Councillors), TTC Dlamini (CEO) Independent Communications Authority of South Africa Pinmill Farm, 164 Katherine Street, Sandton Private Bag X10002, Sandton, 2146 Quality of Service Report: Gauteng June 2011
Transcript of Quality of Service Report: Gauteng -...
0 | P a g e
Dr SS Mncube (Chairperson), NA Batyi, WH Currie, JM Lebooa, TLV Makhakhe, N Ndhlovu, FK Sibanda, Dr MM Socikwa, WF Stucke (Councillors), TTC Dlamini (CEO)
Independent Communications Authority of South Africa Pinmill Farm, 164 Katherine Street, Sandton
Private Bag X10002, Sandton, 2146
Quality of Service Report:
Gauteng
June 2011
1 | P a g e
Dr SS Mncube (Chairperson), NA Batyi, WH Currie, JM Lebooa, TLV Makhakhe, N Ndhlovu, FK Sibanda, Dr MM Socikwa, WF Stucke (Councillors), TTC Dlamini (CEO)
Contents
Abbreviations ..................................................................................................................................................................... 2
Definitions .......................................................................................................................................................................... 3
1. Introduction ............................................................................................................................................................... 4
1.1 Background........................................................................................................................................................ 4
1.2 Objectives .......................................................................................................................................................... 6
2. Methodology .............................................................................................................................................................. 6
2.1 Drive Tests Methodology .................................................................................................................................. 7
2.2 Computational Methodology ........................................................................................................................... 8
3. Results and Analysis ................................................................................................................................................... 9
4. Conclusion ................................................................................................................................................................ 18
2 | P a g e
Dr SS Mncube (Chairperson), NA Batyi, WH Currie, JM Lebooa, TLV Makhakhe, N Ndhlovu, FK Sibanda, Dr MM Socikwa, WF Stucke (Councillors), TTC Dlamini (CEO)
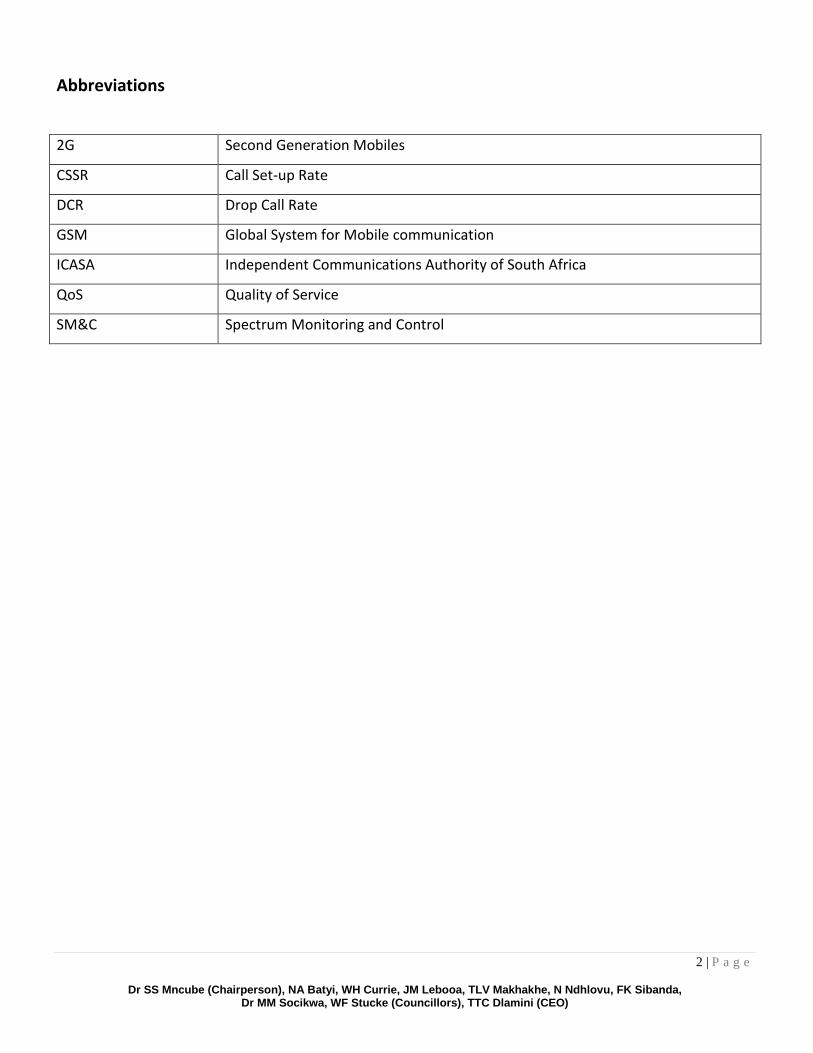
Abbreviations
2G Second Generation Mobiles
CSSR Call Set-up Rate
DCR Drop Call Rate
GSM Global System for Mobile communication
ICASA Independent Communications Authority of South Africa
QoS Quality of Service
SM&C Spectrum Monitoring and Control
3 | P a g e
Dr SS Mncube (Chairperson), NA Batyi, WH Currie, JM Lebooa, TLV Makhakhe, N Ndhlovu, FK Sibanda, Dr MM Socikwa, WF Stucke (Councillors), TTC Dlamini (CEO)
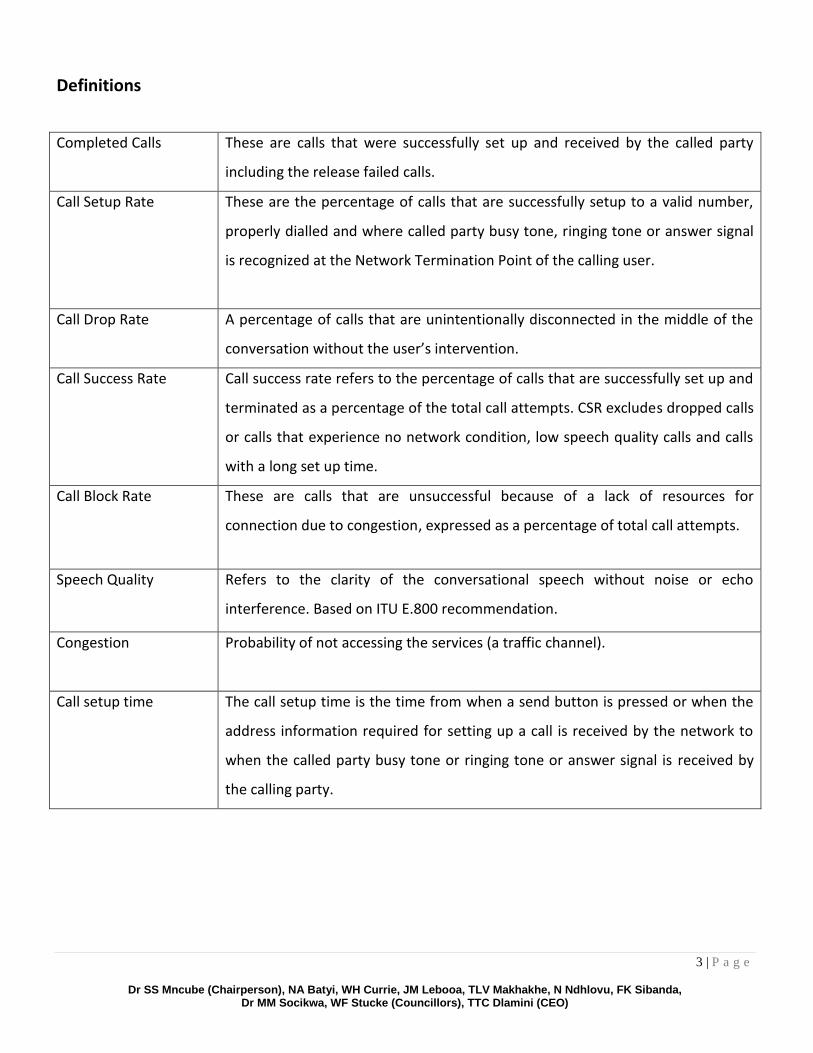
Definitions
Completed Calls
These are calls that were successfully set up and received by the called party
including the release failed calls.
Call Setup Rate
These are the percentage of calls that are successfully setup to a valid number,
properly dialled and where called party busy tone, ringing tone or answer signal
is recognized at the Network Termination Point of the calling user.
Call Drop Rate
A percentage of calls that are unintentionally disconnected in the middle of the
conversation without the user’s intervention.
Call Success Rate
Call success rate refers to the percentage of calls that are successfully set up and
terminated as a percentage of the total call attempts. CSR excludes dropped calls
or calls that experience no network condition, low speech quality calls and calls
with a long set up time.
Call Block Rate
These are calls that are unsuccessful because of a lack of resources for
connection due to congestion, expressed as a percentage of total call attempts.
Speech Quality
Refers to the clarity of the conversational speech without noise or echo
interference. Based on ITU E.800 recommendation.
Congestion
Probability of not accessing the services (a traffic channel).
Call setup time
The call setup time is the time from when a send button is pressed or when the
address information required for setting up a call is received by the network to
when the called party busy tone or ringing tone or answer signal is received by
the calling party.
4 | P a g e
Dr SS Mncube (Chairperson), NA Batyi, WH Currie, JM Lebooa, TLV Makhakhe, N Ndhlovu, FK Sibanda, Dr MM Socikwa, WF Stucke (Councillors), TTC Dlamini (CEO)
1. Introduction
1.1 Background
The Independent Communications Authority of South Africa has a critical mandate to protect the
interest of electronics communications services consumers as stated in the Electronics Communication
Act 2000.
Previously, the Authority relied on operators’ returns on QoS performance reports, as that was dictated
by the End-User Service Charter Regulations of 2009. It was however noted that the self-assessment
submissions were not consistent with customer’s experience. That led to the initiation of a Quality of
Service Monitoring Unit within Spectrum Monitoring and Control (SM&C). QoS is defined as the
collective effect of service performance which determines the degree of satisfaction of a user of the
service. It refers to the capability of a network to provide better service to selected network traffic over
various technologies.
The SM&C has conducted monitoring of Cell-C, MTN and Vodacom’s networks in the Gauteng region.
The monitoring measurements were taken in the period from 10/11/2010 to 15/11/2010.
The object of these QoS tests is to obtain a snapshot of an operator’s network performance from the
user’s point of view. The Authority has measured the QoS of MTN, Vodacom and Cell-C using the TEMS
Investigation Tool (version 10.1) supplied by Ascom.
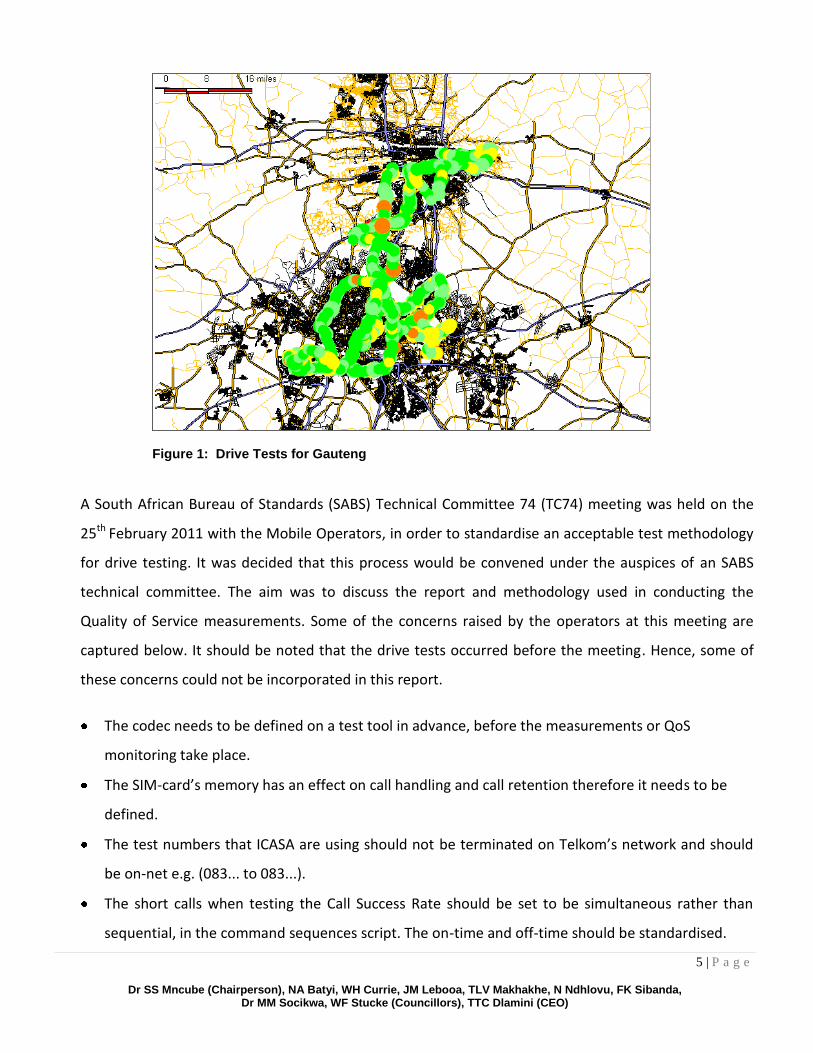
As the aim of the survey was to assess the QoS provided by the mobile operators as perceived by the
user, ICASA selected predominantly urban areas and major road arteries. The maps of the tested areas
and routes are shown below:
5 | P a g e
Dr SS Mncube (Chairperson), NA Batyi, WH Currie, JM Lebooa, TLV Makhakhe, N Ndhlovu, FK Sibanda, Dr MM Socikwa, WF Stucke (Councillors), TTC Dlamini (CEO)
Figure 1: Drive Tests for Gauteng
A South African Bureau of Standards (SABS) Technical Committee 74 (TC74) meeting was held on the
25th February 2011 with the Mobile Operators, in order to standardise an acceptable test methodology
for drive testing. It was decided that this process would be convened under the auspices of an SABS
technical committee. The aim was to discuss the report and methodology used in conducting the
Quality of Service measurements. Some of the concerns raised by the operators at this meeting are
captured below. It should be noted that the drive tests occurred before the meeting. Hence, some of
these concerns could not be incorporated in this report.
The codec needs to be defined on a test tool in advance, before the measurements or QoS
monitoring take place.
The SIM-card’s memory has an effect on call handling and call retention therefore it needs to be
defined.
The test numbers that ICASA are using should not be terminated on Telkom’s network and should
be on-net e.g. (083... to 083...).
The short calls when testing the Call Success Rate should be set to be simultaneous rather than
sequential, in the command sequences script. The on-time and off-time should be standardised.
6 | P a g e
Dr SS Mncube (Chairperson), NA Batyi, WH Currie, JM Lebooa, TLV Makhakhe, N Ndhlovu, FK Sibanda, Dr MM Socikwa, WF Stucke (Councillors), TTC Dlamini (CEO)
The duration (on and off time) of long and short calls should be defined. The measurements of both
should not be saved under one log file.
The antenna length and spacing between antennas (when conducting the measurements) should be
set according to ITU specifications.
Network Coverage measurements should be based on Propagation and Prediction Models
1.2 Objectives
The objectives of QoS Monitoring were:
a) To assess the quality of the mobile networks as experienced by a user driving the selected route. It
should be noted that there are several variables that affect the results obtained, and these results
do not attempt to provide an overall view of the network. The objective of these tests was to
simulate a user driving the selected route at a random date and time.
b) The tests are also not intended to be benchmark tests; rather they intend to provide valuable
insight on the operator’s network during the period under test.
c) The core network performance criteria that were tested were Accessibility and Retainability.
2. Methodology
Measurements were taken in the period from 10/11/2010 to 15/11/2010. A total of 419 test calls were
made along the test route over in 10 days covering a distance of 2000 km. Only voice 2G or GSM
measurements were performed, the mixture of Long calls and Short call were conducted. The Long Calls
are used to measure the call’s Retainability, the duration for the call is not defined and the call is
maintained until it drops. Short Calls are used to measure the call’s Accessibility and the duration is
defined (10 -15 s).
The technical and methodological procedure followed here has a direct influence on the results, and
therefore should be taken into account when analysing the results. The following aspects are particularly
important:
7 | P a g e
Dr SS Mncube (Chairperson), NA Batyi, WH Currie, JM Lebooa, TLV Makhakhe, N Ndhlovu, FK Sibanda, Dr MM Socikwa, WF Stucke (Councillors), TTC Dlamini (CEO)
The terminal equipment used was dual band with EFR. User terminal equipment that does not have
these characteristics can reasonably be expected to obtain network performance which is poorer
than the results of the survey suggest;
The equipment used for testing was the TEMS Investigation 10.2, HP Elite Book 8440p and Ericsson
Mobiles;
The testing equipment used was automatic, eliminating the subjectivity inherent to the human user
and ensuring equality of assessment conditions for all 3 network operators targeted by the QoS
monitoring. The test equipment was set to full rate codec;
Tests were carried out from moving vehicles with roof mounted antennas (the antenna spacing was
not set);
Our results do not permit us to extend conclusions for long calls because the duration of the long
calls were not defined and standard. The ability of the networks to sustain uninterrupted
conversation for longer calls will be assessed in a futures QoS monitoring;
The results of the QoS monitoring reflect only the behaviour of the networks at the place and the
time measurements were taken. It is understood that traffic volumes vary throughout the day,
which affect the performance of the network. However these tests were designed to measure the
operator performance randomly;
Mobile to fixed calls were chosen for the test scenario. However, only parameters of the Radio
Access Network of the operator under test were measured;
64K test SIM-cards were used during the testing;
The measurements focused on the following network parameters:
(i) Dropped Call Rate (DCR);
(ii) Call Set-up Success Rate (CSSR);
(iii) Signal Strength.
2.1 Drive Tests Methodology
Drive testing is the most common and possibly the best way to analyse Network performance by means of
coverage evaluation, system availability, network capacity, network retainability and call quality. Although
these tests only provide data on the downlink side of the process, it provides a perspective to the service
8 | P a g e
Dr SS Mncube (Chairperson), NA Batyi, WH Currie, JM Lebooa, TLV Makhakhe, N Ndhlovu, FK Sibanda, Dr MM Socikwa, WF Stucke (Councillors), TTC Dlamini (CEO)
provider about what’s happening from a subscriber point of view. The drive testing is basically collecting
measurement data with drive test equipment.
The Drive Test equipment consists of:
TEMS Investigation Software
Maps of South Africa
TEMS phones
GPS
Laptops
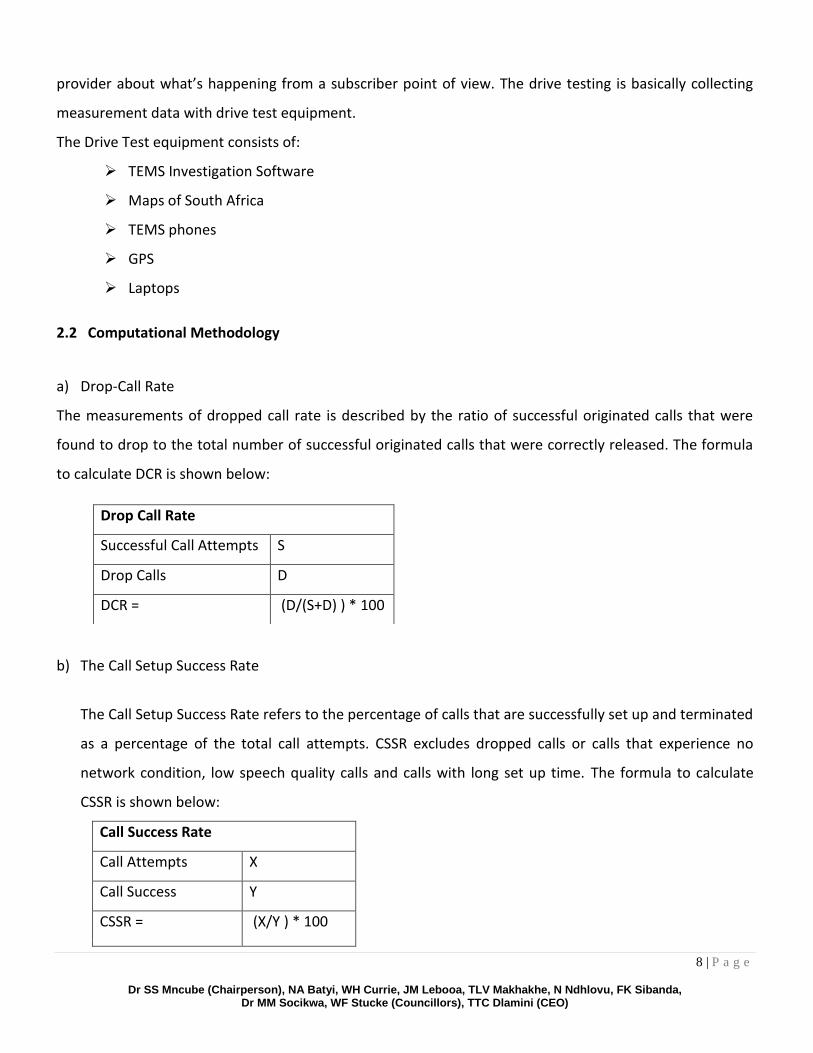
2.2 Computational Methodology
a) Drop-Call Rate
The measurements of dropped call rate is described by the ratio of successful originated calls that were
found to drop to the total number of successful originated calls that were correctly released. The formula
to calculate DCR is shown below:
b) The Call Setup Success Rate
The Call Setup Success Rate refers to the percentage of calls that are successfully set up and terminated
as a percentage of the total call attempts. CSSR excludes dropped calls or calls that experience no
network condition, low speech quality calls and calls with long set up time. The formula to calculate
CSSR is shown below:
Call Success Rate
Call Attempts X
Call Success Y
CSSR = (X/Y ) * 100
Drop Call Rate
Successful Call Attempts S
Drop Calls D
DCR = (D/(S+D) ) * 100
9 | P a g e
Dr SS Mncube (Chairperson), NA Batyi, WH Currie, JM Lebooa, TLV Makhakhe, N Ndhlovu, FK Sibanda, Dr MM Socikwa, WF Stucke (Councillors), TTC Dlamini (CEO)
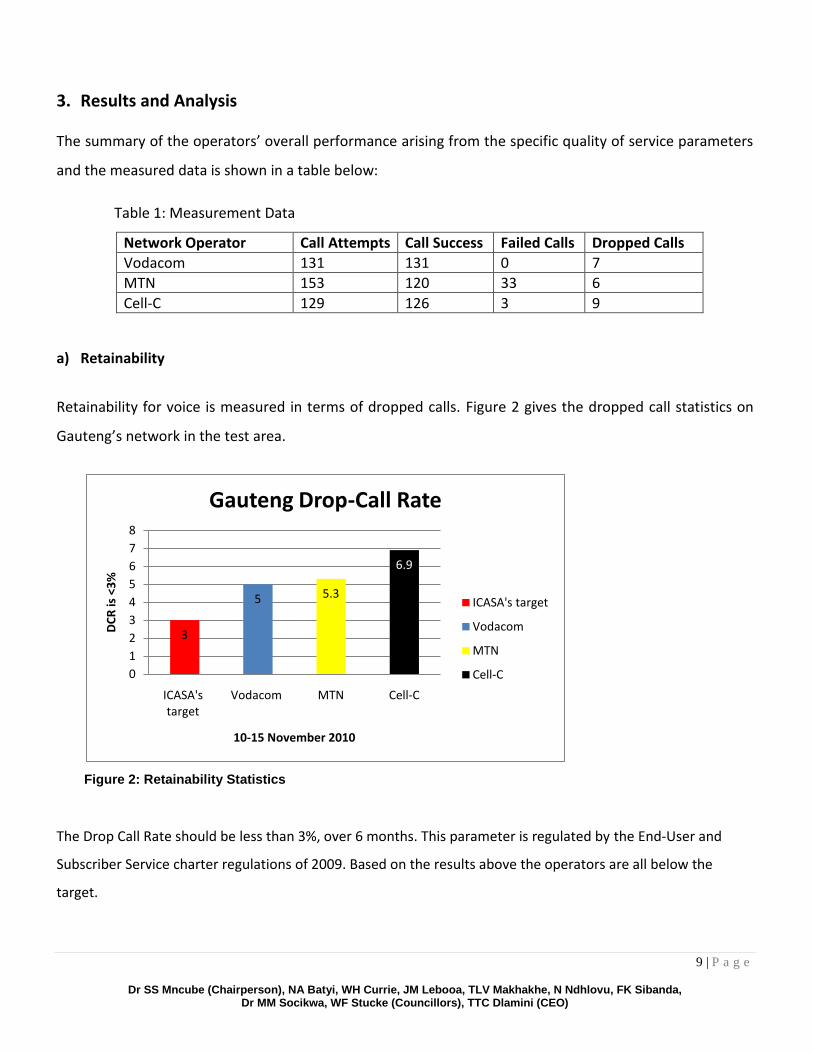
3. Results and Analysis The summary of the operators’ overall performance arising from the specific quality of service parameters
and the measured data is shown in a table below:
Table 1: Measurement Data
Network Operator Call Attempts Call Success Failed Calls Dropped Calls
Vodacom 131 131 0 7
MTN 153 120 33 6
Cell-C 129 126 3 9
a) Retainability
Retainability for voice is measured in terms of dropped calls. Figure 2 gives the dropped call statistics on
Gauteng’s network in the test area.
Figure 2: Retainability Statistics
The Drop Call Rate should be less than 3%, over 6 months. This parameter is regulated by the End-User and
Subscriber Service charter regulations of 2009. Based on the results above the operators are all below the
target.
3
5 5.3
6.9
0
1
2
3
4
5
6
7
8
ICASA's target
Vodacom MTN Cell-C
DC
R is
<3
%
10-15 November 2010
Gauteng Drop-Call Rate
ICASA's target
Vodacom
MTN
Cell-C
10 | P a g e
Dr SS Mncube (Chairperson), NA Batyi, WH Currie, JM Lebooa, TLV Makhakhe, N Ndhlovu, FK Sibanda, Dr MM Socikwa, WF Stucke (Councillors), TTC Dlamini (CEO)
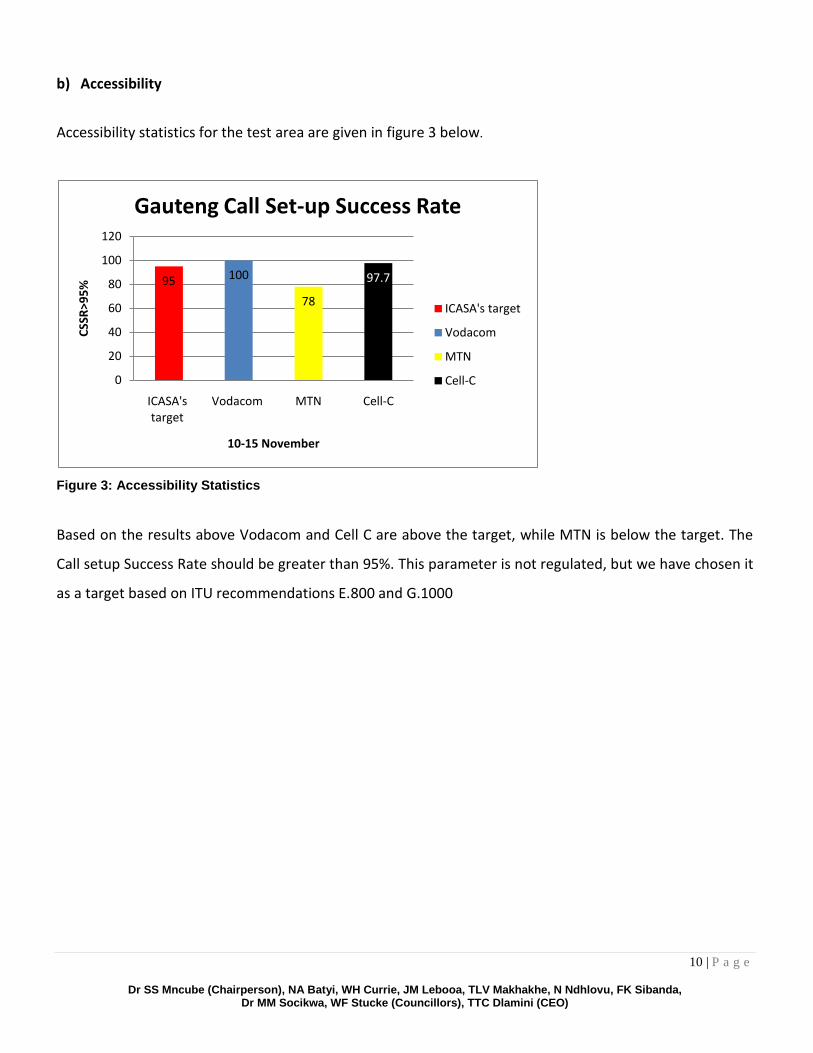
b) Accessibility
Accessibility statistics for the test area are given in figure 3 below.
Figure 3: Accessibility Statistics
Based on the results above Vodacom and Cell C are above the target, while MTN is below the target. The
Call setup Success Rate should be greater than 95%. This parameter is not regulated, but we have chosen it
as a target based on ITU recommendations E.800 and G.1000
95 100
78
97.7
0
20
40
60
80
100
120
ICASA's target
Vodacom MTN Cell-C
CSS
R>9
5%
10-15 November
Gauteng Call Set-up Success Rate
ICASA's target
Vodacom
MTN
Cell-C
11 | P a g e
Dr SS Mncube (Chairperson), NA Batyi, WH Currie, JM Lebooa, TLV Makhakhe, N Ndhlovu, FK Sibanda, Dr MM Socikwa, WF Stucke (Councillors), TTC Dlamini (CEO)
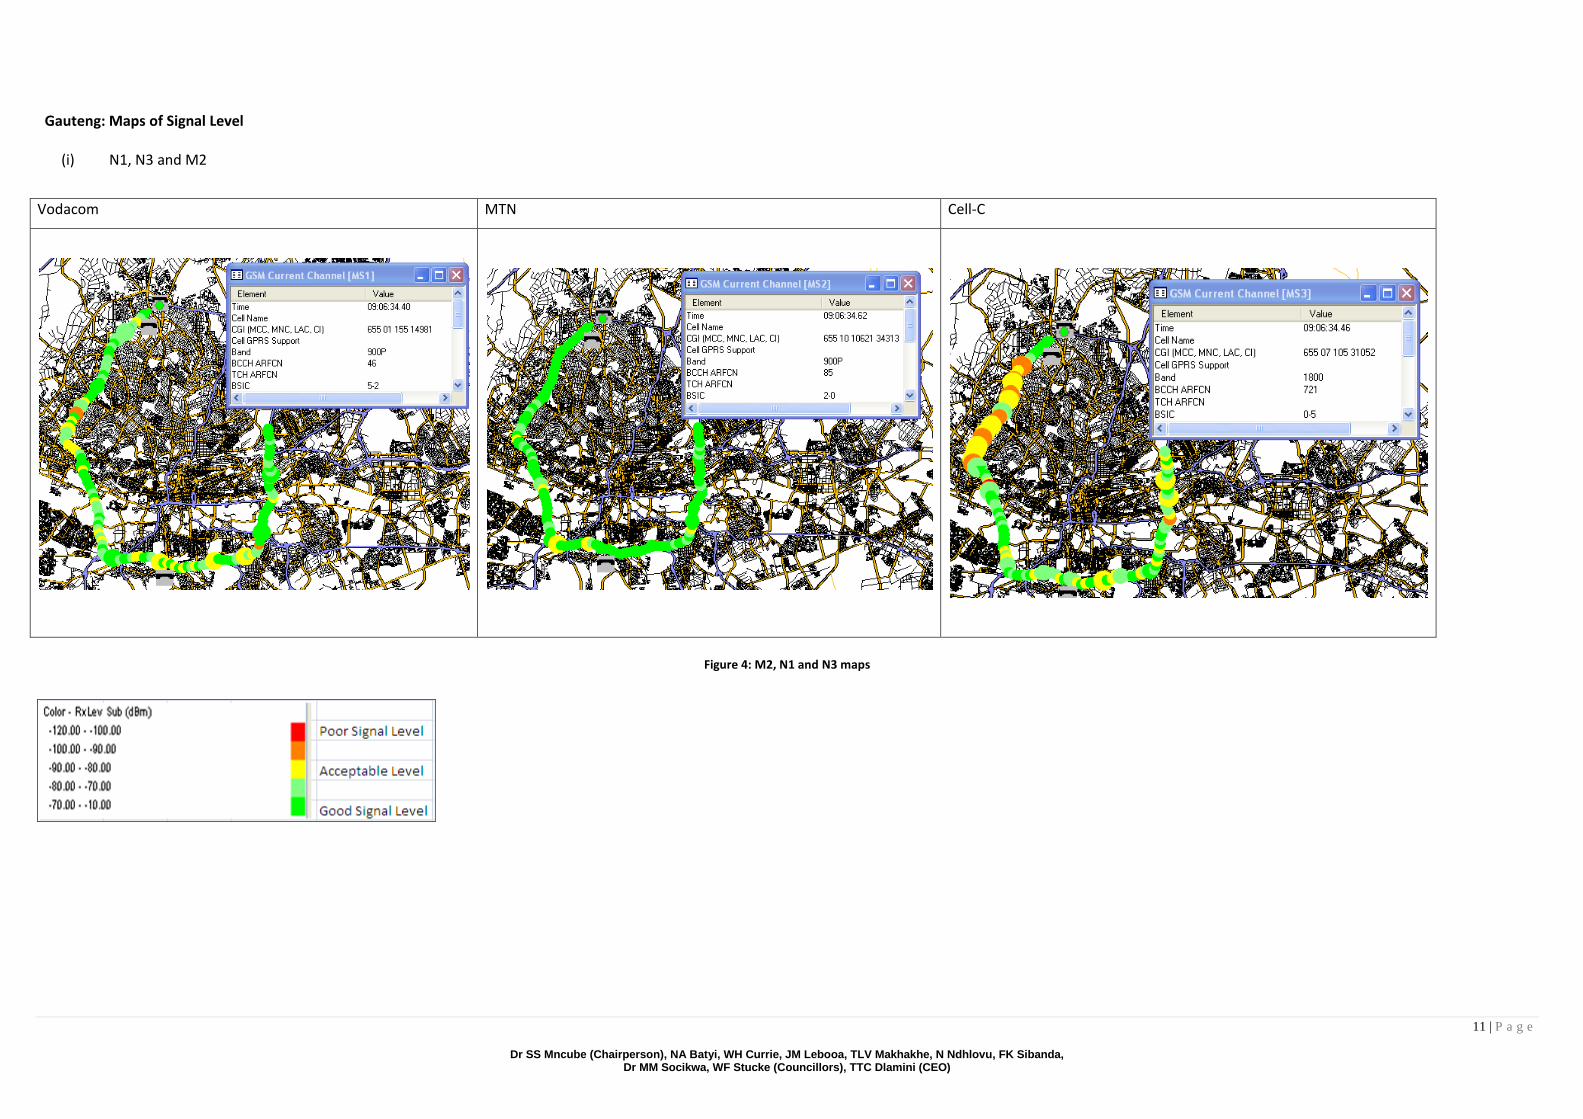
Gauteng: Maps of Signal Level
(i) N1, N3 and M2
Vodacom MTN Cell-C
Figure 4: M2, N1 and N3 maps
12 | P a g e
Dr SS Mncube (Chairperson), NA Batyi, WH Currie, JM Lebooa, TLV Makhakhe, N Ndhlovu, FK Sibanda, Dr MM Socikwa, WF Stucke (Councillors), TTC Dlamini (CEO)
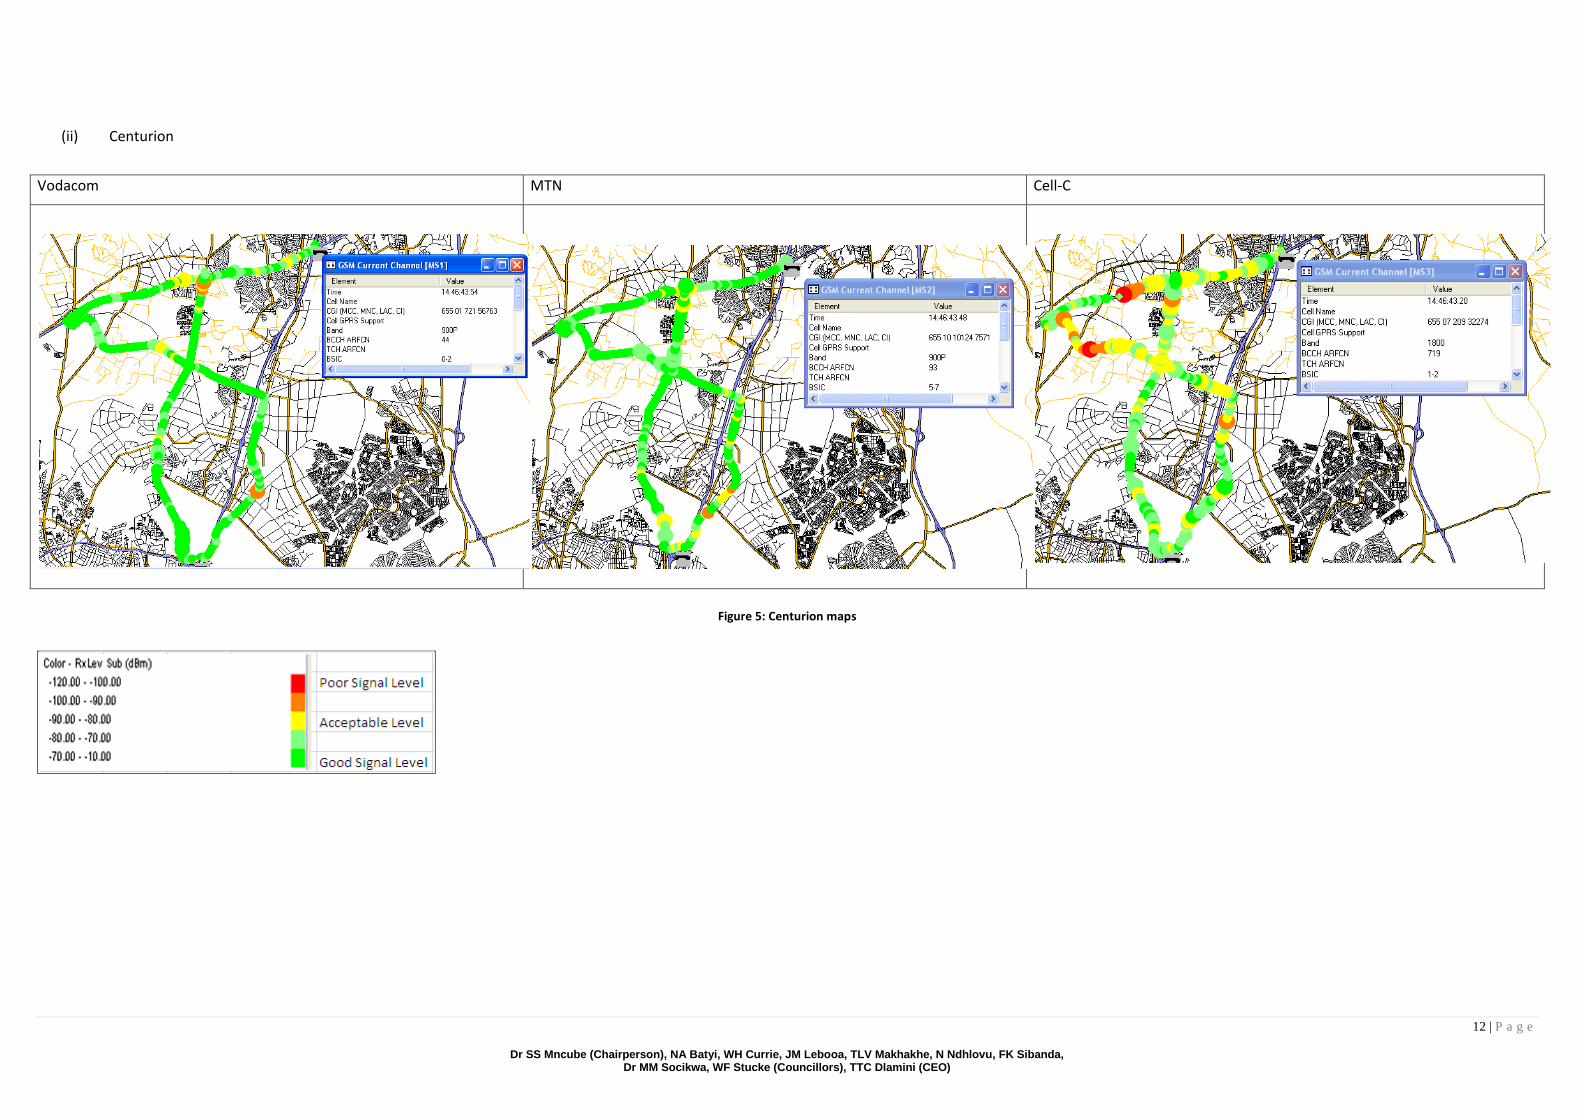
(ii) Centurion
Vodacom MTN Cell-C
Figure 5: Centurion maps
13 | P a g e
Dr SS Mncube (Chairperson), NA Batyi, WH Currie, JM Lebooa, TLV Makhakhe, N Ndhlovu, FK Sibanda, Dr MM Socikwa, WF Stucke (Councillors), TTC Dlamini (CEO)
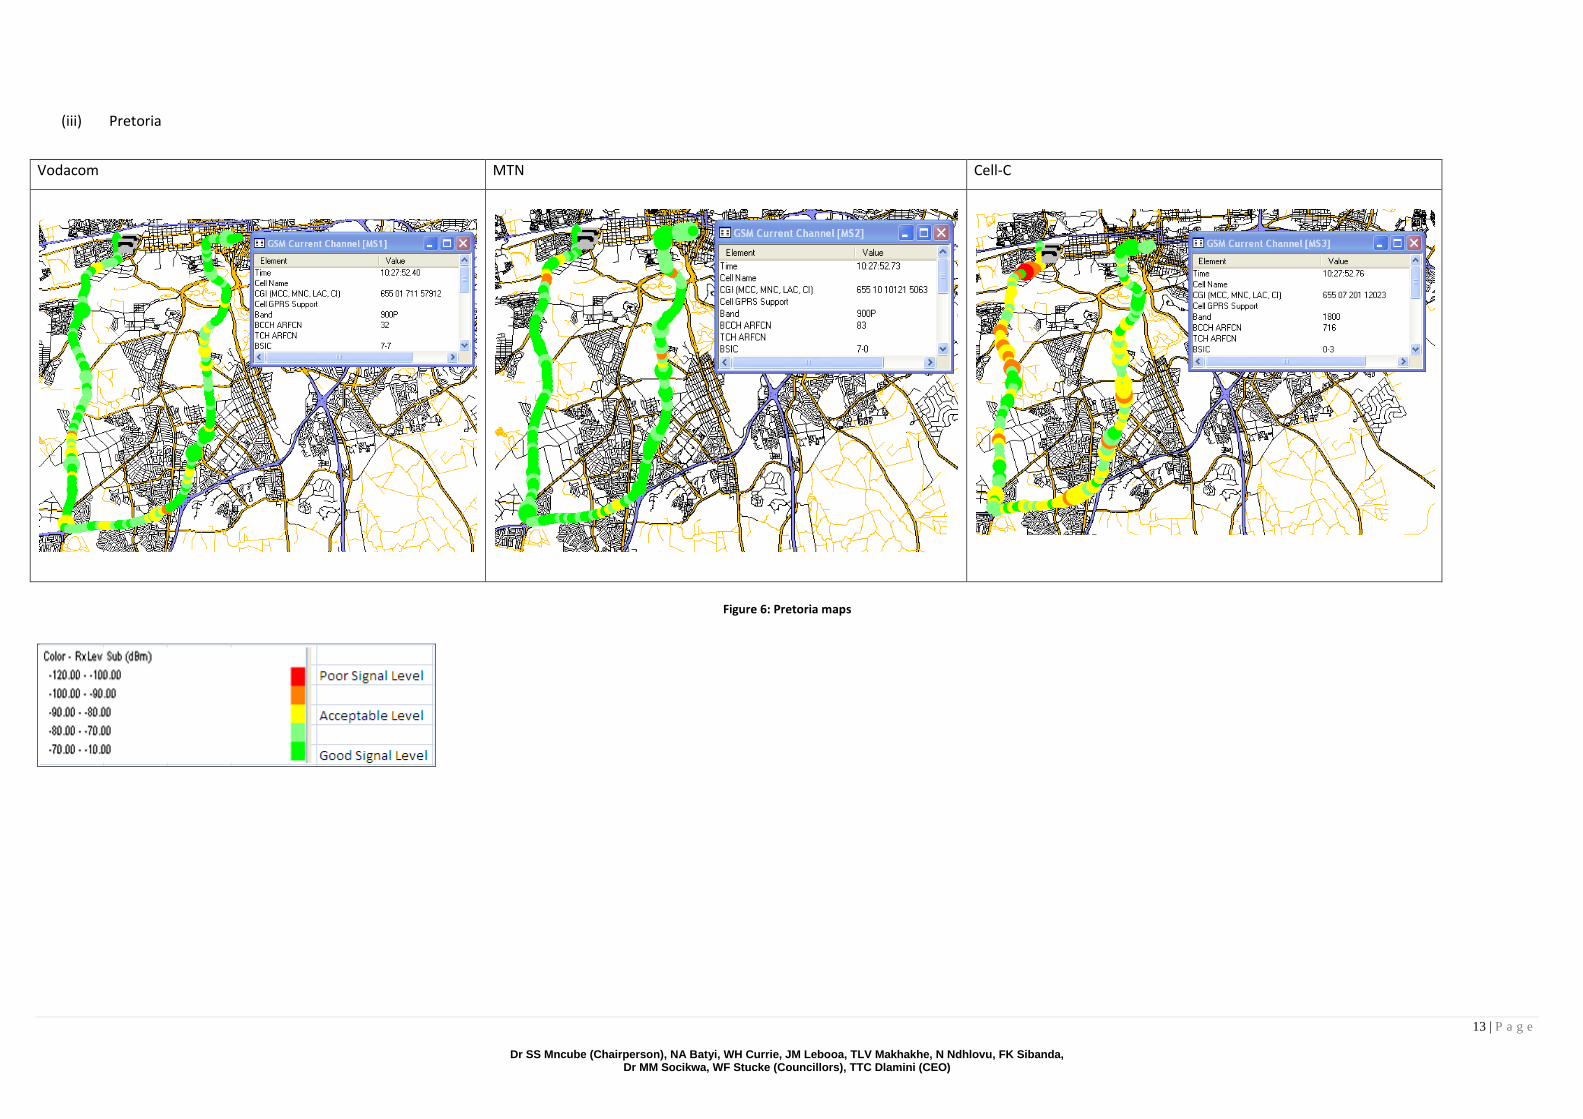
(iii) Pretoria
Vodacom MTN Cell-C
Figure 6: Pretoria maps
14 | P a g e
Dr SS Mncube (Chairperson), NA Batyi, WH Currie, JM Lebooa, TLV Makhakhe, N Ndhlovu, FK Sibanda, Dr MM Socikwa, WF Stucke (Councillors), TTC Dlamini (CEO)
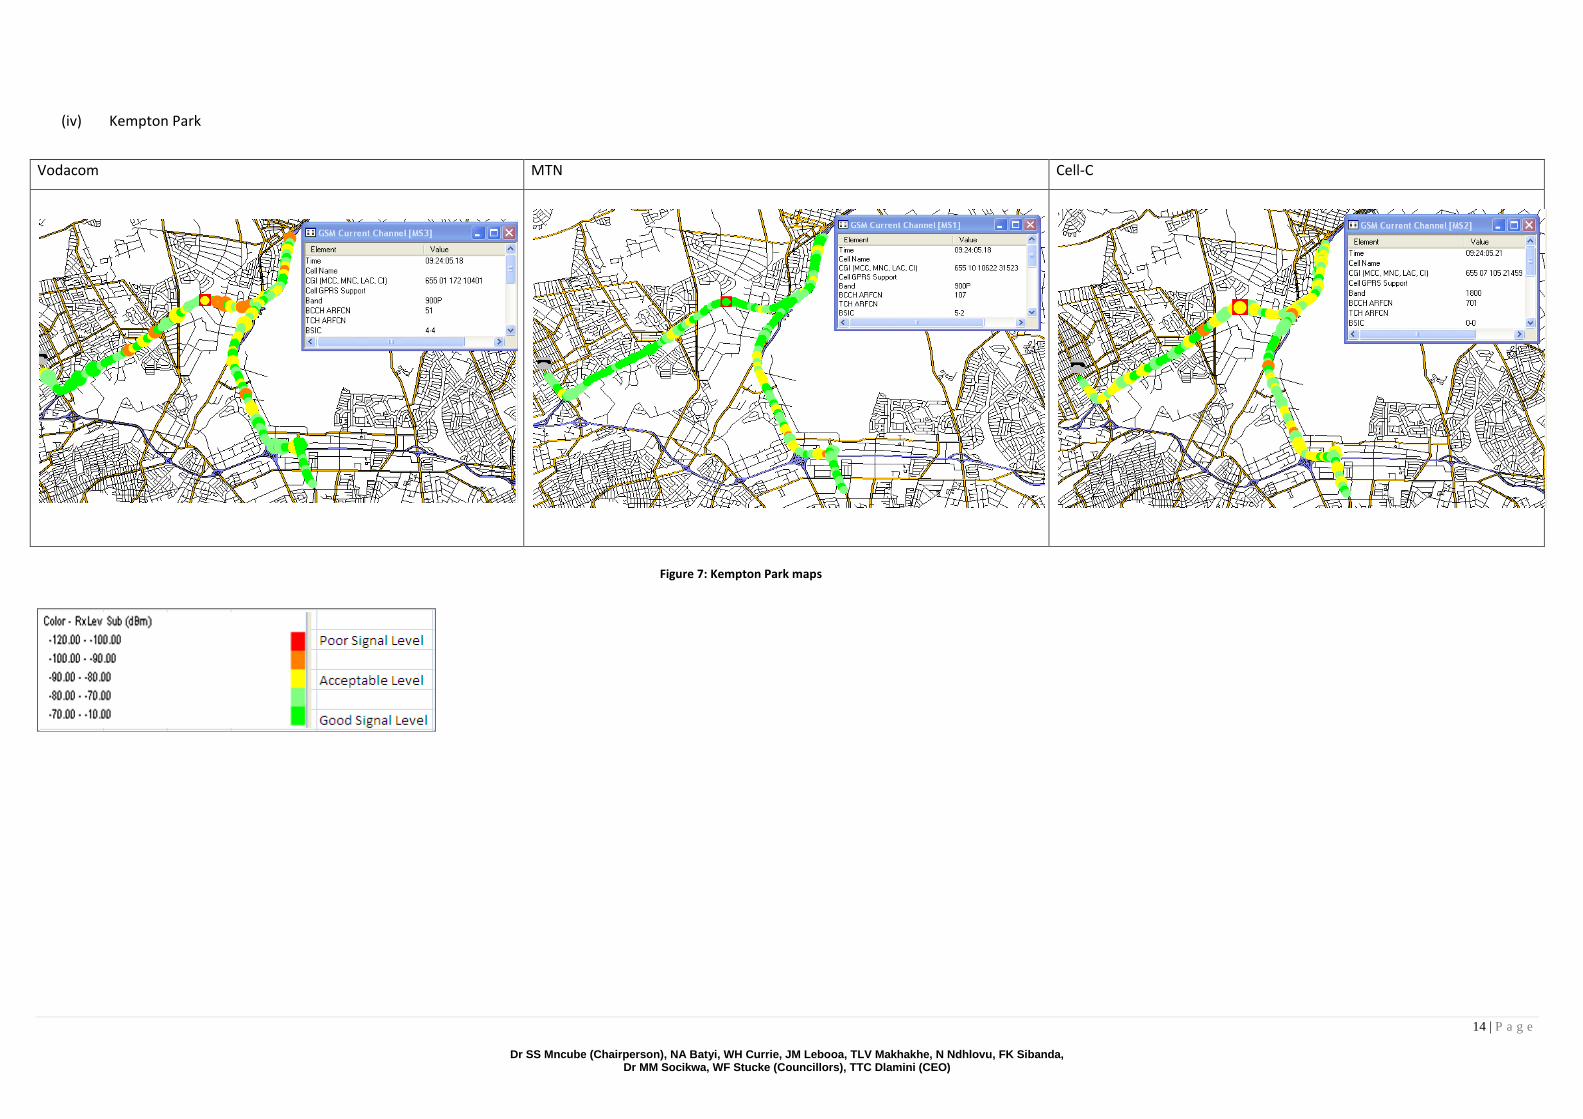
(iv) Kempton Park
Vodacom MTN Cell-C
Figure 7: Kempton Park maps
15 | P a g e
Dr SS Mncube (Chairperson), NA Batyi, WH Currie, JM Lebooa, TLV Makhakhe, N Ndhlovu, FK Sibanda, Dr MM Socikwa, WF Stucke (Councillors), TTC Dlamini (CEO)
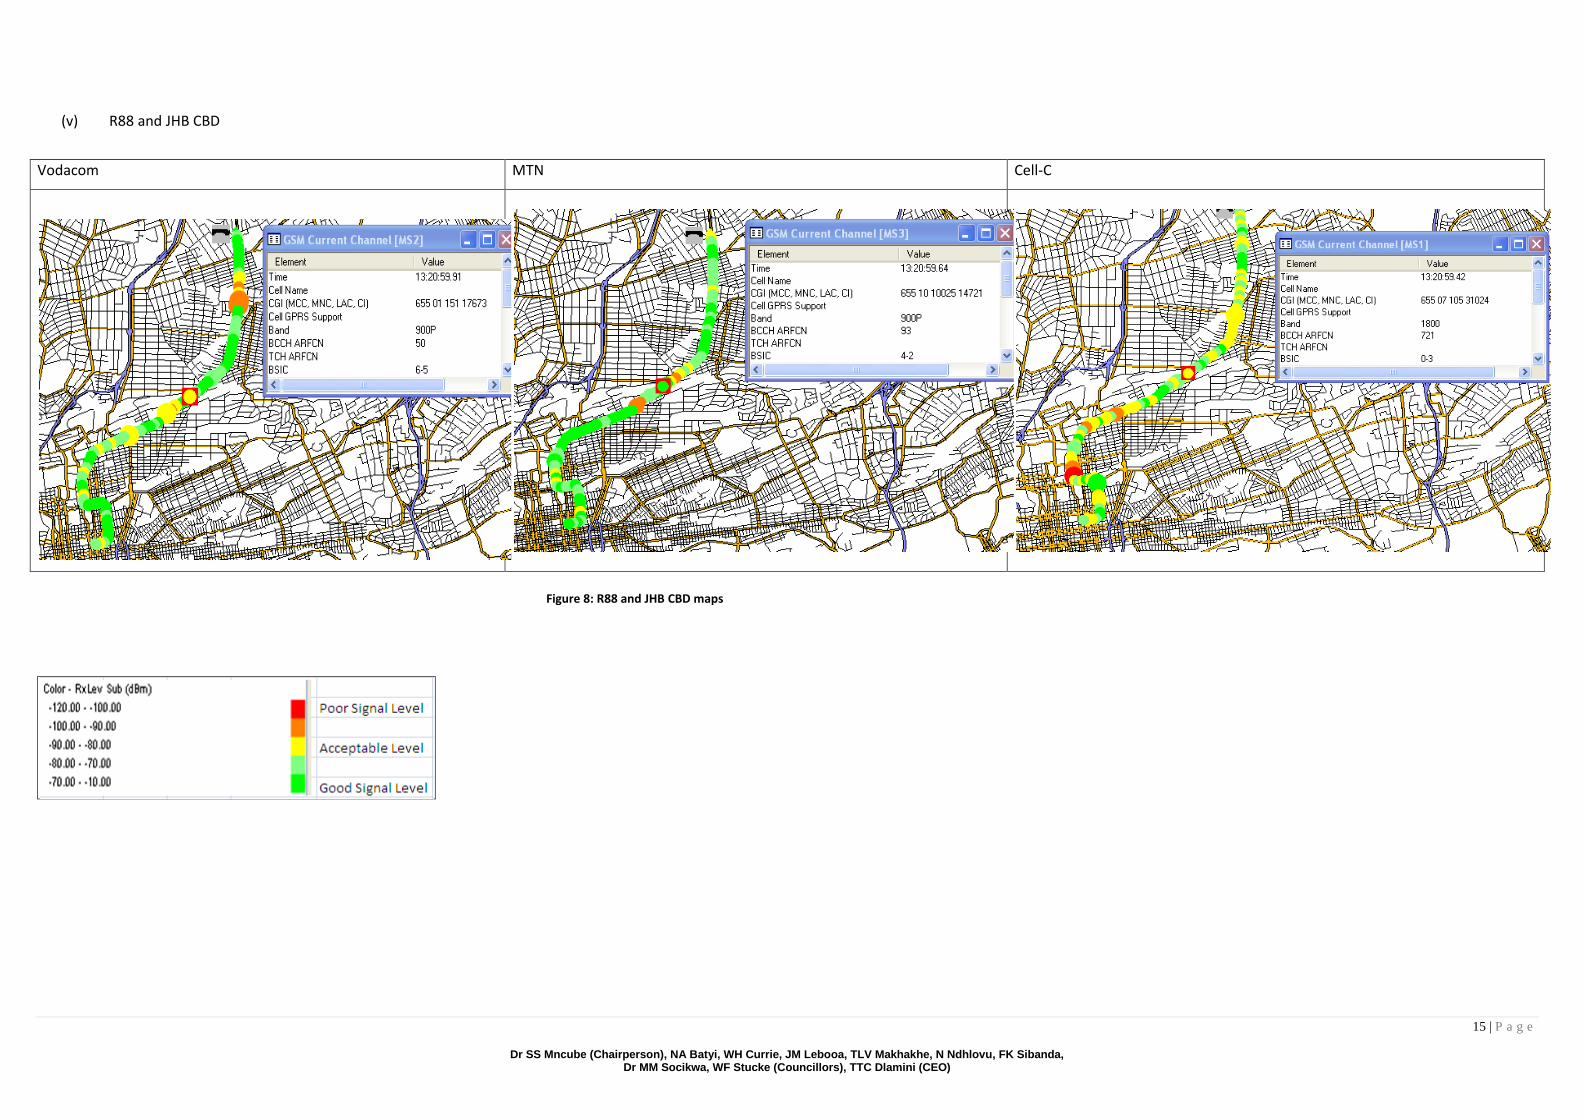
(v) R88 and JHB CBD
Vodacom MTN Cell-C
Figure 8: R88 and JHB CBD maps
16 | P a g e
Dr SS Mncube (Chairperson), NA Batyi, WH Currie, JM Lebooa, TLV Makhakhe, N Ndhlovu, FK Sibanda, Dr MM Socikwa, WF Stucke (Councillors), TTC Dlamini (CEO)
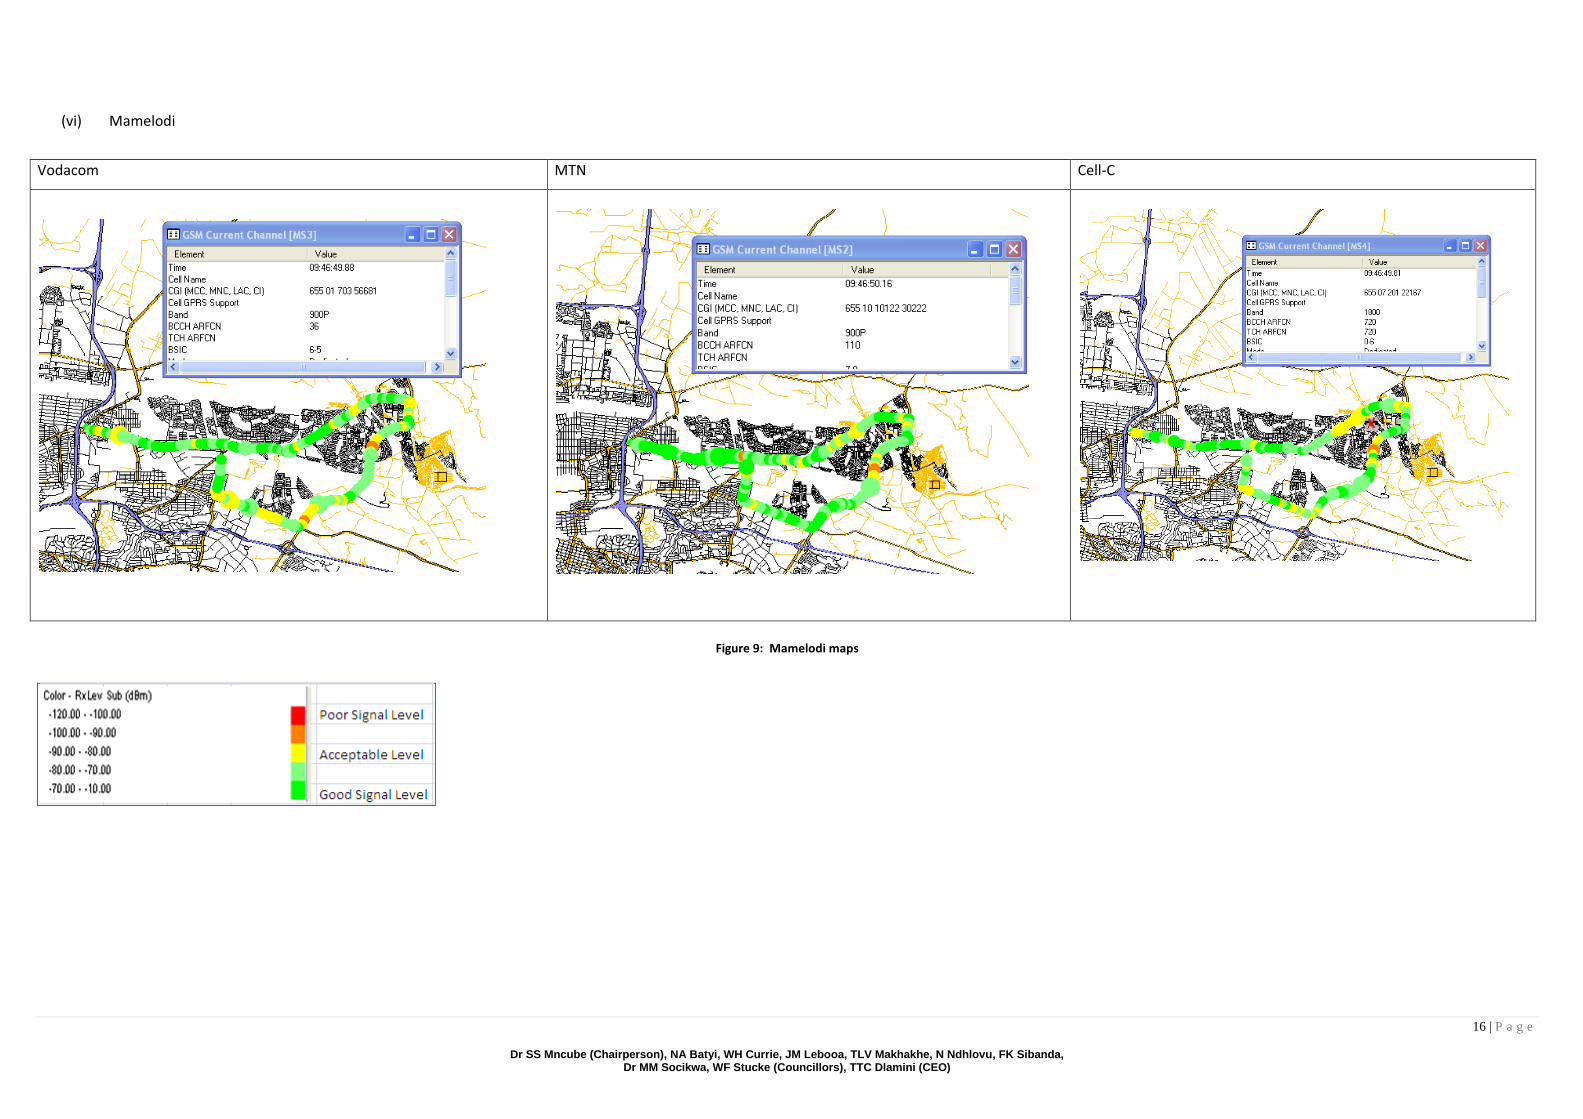
(vi) Mamelodi
Vodacom MTN Cell-C
Figure 9: Mamelodi maps
17 | P a g e
Dr SS Mncube (Chairperson), NA Batyi, WH Currie, JM Lebooa, TLV Makhakhe, N Ndhlovu, FK Sibanda, Dr MM Socikwa, WF Stucke (Councillors), TTC Dlamini (CEO)
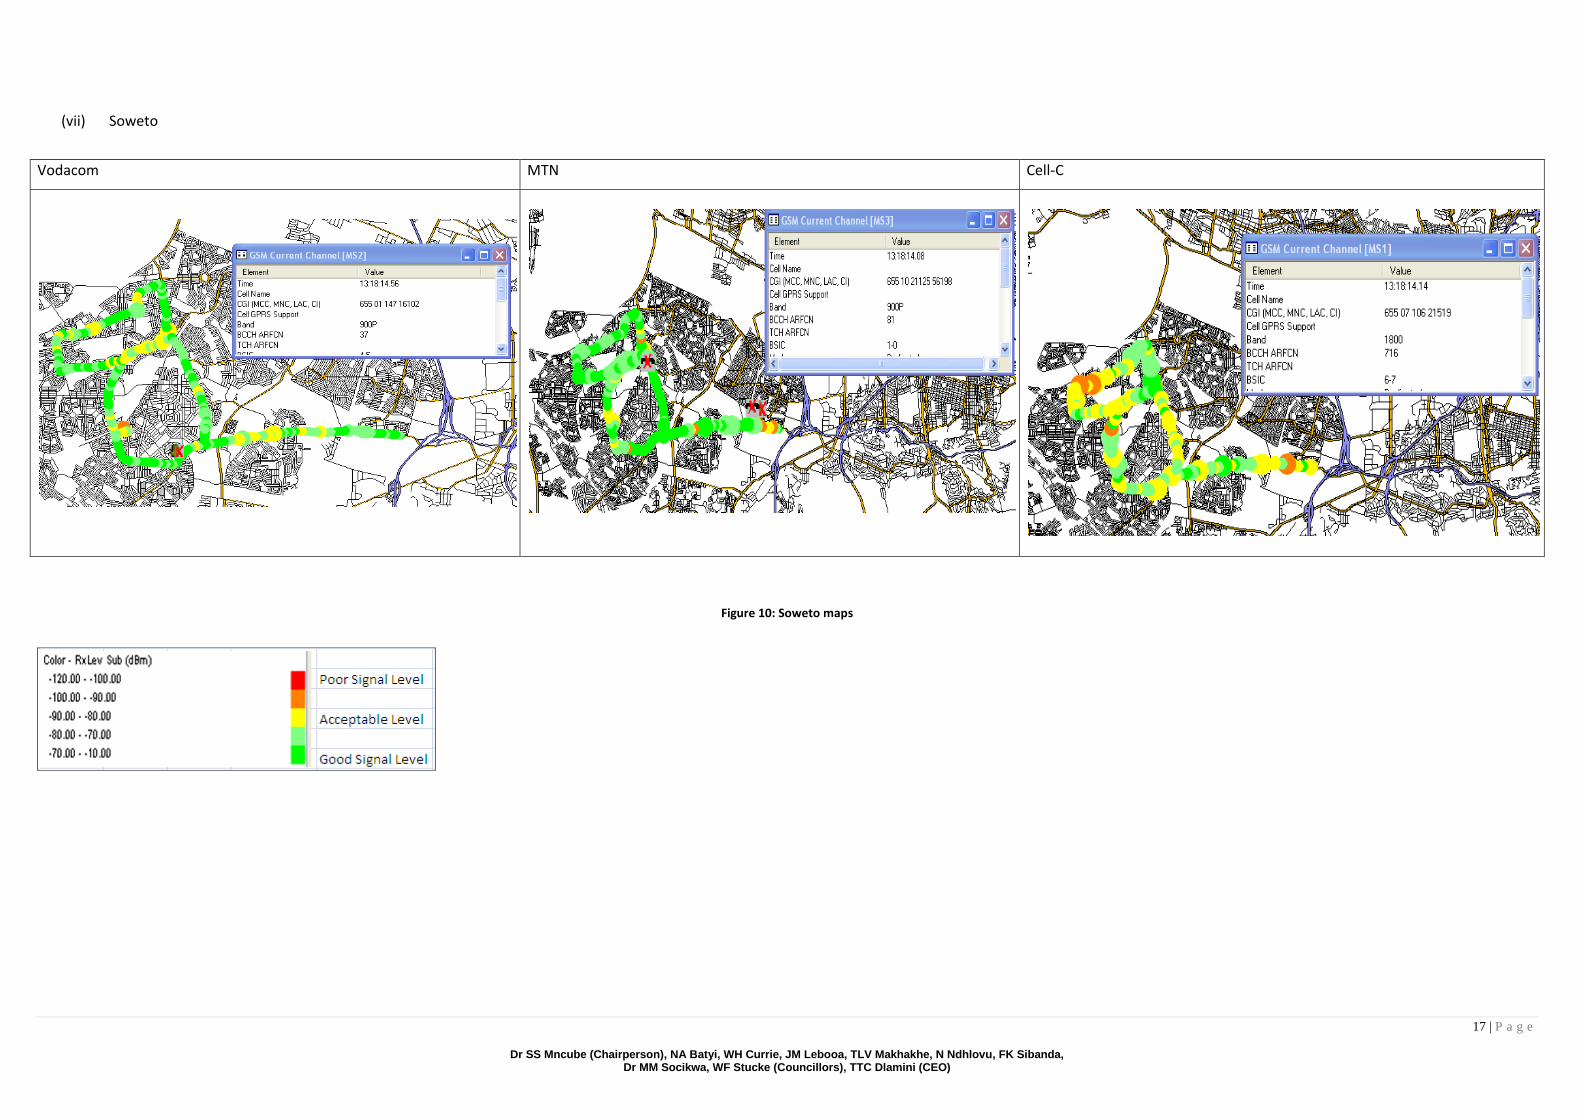
(vii) Soweto
Vodacom MTN Cell-C
Figure 10: Soweto maps
18 | P a g e
4. Conclusion
The methodology followed allowed us to assess Quality of Service on the spot, giving us as realistic a
picture as possible of network performance, from the user’s point of view. The drive test results
represent a snapshot of the mobile service provider's network performance, based on the specified
routes during the time of day when the measurements were carried out and using a particular type of
handset. The reported level of service quality may therefore not be exactly comparable with the
consumer's own. These tests cannot be assumed to be representative, but are merely indicative.
Further, more rigorous, tests will be conducted in future.
![Advice [Gauteng Leadership Seminar]](https://static.fdocuments.in/doc/165x107/5596d76e1a28ab91098b46f4/advice-gauteng-leadership-seminar.jpg)