Quality of Life Stat May 3 2012
25
C ITY OF N EW O RLEANS May 3 rd , 2012 (Reporting Period: March, 2012) www.nola.gov/opa QualityofLifeSTAT
-
Upload
city-of-new-orleans -
Category
Technology
-
view
304 -
download
2
Transcript of Quality of Life Stat May 3 2012

CITY OF NEW ORLEANS
May 3rd, 2012 (Reporting Period: March, 2012)
www.nola.gov/opa
QualityofLifeSTAT

QualityofLifeSTAT May 3, 2012
Agenda Part 1: Introduction/General Updates
1. About this STAT
2. Management Level Approach to Issues
3. 3-14 Coordinated Enforcement Debrief
4. 311 Update
Part 2: Data & Management Reports
1. Parking
2. Abandoned Vehicles
3. Street Lights
4. Potholes
5. Catch Basins
6. Sewerage & Water Board
7. Tree Issues
8. Bandit Signs
9. Illegal Dumping
10. Alcoholic Beverage Outlets
1
QualityofLifeSTAT May 3, 2012
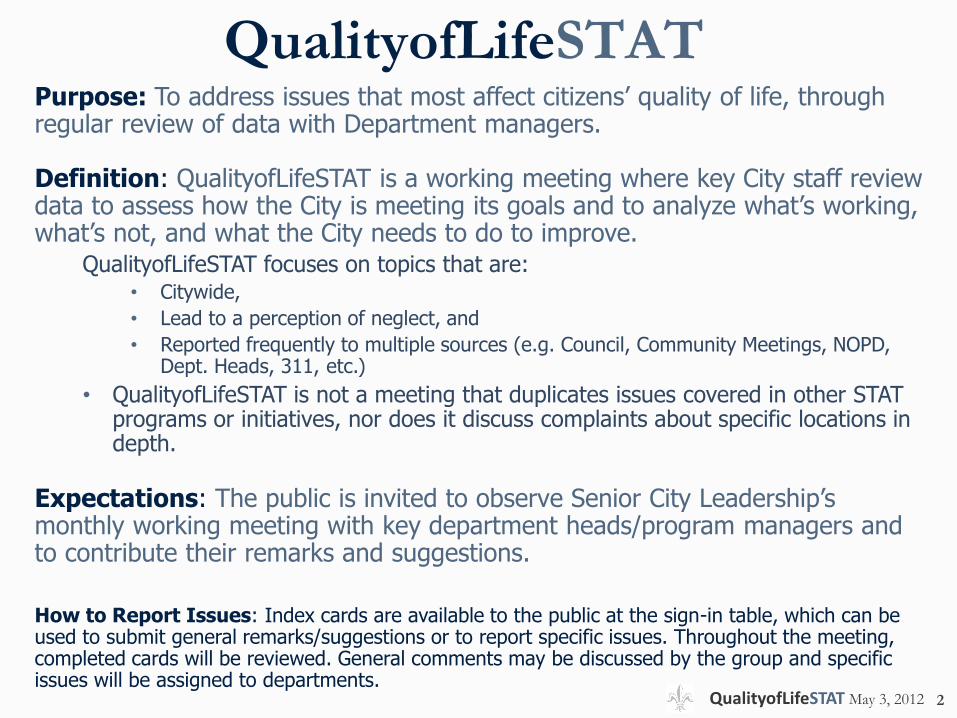
Purpose: To address issues that most affect citizens’ quality of life, through regular review of data with Department managers.
Definition: QualityofLifeSTAT is a working meeting where key City staff review data to assess how the City is meeting its goals and to analyze what’s working, what’s not, and what the City needs to do to improve.
QualityofLifeSTAT focuses on topics that are: • Citywide,
• Lead to a perception of neglect, and
• Reported frequently to multiple sources (e.g. Council, Community Meetings, NOPD, Dept. Heads, 311, etc.)
• QualityofLifeSTAT is not a meeting that duplicates issues covered in other STAT programs or initiatives, nor does it discuss complaints about specific locations in depth.
Expectations: The public is invited to observe Senior City Leadership’s monthly working meeting with key department heads/program managers and to contribute their remarks and suggestions.
How to Report Issues: Index cards are available to the public at the sign-in table, which can be used to submit general remarks/suggestions or to report specific issues. Throughout the meeting, completed cards will be reviewed. General comments may be discussed by the group and specific issues will be assigned to departments.
QualityofLifeSTAT
2

QualityofLifeSTAT May 3, 2012
NOLA311
● Launched on March 26
○ 4 departments: Sanitation, Code Enforcement, Public Works, and City-Assisted Evacuation
● Before June 1:
○ Web-based & Mobile self-service tools to report complaints & view status of requests
○ Automated case creation & closure notification
● Later this year:
○ Additional departments fully integrated
○ Integration with One-Stop Permitting Shop

QualityofLifeSTAT May 3, 2012
311 Performance Dashboard March 26, 2012 – April 26, 2012
- Met SLA target
- SLA not met (within 10-20%)
- SLA not met (everything else)
4
Not
able to
collect
Integrated 311 Departments
• Public Works
• Sanitation
• Code Enforcement
• EOC
Note: 31 Active Service Requests
0
20
40
60
80
100%
Age of Open Requests
Total Tickets
Not
able to
collect 0
20
40
60
80 120
140
160
180
200
Average Call Length: 151 sec
0
3
6
9
12 15
18
21
24
27
30
Average Hold Time: 14 sec
First Call Resolution: 69%**
0%
10%
20%
30%
40% 60%
70%
80%
90%
100%
0%
10%
20%
30%
40% 60%
70%
80%
90%
100%
Abandonment Rate: 6%

QualityofLifeSTAT May 3, 2012
Part 2: Data & Management Reports Department of Public Works
1. Abandoned Vehicles/Parking
2. Street Lights
3. Potholes
4. Catch Basins
Sewerage & Water Board
Parks & Parkways
1. Tree Issues
Sanitation
1. Bandit Signs
2. Illegal Dumping
3. Alcoholic Beverage Outlets
5

QualityofLifeSTAT May 3, 2012
Abandoned Vehicle Response Times Remain
Constant
Source: Department of Public Works, Abandoned Call Log 3/30/2012
Issue
Abandoned vehicles take up parking spaces needed for traffic circulation, contribute to a sense of neglect in neighborhoods, and can become junked harborages for rats and mosquitos
Status
Transitioned to 311. beginning April 2012
Critical Parties
Public Works
Follow-Up
311 call center data will be data of record, beginning with June QoLStat
6
NOTE: A lag occurs in call closure because work orders are given to towing on a rolling basis, but
towing returns closed work orders with dispositions monthly.
The actual number of closed calls is likely higher than shown here, but is reflected on a one month lag.
43
73
149
131
112
91 88 82
62
36
21
78
60 54 55
1
0 2
25
33
26 25
19
24
20
6
4 5
1
15 15
12
0.00
5.00
10.00
15.00
20.00
25.00
30.00
35.00
0
20
40
60
80
100
120
140
160
Jan-11 Feb-11 Mar-11 Apr-11 May-11 Jun-11 Jul-11 Aug-11 Sep-11 Oct-11 Nov-11 Dec-11 Jan-12 Feb-12 Mar-12
Abandoned Vehicle Call Disposition by Month of Call
Count of Active Calls Count of Closed Calls Avg. Days to Close (Month of Close)
13 13

QualityofLifeSTAT May 3, 2012
Parking: Booting & Towing Activity
Source: Department of Public Works Monthly Parking Report 4/15/2012
Issue
Parking violations prevent proper parking circulation and can block sidewalks, driveways, and intersections
Status
Ongoing monitoring
Critical Parties
Department of Public Works, NOPD
7
392 357 484
776
610
988 904
972 968 982
803 823
1272 1395 1458 1480
1208
0
200
400
600
800
1,000
1,200
1,400
1,600
September October November December January February March
Confirmed Tows, by month
2010
2011
2012
255 290
254 258 205
342 339 378 360
314 323 265
366 355 414
729 781
0
100
200
300
400
500
600
700
800
900
September October November December January February March
Confirmed Boots, by month
2010
2011
2012

QualityofLifeSTAT May 3, 2012
Parking: Citation Issuance In Line With
Expectations
Source: Department of Public Works Monthly Parking Report 4/15/2012
Issue
Parking violations prevent proper parking circulation and can block sidewalks, driveways, and intersections
Status
Ongoing monitoring
Critical Parties
Department of Public Works, NOPD
8
19,769
23,687
20,859 21,878
23,179
40,746
26,366
23,719
27,637
30,703 29,490
20,351 23,200
35,943
30,614
39,709
25,346
-
5,000
10,000
15,000
20,000
25,000
30,000
35,000
40,000
45,000
September October November December January February March
Citations Issued, by month
2010
2011
2012

QualityofLifeSTAT May 3, 2012
Streetlight Repairs: City Announces Plan to Light Up
the City by 2013
• Identified $8M in federal recovery funds to supplement funds remaining in ‘12 budget
• Will increase inspections and routine repairs by an estimated 50% with the goal of working 200+ outages a week
Current Planned
Crews 3 6
Hours Per Day 8 13
Days Per Week 5 6

QualityofLifeSTAT May 3, 2012
Street Light Repairs Completed, by month & type
Source: Royal Engineering Monthly Summary Report, March 2012 10
Issue
Street light outages contribute to perception of lack of safety and create opportunity for crime, as well as unsafe road conditions for pedestrians & drivers
Status
Repairs resumed 1/3/12, following Federal Environmental Review DPW addressing backlog generated during review process
Critical Parties
Department of Public Works Royal Engineers and All Star Electric
Note: Routine Maintenance repairs are those of recurring nature such as bulb replacement.
Major repairs are those repairs that include wiring, circuits, poles, and trenching work.
697 752
1,215 1,117 1,153
1,432
523
- -
223
544
343
24 69
96
86
624
319
106
0 0
-
63
24
0
200
400
600
800
1,000
1,200
1,400
1,600
1,800
2,000
Apr-11 May-11 Jun-11 Jul-11 Aug-11 Sep-11 Oct-11 Nov-11 Dec-11 Jan-12 Feb-12 Mar-12
Street Light Repairs Completed
Routine Maintenance Complete Major Repairs Complete
Federal Environmental
Review
QualityofLifeSTAT May 3, 2012
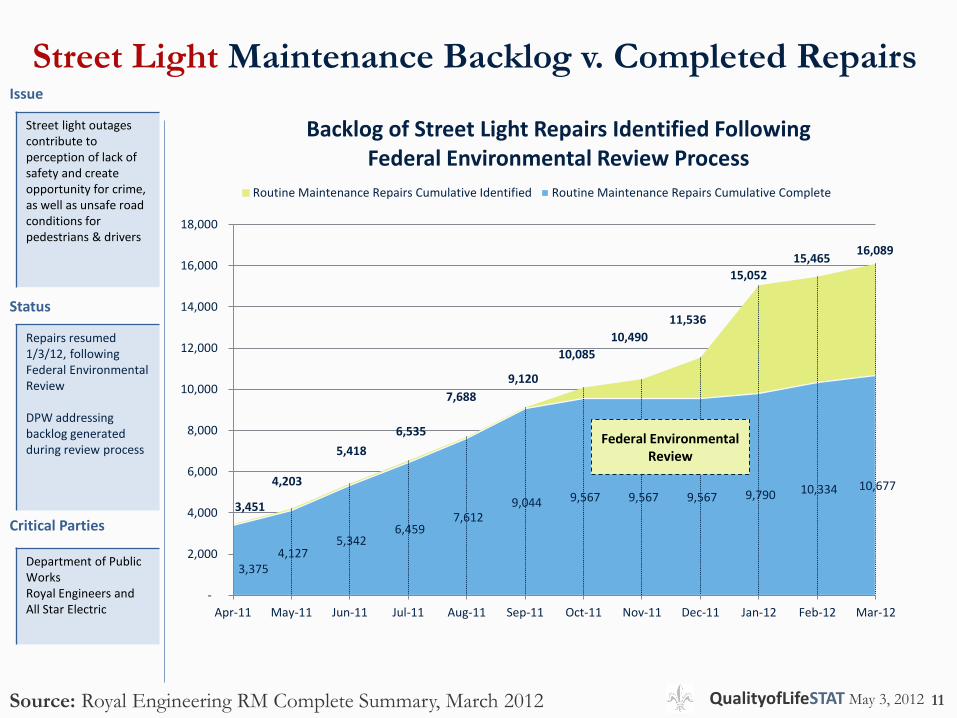
Street Light Maintenance Backlog v. Completed Repairs
Source: Royal Engineering RM Complete Summary, March 2012 11
Issue
Street light outages contribute to perception of lack of safety and create opportunity for crime, as well as unsafe road conditions for pedestrians & drivers
Status
Repairs resumed 1/3/12, following Federal Environmental Review DPW addressing backlog generated during review process
Critical Parties
Department of Public Works Royal Engineers and All Star Electric
3,451
4,203
5,418
6,535
7,688
9,120
10,085
10,490
11,536
15,052
15,465 16,089
3,375 4,127
5,342 6,459
7,612 9,044 9,567 9,567 9,567 9,790 10,334 10,677
-
2,000
4,000
6,000
8,000
10,000
12,000
14,000
16,000
18,000
Apr-11 May-11 Jun-11 Jul-11 Aug-11 Sep-11 Oct-11 Nov-11 Dec-11 Jan-12 Feb-12 Mar-12
Backlog of Street Light Repairs Identified Following Federal Environmental Review Process
Routine Maintenance Repairs Cumulative Identified Routine Maintenance Repairs Cumulative Complete
Federal Environmental Review

QualityofLifeSTAT May 3, 2012
Potholes Filled Continues to Exceed Target
Source: Department of Public Works, Pothole Killer Log, March 2012
Issue
Potholes signal neglect in neighborhoods, cause damage to cars, and increase the risk of vehicular accidents
Status
2012 annual goal has been set at 50,000 (monthly goal: 4,167) Timeliness data on pothole filling will be generated via 311 reporting, beginning in Q2
Critical Parties
Public Works, ITI
12
NOTE:
Number of
working days
varies by
month due to
weather
8,299
6,226 5,437
6,044
3,035 3,125 3,223 2,748
2,104 2,515
5,393 5,189
-
1,000
2,000
3,000
4,000
5,000
6,000
7,000
8,000
9,000
Apr-11 May-11 Jun-11 Jul-11 Aug-11 Sep-11 Oct-11 Nov-11 Dec-11 Jan-12 Feb-12 Mar-12
Potholes Filled by Month
Monthly Goal: 4,167
Aug-11 Sep-11 Oct-11 Nov-11 Dec-11 Jan-12 Feb-12 Mar-12
Avg # Filled per Work Day 152 174 157 139 136 165 157 169
Total # Working Days 20 18 20.5 19.7 15.5 22 17 15
152 174 157
139 136 165 157 169
20 18 20.5 19.7 15.5 22 17 15 0
20
40
60
80
100
120
140
160
180
200
Average Potholes FIlled Per Working Day

QualityofLifeSTAT May 3, 2012
363 369
182
273 245
274 243
579
-
100
200
300
400
500
600
700
Aug-11 Sep-11 Oct-11 Nov-11 Dec-11 Jan-12 Feb-12 Mar-12
Catch Basins Cleaned, by Month
Catch Basin Cleanings Rebound After Mardi Gras
Efforts
Source: Department of Public Works Weekly Maintenance Reports, February 2012 13
Issue
Catch Basins when blocked can cause severe flooding in neighborhoods, damage streets, and cause damage to cars and homes.
Status
2012 annual goal has been set at 4,200; monthly targets vary due to seasonality
Critical Parties
Department of Public Works, Sewerage and Water Board
Monthly Goal: 350

QualityofLifeSTAT May 3, 2012 14

QualityofLifeSTAT May 3, 2012 15

QualityofLifeSTAT May 3, 2012 16

QualityofLifeSTAT May 3, 2012 17

QualityofLifeSTAT May 3, 2012
Tree Work Order Timeliness for Non-
Emergency Work Orders Improves Issue
Tree trimming and removal prevents damage to public and private buildings
Status
GIS mapping and optimization of work patterns in process ITI will work with Parkways to design 311 protocol for implementation during 2nd half of 2012
Critical Parties
Parks and Parkways ITI OPA
18 Source: Department of Parks and Parkways Database Export as of 3/9/2012
NOTE: Tropical Storm Lee (September 2011) generated significant
backlog of work orders
96
46
43 44
96
40 55
44 33
87
43
66 49
95
74
61
44 66
98
92
103 85
99
87
56
33
35
38
51
70
9 8
6 4
7 8
13 12 11
14 17
18
21 23
17
0
10
20
30
40
50
0
20
40
60
80
100
120
140
160
180
200
Nu
mb
er
of
We
eks
to
Clo
se N
on
-Em
erg
en
cy W
ork
Ord
ers
Co
un
t o
f W
ork
ord
ers
Non-Emergency Work Order Response Time
Non-Emergency Workorders Emergency Workorders Weeks to Close Non-Emergency Workorders

QualityofLifeSTAT May 3, 2012
Forestry Activity Remains In Line With Historic
Patterns Issue
Tree trimming and removal prevents damage to public and private buildings
Status
Ongoing ITI will work with Parkways to design 311 protocol for implementation during 2nd half of 2012
Critical Parties
Parks and Parkways
19 Source: Department of Parks and Parkways Database Export through 3/9/2011
Contact Info: Non-Emergency 658-3200; Emergency 911
33 24 33 14 9 3 14 4 - 3 17 3
33 59 44 67 58 93
173
26 11 17 11
21 34
92 120 107 126
108 84
143
224
139 101
618
166
93
54
57 63
99
56 90
77
64
33
28
49
117
82
-
100
200
300
400
500
600
700
800
Mar-11 Apr-11 May-11 Jun-11 Jul-11 Aug-11 Sep-11 Oct-11 Nov-11 Dec-11 Jan-12 Feb-12 Mar-12
Work Orders
Removals
Trims
Emergencies
No WorkNeeded/Private Trees

QualityofLifeSTAT May 3, 2012
Bandit Sign Coordinated Enforcement
Efforts Yield Continued Success
Source: Department of Parks and Parkways and Department of Sanitation Monthly Illegal Sign
Spreadsheet, Parkways Working Sign List, Department of Sanitation Monthly Reports 4/16/12
Issue
Bandit Signs signal neglect in neighborhoods, create visual clutter, and are private use of public space for advertising
Status
Monitoring efforts continue
Critical Parties
Sanitation, Parks and Parkways
20
Note: Approximately 4,300 of the signs removed in
October were related to the October 22nd elections
1,914
3,881
1,361
1,628
1,880
368
828
2,310
1,633
5,147
333
662 630
186
614
-
1,000
2,000
3,000
4,000
5,000
6,000
Jan-11 Feb-11 Mar-11 Apr-11 May-11 Jun-11 Jul-11 Aug-11 Sep-11 Oct-11 Nov-11 Dec-11 Jan-12 Feb-12 Mar-12
Bandit Signs Removed

QualityofLifeSTAT May 3, 2012
Sanitation Ranger & Quality of Life
ABOs, Litter, and Tire Dumping
Source: Department of Sanitation Monthly Report 4/16/2012 21
Issue
Illegal dumping sites are a risk to public health and contribute to a sense of neighborhood neglect
Status
Sanitation is working on call classification so that variations based on types of calls can be detected.
Critical Parties
Sanitation, NOPD
Follow-Up
• Should a target
be set?
166
104
91
6 2 8
0
20
40
60
80
100
120
140
160
180
200
Apr-11May-
11Jun-11 Jul-11 Aug-11 Sep-11 Oct-11 Nov-11 Dec-11 Jan-12 Feb-12 Mar-12
Inspections 98 14 95 64 89 53 124 186 153 166 104 91
NOPD Summons 0 0 10 1 4 8 12 6 10 6 2 8
Sanitation Enforcement Activity

QualityofLifeSTAT May 3, 2012
Sanitation Maintains Momentum While
Integrating with NOLA311
Source: Department of Sanitation Monthly Report 4/16/2012
Issue
Dumping sites are a risk to public health and contribute to a sense of neighborhood neglect
Status
Included in initial 311 rollout Work Order intake system with mapping needed
Critical Parties
Sanitation
22
1,034 722 626
1,489 1,559 930
4,836
1,378
2,078
-
1,000
2,000
3,000
4,000
5,000
6,000
October November December January February March
Tires Removed, by month
2011
2012
133
40
89 102
46 46 45
28
65
0
20
40
60
80
100
120
140
October November December January February March
Illegal Dumping Sites Cleared
2011
2012

QualityofLifeSTAT May 3, 2012
Alcohol Beverage Outlet Cases Prosecuted
Issue
Alcoholic Beverage Outlets operating in violation of their regulations can become sites of violent incidents and create noise, litter, and parking violations that interfere with neighbors' quality of life
Status
Ongoing enforcement efforts 311: routing and tracking of nuisance cases? Exploring strategies for ABCB to hear additional nuisance cases each month
Critical Parties
Law, NOPD, Safety and Permits
Source: Law Department, April 2, 2012 23
22 22 23
20 19
15
0
5
10
15
20
25
Oct-11 Nov-11 Dec-11 Jan-12 Feb-12 Mar-12
ABO Tax & Nuisance Cases Prosecuted, by month as of March 31st, 2012
QualityofLifeSTAT May 3, 2012
Evaluation Form
● Are you a city employee or a member of the public?
● On a scale 1-5, how useful was this meeting to you (1= least useful and 5= most useful)?
● What’s working?
● What’s not working?