Quality of Life and Symptom Assessment: An Overvie GGIG...Quality of Life and Symptom Assessment: An...
50
Quality of Life and Symptom Assessment: An Overview Barbara A Murphy, MD Vanderbilt Ingram Cancer Center Director, Pain and Symptom Management Program
-
Upload
dangkhuong -
Category
Documents
-
view
217 -
download
2
Transcript of Quality of Life and Symptom Assessment: An Overvie GGIG...Quality of Life and Symptom Assessment: An...
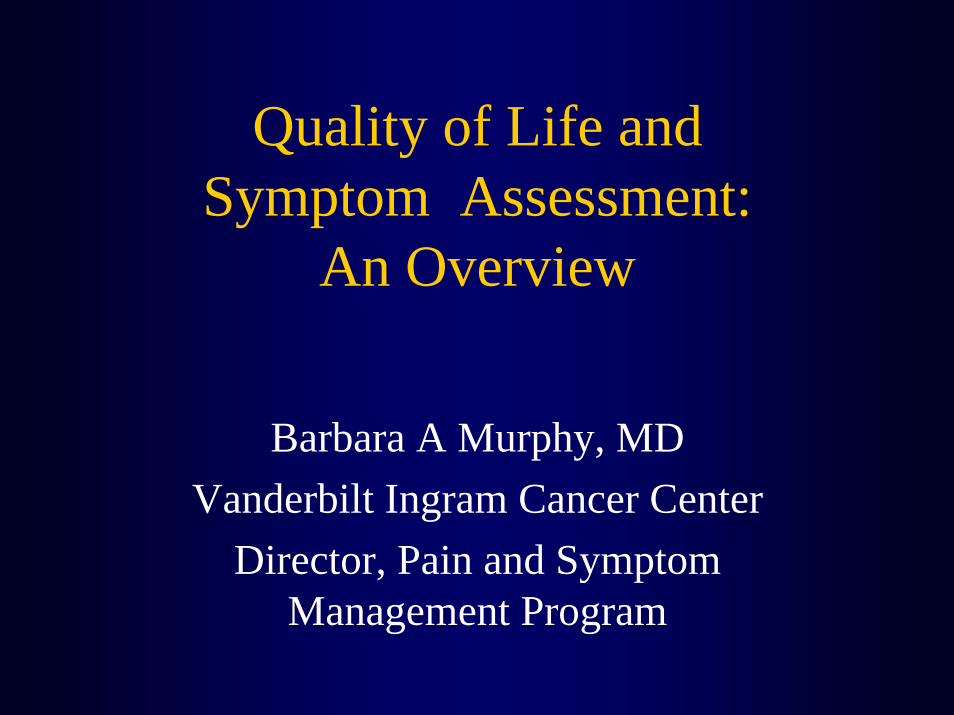
Quality of Life and Symptom Assessment:
An Overview
Barbara A Murphy, MDVanderbilt Ingram Cancer Center
Director, Pain and Symptom Management Program
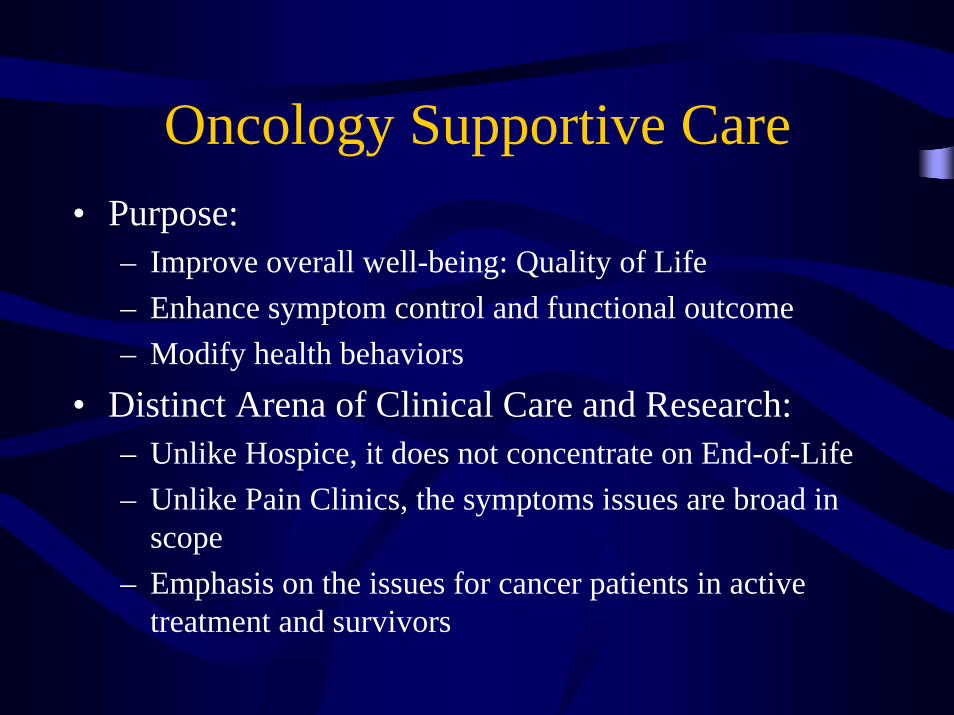
Oncology Supportive Care• Purpose:
– Improve overall well-being: Quality of Life – Enhance symptom control and functional outcome– Modify health behaviors
• Distinct Arena of Clinical Care and Research:– Unlike Hospice, it does not concentrate on End-of-Life– Unlike Pain Clinics, the symptoms issues are broad in
scope– Emphasis on the issues for cancer patients in active
treatment and survivors
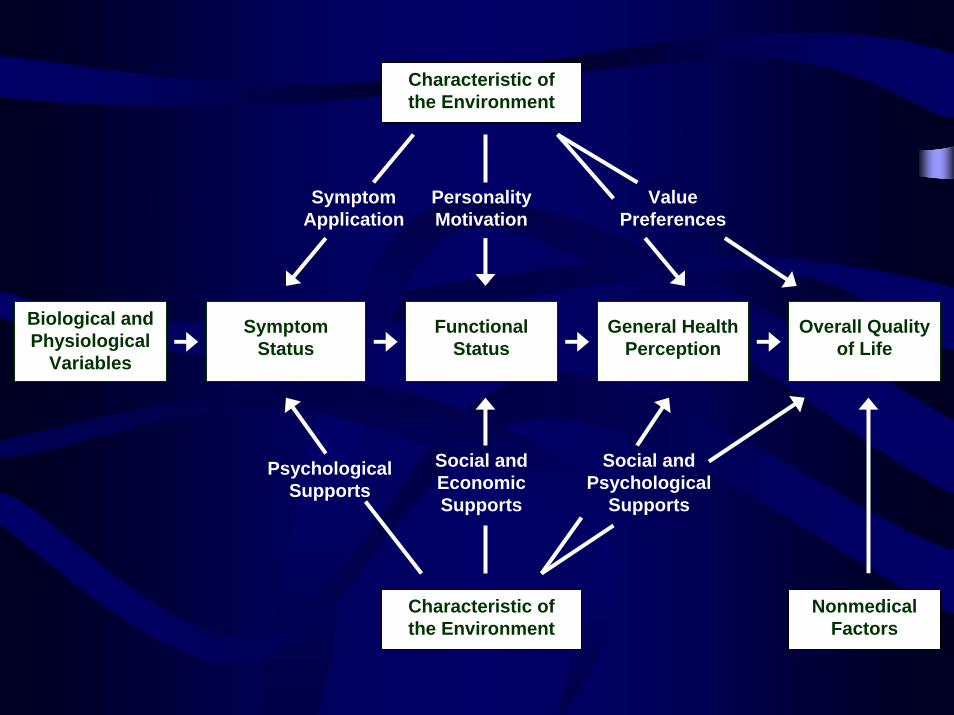
Biological and Physiological
Variables
Symptom Status
Functional Status
General Health Perception
Overall Quality of Life
Characteristic of the Environment
Nonmedical Factors
Symptom Application
Value Preferences
Psychological Supports
Social and Psychological
Supports
Characteristic of the Environment
Social and Economic Supports
Personality Motivation
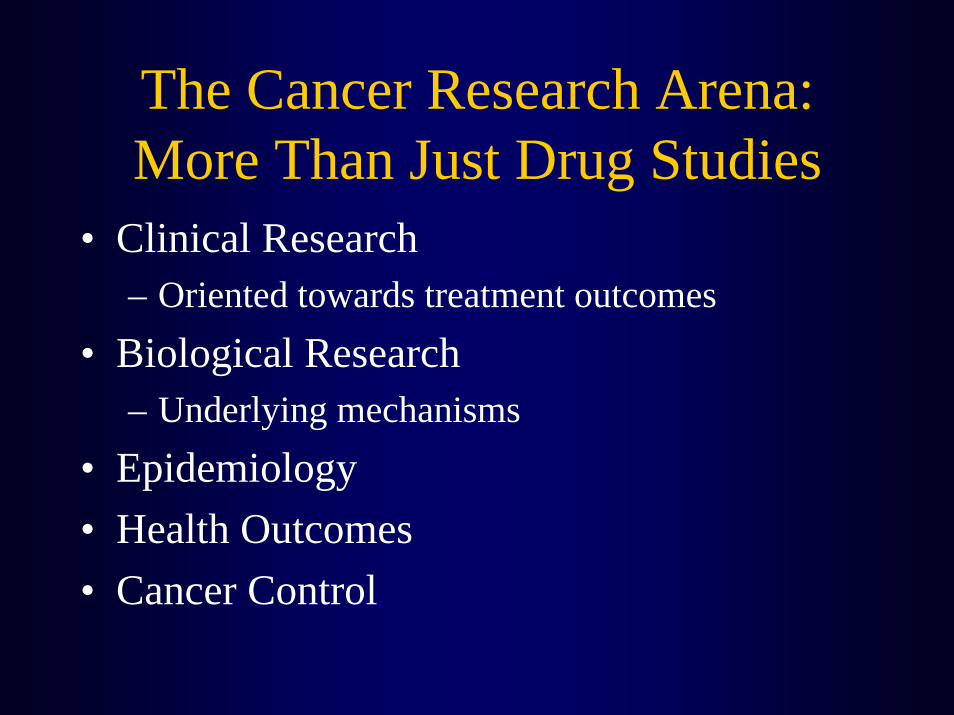
The Cancer Research Arena:More Than Just Drug Studies
• Clinical Research– Oriented towards treatment outcomes
• Biological Research– Underlying mechanisms
• Epidemiology• Health Outcomes• Cancer Control

Cancer Control:
• Vague term which encompasses the following:– Quality of life– Symptoms– Psychological Outcomes– Nutrition– Rehabilitation– Health Behaviors– ECT……
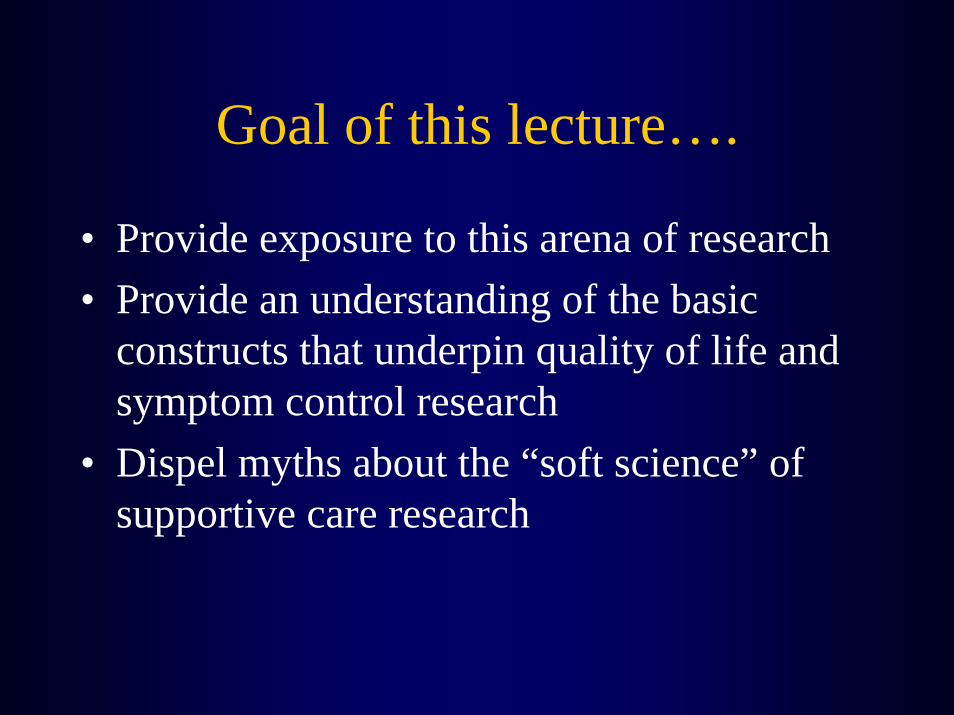
Goal of this lecture….
• Provide exposure to this arena of research• Provide an understanding of the basic
constructs that underpin quality of life and symptom control research
• Dispel myths about the “soft science” of supportive care research
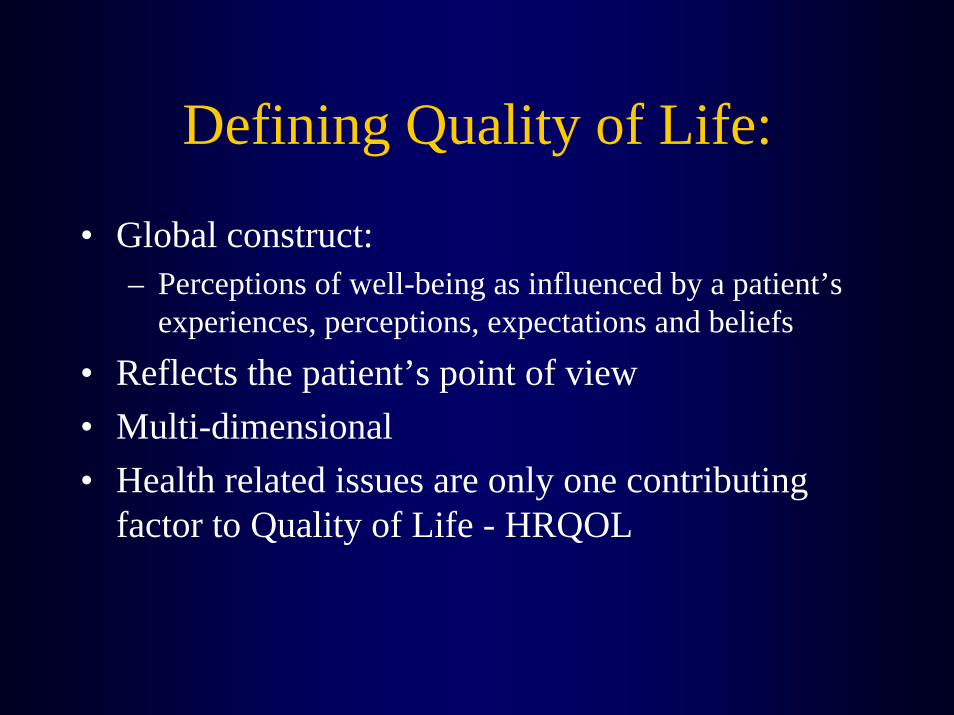
Defining Quality of Life:
• Global construct: – Perceptions of well-being as influenced by a patient’s
experiences, perceptions, expectations and beliefs
• Reflects the patient’s point of view• Multi-dimensional• Health related issues are only one contributing
factor to Quality of Life - HRQOL
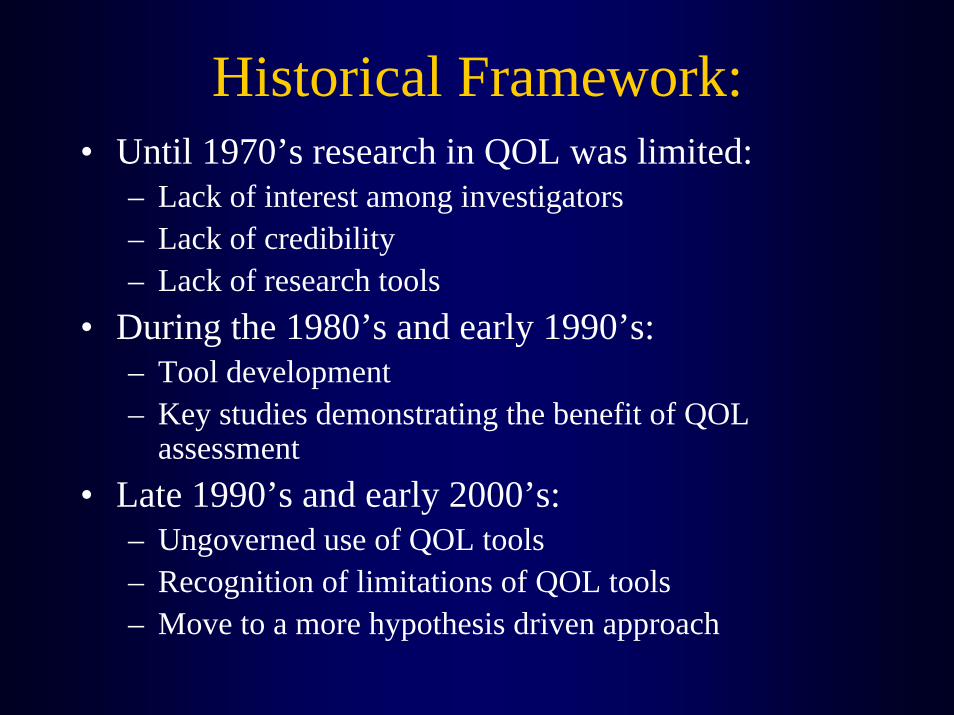
Historical Framework:• Until 1970’s research in QOL was limited:
– Lack of interest among investigators– Lack of credibility– Lack of research tools
• During the 1980’s and early 1990’s: – Tool development – Key studies demonstrating the benefit of QOL
assessment• Late 1990’s and early 2000’s:
– Ungoverned use of QOL tools– Recognition of limitations of QOL tools– Move to a more hypothesis driven approach
Quality of Life:The Challenge of Measurement
• How do you express general well-being in a way that is pertinent to all patients?
Answer: Ask the patient….

Commonly Assessed QOL Domains:
• Physical well being• Functional well being• Social well being• Emotional well being• Spiritual well being• Financial well being
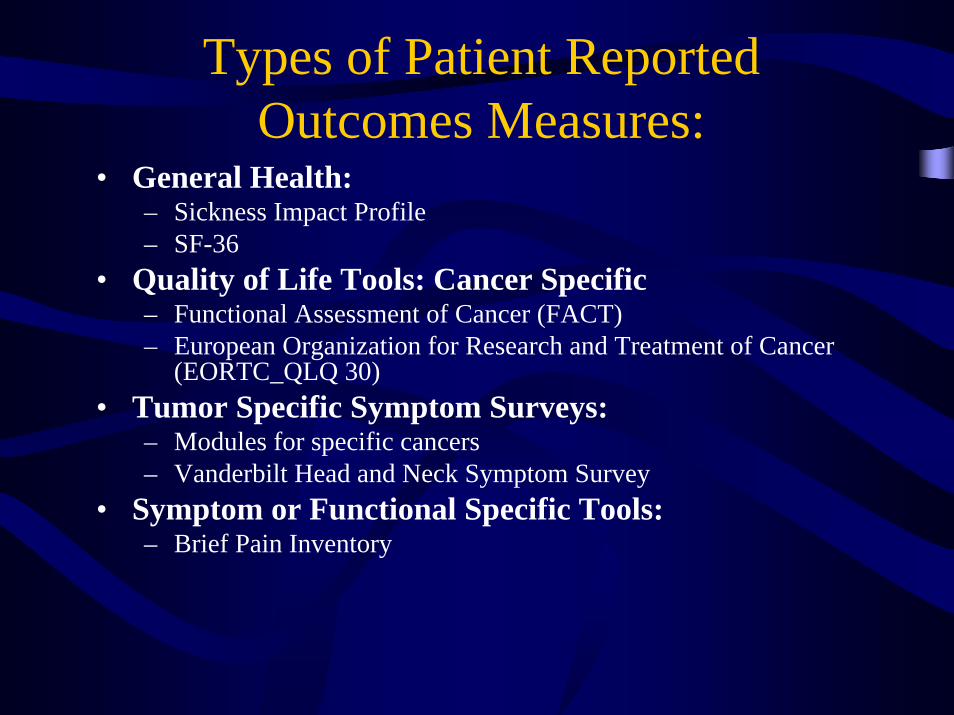
Types of Patient Reported Outcomes Measures:
• General Health:– Sickness Impact Profile– SF-36
• Quality of Life Tools: Cancer Specific– Functional Assessment of Cancer (FACT)– European Organization for Research and Treatment of Cancer
(EORTC_QLQ 30)• Tumor Specific Symptom Surveys:
– Modules for specific cancers – Vanderbilt Head and Neck Symptom Survey
• Symptom or Functional Specific Tools:– Brief Pain Inventory

QOL Tool Parameters:
• Item generation• Reliability
– test-retest (5-7 days apart)– internal consistency
• evaluative use - individual change over time (>.8)• discriminative use - group change (>.7)
• Validity– face validity– content validity– construct validity - scale behaves consistently with
theoretical framework• Responsiveness over time

Determining Clinical Significance
• Distribution-based methods– Examples: use of means, use of standard deviations– Compare difference in patient score to score of
reference population– Difference converted into an effect size
• Anchor-based methods– Correspondence between change in QOL or symptom
and other clinical parameter– Develop criterion for clinically significant change for a
given parameter
Original QOL Report
• There is a reported change in ABC QOL Scale from 10 to 15

Original QOL Report
• There is a reported change in ABC QOL Scale from 10 to 15
• Range of ABC Scores: 10 to 20
Original QOL Report
• There is a reported change in ABC QOL Scale from 10 to 15
• Range of ABC Scores: 0 to 100
Anchor-based Reports
• Change in ABC QOL Scale from 10 to 15• Anchors of meaning
10 - “Poor” QOL50 - “Moderate” QOL90 - “Excellent” QOL
Anchor-based reports
• Change in ABC QOL Scale from 10 to 15• Anchors of meaning
10 – Typical ICU patients50 – PEG-dependent patients90 – Patients able to work

Clinical Interpretation
• Authors should provide scale’s range of scores • Authors should provide anchors to guide
clinical interpretation

What is clinically meaningful? Minimally Important Clinical Difference
Can be calculated with:• Internally-Based (distribution, or statistically
based) techniques• Externally-Based (anchor-based) techniques
Internally-based MCID
• Calculated after analysis of statistical distribution of data (Cohen’s effect size)
• Effect size of 0.20 (20% of standard deviation) is considered minimally important
• Effect size of 0.50 considered moderately important, 0.80 considered highly important
However
• Distribution-based MCID calculations are based in statistics
• Should develop method for calculating MCID based on clinical judgments

Externally-based MCID
• Use clinical ‘anchors’• Compare changes in QOL to external
clinical change or result
Calculating MCID
• Administer QOL scale twice prospectively• During second inquiry, administer
‘Changes’ questionnaire as well• Calculate MCID of QOL changes in
patients indicating minimal change (2/7)
Revisit QOL Report
• Change in ABC QOL Scale from 10 to 15
• MCID: 12 points
Revisit QOL Report
• Change in ABC QOL Scale from 10 to 15
• MCID: 2 points
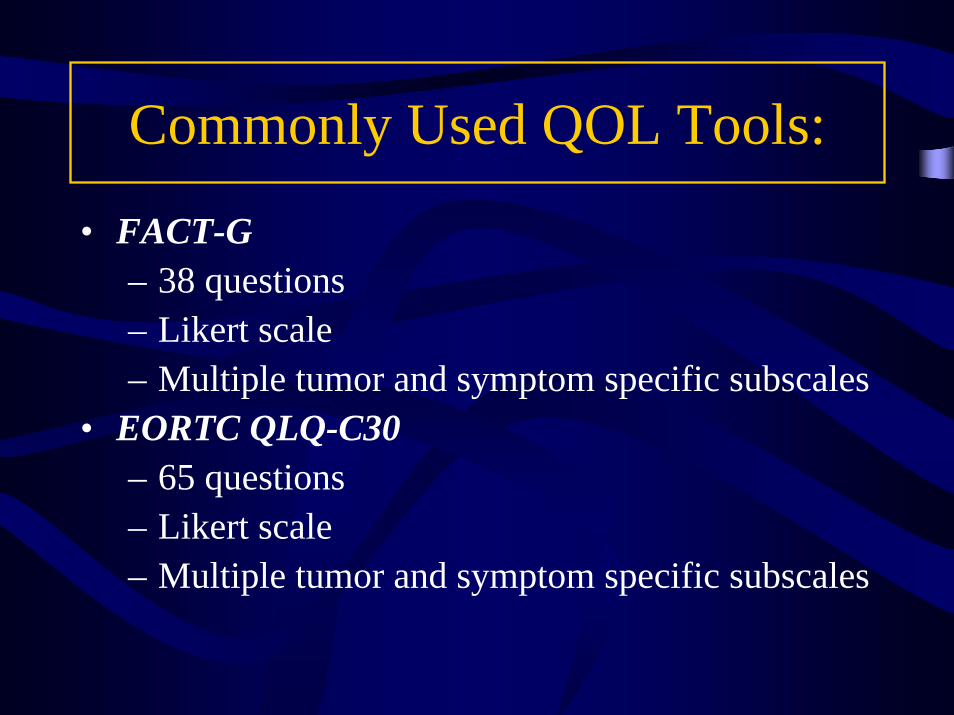
Commonly Used QOL Tools:
• FACT-G – 38 questions – Likert scale– Multiple tumor and symptom specific subscales
• EORTC QLQ-C30– 65 questions – Likert scale– Multiple tumor and symptom specific subscales
Why do we need QOL Measures and how are they used?
• Outcome measure in and of itself • Compare treatment regimens• Predictive factor for outcome• Identify issues needing further evaluation
and/or intervention• Provide insight into specific issues for
individuals or groups
General Lessons Learned from QOL Studies:
• QOL is a multi-dimensional construct• Observers are a poor judge of how patients
feel about QOL• High rates of compliance can be achieved
for QOL studies• Aggressive therapy may enhance QOL• Symptoms disrupt QOL• QOL may predict survival
Osoba, David: JCO 1994

Examples:

Does Chemotherapy Palliate in the setting of Advanced Cancer
• Randomized trial of best supportive care versus systemic chemotherapy
• Patient population: advanced NSCLC• Correlative study: QOL assessment• Results:
– Improved survival for chemotherapy arm– Improved QOL for chemotherapy arm

Does treatment of anemic cancer patients with red cell growth factors improve QOL?
• Randomized, double blind placebo controlled trial• Patient population: cancer patients with a HGB
<10.5• Treatment: placebo vs Epoetin• Measures:
– FACT-an, SF-36, and CLAS• Results:
– Decrease in transfusions– Increase in HGB– Increase in QOL in all cancer and anemia specific
domains

E1395: Phase III Trial of Cisplatin + 5FU vsCisplatin Taxol in Met/Rec HNC
• Patient Population:– Chemo-naïve Metastatic or Recurrent Disease
• Treatment:– Arm 1 Cisplatin 100mg/m2 + 5FU 1gm/m2 x 4– Arm 2 Cisplatin 75mg/m2 + Taxol 175mg/m2
• Endpoints:– Response: no difference– Median survival and 1 year survival: no difference– Toxicity Profile: favored arm 2
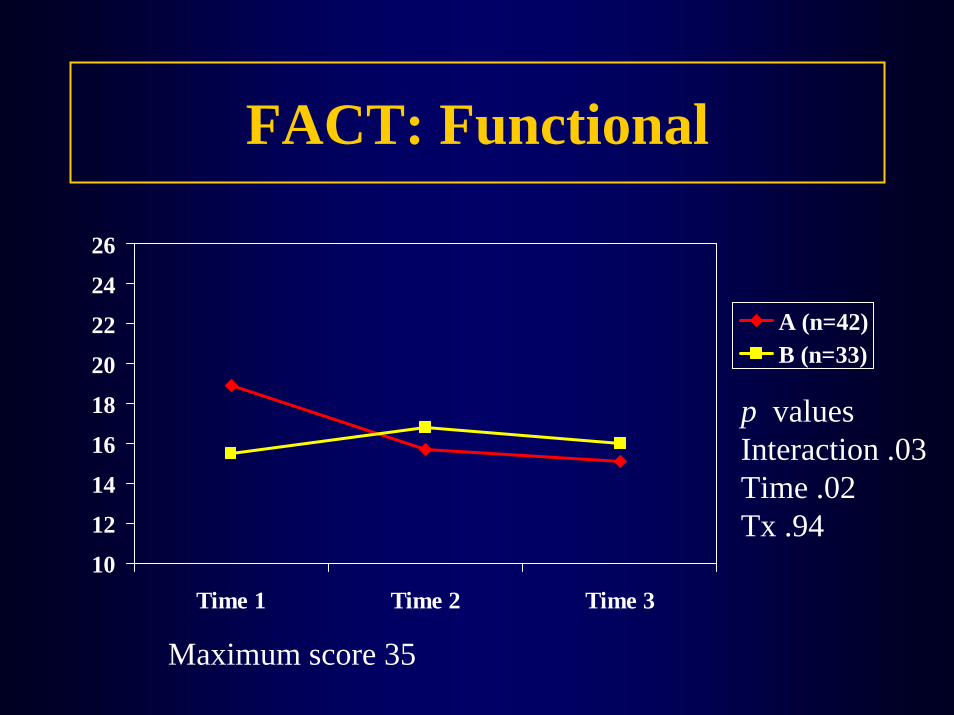
FACT: Functional
10
12
14
16
18
20
22
24
26
Time 1 Time 2 Time 3
A (n=42)B (n=33)
Maximum score 35
p valuesInteraction .03Time .02Tx .94
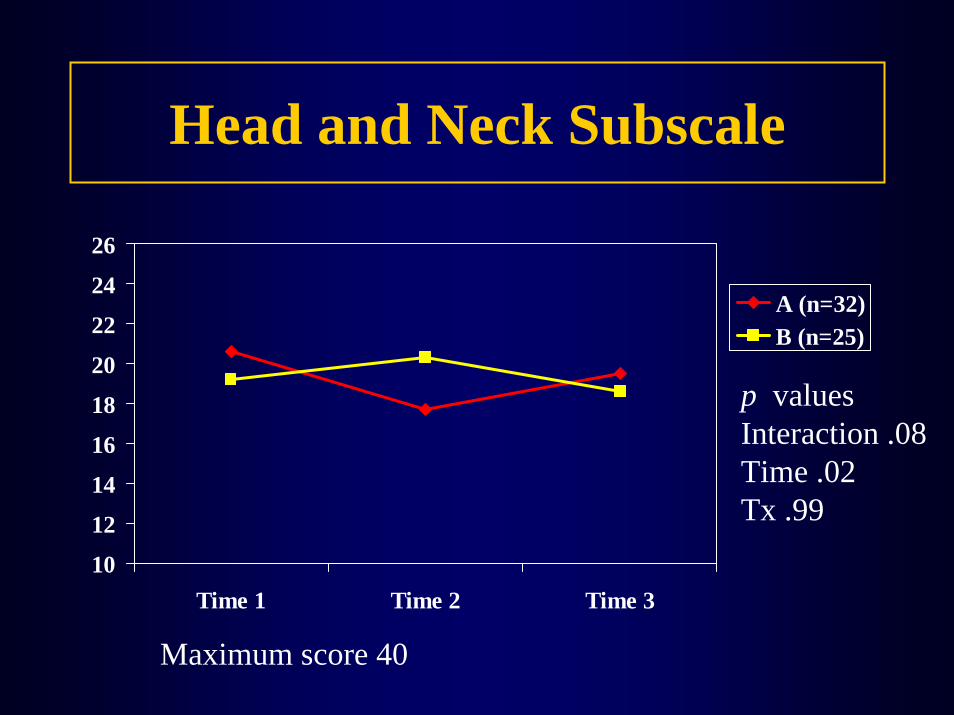
Head and Neck Subscale
10
12
14
16
18
20
22
24
26
Time 1 Time 2 Time 3
A (n=32)B (n=25)
Maximum score 40
p valuesInteraction .08Time .02Tx .99
Limitations of QOL as an Outcome Measure:

Curran, D. et al. J Clin Oncol; 25:2191-2197 2007
Quality of Life Over Time:
Response Shift:
“under the influence of a (highly significant) life event, such as getting a life threatening disease……there will be a concurrent change in the internalized standard on which the patient bases their perceptions.”
Breetvelt IS. Underreporting by cancer patients: the case of response shift. Soc Sci Med 32:981-987, 1991

Symptoms and Function Outcomes:
• Symptoms perceived alterations in sensation– Some symptoms are purely subjective and must be measure
by self-report (example: pain, fatigue, ect…) – Some symptoms are related to alterations in function
(example: dysphagia, xerostomia, ect…) and may be measured by PROs or objective measures
• Function loss may or may not be perceived by the patient – Thus, function loss may require objective assessment– Asymptomatic function loss may clinically significant
Symptoms and Function Outcomes:
• Symptoms and function loss may be secondary to disease state or treatment
• Symptoms or function loss due to treatment is termed “adverse effects” or “treatment related toxicity”
• Acute and late effects of therapy are the result of interactionsbetween the host genetic make-up, treatment and the underlying tumor.
• Patient reports of QOL may return to baseline in the face of significant symptom burden– Response shift
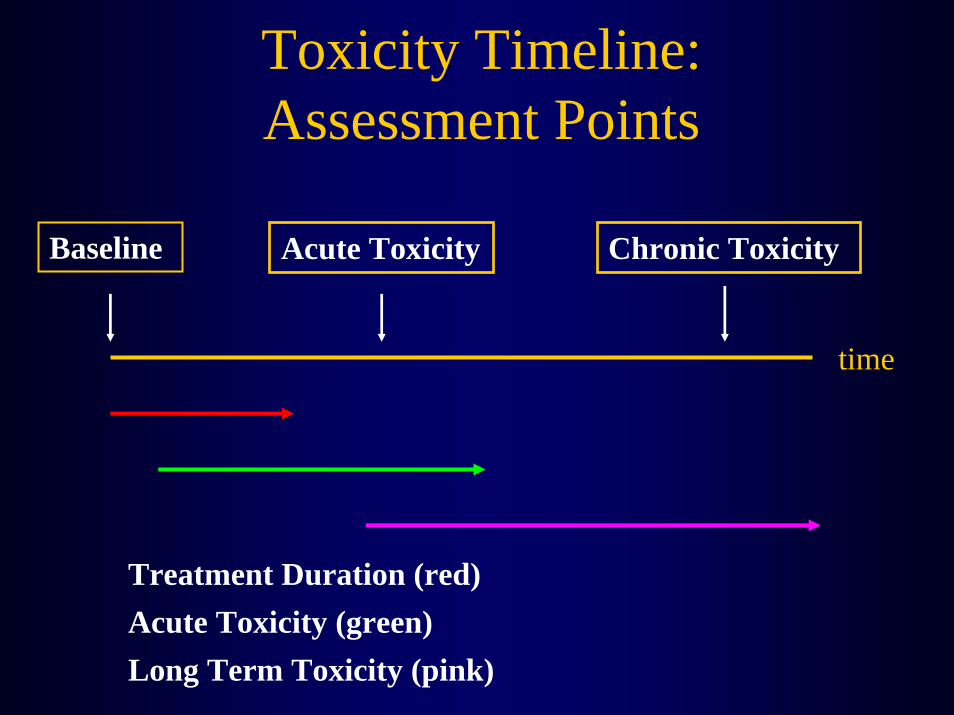
Toxicity Timeline:Assessment Points
Baseline
Acute Toxicity (green)Treatment Duration (red)
Long Term Toxicity (pink)
Acute Toxicity Chronic Toxicity
time
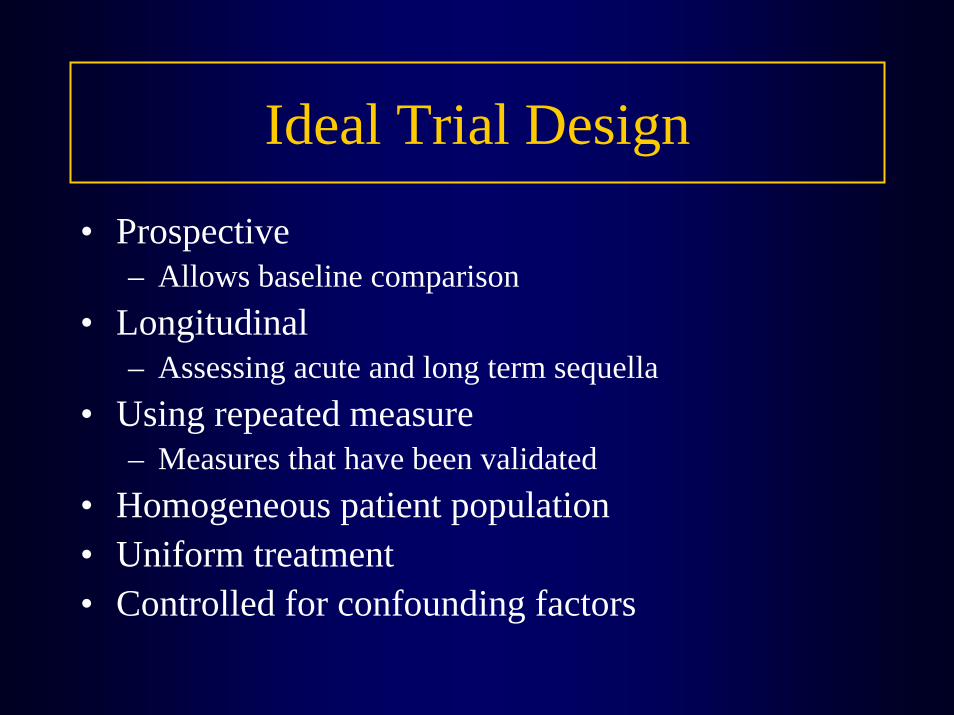
Ideal Trial Design
• Prospective– Allows baseline comparison
• Longitudinal– Assessing acute and long term sequella
• Using repeated measure– Measures that have been validated
• Homogeneous patient population• Uniform treatment• Controlled for confounding factors

Measurement Issues:
• Subjective Measures:– Self-report
• Objective Measures:– Exercise testing– Actigraphs– Diet Recall– Modified Barium Swallow
Relationship Between QOL and Symptoms
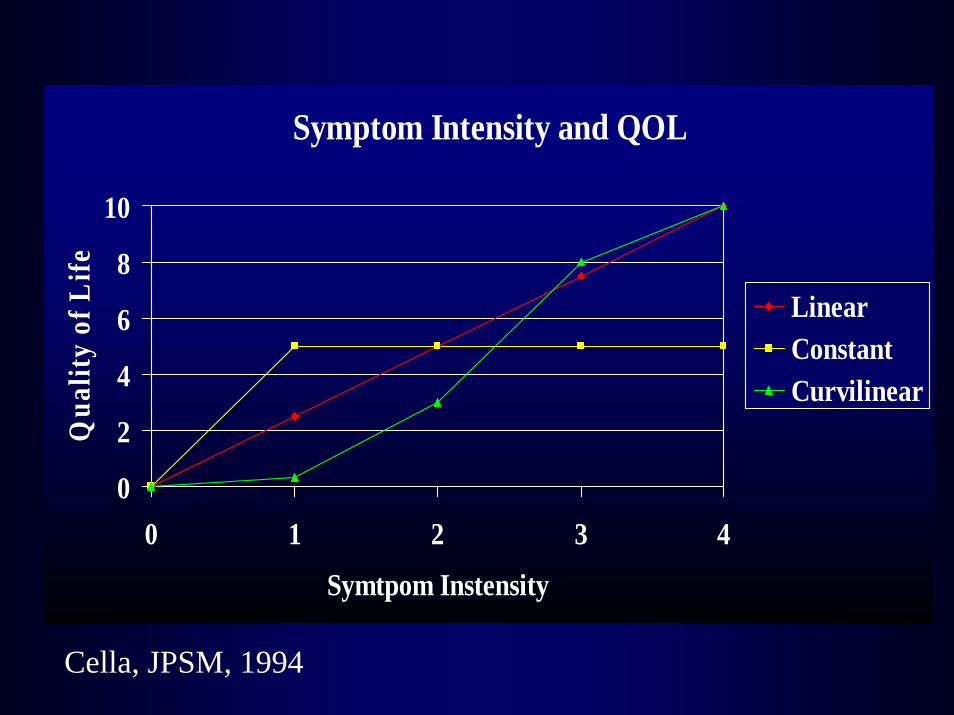
Symptom Intensity and QOL
0
2
4
6
8
10
0 1 2 3 4
Symtpom Instensity
Qua
lity
of L
ife
LinearConstantCurvilinear
Cella, JPSM, 1994

Symptom Duration and Quality of Life
0
2
4
6
8
10
1 2 3 4 5 6 7 8 9 10 11 12
Duration in months
Qua
lity
of L
ife
ChronicityNo RelationshipAdaptation

Major Issues in Design & Method:Instrument Selection
• Do you want to study general QOL or a specific symptom or functional outcome?
• What is the purpose of obtaining data?– Change treatment or policy?
• What time burden will patients be able to tolerate?– How can you minimize subject burden.
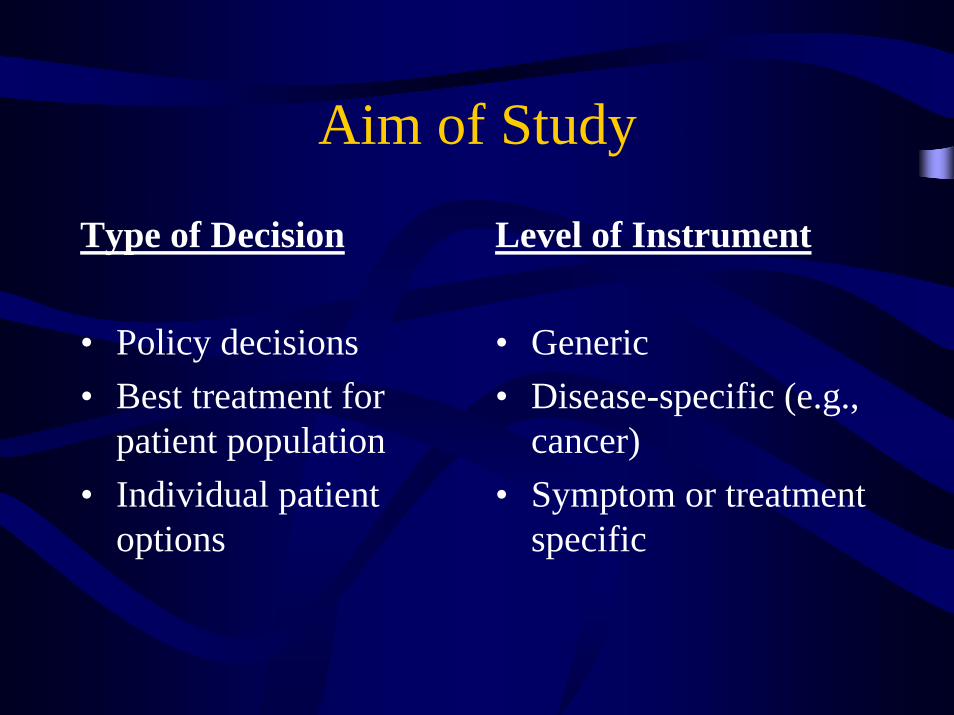
Aim of Study
Type of Decision
• Policy decisions• Best treatment for
patient population• Individual patient
options
Level of Instrument
• Generic• Disease-specific (e.g.,
cancer)• Symptom or treatment
specific
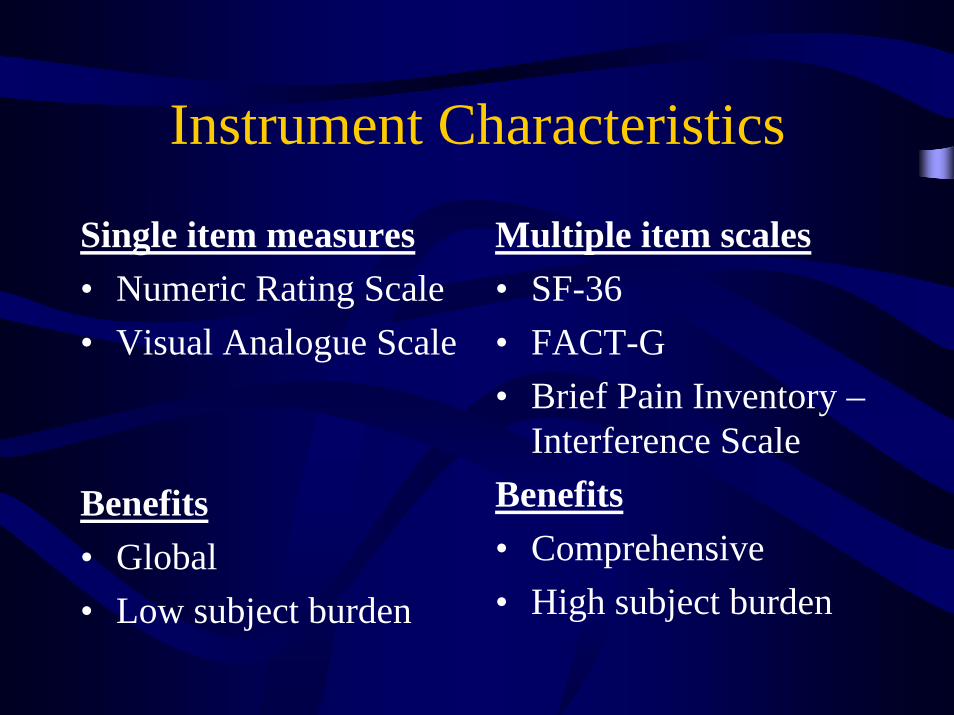
Instrument Characteristics
Single item measures• Numeric Rating Scale• Visual Analogue Scale
Benefits• Global• Low subject burden
Multiple item scales• SF-36• FACT-G• Brief Pain Inventory –
Interference ScaleBenefits• Comprehensive• High subject burden