Quality of cosmetics with active caffeine in cream and gel ...
16
1/16 Brazilian Journal of Biology, 2022, vol. 82, e241043 | https://doi.org/10.1590/1519-6984.241043 Original Article ISSN 1519-6984 (Print) ISSN 1678-4375 (Online) This is an Open Access article distributed under the terms of the Creative Commons Attribution License, which permits unrestricted use, distribution, and reproduction in any medium, provided the original work is properly cited. 1. Introduction The cosmetics industry is currently the fastest growing, and this increase in demand has attracted the attention of investors in the development and manufacture of cosmetic products. In order to remain on the market, innovation is required, which requires manufacturers to continuously develop new products. However, scientific evidence that begins with the active ingredient added to the formula and the vehicle and pharmaceutical form of different physical states in order to carry the active ingredient to its site of action (Vanzin, 2015), has been necessary to guarantee a product of proven quality and effectiveness. In Brazil, the Ministry of Health is the body that controls the manufacture and import of all cosmetic Abstract As there is a great scarcity of studies on the importance of good compounding practices in the preparation of cosmetics, this study aimed to evaluate the quality control of cosmetics with active ingredient caffeine for the treatment of cellulite prepared by magistrals pharmacies. Microbiological analyzes, pH determination, color measurement, quantification of the percentage of the active ingredient caffeine and viscosity in creams and gels with 5% of the active ingredient caffeine were performed. In the microbiological analysis, the presence of molds and yeasts was verified above the permitted level according to the Brazilian pharmacopoeia. The pH decreased over time, contributing to the formulations becoming more acidic. In the color parameters, it was found that pharmacy F4 showed a brownish color, both for the gel and for the cream. The percentage of caffeine was within specifications in all formulations and the viscosity remained unchanged during the shelf life of the samples. It is important that the compounding pharmacies demand more effectively the commitment of the team, as well as the analysis of the raw material according to the microbiological control regulations to translate into the quality of the products prepared by the pharmacies and favor the consumer in the effective objective that the product you want to achieve. Keywords: caffeine, permeation, microbiological control, quality. Resumo Como há uma grande escassez de estudos sobre a importância de boas práticas de manipulação na elaboração de cosméticos, o presente estudo teve como objetivo avaliar o controle de qualidade de cosméticos com princípio ativo cafeína para o tratamento de celulite, elaborados por farmácias de manipulação de Campo Mourão. Foram realizadas análises microbiológicas, determinação do pH, mensuração da coloração, quantificação da porcentagem do princípio ativo cafeína e viscosidade em cremes e geís com 5% do princípio ativo cafeína. Nas análises microbiológicas foi verificada a presença de bolores e leveduras acima do pemitido segundo a farmacopéia brasileira. O pH diminuiu ao longo do tempo, contribuindo para que as formulações ficassem mais ácidas. Nos parâmetros de cor averiguou-se que a farmácia F4 apresentou uma coloração amarronzada, tanto para o gel quanto para o creme. A porcentagem de cafeína estava dentro das especificações em todas as formulações e a viscosidade se manteve inalterada durante o prazo de validade das amostras. Com o propósito de um melhor preparo magistral é importante que as farmácias de manipulação exijam de forma mais eficaz o comprometimento da equipe, bem como a análise da matéria-prima segundo as regulamentações de controle microbiológico. Além disso, a implementação de normas mais rígidas e o melhor controle da matéria-prima e das formulações finais fazem com que a qualidade dos produtos manipulados pelas farmácias magistrais seja aumentada significativamente, favorecendo o consumidor na efetiva finalidade a que o produto objetiva atingir. Palavras-chave: cafeína, permeação, controle microbiológico, qualidade. Quality of cosmetics with active caffeine in cream and gel galenic bases prepared by compounding pharmacies Qualidade de cosméticos com cafeína ativa em bases galênicas em creme e gel preparadas por farmácias de manipulação E. M. Vogel a , L. L. M. Marques b , A. A. Droval b , A. M. Gozzo b , and F. A. R. Cardoso a * a Universidade Tecnológica Federal do Paraná – UTFPR, Programa de Pós-graduação em Inovações Tecnológicas – PPGIT, Campo Mourão, PR, Brasil b Universidade Tecnológica Federal do Paraná – UTFPR, Departamento de Engenharia de Alimentos, Campo Mourão, PR, Brasil *e-mail: [email protected] Received: July 16, 2020 – Accepted: October 28, 2020
Transcript of Quality of cosmetics with active caffeine in cream and gel ...

1/16Brazilian Journal of Biology, 2022, vol. 82, e241043 | https://doi.org/10.1590/1519-6984.241043
Original Article
THE INTERNATIONAL JOURNAL ON NEOTROPICAL BIOLOGYTHE INTERNATIONAL JOURNAL ON GLOBAL BIODIVERSITY AND ENVIRONMENT
ISSN 1519-6984 (Print)ISSN 1678-4375 (Online)
This is an Open Access article distributed under the terms of the Creative Commons Attribution License, which permits unrestricted use, distribution, and reproduction in any medium, provided the original work is properly cited.
1. Introduction
The cosmetics industry is currently the fastest growing, and this increase in demand has attracted the attention of investors in the development and manufacture of cosmetic products. In order to remain on the market, innovation is required, which requires manufacturers to continuously develop new products. However, scientific evidence that begins with the active ingredient added
to the formula and the vehicle and pharmaceutical form of different physical states in order to carry the active ingredient to its site of action (Vanzin, 2015), has been necessary to guarantee a product of proven quality and effectiveness.
In Brazil, the Ministry of Health is the body that controls the manufacture and import of all cosmetic
AbstractAs there is a great scarcity of studies on the importance of good compounding practices in the preparation of cosmetics, this study aimed to evaluate the quality control of cosmetics with active ingredient caffeine for the treatment of cellulite prepared by magistrals pharmacies. Microbiological analyzes, pH determination, color measurement, quantification of the percentage of the active ingredient caffeine and viscosity in creams and gels with 5% of the active ingredient caffeine were performed. In the microbiological analysis, the presence of molds and yeasts was verified above the permitted level according to the Brazilian pharmacopoeia. The pH decreased over time, contributing to the formulations becoming more acidic. In the color parameters, it was found that pharmacy F4 showed a brownish color, both for the gel and for the cream. The percentage of caffeine was within specifications in all formulations and the viscosity remained unchanged during the shelf life of the samples. It is important that the compounding pharmacies demand more effectively the commitment of the team, as well as the analysis of the raw material according to the microbiological control regulations to translate into the quality of the products prepared by the pharmacies and favor the consumer in the effective objective that the product you want to achieve.
Keywords: caffeine, permeation, microbiological control, quality.
ResumoComo há uma grande escassez de estudos sobre a importância de boas práticas de manipulação na elaboração de cosméticos, o presente estudo teve como objetivo avaliar o controle de qualidade de cosméticos com princípio ativo cafeína para o tratamento de celulite, elaborados por farmácias de manipulação de Campo Mourão. Foram realizadas análises microbiológicas, determinação do pH, mensuração da coloração, quantificação da porcentagem do princípio ativo cafeína e viscosidade em cremes e geís com 5% do princípio ativo cafeína. Nas análises microbiológicas foi verificada a presença de bolores e leveduras acima do pemitido segundo a farmacopéia brasileira. O pH diminuiu ao longo do tempo, contribuindo para que as formulações ficassem mais ácidas. Nos parâmetros de cor averiguou-se que a farmácia F4 apresentou uma coloração amarronzada, tanto para o gel quanto para o creme. A porcentagem de cafeína estava dentro das especificações em todas as formulações e a viscosidade se manteve inalterada durante o prazo de validade das amostras. Com o propósito de um melhor preparo magistral é importante que as farmácias de manipulação exijam de forma mais eficaz o comprometimento da equipe, bem como a análise da matéria-prima segundo as regulamentações de controle microbiológico. Além disso, a implementação de normas mais rígidas e o melhor controle da matéria-prima e das formulações finais fazem com que a qualidade dos produtos manipulados pelas farmácias magistrais seja aumentada significativamente, favorecendo o consumidor na efetiva finalidade a que o produto objetiva atingir.
Palavras-chave: cafeína, permeação, controle microbiológico, qualidade.
Quality of cosmetics with active caffeine in cream and gel galenic bases prepared by compounding pharmaciesQualidade de cosméticos com cafeína ativa em bases galênicas em creme e gel preparadas por farmácias de manipulação
E. M. Vogela , L. L. M. Marquesb , A. A. Drovalb , A. M. Gozzob , and F. A. R. Cardosoa* a Universidade Tecnológica Federal do Paraná – UTFPR, Programa de Pós-graduação em Inovações Tecnológicas – PPGIT, Campo Mourão, PR, Brasilb Universidade Tecnológica Federal do Paraná – UTFPR, Departamento de Engenharia de Alimentos, Campo Mourão, PR, Brasil
*e-mail: [email protected]: July 16, 2020 – Accepted: October 28, 2020

Brazilian Journal of Biology, 2022, vol. 82, e2410432/16
Vogel, E.M. et al.
products in order to offer the quality and safety necessary for human consumption.
Cosmetics are considered preparations consisting of natural or synthetic substances, for external use in different parts of the human body and with the sole or main purpose of cleaning, perfuming, altering their appearance and or correcting body odors and/or protecting them. or keep them in good condition (Brasil, 2015).
The advancement of technology and constant research in the cosmetology area have generated increasingly efficient research and concepts for aesthetic treatments. Like these, there is the term cosmeceutical, a word created by dermatologist Albert Kligmann, in 1980, which combines the word pharmaceutical with the word cosmetic. Cosmeceuticals contain medicinally active substances, that is, they are cosmetics with a light medicinal action and that have in their formula ingredients with moderate therapeutic properties. This term, however, is not recognized by any pharmaceutical or cosmetic regulatory authority. Cosmeceuticals can also be called dermocosmetics, products used for treatments in aesthetic clinics (Borges and Scorza, 2016).
The main component of a cosmetic is the active ingredient, a substance that has a more pronounced effect or that gives the final action, the biomaterials, which participate in specific biological reactions, such as lipolysis, lipogenesis, melanogenesis and tissue repair. Among these, caffeine stands out, a hydrophilic substance, an alkaloid from the group of xanthines, found in some food products such as coffee, tea, cola, guarana and mate. It is used as a central nervous system stimulant with a lipolytic mechanism of action, a phosphodiesterase and adenosine inhibitor that increases the cyclic cAMP (adenosyl monophosphate) messenger of lipolysis and reduces the size of adipocytes. It is indicated as an aid in unsightly treatments of lipostrophy and FEG (cellulite). According to ANVISA’s Technical Opinion No. 1 of June 29, 2001, its concentration is 8% for cosmetics based on non-ionic gel or cream because it facilitates the incorporation in the formula. Caffeine stimulates lipolysis by inhibiting phosphodiesterase that causes the activation of beta-adrenergic receptors that results in a lipolytic action (Borges and Scorza, 2016; Gomes, 2013).
Physicochemical characteristics, such as the molecular weight of 194.2 g per mol (g/mol) of caffeine, make it difficult to transpose the skin barrier, a limiting step in the skin permeation process. In industrialized topical cosmetic formulations, it is used in a concentration of 1-2%, although formulations with 5% are available on the market, the percentage used is directly linked to the galenic base, product purpose and the addition of other active ingredients due to its incorporation to ensure a final product without turbidity (Pereira, 2013).
Cosmetology also has a variety of active ingredients derived from caffeine, such as cafeisilane C, cafeiskin, glycosan caffeine, isso-slim complex, micropatch caffeine, and phytocafeil c plus, which act as mechanisms of action similar to those of caffeine (Fernandes et al., 2014).
In an in vivo study, Silva and Delfino (2018) evaluated the lipolytic action of caffeine and cafeisilane C. After histological analysis on the back of Wistar rats, when
compared with the control group, they found as a result a 17% reduction in the diameter of fat cells for caffeine and 16% for cafeisilane C when incorporated in non-ionic solutions.
Fernandes et al. (2014), observed the precipitation of caffeine in aqueous gels and discussed the phenomenon because it has a characteristic slightly soluble in water and which can provide formation of lumps that are difficult to redispersion, compromising the effectiveness due to the concentration in the site of action.
Cosmetics work as a complement in anti-cellulite treatment, as they act on the skin and can improve microcirculation by increasing blood flow, further reducing the formation of free radicals and promoting adipocyte reduction in the area. In addition, they can improve interstitial fluid absorption, decrease edema caused by cellulite and facilitate venous return (Borges and Scorza, 2016).
In view of the activities developed and offered to the population, this study aimed to evaluate the quality control of cosmetics with active ingredient caffeine prepared by compounding pharmacies in the interior of Paraná and the follow up of good compounding practices in compounding pharmacies, still more considering that good compounding practices are the responsibility of the pharmacy responsible for the quality of compounding or officinal preparations that it prepares, preserves, dispenses and transports.
2. Material and Methods
2.1. Material
In order to carry out the research, a survey was first carried out of compounding pharmacies of a municipality in the interior of Paraná and, later, the project was presented to them for participation, data collection and preparation of the cosmetic under study. The responsible pharmacists signed an informed consent form, which presents the project and its stages as well as the strict secrecy of the results.
The request for cosmetic formulations was delimited for preparation on a single date for analysis at time zero, thirty, sixty and ninety days.
The request was made individually to each pharmacist with the most used cosmetic bases with their indication. In each of the bases, the amount of active ingredient caffeine at 5% was requested, a percentage justified for better incorporation in the bases, maintaining the homogeneity of the formulation, separated into ten- and twenty-gram sachets with gel and cream bases without the addition of other actives or preservatives (Figures A1 to A4 in Supplementary Material - Appendix A).
The participating pharmacies were named Pharmacy 1 (F1) which used gel (G1) and cream (C1) of their own manufacture, Pharmacy 2 (F2) which used aristoflex as a gel base (G2) and non-ionic cream (C2), Pharmacy 3 (F3) which used natrosol as a gel base (G3) and non-ionic cream (C3) and Pharmacy 4 (F4) which used natrosol as a gel base (G4) and lanette cream (anionic cream) (G4).

Brazilian Journal of Biology, 2022, vol. 82, e241043 3/16
Quality of cosmetics with active caffeine
The expiration dates for gel-based and cream-based cosmetics varied as follows:F1: manufacturing date 05/03/2019 expiration date
08/31/2019F2: manufacturing date 05/03/2019 expiration date
08/01/2019F3: manufacturing date 05/03/2019 expiration date
08/01/2019F4: manufacturing date 05/03/2019 expiration date
10/30/2019
2.2. Methods
2.2.1. Microbiological assay
In order to carry out microbiological tests, pharmacists were asked which reports were required and analyzed by health surveillance in accordance with the rules in force in the city where the analysis took place. The analyzed reports are the count of heterotrophic bacteria, total coliforms F1 Staphylococcus aureus F2, Escherichia coli, Pseudomonas aeruginosa, Staphylococcus aureus, total count of aerobic mesophilic bacteria and total count of molds and yeasts F3 and galenic bases F4.
The microbiological tests carried out for non-sterile pharmaceutical products are those of mesophilic microorganisms count (bacteria, yeasts and fungi) and research of pathogenic microorganisms. Also, according to the Pharmacopoeia, for galenic bases the total count of bacteria CFU/g or mL is 103 and the total count of fungi/yeasts CFU/g or mL is 102 meaning the absence of Escherichia coli, Pseudomonas aeruginosa and Staphylococcus aureus in 1g, or mL, absence of Salmonella spp in 10g, or 10 mL (Rebello, 2016).
The total number count of mesophilic microorganisms and fungi in non-sterile raw materials with sachets of ten grams each being cream and gel was carried out in triplicate in the culture media Sabouraud dextrose agar at 22.5 °C ± 2.5 °C and casein soy agar at 32.5 °C ± 2.5 °C and within 7 days.
In laboratory C003 and C004 of UTFPR (Federal University of Technology – Paraná), ten grams of the sample were transferred to obtain a 1:10 dilution in casein-soy broth containing 0.1 tetradecyl sulfate sodium, heated to 40 - 45 °C and stirred until mixture remains homogeneous. Carefully the mixture was always kept at temperature for the minimum time necessary for the formation of an emulsion, in any case not more than 30 minutes. If necessary, adjust the pH to 6.5-7.5. The solution was prepared in successive decimal dilutions with the same diluent plus 0.1% sodium tetradecyl sulfate (Brasil, 2010).
For the surface method, 15-20 mL of casein soy agar and Sabouraud dextrose agar were added separately in Petri dishes until solid. After the plates were dried and 0.1 mL of the prepared sample was added to the surface of each culture medium. The plates containing casein-soy agar were incubated at 32.5 °C ± 2.5 °C for 3-5 days and the plates containing Sabouraud dextrose agar at 22.5 °C ± 2.5 °C for 5-7 days for determination the number of total aerobic microorganisms and molds and yeasts, respectively. The arithmetic mean of the plate count of
each medium was taken and the number of CFU per gram or mL of product was calculated (Teodoro et al., 2019).
2.2.2. Physicochemical analysis
In laboratory C004 of UTFPR (Federal University of Technology - Paraná) the physical-chemical parameters were analyzed: potential of hydrogen (pH) and colorimetry. The pH of the samples was measured in triplicate with the pHmeter testo 205 instrument for measuring pH for semi-solid media at room temperature. Staining was verified with the MiniScan EZ 4500L spectrophotometer equipment indicated for semi-solid material in triplicate at room temperature.
2.2.3. Viscosity analysis
In order to analyze the behavior of viscosity, the Brookfield DVIII Ultra Programmable Rheometer equipment installed in laboratory C104 of UTFPR (Federal University of Technology - Paraná) was used. The measurements were performed with spindle rotation speed of 25 millimeters starting from zero up to a maximum of 250 rpm. The samples were subjected to duplicate tests on the Herschel-Bulkley model. Equation 1 Herschel-Bulkley is given by:
( )nOH HT T K . Y= + (1)
where: T: shear stress,Y: strain rate,KH: consistency index,n: behavior index,TOH: initial shear stress.
The data collected by the rheometer in stationary phase were shear stress, strain rate and apparent viscosity, parameters extracted from the mean of the second increasing curve of the rheograms, seeking to avoid the influences of the inertia of the equipment. The measurement of the data was only possible in the cream samples due to the non-reading of the galenic bases in gel of the equipment, this is due to the self-sustaining characteristic of the sample, a limiting factor for the adequate reading of the rotational rheometers of concentric cylinders. For the galenic bases in gel, the appropriate equipment would be the viscometer which could not be read due to the non-availability of it.
The variations in the rotation speed in rotation per minute of the creams from time zero to ninety days were determined according to Table 1.
2.2.4. Kitzberger methodology adapted for determination of caffeine
Initially, the test was carried out to verify the caffeine curve with 99% pure raw material. In the preparation of the buffer solution in a volumetric flask, 3.66 g of sodium acetate were used and dissolved in 690 mL of acetic acid and 500 mL of distilled water were added and reserved. After weighing 0.0022 g of caffeine diluted in 100 mL of distilled water. In test tubes, eight samples were prepared in quintuplicate for later reading in the UV-visible spectrophotometer equipment installed in

Brazilian Journal of Biology, 2022, vol. 82, e2410434/16
Vogel, E.M. et al.
the room attached to laboratory C004 of UTFPR (Federal University of Technology - Paraná).
The preparation of the Kitzberger test adapted for the extraction of caffeine in cosmetics was carried out in the gel and cream formulation with active ingredient 5% caffeine and cafeisilane in triplicate totaling twenty-four samples.
Initially 0.8 g of samples were weighed in aluminum foil on the Bioscale analytical balance for precision weighing. Then, in 50 mL beakers, they were diluted with 10 mL of boiling distilled water measured in a 10 mL pipette heated in the 100 mL beaker in the C-Mag HS 7 electromagnetic stirrer. Of these, 2 mL of each sample were transferred to test tubes and reserved.
In the fume hood, in a 100 mL beaker, 54 mL of distilled water were placed at room temperature and 6 mL of sulfuric acid were added. The samples from the test tubes were taken to the fume hood and over them 2 mL of the water solution with sulfuric acid and 4 mL of chloroform were added.
All samples were stirred for ten minutes on the vortex stirrer in continuous mode. Then the solution was kept at rest for ten minutes. From the mixed samples, 2 mL were extracted and transported to 50 mL beakers and taken to a water bath at 80 °C for approximately ten hours for acid evaporation.
After evaporation, 10 mL of boiling distilled water were added to each sample. They were stirred and were sent for analysis in the UV-visible spectrophotometry equipment to read the wavelength.
2.2.5. Statistical analysis
The data were analyzed statistically by means of ANOVA analysis of variance in order to evaluate the existence of a significant difference in the standards evaluated between the different samples on the gel and cream bases.
The analysis and statistical graphs were generated with the aid of the Statistica 12.0 software.
3. Results and Discussions
3.1. Microbiological assay
The comparison of the results was based on the Brazilian Pharmacopoeia (Brasil, 2010), this mean result of strict and facultative aerobic mesophiles was mostly satisfactory, below the standard of 103 CFU/g or mL for the formulations, except for sample F3C which had a microbial load 1.6 x 10³ CFU of mesophiles/g of product, as shown in Table 2.
The mean result of molds and yeasts was mostly unsatisfactory, above the standard of 102 CFU/g or mL for the formulations, except for sample F4G which had a microbial load of 9.2x101 CFU of molds and yeasts/g of product, according to Table 2.
Therefore, the analyzes confirm that the only product that met mold and yeast standards, as well as mesophiles, was the gel prepared at Pharmacy 4. This means that F4G is a product in satisfactory health conditions because the analytical results of strict and optional aerobic mesophiles and molds and yeasts (Figures A9 and A10 in Supplementary Material - Appendix A) are within the limits established for the sample according to the Brazilian Pharmacopoeia.
According to Teodoro et al. (2019), high microbial loads change the stability of the product and lead to its deterioration, but there are still physical and chemical
Table 1. Rotation of creams.
Time zero Time 30 days Time 60 days Time 90 days
C1: from 0 to 150 rpm C1: from 0 to 100 rpm C1: from 0 to 100 rpm C1: from 0 to 150 rpm
C2: from 0 to 50 rpm C2: from 0 to 100 rpm C2: from 0 to 50 rpm C2: from 0 to 100 rpm
C3: from 0 to 20 rpm C3: from 0 to 20 rpm C3: from 0 to 10 rpm C3: from 0 to 20 rpm
C4: from 0 to 100 rpm C4: from 0 to 50 rpm C4: from 0 to 50 rpm C4: from 0 to 100 rpm
Table 2. Microbiological analysis.
Total mesophilic count
Gel/Cream MPN Pharmacopeia
F1C 577.5 5.8X10^2
F1G 960 9.6X10^2
F2C 865 8.6X10^2
F2G 769 7.9X10^2
F3C 1577.5 1.6X10^3
F3G 865 8.6X10^2
F4C 974.5 9.8X10^2
F4G 690 6.9X10^2
Total mold and yeast count
Gel/Cream MPN Pharmacopeia
F1C 720 7.2X10^2
F1G 462.5 4.6X10^2
F2C 917.5 9.2X10^2
F2G 620 6.2X10^2
F3C 1227.5 1.2X10^3
F3G 245 2.4X10^2
F4C 575 5.7X10^2
F4G 92.5 9.2X10^1
F1G = Pharmacy 1 gel; F2G = Pharmacy 2 gel; F3G = Pharmacy 3 gel; F4G = Pharmacy 4 gel; F1C = Pharmacy 1 cream; F2C = Pharmacy 2 cream; F3C = Pharmacy 3 cream, F4C = Pharmacy 4 cream and MPN = most probable number.

Brazilian Journal of Biology, 2022, vol. 82, e241043 5/16
Quality of cosmetics with active caffeine
changes that cause changes, such as breaking stability, changing pH and organoleptic characteristics (color, odor and texture), and inactivation of the active substances and excipients of the formulation in addition to economic losses and impaired visibility of pharmacies.
Cleaning and sanitation are fundamental in the production processes, they are the ones that define the final quality of the product. There is great concern about microbiological contamination as it exposes the user. In compounding pharmacies, non-sterile products are generally produced with a limit on the microbial load. The high microbial load can compromise the stability of the product and the loss of effectiveness due to degradation of the active ingredient (Mota et al., 2017).
Pharmaceutical ingredients such as galenic bases have microbial limits of 2 x 10³ for total anaerobic bacteria count and 2 x 10² for fungi and yeasts. They must be free of Escherichia coli, Pseudomonas aeruginosa, Staphylococcus aureus and Salmonella spp (Brasil, 2013) pathogens.
3.2. Physical-chemical analysis
Regarding the pH analysis for gels, there are significant differences among pharmacies in the data in Table 3. The highest pH value was for Pharmacy 3 and the lowest value for Pharmacy 1, this over the 90 days of analyze. Regarding the pH values for each pharmacy individually over the 90 days, it was possible to see small variations in the sense that the pH value decreased over the 90 days. For the pH analysis in creams, the highest values were also for Pharmacy 3, while the lowest values were for Pharmacy 2, showing significant differences between all means. Over the 90 days there was also a drop in pH values for all pharmacies, although small, causing some means to not differ from others at the 5% significance level, as best seen in Figure 1.
Sousa et al. (2019), describes that the hydrogen potential is characterized by its conditions of acidity, neutrality and alkalinity of the medium, in which the concentration of hydrogen ions is measured on a scale of 0 to 14, where the acid level from o to 6 and basic from 8 to 14.7 can be found, the medium 7 is considered neutral.
The pH can be measured by the equation pH = -log [H3O+]
(Atkins et al., 2011). In the pH calculation, it is possible to observe that the pH is inversely proportional to the concentration of H3O
+ ions, so the greater the number of ions, the lower the pH value. Considering that pH is the common negative logarithm of the H3O
+ ion concentration and, in this way, a product with a more alkaline pH increases the amount of negative charges (Goshiyama, 2019).
The decrease in pH during the ninety days denotes an increase in the acidity of the formulations, which improves the slow permeation through the skin to the recipient cell.
Goshiyama (2019) interprets the coordinates for colorimetry evaluation, with the value L* being the luminosity, this parameter varies from 0 to 100, from black to white respectively, a* represents the variation between the red and green shades, in which positive values indicate shades more reddish and the negative values the greenish and b* is the variation between the blue and yellow shades, with positive values for the bluish and negative values for the yellowish.
In color analysis, the L* coordinate represents the luminosity and the higher it is, the closer to white it approaches. Table 4 shows that the cosmetics that used creams as a base, the L* value is much higher than those that used gels as a base. Thus, it can be said that creams are more opaque than gels and these, in turn, are more transparent. The cream at Pharmacy 3 was the whitest and the gel was the most transparent. Over the 90 days, Pharmacies 1, 2 and 3 had a decrease in the values of the L* coordinate for the gels, while Pharmacy 4 had its value increased. This means that the transparency for Pharmacy 4 increased over the days and for Pharmacy 1, 2 and 3 it decreased and to a greater extent in Pharmacy 1, which presented a much larger granulation in relation to Pharmacy 2 and 3. For creams, the opposite happened, while Pharmacies 1, 2 and 3 had their values increased, Pharmacy 4 had its value decreased. The cream at Pharmacy 4 darkened more after 90 days, becoming browner than in the beginning of the analysis. The results show the lack of stability of the formulations; however, it did not represent a validity of the organoleptic properties of the samples.
Table 3. Means and standard deviations for gel-based formulations for the pH factor.
Samples Day 0 Day 30 Day 60 Day 90
G1 4.587dA±0.001 4.367dB±0.015 4.293dC±0.017 4.070dD±0.012
G2 4.960cA±0.021 4.940cA±0.029 4.657cB±0.003 4.377cC±0.003
G3 6.347aA±0.003 6.317aA±0.012 6.317aA±0.007 6.320aA±0.017
G4 5.380bB±0.006 5.420bA±0.000 5.427bA±0.007 5.163bC±0.009
C1 5.623bA±0.003 5.539bA±0.000 5.473bAB±0.057 5.357bB±0.034
C2 5.237dA±0.019 5.200cAB±0.006 5.183cB±0.012 4.897dC±0.003
C3 6.403aA±0.003 6.313aB±0.012 6.387aA±0.015 6.267aB±0.013
C4 5.437cB±0.007 5.490bA±0.020 5.490bA±0.006 5.227cC±0.007
Means in the same column. followed by distinct lower-case letters. differ from each other by the Tukey test, at the significance level of 5%. Means on the same line, followed by different capital letters, differ by the Tukey test, at the significance level of 5%. G1 = Pharmacy 1 gel; G2 = Pharmacy 2 gel; G3 = Pharmacy 3 gel; G4 = Pharmacy 4 gel; C1 = Pharmacy 1 cream; C2 = Pharmacy 2 cream; C3 = Pharmacy 3 cream and C4 = Pharmacy 4 cream.

Brazilian Journal of Biology, 2022, vol. 82, e2410436/16
Vogel, E.M. et al.
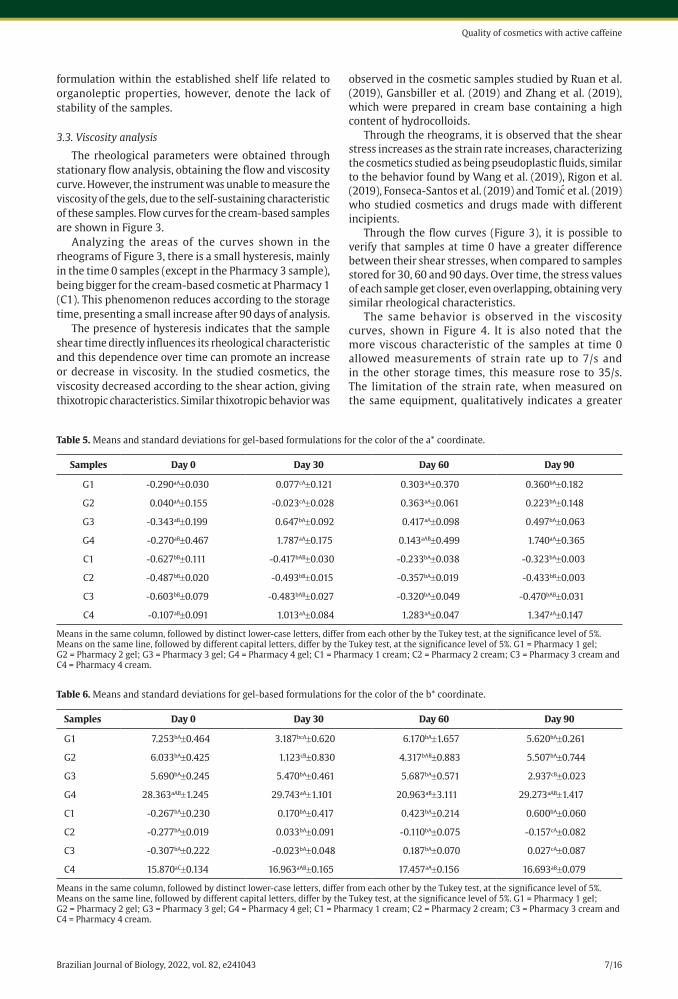
Regarding the a* coordinate, which represents the red/green ratio, the presence of low values in Table 5 is notorious, for both gels and creams. It is also possible to verify that the means did not present significant differences, with the exception of Pharmacy 4 whose cream has a browner shade. Highlight this very present with respect to the b* coordinate (Table 6), which represents the relationship between blue and yellow. High values
for the b* coordinate indicate a greater approximation of the yellowish shades, represented here by the creams and gels of Pharmacy 4.
Figure 2 corroborates the color analysis and highlights the differences among pharmacies, especially with regard to Pharmacy 4.
These results show that the color parameter varying in the ninety days does not affect the quality of the
Figure 1. pH analysis for cosmetics in cream and gel base.
Table 4. Means and standard deviations for gel-based formulations for the color of the L* coordinate.
SAMPLES Day 0 Day 30 Day 60 Day 90
G1 83.630aA±1.408 70.497aB±0.485 78.837aA±1.577 72.473abB±1.443
G2 74.603bA±0.855 62.580bB±2.499 72.830abAB±1.450 70.110abAB±4.278
G3 73.610bA±1.129 69.870aA±1.449 70.220bA±1.157 64.120bB±1.107
G4 76.930bA±0.427 74.893aA±0.345 75.417abA±1.728 78.427aA±0.531
C1 91.707bA±0.084 94.057aA±1.440 94.620aA±0.574 95.020aA±0.215
C2 95.023aA±0.139 96.660aA±0.072 95.777aA±0.254 95.090aA±1.187
C3 93.547aB±0.596 94.700aAB±0.225 95.203aA±0.324 94.900aAB±0.107
C4 81.367cA±0.250 80.893bAB±0.504 79.960bAB±0.103 79.727bB±0.398
Means in the same column, followed by distinct lower-case letters, differ from each other by the Tukey test, at the significance level of 5%. Means on the same line, followed by different capital letters, differ by the Tukey test, at the significance level of 5%. G1 = Pharmacy 1 gel; G2 = Pharmacy 2 gel; G3 = Pharmacy 3 gel; G4 = Pharmacy 4 gel; C1 = Pharmacy 1 cream; C2 = Pharmacy 2 cream; C3 = Pharmacy 3 cream and C4 = Pharmacy 4 cream.
Brazilian Journal of Biology, 2022, vol. 82, e241043 7/16
Quality of cosmetics with active caffeine
formulation within the established shelf life related to organoleptic properties, however, denote the lack of stability of the samples.
3.3. Viscosity analysis
The rheological parameters were obtained through stationary flow analysis, obtaining the flow and viscosity curve. However, the instrument was unable to measure the viscosity of the gels, due to the self-sustaining characteristic of these samples. Flow curves for the cream-based samples are shown in Figure 3.
Analyzing the areas of the curves shown in the rheograms of Figure 3, there is a small hysteresis, mainly in the time 0 samples (except in the Pharmacy 3 sample), being bigger for the cream-based cosmetic at Pharmacy 1 (C1). This phenomenon reduces according to the storage time, presenting a small increase after 90 days of analysis.
The presence of hysteresis indicates that the sample shear time directly influences its rheological characteristic and this dependence over time can promote an increase or decrease in viscosity. In the studied cosmetics, the viscosity decreased according to the shear action, giving thixotropic characteristics. Similar thixotropic behavior was
observed in the cosmetic samples studied by Ruan et al. (2019), Gansbiller et al. (2019) and Zhang et al. (2019), which were prepared in cream base containing a high content of hydrocolloids.
Through the rheograms, it is observed that the shear stress increases as the strain rate increases, characterizing the cosmetics studied as being pseudoplastic fluids, similar to the behavior found by Wang et al. (2019), Rigon et al. (2019), Fonseca-Santos et al. (2019) and Tomic et al. (2019) who studied cosmetics and drugs made with different incipients.
Through the flow curves (Figure 3), it is possible to verify that samples at time 0 have a greater difference between their shear stresses, when compared to samples stored for 30, 60 and 90 days. Over time, the stress values of each sample get closer, even overlapping, obtaining very similar rheological characteristics.
The same behavior is observed in the viscosity curves, shown in Figure 4. It is also noted that the more viscous characteristic of the samples at time 0 allowed measurements of strain rate up to 7/s and in the other storage times, this measure rose to 35/s. The limitation of the strain rate, when measured on the same equipment, qualitatively indicates a greater
Table 5. Means and standard deviations for gel-based formulations for the color of the a* coordinate.
Samples Day 0 Day 30 Day 60 Day 90
G1 -0.290aA±0.030 0.077cA±0.121 0.303aA±0.370 0.360bA±0.182
G2 0.040aA±0.155 -0.023cA±0.028 0.363aA±0.061 0.223bA±0.148
G3 -0.343aB±0.199 0.647bA±0.092 0.417aA±0.098 0.497bA±0.063
G4 -0.270aB±0.467 1.787aA±0.175 0.143aAB±0.499 1.740aA±0.365
C1 -0.627bB±0.111 -0.417bAB±0.030 -0.233bA±0.038 -0.323bA±0.003
C2 -0.487bB±0.020 -0.493bB±0.015 -0.357bA±0.019 -0.433bB±0.003
C3 -0.603bB±0.079 -0.483bAB±0.027 -0.320bA±0.049 -0.470bAB±0.031
C4 -0.107aB±0.091 1.013aA±0.084 1.283aA±0.047 1.347aA±0.147
Means in the same column, followed by distinct lower-case letters, differ from each other by the Tukey test, at the significance level of 5%. Means on the same line, followed by different capital letters, differ by the Tukey test, at the significance level of 5%. G1 = Pharmacy 1 gel; G2 = Pharmacy 2 gel; G3 = Pharmacy 3 gel; G4 = Pharmacy 4 gel; C1 = Pharmacy 1 cream; C2 = Pharmacy 2 cream; C3 = Pharmacy 3 cream and C4 = Pharmacy 4 cream.
Table 6. Means and standard deviations for gel-based formulations for the color of the b* coordinate.
Samples Day 0 Day 30 Day 60 Day 90
G1 7.253bA±0.464 3.187bcA±0.620 6.170bA±1.657 5.620bA±0.261
G2 6.033bA±0.425 1.123cB±0.830 4.317bAB±0.883 5.507bA±0.744
G3 5.690bA±0.245 5.470bA±0.461 5.687bA±0.571 2.937cB±0.023
G4 28.363aAB±1.245 29.743aA±1.101 20.963aB±3.111 29.273aAB±1.417
C1 -0.267bA±0.230 0.170bA±0.417 0.423bA±0.214 0.600bA±0.060
C2 -0.277bA±0.019 0.033bA±0.091 -0.110bA±0.075 -0.157cA±0.082
C3 -0.307bA±0.222 -0.023bA±0.048 0.187bA±0.070 0.027cA±0.087
C4 15.870aC±0.134 16.963aAB±0.165 17.457aA±0.156 16.693aB±0.079
Means in the same column, followed by distinct lower-case letters, differ from each other by the Tukey test, at the significance level of 5%. Means on the same line, followed by different capital letters, differ by the Tukey test, at the significance level of 5%. G1 = Pharmacy 1 gel; G2 = Pharmacy 2 gel; G3 = Pharmacy 3 gel; G4 = Pharmacy 4 gel; C1 = Pharmacy 1 cream; C2 = Pharmacy 2 cream; C3 = Pharmacy 3 cream and C4 = Pharmacy 4 cream.

Brazilian Journal of Biology, 2022, vol. 82, e2410438/16
Vogel, E.M. et al.
Figure 2. Color analysis for cosmetics in cream and gel base.
Figure 3. Flow curve for cream-based cosmetics at time 0 and stored for 30, 60 and 90 days. Of which: C1 (cream-based cosmetic at Pharmacy 1), C2 cream-based cosmetic at Pharmacy 2), C3 (cream-based cosmetic at Pharmacy 3) and C4 cream-based cosmetic at Pharmacy 4).

Brazilian Journal of Biology, 2022, vol. 82, e241043 9/16
Quality of cosmetics with active caffeine
stable to extreme temperature and pH variations. One of the extraction methods is spectrophotometry by absorbing electromagnetic radiation in the ultraviolet region and its absorption is between 271 and 275 nanometers in wavelength (Kitzberger et al., 2013).
The analyzes were performed for cosmetic products prepared with caffeine in gel and cream bases. Four pharmacies were evaluated in order to verify the quality control of the products. Both bases, gel and cream, were denoted by G1, G2, G3, G4, C1, C2, C3 and C4, respectively for each of the four pharmacies, designated by 1, 2, 3 and 4.
Initially the samples were weighed to determine the exact amount of gel and cream used for each caffeine extraction. Table 8 presents the results and allows us to observe that the measurement standard for all samples was maintained throughout the 90 days of analysis because the means do not have significant differences.
After weighing, the samples were tested for caffeine. For this, a spectrophotometer was used in order to verify the wavelength of each sample according to a standard-length equivalent to 275 nm. The results of the eight samples are shown in Table 9.
From the results obtained by the spectrum, it was possible to verify that all samples reached the minimum value stipulated by Holiday, which in the middle of the 20th century, when the author described that caffeine had a maximum limit of ultraviolet absorption between the wavelengths of 271 and 275 nanometers, that is, the absorption of electromagnetic radiation in the ultraviolet (UV) region was higher in all evaluated cases,
viscoelasticity characteristic. However, this parameter can only be quantified in oscillatory tests, restricted to more specific equipment.
As in the flow curves (Figure 3), in the viscosity rheograms (Figure 4) the samples tended to behave very similar to each other, regardless of the origin of manufacture. This behavioral approximation occurred during the 30-day storage period, remaining stable until the end of the analyzes (90 days). Cosmetic samples, therefore, showed a visibly stable rheological behavior throughout this study.
Due to the pseudoplastic behavior of the samples, the Casson, Bingham and Herschel-Bulkley (HB) models were tested. Among the models analyzed, HB had the highest correlation coefficient (R2) and the lowest error for all analyzed samples.
The rheological parameters modeled from the Herschel-Bulkley constitutive equation are shown in Table 7, and can be used, in a highly reliable way, in industrial processes, as a quality parameter and in studies of the shelf life of these products.
3.4. Kitzberger methodology adapted for determination of caffeine
Chemically known as 1,3,7-trimethylxanthine or trimethyldioxipurine, caffeine is a chemical compound that was discovered and isolated from coffee by chemist Ferdinand Runge in 1820 in Germany, this alkaloid is found in coffee seeds, green tea leaves, mate herb and guarana. When pure it is odorless, with a bitter taste,
Figure 4. Viscosity curve for cream-based cosmetics, at time 0 and stored for 30, 60 and 90 days. Of which: C1 (cream-based cosmetic at Pharmacy 1), C2 (cream-based cosmetic at Pharmacy 2), C3 (cream-based cosmetic at Pharmacy 3) and C4 (cream-based cosmetic at Pharmacy 4).

Brazilian Journal of Biology, 2022, vol. 82, e24104310/16
Vogel, E.M. et al.
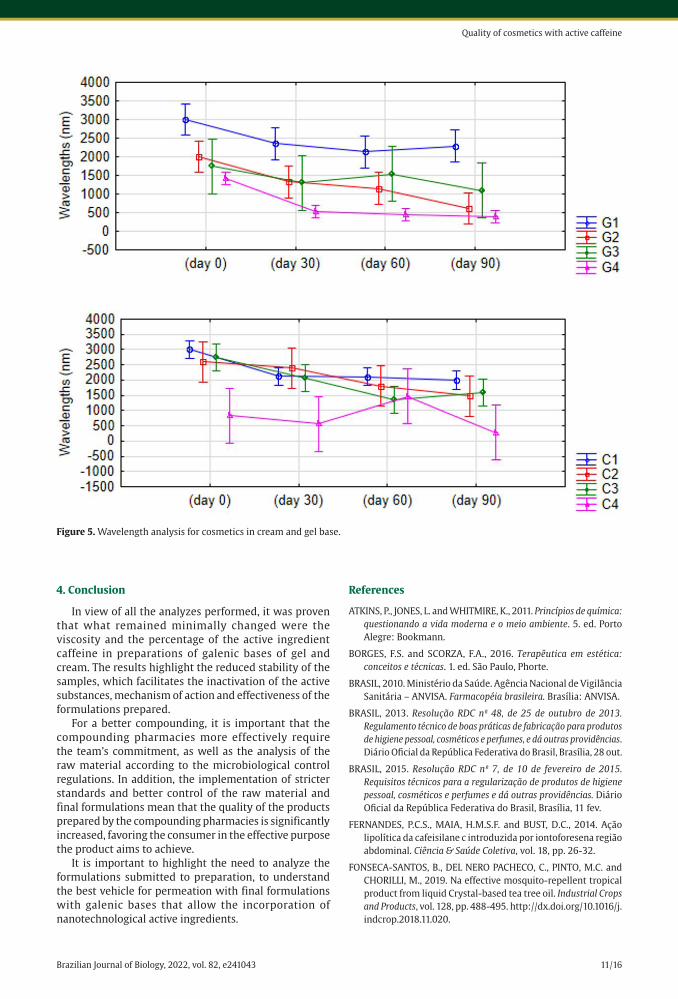
from Pharmacy 4 are those that significantly approach the parameters cited by Holiday in the middle of the 20th century. It is also possible to verify the decrease in wavelength over the 90 days of analysis for almost all samples. This reduction demonstrates the oxidation of the active ingredient caffeine, a condition in which the loss of electrons and the increase in the molecular charge of the active substance occurs.
which means that all samples contained the amount of the active caffeine according to the initial order at the magistral pharmacy.
Figure 5 further elucidates the data in Table 9 and highlights the Pharmacy 4 samples, both gel-based and cream-based, which have a shorter wavelength compared to the other samples, due to the active ingredient used being cafeisilane C instead of the active caffeine. The samples
Table 8. Means and standard deviations for gel-based formulations for the weight factor (g).
Samples Day 0 Day 30 Day 60 Day 90
G1 0.802aA±0.001 0.803aA±0.001 0.803aA±0.001 0.801aA±0.001
G2 0.805aA±0.001 0.805aA±0.002 0.805aA±0.002 0.801aA±0.000
G3 0.804aAB±0.002 0.803aAB±0.001 0.808aA±0.001 0.801aB±0.000
G4 0.803aA±0.002 0.802aA±0.001 0.833aA±0.031 0.800aA±0.000
C1 0.801aA±0.000 0.802aA±0.000 0.802aA±0.001 0.801aA±0.000
C2 0.804aA±0.001 0.804aAB±0.001 0.803aAB±0.001 0.801aB±0.000
C3 0.804aA±0.001 0.805aA±0.001 0.803aA±0.002 0.827aA±0.026
C4 0.802aA±0.001 0.802aA±0.000 0.803aA±0.001 0.802aA±0.001
Means in the same column, followed by distinct lower-case letters, differ from each other by the Tukey test, at the significance level of 5%. Means on the same line, followed by different capital letters, differ by the Tukey test, at the significance level of 5%. G1 = Pharmacy 1 gel; G2 = Pharmacy 2 gel; G3 = Pharmacy 3 gel; G4 = Pharmacy 4 gel; C1 = Pharmacy 1 cream; C2 = Pharmacy 2 cream; C3 = Pharmacy 3 cream, C4 = Pharmacy 4 cream.
Table 9. Means and standard deviations for gel-based formulations for wavelength (nm).
Samples Day 0 Day 30 Day 60 Day 90
G1 3000.000aA±0.000 2356.667aAB±54.044 2126.667aB±39.725 2287.000aAB±362.683
G2 1996.000bA±279.440 1321.333bAB±26.206 1153.333abB±106.793 622.667bB±205.438
G3 1740.333bA±54.694 1302.333bA±106.631 1541.333abA±615.271 1091.333bA±115.016
G4 1428.333bA±40.863 520.000cB±110.436 453.667bB±82.422 401.667bB±14.530
C1 3000.000aA±0.000 2117.00aB±58.944 2110.667aB±236.673 2004.00aB±82.710
C2 2596.333aA±403.667 2396.00aA±302.637 1809.333aA±35.092 1480.333aA±277.424
C3 2740.000aA±260.000 2064.333aAB±55.107 1349.667aB±248.116 1590.333aB±87.310
C4 833.667bA±89.126 562.000bB±24.007 1466.000aA±768.221 280.667bC±14.814
Means in the same column, followed by distinct lower-case letters, differ from each other by the Tukey test, at the significance level of 5%. Means on the same line, followed by different capital letters, differ by the Tukey test, at the significance level of 5%. G1 = Pharmacy 1 gel; G2 = Pharmacy 2 gel; G3 = Pharmacy 3 gel; G4 = Pharmacy 4 gel; C1 = Pharmacy 1 cream; C2 = Pharmacy 2 cream; C3 = Pharmacy 3 cream and C4 = Pharmacy 4 cream.
Table 7. Rheological parameters obtained from the Herschel-Bulkley mathematical model.
Samples σo (Pa) K (Pa.sn) N R2 Error
C1 (day 0) 1.21 11,191 0.55 98.2 0.003
C1 (day 30) 4.24 8,900 0.66 99.5 0.011
C1 (day 60) 1.82 10,766 0.57 99.8 0.029
C1 (day 90) 2.67 10,670 0.55 99.6 0.002
C2 (day 0) 15.1 24,408 0.62 94.2 0.013
C2 (day 30) 0.01 23,494 0.44 99.2 0.010
C2 (day 60) 2.94 26,725 0.41 99.6 0.021
C2 (day 90) 0.01 26,853 0.34 98.6 0.012
C3 (day 0) 9.72 27,334 0.60 95.6 0.009
C3 (day 30) 9.91 28,760 0.69 99.6 0.010
C3 (day 60) 6.39 37,274 0.58 99.0 0.029
C3 (day 90) 7.52 30,037 0.58 99.5 0.018
C4 (day 0) 16.6 3,291 0.97 98.8 0.012
C4 (day 30) 17.4 2,478 1.19 97.5 0.009
C4 (day 60) 18.7 1,056 1.55 97.2 0.017
C4 (day 90) 20.7 1,194 1.34 96.0 0.004
σo = initial shear stress, K = consistency index, N = flow index and R2 = correlation coefficient.
Brazilian Journal of Biology, 2022, vol. 82, e241043 11/16
Quality of cosmetics with active caffeine
Figure 5. Wavelength analysis for cosmetics in cream and gel base.
4. Conclusion
In view of all the analyzes performed, it was proven that what remained minimally changed were the viscosity and the percentage of the active ingredient caffeine in preparations of galenic bases of gel and cream. The results highlight the reduced stability of the samples, which facilitates the inactivation of the active substances, mechanism of action and effectiveness of the formulations prepared.
For a better compounding, it is important that the compounding pharmacies more effectively require the team’s commitment, as well as the analysis of the raw material according to the microbiological control regulations. In addition, the implementation of stricter standards and better control of the raw material and final formulations mean that the quality of the products prepared by the compounding pharmacies is significantly increased, favoring the consumer in the effective purpose the product aims to achieve.
It is important to highlight the need to analyze the formulations submitted to preparation, to understand the best vehicle for permeation with final formulations with galenic bases that allow the incorporation of nanotechnological active ingredients.
References
ATKINS, P., JONES, L. and WHITMIRE, K., 2011. Princípios de química: questionando a vida moderna e o meio ambiente. 5. ed. Porto Alegre: Bookmann.
BORGES, F.S. and SCORZA, F.A., 2016. Terapêutica em estética: conceitos e técnicas. 1. ed. São Paulo, Phorte.
BRASIL, 2010. Ministério da Saúde. Agência Nacional de Vigilância Sanitária – ANVISA. Farmacopéia brasileira. Brasília: ANVISA.
BRASIL, 2013. Resolução RDC nº 48, de 25 de outubro de 2013. Regulamento técnico de boas práticas de fabricação para produtos de higiene pessoal, cosméticos e perfumes, e dá outras providências. Diário Oficial da República Federativa do Brasil, Brasília, 28 out.
BRASIL, 2015. Resolução RDC nº 7, de 10 de fevereiro de 2015. Requisitos técnicos para a regularização de produtos de higiene pessoal, cosméticos e perfumes e dá outras providências. Diário Oficial da República Federativa do Brasil, Brasília, 11 fev.
FERNANDES, P.C.S., MAIA, H.M.S.F. and BUST, D.C., 2014. Ação lipolítica da cafeisilane c introduzida por iontoforesena região abdominal. Ciência & Saúde Coletiva, vol. 18, pp. 26-32.
FONSECA-SANTOS, B., DEL NERO PACHECO, C., PINTO, M.C. and CHORILLI, M., 2019. Na effective mosquito-repellent tropical product from liquid Crystal-based tea tree oil. Industrial Crops and Products, vol. 128, pp. 488-495. http://dx.doi.org/10.1016/j.indcrop.2018.11.020.

Brazilian Journal of Biology, 2022, vol. 82, e24104312/16
Vogel, E.M. et al.
GANSBILLER, M., SCHMID, J. and SIEBER, V., 2019. In-depth rheological characterization of genetically modified xanthan-variants. Carbohydrate Polymers, vol. 213, pp. 236-246. http://dx.doi.org/10.1016/j.carbpol.2019.02.055. PMid:30879665.
GOMES, R.K., 2013. Cosmetologia: descomplicando os princípios ativos. 4. ed. São Paulo: Médica Paulista.
GOSHIYAMA, A.M., 2019. Avaliação das propriedades das fibras capilares tratadas com alisante ácido com diferentes valores de pH. São Paulo: Universidade de São Paulo. Dissertação de Mestrado em Ciências Farmacêuticas.
KITZBERGER, C.S.G., SCHOLZ, M.B.S., PEREIRA, L.F.P., VIEIRA, L.G.E., SERA, T., SILVA, J.B.G.D. and BENASSI, M.T., 2013. Diterpenes in green and roasted coffee of Coffea arabica cultivars growing in the same edapho-climatic conditions. Journal of Food Composition and Analysis, vol. 30, no. 1, pp. 52-57. http://dx.doi.org/10.1016/j.jfca.2013.01.007.
MOTA, V.A.M., OSHIRO JUNIOR, J.A. and CHIARI-ANDRÉO, B.G., 2017. O controle da contaminação microbiológica de produtos magistrais. Revista Brasileira Multidisciplinar, vol. 20, no. 1, pp. 33-49. http://dx.doi.org/10.25061/2527-2675/ReBraM/2017.v20i1.474.
PEREIRA, M.F.L., 2013. Cosmetologia. 1. ed. São Paulo: Difusão.
REBELLO, T., 2016. Guia de produtos cosméticos. 11. ed. São Paulo: Senac.
RIGON, C., MARCHIORI, M.C.L., JARDIM, F.S., PEGORARO, N.S., CHAVES, P.D.S., VELHO, M.C., BECK, R.C.R., OURIQUE, A.F., SARI, M.H.M., OLIVEIRA, S.M. and CRUZ, L., 2019. Hydrogel containing silibinin nanocapsules presents effective anti-inflammatory action in a model of irritant contact dermatitis in mice. European Journal of Pharmaceutical Sciences, vol. 137, pp. 104969. PMid:31238095.
RUAN, Q., YANG, X., ZENG, L. and QI, J., 2019. Physical and tribological properties of high internal phase emulsions based on citrus
fibers and corn peptides. Food Hydrocolloids, vol. 95, pp. 53-61. http://dx.doi.org/10.1016/j.foodhyd.2019.04.014.
SILVA, M.C. and DELFINO, M.M., 2018. Efeitos de cosméticos a base de cafeína na lipólise: uma revisão de literature. EJCH, vol. 11, no. esp., pp. S1299-S1303. http://dx.doi.org/10.25248/REAS167_2018.
SOUSA, T.S.B., LIMA, A.D.S., SILVA, E.K. and LIMA, E.N., 2019. Análise dos parâmetros físico-químicos e organolépticos de sabonetes líquidos íntimos. Braz J Nat Sci, vol. 2, no. 3, pp. 115-122. http://dx.doi.org/10.31415/bjns.v2i3.62.
TEODORO, L.L.I., TORRES, I.M.S. and BARBOSA, N.P., 2019. Avaliação microbiológica dos produtos de higiene pessoal das indústrias de cosméticos de Goiânia e região metropolitana. RPQ, vol. 13, no. 25, pp. 63-70. http://dx.doi.org/10.19142/rpq.v13i25.481.
TOMIC, I., JURETIC, M., JUG, M., PEPIC, I., CETINA C�IŽMEK, B. and FILIPOVIC-GRC�IC, J., 2019. Preparation of in situ hydrogels loaded with azelaic acid nanocrystals and their dermal application performance study. International Journal of Pharmaceutics, vol. 563, pp. 249-258. http://dx.doi.org/10.1016/j.ijpharm.2019.04.016. PMid:30965120.
VANZIN, S.B., 2015. Entendendo cosmecêuticos: diagnósticos e tratamentos. 2. ed. São Paulo: Santos.
WANG, X., ZHANG, Y., HUANG, J., XIA, M., LIU, L., TIAN, C., HU, R., GUI, S. and CHU, X., 2019. Self-assembled hexagonal liquid crystalline gels as novel ocular formulation with enhanced topical delivery of pilocarpine nitrate. International Journal of Pharmaceutics, vol. 562, pp. 31-41. http://dx.doi.org/10.1016/j.ijpharm.2019.02.033. PMid:30878587.
ZHANG, J., WANG, G., LIANG, Q., CAI, W. and ZHANG, Q., 2019. Rheological and microstructural properties of gelatin B/tara gum hydrogels: effect of protein/polysaccharide ratio, pH and salt addition. LWT - Food Science and Technology, vol. 103, pp. 108-115. http://dx.doi.org/10.1016/j.lwt.2018.12.080.

Brazilian Journal of Biology, 2022, vol. 82, e241043 13/16
Quality of cosmetics with active caffeine
Appendix A - Photographs of the analyzes and cosmetics analyzed
Supplementary material accompanies this paper.This material is available as part of the online article from http://www.scielo.br/bjbAppendix A - Photographs of the analyzes and cosmetics analyzed
Figure A1 - Cosmetics based on F1 gel and cream from time 0 to time 90 days.
Figure A2 - Cosmetics based on gel and cream F2 from time 0 to time 90 days.
Appendix A - Photographs of the analyzes and cosmetics analyzed
Figure A1 - Cosmetics based on F1 gel and cream from time 0 to time 90 days.
Figure A2 - Cosmetics based on gel and cream F2 from time 0 to time 90 days.
Figure A3 - Cosmetics based on gel and cream F3 from time 0 to time 90 days.
Figure A4 - Cosmetics based on gel and cream F4 from time 0 to time 90 days.

Brazilian Journal of Biology, 2022, vol. 82, e24104314/16
Vogel, E.M. et al.
Figure A5 - Granulation of caffeine in gel F1 from time 0 to time 90 days.
Figure A6 - Formation of caffeine alveoli in gel F1 from time 0 to time 90 days.
Figure A3 - Cosmetics based on gel and cream F3 from time 0 to time 90 days.
Figure A4 - Cosmetics based on gel and cream F4 from time 0 to time 90 days.
Figure A5 - Granulation of caffeine in gel F1 from time 0 to time 90 days.
Figure A6 - Formation of caffeine alveoli in gel F1 from time 0 to time 90 days.

Brazilian Journal of Biology, 2022, vol. 82, e241043 15/16
Quality of cosmetics with active caffeine
Figure A7 - Coloring of cosmetics in cream with active ingredient cafeisilane
C from time 0 to time 90 days in the pharmacy F4.
Figure A8 - Coloring of gel cosmetics with active ingredient cafeisilane
C from time 0 to time 90 days in the pharmacy F4.
Figure A7 - Coloring of cosmetics in cream with active ingredient cafeisilane
C from time 0 to time 90 days in the pharmacy F4.
Figure A8 - Coloring of gel cosmetics with active ingredient cafeisilane
C from time 0 to time 90 days in the pharmacy F4.
Figure A9 - Molds and yeasts in the pharmacy F4.
Figure A10 - Mesophiles in the pharmacy F3.

Brazilian Journal of Biology, 2022, vol. 82, e24104316/16
Vogel, E.M. et al.
Figure A9 - Molds and yeasts in the pharmacy F4.
Figure A10 - Mesophiles in the pharmacy F3.