Quality Measures of Universities and the Determinants of...
28
Quality Measures of Universities and the Determinants of Tuition in South Korea Young Hoon Ko April, 2017 Martin School of Public Policy and Administration Graduate Capstone Advisor: J. S. Butler, PhD
Transcript of Quality Measures of Universities and the Determinants of...

Quality Measures of Universities
and the Determinants of Tuition in South Korea
Young Hoon Ko
April, 2017
Martin School of Public Policy and Administration
Graduate Capstone
Advisor: J. S. Butler, PhD
2
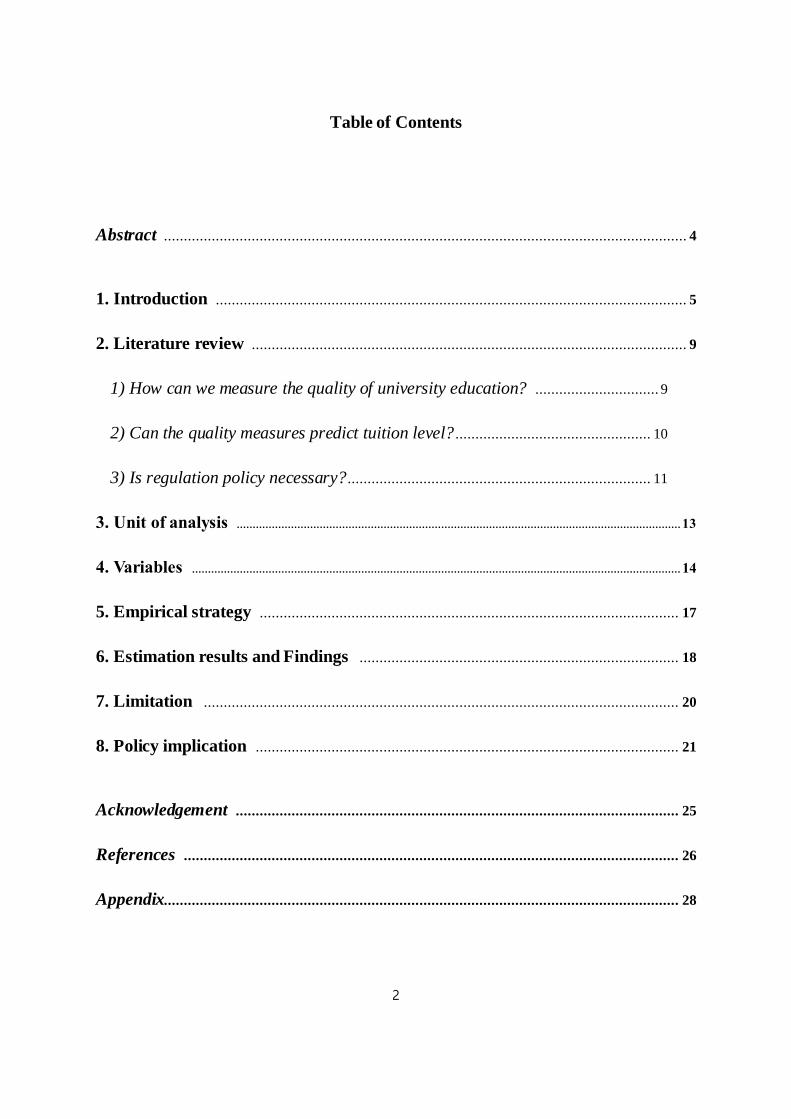
Table of Contents
Abstract ................................................................................................................................... 4
1. Introduction ...................................................................................................................... 5
2. Literature review ............................................................................................................. 9
1) How can we measure the quality of university education? ............................... 9
2) Can the quality measures predict tuition level? ................................................. 10
3) Is regulation policy necessary? ............................................................................ 11
3. Unit of analysis ........................................................................................................................................... 13
4. Variables ......................................................................................................................................................... 14
5. Empirical strategy ......................................................................................................... 17
6. Estimation results and Findings ................................................................................ 18
7. Limitation ....................................................................................................................... 20
8. Policy implication .......................................................................................................... 21
Acknowledgement ............................................................................................................... 25
References ............................................................................................................................ 26
Appendix................................................................................................................................. 28

3
Figures and Tables
Table 1: Rate of advanced school entrance ............................................................. 6
Figure 1.1: Comparison between Tuition increase rate and Inflation rate .................. 7
Figure 1.2: Tuition dependency ratio ..................................................................... 8
Table 2: Comparison between tuition increase rate and college entrance rate........... 12
Table 3: The present condition of four-year universities in Korea ........................... 13
Table 4.1: The first category of independent variables ........................................... 15
Table 4.2: The second category of independent variables....................................... 16
Table 5: Estimating equation............................................................................... 17
Table 6.1: Estimation results of first category, educational inputs ........................... 18
Table 6.2: Estimation results of second category, educational outputs ..................... 19
Table 6.3: Estimation results of the policy of regulating tuition level ...................... 20
Table 7: Equations for verification of reverse causation......................................... 21
Figure 8.1: Government subsidy to private universities ......................................... 23
Figure 8.2: Government funding for higher education compared to GDP ................ 23
Table 8: Operating revenue of private university in 2014 fiscal year ....................... 24
Figure 8.3: Donations to private universities ........................................................ 24

4
Abstract
University tuition had increased in highly excess of the inflation rate from 1990s
until 2008. Many people are wondering whether the quality of university education is
proportional to the tuition level. Thus, this capstone project examines whether the quality
measures in higher education can predict the tuition level.
After analyzing eight-year data of 146 private universities in South Korea, I get the
result that university tuition is not a function of quality measures in terms of educational costs.
However, tuition is a function of quality measures related with attractiveness,
accomplishment, and satisfaction. Incoming student recruitment rate, and drop-out rate have
significant impact on the tuition level at a 99 percent confidence level. Admission
competition and research funding per faculty from internal sources also have statistically
significant impact on the tuition level at a 95 percent confidence level.
Even though the tuition level has increased continuously, the rate of university
entrance in terms of high school graduates also increased. The cost of college education
impacts society broadly, especially under these circumstances. Thus, governmental
intervention may be necessary. Actually, the Korean government has tried to stabilize the
level of tuition since 2011. So this study also examines policy effectiveness and gets the result
that tuition is reduced by the policy as intended.
Considering the result that the quality measures representing educational costs
cannot predict the tuition level, universities should make an effort to relieve tuition burden by
setting rational criteria of tuition level and reflecting all cost factors in this criteria. In the
light of the result that tuition is a function of quality measures related with attractiveness,
accomplishment, and satisfaction, government must be careful when it tries to regulate
university tuition because there might be a possibility that the policy of tuition regulation
would lead to deterioration in education quality.

5
1. Introduction
After the liberation from Japanese colonial rule, Korea was one of the poorest
nations in the world. But it has developed very fast. Korea hosted the Summer Olympic
Games in 1988 and became a member of the Organization for Economic Cooperation and
Development (OECD) in 1995. In terms of the total size of GDP, it ranked eighth out of 34
OECD countries in 2015. (Chosun, 2016)
The energy of Korea’s success was education. Traditionally Korean people have
been putting emphasis on education. Even during the undeveloped ages, although there was
no food at home, there might be some books for children’s education. The people’s passion
for education in Korea has been very famous. And the accomplishment has been recognized
by other countries. The text here was from The Washington Post.
By the numbers, the South Korean system is the envy of the world: The nation
regularly places among the top five countries on international math and reading
tests, the high school dropout rate is less than 4 percent, and the college completion
rate among young adults is among the highest in the world.1
Over 99 percent of middle school graduates go to high school.2 Even though the
university entrance rate has been reduced since 2012, over 70 percent of students among high
school graduates go to higher education institutions which include both 2-year colleges and 4-
year universities. The level of university entrance rate was ranked in first place among OECD
1 Michael Alison Chandler, S. Korea tries to wrest control from booming private tutoring industry
The Washington Post, April 3, 2011
2 Korean education statistics service, http://kess.kedi.re.kr/index

6
countries. (News one, 2014).
Table 1: Rate of advanced school entrance3 (%)
year High school
graduate
Students going
to college
Ratio of high school
graduate to students
going to college
GDP
per capita
1990 761,922 206,790 27.1 % $6,514
2000 764,712 473,803 62.0 % $11,951
2010 633,539 477,384 75.4% $22,147
2011 648,468 469,961 72.5% $24,159
2012 636,724 453,899 71.3% $24,445
2013 631,197 446,474 70.7% $25,993
2014 632,983 448,817 70.9% $27,982
2015 615,462 435,650 70.8% $27,213
However, unfortunately there is an unpleasant side effect which is called academic
elitism. Korean society regards educational background as being very important. There are a
lot of discriminations on the grounds of the level of education, especially related with whether
graduating university or not. Lee et al. (2011) stated that people in South Korea have
experienced discrimination based on their education level. It is more difficult for less
educated people to be hired than educated people. They normally earn less income. In Korean
society, less educated persons also have difficulty in getting married. Thus, Korean people
have considered going to universities as an instrument to get privileges such as getting a good
job and reputation from others. Most parents want their sons and daughters to go to university.
In short, higher education has been considered as a critical mechanism for socioeconomic
advancement in Korean society.
3 I merged data from Korean education statistics service (http://kess.kedi.re.kr/index) and Korean
Statistical Information Service (http://www.kosis.kr)

7
Parents are willing to sacrifice for the cost of higher education of their children.
Although they could face financial hardships, they eagerly pay a lot of money for tuition. As I
mentioned above, because about 70 percent of graduates of high school go to universities, the
burden of university tuition is not the problem related with a certain group but the problem
which the entire nation is interested in.
Many people have hoped that the tuition level was stabilized. But university tuition
had increased in excess of the inflation rate from 1990s until 2008. In the 2000s, the situation
was getting worse. From 2009, the newly inaugurated administration tried to stabilize the
level of tuition. As shown below, it was effective. But the level of university tuition was
ranked in fourth place among OECD countries based on real GDP as of 2011. (OECD, 2013)
Thus, the government established the law to regulate the tuition level in 2011.
Figure 1.1: Comparison between Tuition increase rate and Inflation rate
Song (2013) cast doubt on the appropriateness of universities’ setting their tuition
level. She considered private universities’ poor financial status as the reason for the excessive
increase in tuition. Actually, according to statistics of higher education in Korea, the financial

8
resources of private universities have come mainly from tuition which students gave. The
portion which the tuition occupies in the total financial resources of private universities has
continuously declined but the below graph shows that tuition dependency ratio compared to
total revenue is still very big.
Figure 1.2: Tuition dependency ratio4 (%)
When we think about buying something, price plays an important role in our
decision. Markman (2011) stated that we might use price information to judge the
quality. Actually, we commonly assume that the price is proportionate to the quality. If tuition
of the university can be considered as the price for the education that universities provide, it
seems reasonable to think that a university with higher quality education may set higher
tuition level. But many people in South Korea are wondering whether the tuition level is
proportional to their educational quality. Therefore, this capstone project examines whether
the quality measures in higher education can predict the tuition level. And as I mentioned
4 I modified the statistics released by KHEI (Korea Higher Education Research Institution, http://khei-
khei.tistory.com)

9
above, the Korean government established the law to stabilize the level of tuition since 2011.
So this study also examines whether tuition is reduced by the policy as intended.
2. Literature review
1) How can we measure the quality of university education?
Bennett (2012) answered this question by saying that “value added” is the
appropriate approach, which means measuring value added by comparing students’
intellectual status as they begin university to that of the same students as they graduate
university. It might be ideal to measure by using the criteria of what is improved about the
capabilities or knowledge through their education at a certain university. But it seems to be
difficult to apply that in practice. Archibald and Feldman (2010) stated that it is not possible
to measure the educational quality in this regard, such as the amount of knowledge
transmitted, the usefulness of that knowledge, or the extent to which students' problem-
solving skills and love of learning are improving over time. Bennett (2012) also
acknowledged that there was no reliable measures about these.
If so, what is the second-best way to measure university quality? Moon (2012)
stated that assessing the measures which represent the condition of education and outputs of
education, such as student faculty ratio, graduate employment rate, and performance of
research can be an alternative, even though there is no clear consensus about what university
quality is. Kim (2016) classified the quality measures into three categories. The first category
is concerned with the inputs which represent the investment for improving the learning
environment. Second is about the process of teaching and learning. Some examples
introduced by Kim (2016) are as follows: quality of curriculum and class, support system for
student academic performance, the degree of participation in class, degree of student

10
satisfaction about education. Third is about educational outcomes which are related with the
students’ learning and performance itself.
From the viewpoint of educational costs, if universities spend money on hiring
faculty members, giving more scholarships to their students, and expanding educational
facilities, it is natural to assume that the educational quality measured may be enhanced. Thus,
educational costs can be used as the proxy of educational quality in regard of educational
input.
Some outcome measures such as retention rate, employment rate of graduates,
publications of full time faculty, and the institution’s reputation can also be used as variables
which represents the quality of education (Kim, 2016). Bennett (2001) said retention rate
shows what percentage of university’s students were satisfied enough to continue at a college
and capable of continuing. If students are satisfied with the quality of education, they do not
drop out from the university. Thus, retention rate can represent educational output.
2) Can the quality measures predict tuition level?
Mizutani, Nakayama, & Tanaka suggested that educational quality of a university
affects the tuition level of private universities in Japan. But this result might have some
limitations, because the variable which represents the educational quality was only SDC
(Standard Deviation Score) of the National Center Test of University Admission.5 Seneca &
Taussing (1987) showed the opposite result. This result has also same limitation, because they
also used SAT scores as the only variable to represent the educational quality of university.
Koshal and Koshal (1998) found that the quantity of students, cost of education,
average SAT score, class size, level of highest degree offered, and tier of institutions can
5 It may be more difficult to enter the university with higher average SDC of new students.

11
explain the variations in tuition at comprehensive universities. Cost of education and class
size, tier of institution can be quality factors of university education in regard to inputs. The
tier of the institution can be a quality factor in regard to outputs. Lee, et al. (2011) explained
that universities normally set their tuition based on inflation rates, faculty costs, basic
operating expenses, and equipment costs for maintaining facilities, such as classrooms,
libraries and research labs. On the contrary, Song & Yun (2011) showed that learning
environments expenditures such as students per professor, research funds, and student welfare
costs have no statistically significant effect on tuition.
3) High tuition cannot reduce demand. Is regulation policy necessary?
Tuition is the price of university education. Price is the key mechanism to control
supply and demand. In terms of demand, price especially changes quantity demanded through
the substitution effect and the income effect. The increased tuition reduces the real income of
students who have the intention to enter university. This is the income effect that may cause
them to give up entering university. This should be prevented by the government or university
giving scholarships or loans. This can be a justification for tuition regulation policy.
Of greatest interest here is the fact that changes in price also bring the substitution
effect. If tuition plays the role of a mechanism controlling demand, increased tuition may
reduce university enrollment. Sillers (2016) said some students who have the intention to
enter university respond by going to a vocational training institute instead of entering
university. They may think that university education has become more expensive compared to
potential substitutes, such as a vocational training institute. This means that the substitution
effect may make students think reasonably when they decide whether to enter university or
not. They may compare the cost and benefit of each case – entering university or going to a
vocational training center. If the increase in tuition can deter unnecessary enrollment in

12
university, tuition increase can be justified by controlling demand to so me degree, as
mentioned above. In the case of increases in tuition in Korea, however, there is very little
substitution effect. Korea seems to have very low price elasticity where higher education is
concerned. It is obvious that a tuition increase would not deter university enrollment in South
Korea. The table below shows that even though the tuition level has increased continuously
from 2000 to 2008, the rate of university entrance in terms of high school graduates also
increased.
Table 2: Comparison between tuition increase rate and college entrance rate
year 2000 2001 2002 2003 2004 2005 2006 2007 2008
tuition increase
rate (%) 6.2 5.9 6.9 6.7 5.9 5.1 6.7 6.5 6.7
college entrance
rate (%) 62.0 70.5 74.2 79.7 81.3 82.1 82.1 82.8 83.8
Universities seem to increase their tuition without concern about declining
enrollment. Thus, we notice that the price elasticity in higher education of Korea is obviously
very low. Korean people want to have the opportunity for higher education regardless of how
much they have to pay for it. Lee, et al. (2011) told a story to explain this:
Traditionally tuition has not been affordable in Korea. In the past, universities
were referred to as ‘wu-gol-tap’, a tower made up of cattle bones alluding that
tuition was so expensive that the biggest property of a household, a cow, had to be
sold in order to afford it.
In Korea, like other countries in the world, university education is not compulsory.
Individuals can choose to enter university if they want to maximize their utility, which
suggests that university tuition is not a matter of public policy or government concern. But
the price of higher education, tuition, cannot be the mechanism for controlling demand of

13
higher education, which is a kind of market failure. It is obvious that people in South Korea
feel that university tuition is burdensome because most people are not likely to change their
intention to enter university based on the tuition level. Song & Yun (2011) said that the cost of
college education impacts society broadly, especially under these circumstances. Lee et al.
(2011) introduced this situation as below. In order to solve this problematic situation,
governmental intervention may be necessary.
Recently, the media has reported numerous unfortunate stories of students quitting
or taking time off from school due to the burden of tuition. The current situation is
making a four-year graduation almost an exceptional case
3. Unit of analysis
There are 189 four-year universities. Among them, private universities are
predominant. About 81.5 percent of universities are private. Different from the United States,
public universities were established as a national university and there is just one municipal
university which was established by the Seoul metropolitan government.
Table3: The present condition of four-year university in South Korea
Category National Municipality Private Total
Number 34 1 154 189
Ratio 17.99% 0.53% 81.48% 100%
Koshal et al. (1994) suggested that focusing on a homogeneous group made it
possible to gain better insight into the determinants of tuition. In Korea, national and
municipal universities have been subsidized by government more than private universities
and their tuition level is much cheaper than private universities.6 In addition, governmental
6 In 2016, the average tuition of private university was 7,370 dollars and the average tuition
of public and national university was 4,210 dollars.

14
authority has controlled their educational condition such as the number of students per faculty
based on laws and many regulations.7 Because they differ in many ways, it is difficult to
analyze private universities and public universities in the same sense, Thus, I limit my
analysis to private universities. I collected eight consecutive year (2009-2016) data of four-
year private universities in South Korea. Thus, the unit of my analysis is each private
university in South Korea.
4. Variables
The dependent variable of my analysis is tuition of each university. Korean
universities usually have two semesters a year, the tuition of each university in this model
indicates the summation of tuitions for two semesters of each year. The monetary unit of my
analysis hereafter is 1,000 Korean Won (KRW). The exchange rate between KRW and U.S.
dollar is about 1,000 KRW per dollar.8
Independent variables are representatives of quality factors of university education. I
referred to the classification of Kim (2016). She categorized the quality factors into three
categories: input, process and output. The first category is concerned with the input which
represents the investment for improving learning environment. The second is about the
process of teaching and learning. Some examples in terms of process are as follows: qual ity
of curriculum and class, the degree of participation in class, degree of student satisfaction
about education. The third is about educational outputs which are related with the students’
learning and performance.
7 Lee et al. (2011) indicated that the government-subsidized portion of a national university’s
accounting system is appropriated and executed partly from government budgets. Therefore, national
universities are strictly controlled by the National Finance Act and the National Accounting Act.
8 This is based on the average exchange rate over a span of 8 years (2009~2016), which is a rough
value for the convenience sake.

15
I modified Kim (2016)’s division of category because the concept of the input,
process and output was a little bit vague and measuring the process which means how student
capabilities and knowledge improved through higher education was not available in this study.
Thus, I have two categories. First is measures related with financial investment, and second is
measures related with educational accomplishment, attractiveness, and satisfaction. The first
category is concerned with university’s effort to improve learning environment. The second
category includes the indicators reflecting external evaluations. Each measure has been used
as the indicators of education quality in previous researches (Kim, 2016; Song & Yun, 2011)
In terms of the first category, financial investment, I will use three variables like
these: scholarship per student, student faculty ratio, research funding from internal sources
per full time faculty. These may represent the cost of university education. In order to
increase the amount of scholarship per student and research funding per faculty from internal
financial resources and decrease the ratio of student per faculty, universities should invest
financially. University should spend more money on giving scholarship to students, giving
research funding to faculties using internal financial resources and recruiting faculties.
Table 4.1: The first category of independent variables: financial investment
Variables Formula
Scholarship
per student
𝑡𝑜𝑡𝑎𝑙 𝑎𝑚𝑜𝑢𝑛𝑡 𝑜𝑓 𝑠𝑐ℎ𝑜𝑙𝑎𝑟𝑠ℎ𝑖𝑝
𝑡ℎ𝑒 𝑛𝑢𝑚𝑒𝑏𝑟 𝑜𝑓 𝑡𝑜𝑡𝑎𝑙 𝑒𝑛𝑟𝑜𝑙𝑙𝑒𝑑 𝑠𝑡𝑢𝑑𝑒𝑛𝑡
Student faculty ratio 𝑡𝑜𝑡𝑎𝑙 𝑒𝑛𝑟𝑜𝑙𝑙𝑒𝑑 𝑠𝑡𝑢𝑑𝑒𝑛𝑡𝑠
𝑡ℎ𝑒 𝑛𝑢𝑚𝑏𝑒𝑟 𝑜𝑓 𝑓𝑢𝑙𝑙 𝑡𝑖𝑚𝑒 𝑓𝑎𝑐𝑢𝑙𝑡𝑦
Research funding per full
time faculty from internal
sources
𝑡𝑜𝑡𝑎𝑙 𝑎𝑚𝑜𝑢𝑛𝑡 𝑜𝑓 𝑟𝑒𝑠𝑒𝑎𝑟𝑐ℎ 𝑓𝑢𝑛𝑑𝑖𝑛𝑔 𝑓𝑟𝑜𝑚 𝑖𝑛𝑡𝑒𝑟𝑛𝑎𝑙 𝑠𝑜𝑢𝑟𝑐𝑒𝑠
𝑡ℎ𝑒 𝑛𝑢𝑚𝑏𝑒𝑟 𝑜𝑓 𝑓𝑢𝑙𝑙 𝑡𝑖𝑚𝑒 𝑓𝑎𝑐𝑢𝑙𝑡𝑦

16
With regards to the second category, educational accomplishment, attractiveness,
and satisfaction, I will use five variables: incoming student recruitment rate, admission
competition ratio, publication in SCI level journal per full time faculty, publication in NRF 9
registered journal, research funding from external sources per full time faculty, and drop-out
rate.
Table 4.2: The second category of independent variables:
attractiveness, accomplishment, and satisfaction
Variables Formula
Incoming student
recruitment rate
𝑡ℎ𝑒 𝑛𝑢𝑚𝑏𝑒𝑟 𝑜𝑓 𝑠𝑡𝑢𝑑𝑒𝑛𝑡𝑠 𝑤ℎ𝑜 𝑒𝑛𝑟𝑜𝑙𝑙𝑒𝑑 𝑎𝑠 𝑓𝑟𝑒𝑠ℎ𝑚𝑒𝑛
𝐼𝑛𝑐𝑜𝑚𝑖𝑛𝑔 𝑠𝑡𝑢𝑑𝑒𝑛𝑡 𝑞𝑢𝑜𝑡𝑎×100
Admission competition 𝑡ℎ𝑒 𝑛𝑢𝑚𝑏𝑒𝑟 𝑜𝑓 𝑎𝑝𝑝𝑙𝑖𝑐𝑎𝑡𝑖𝑜𝑛
𝑠𝑡𝑢𝑑𝑒𝑛𝑡 𝑞𝑢𝑜𝑡𝑎10
Publication
in SCI level Journal
per faculty
𝑡ℎ𝑒 𝑛𝑢𝑚𝑏𝑒𝑟 𝑜𝑓 𝑝𝑢𝑏𝑙𝑖𝑐𝑎𝑡𝑖𝑜𝑛 𝑖𝑛 𝑆𝐶𝐼 𝑜𝑟 𝑆𝐶𝑂𝑃𝑈𝑆 𝑗𝑜𝑢𝑟𝑛𝑎𝑙
𝑡ℎ𝑒 𝑛𝑢𝑚𝑏𝑒𝑟 𝑜𝑓 𝑓𝑎𝑐𝑢𝑙𝑡𝑦
Publication
in NRF registered
Journal per faculty
𝑡ℎ𝑒 𝑛𝑢𝑚𝑏𝑒𝑟 𝑜𝑓 𝑝𝑢𝑏𝑙𝑖𝑐𝑎𝑡𝑖𝑜𝑛 𝑖𝑛 𝑁𝑅𝐹 𝑟𝑒𝑔𝑖𝑠𝑡𝑒𝑟𝑒𝑑 𝑗𝑜𝑢𝑟𝑛𝑎𝑙
𝑡ℎ𝑒 𝑛𝑢𝑚𝑏𝑒𝑟 𝑜𝑓 𝑓𝑎𝑐𝑢𝑙𝑡𝑦
Research funding
per full time faculty
from external sources
𝑡ℎ𝑒 𝑎𝑚𝑜𝑢𝑛𝑡 𝑜𝑓 𝑓𝑢𝑛𝑑𝑖𝑛𝑔 𝑓𝑜𝑟 𝑟𝑒𝑠𝑒𝑎𝑟𝑐ℎ
𝑡ℎ𝑒 𝑛𝑢𝑚𝑏𝑒𝑟 𝑜𝑓 𝑓𝑢𝑙𝑙 𝑡𝑖𝑚𝑒 𝑓𝑎𝑐𝑢𝑙𝑡𝑦
Drop-out rate 𝑡ℎ𝑒 𝑛𝑢𝑚𝑏𝑒𝑟 𝑜𝑓 𝑠𝑡𝑢𝑑𝑒𝑛𝑡𝑠 𝑤ℎ𝑜 𝑑𝑟𝑜𝑝𝑝𝑒𝑑 𝑜𝑢𝑡
𝑡ℎ𝑒 𝑛𝑢𝑚𝑏𝑒𝑟 𝑜𝑓 𝑟𝑒𝑔𝑖𝑠𝑡𝑒𝑟𝑒𝑑 𝑠𝑡𝑢𝑑𝑒𝑛𝑡𝑠×100
9 The NRF (National Research Foundation) was founded on June 26, 2009, as a specialized research
funding agency through a merger of the Korea Science and Engineering Foundation (KOSEF), the
Korea Research Foundation (KRF), and the Korea Foundation for International Cooperation of
Science and Technology (KICOS). The aim of the NRF is to optimize and advance the national basic
research funding system that encompasses all academic research fields, http://nrf.re.kr
10 In Korea, each college has the fixed number of student quota, which is approved by the government.

17
Incoming student recruitment rate and admission competition ratio can be
considered as the indicators representing attractiveness. Unlike research funding from internal
sources, that from external sources has a tendency to depend on their academic
accomplishments. Thus, research funding from external sources can be a variable to represent
the educational accomplishment. Bennett (2001) said drop-out rate shows what percentage of
students were not satisfied enough to continue at a college. Thus, this variable represents the
educational satisfaction.
5. Estimation equation and Empirical strategy
I will use fixed effects panel regression because I think something that characterizes
the individual unit but does not change over time may impact or bias the explanatory
variables. Those might be a vision, culture, and location of each university. I need to control
for these. By using fixed effects panel regression, I can control for the average differences
across universities in any observable or unobservable predictors across the universities. The
estimation equation of interest is as below.
Table 5: Estimating equation
𝑇𝑢𝑖𝑖𝑡 = 𝛼𝑖+ 𝛽1𝑆𝑃𝑆𝑖𝑡 + 𝛽2𝑆𝐹𝑅𝑖𝑡 + 𝛽3𝑅𝐹𝐼𝑖𝑡 + 𝛽4𝐷𝑂𝑖𝑡 + 𝛽5𝐼𝑅𝑅𝑖𝑡 + 𝛽6𝐴𝐶𝑖𝑡 + 𝛽7𝑆𝐶𝐼𝑖𝑡 +
𝛽8𝑁𝑅𝐹𝑖𝑡 + 𝛽9𝑅𝐹𝐸𝑖𝑡 + 𝛽10𝑃𝑂𝐿𝑖𝑡 + 𝜀𝑖𝑡 (i= entity, t = time)
Explanation about abbreviation
𝑇𝑢𝑖𝑖𝑡 : Tuition level 𝑆𝑃𝑆𝑖𝑡: Scholarship per one student
𝑆𝐹𝑅𝑖𝑡 : Student faculty ratio 𝑅𝐹𝐼𝑖𝑡: Research funding per full faculty from internal sources
𝐷𝑂𝑖𝑡 : Drop-out rate 𝐼𝑅𝑅𝑖𝑡 : Incoming student recruitment rate
𝐴𝐶𝑖𝑡: admission competition 𝑆𝐶𝐼𝑖𝑡: Publication in SCI level Journal per faculty
𝑁𝑅𝐹𝑖𝑡 : Publication in NRF registered Journal per faculty
𝑅𝐹𝐸𝑖𝑡 : Research funding per full faculty from external sources
𝑃𝑂𝐿 𝑖𝑡: Policy of regulating tuition level
𝛼𝑖 : unknown intercept for each entity 𝜀𝑖𝑡: error term 𝛽𝑘: 𝑡ℎ𝑒 𝑐𝑜𝑒𝑓𝑓𝑖𝑐𝑖𝑒𝑛𝑡 𝑓𝑜𝑡 𝐼𝑉𝑠

18
Blumenstock (2016) stated that the fixed effect coefficients absorb all the across-
group action, what is left over is the within-group action. The fixed effect model allows for
heterogeneity among panel by allowing each university to have its own intercept value. In
short, the fixed-effects model controls for unmeasured time-invariant differences between the
individuals, so the omitted time-invariant characteristics cannot bias the estimated
coefficients of the fixed-effects model. Through this mechanism, the threat of omitted
variable bias is greatly reduced.
6. Estimation results and Findings
The tables below show the estimation results for the determinants of tuition level.
Table 6.1 is the estimation result summarizing whether tuition is a function of quality
measures with regards to financial investment. Table 6.2 is the estimation results showing
whether tuition is a function of quality measures in term of attractiveness, accomplishment,
and satisfaction. Even though I estimated one equation with all variables, I used three tables
in order to facilitate understanding of my division of independent variables.
Table 6.1: Estimation results of first category, financial investment
VARIABLES Tuition P-value|
SPS -0.030 0.107
Amount of scholarship per student (0.187)
SFR -0.126 0.901
Student faculty ratio (1.018)
RFI -0.003 0.673
Research funding per faculty from internal sources (0.007)
Standard errors in parentheses *** p<0.01, ** p<0.05, * p<0.1
19
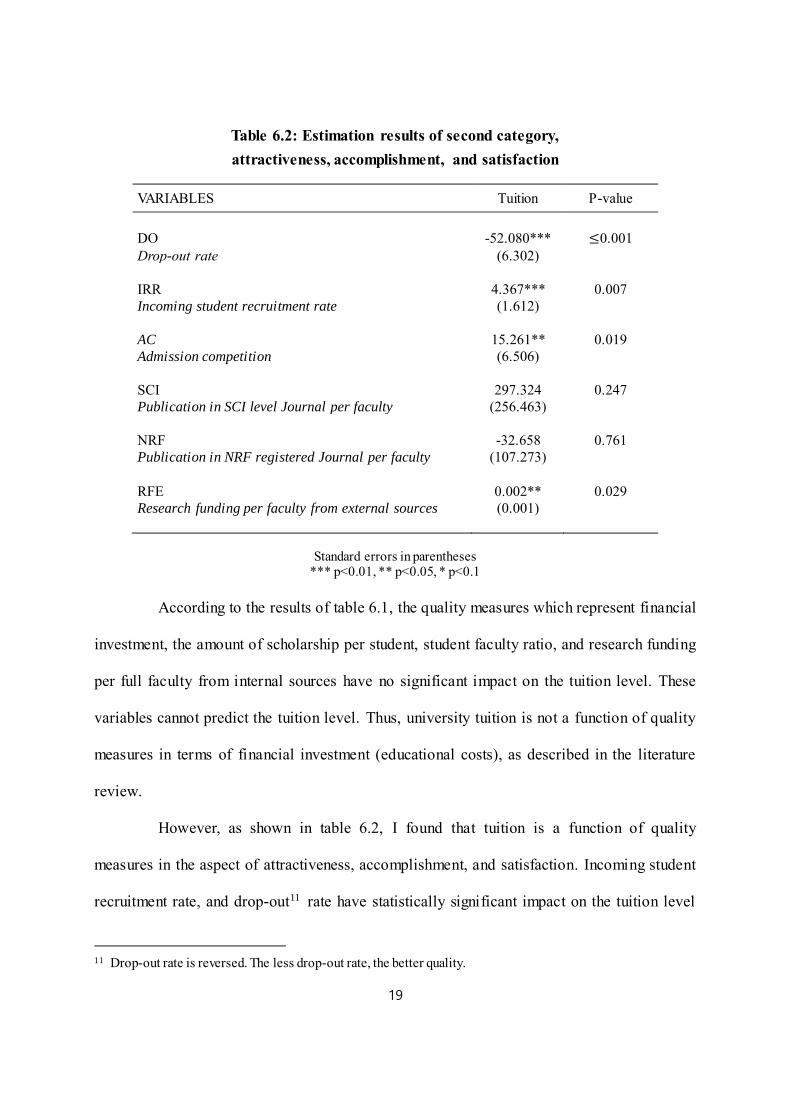
Table 6.2: Estimation results of second category,
attractiveness, accomplishment, and satisfaction
VARIABLES Tuition P-value
DO -52.080*** ≤0.001
Drop-out rate (6.302)
IRR 4.367*** 0.007
Incoming student recruitment rate (1.612)
AC 15.261** 0.019
Admission competition (6.506)
SCI 297.324 0.247
Publication in SCI level Journal per faculty (256.463)
NRF -32.658 0.761
Publication in NRF registered Journal per faculty (107.273)
RFE 0.002** 0.029
Research funding per faculty from external sources (0.001)
Standard errors in parentheses *** p<0.01, ** p<0.05, * p<0.1
According to the results of table 6.1, the quality measures which represent financial
investment, the amount of scholarship per student, student faculty ratio, and research funding
per full faculty from internal sources have no significant impact on the tuition level. These
variables cannot predict the tuition level. Thus, university tuition is not a function of quality
measures in terms of financial investment (educational costs), as described in the literature
review.
However, as shown in table 6.2, I found that tuition is a function of quality
measures in the aspect of attractiveness, accomplishment, and satisfaction. Incoming student
recruitment rate, and drop-out11 rate have statistically significant impact on the tuition level
11 Drop-out rate is reversed. The less drop-out rate, the better quality.

20
at a 99 percent confidence level. Admission competition ratio and research funding per full
faculty from external sources also have statistically significant impact on the tuition level at a
95 percent confidence level.
Tuition is reduced by the policy as intended. Around 2011, the complaints about the
burden of university tuition reached its peak and government considered this problem very
serious. Since then, the Ministry of Education of Korean government has tried to stabilize
university tuitions. The representative policy which was introduced to regulate the tuition
level in 2011 is so called CTI (Cap of Tuition Increase). This policy requires universities in
Korea not to increase their tuition in excess of one and half times of the inflation rate of
consumer price. According to the result of this study, most of universities seem to observe this
policy since then.
Table 6.3: Estimation results about policy of regulating tuition level
VARIABLES Tuition P-value
POL -180.903*** ≤0.001
Policy of regulating tuition level
(37.038)
Standard errors in parentheses
*** p<0.01, ** p<0.05, * p<0.1
7. Limitation
First of all, I would like to mention about the measurement of the educational
quality. I think it is very essential to measure the achievement after the students took the
educational services from the universities and to measure the quality of the process on which
the students take the educational services from the universities, in order to identify the
educational quality of a certain university. My research, however, does not include these

21
measurements of students’ development and the quality of learning process due to the
difficulty of collecting data.
Second, the question can be raised whether education quality is possibly caused by
tuition level. Thus, in order to test this question, I selected most direct measure of quality
which is admission competition (selectivity). The following two equations ask whether last
year’s tuition predicts this year’s selectivity controlling for the relationship between the two,
and whether last year’s selectivity predicts this year’s tuition, controlling for the relationship
between the two.
Table 7: Equations for verification of reverse causation
(𝐄𝐪𝐮𝐚𝐭𝐢𝐨𝐧 𝟏) 𝑆𝑒𝑙𝑒𝑐𝑡𝑖𝑣𝑖𝑡𝑦𝑖𝑡 = 𝛽1𝑆𝑒𝑙𝑒𝑐𝑡𝑖𝑣𝑖𝑡𝑦𝑖,𝑡−1 + 𝛽2𝑇𝑢𝑖𝑡𝑖𝑜𝑛𝑖,𝑡−1 + 𝛽3𝑇𝑢𝑖𝑡𝑖𝑜𝑛𝑖𝑡 + 𝜖𝑖𝑡
(𝐄𝐪𝐮𝐚𝐭𝐢𝐨𝐧 𝟐) 𝑇𝑢𝑖𝑡𝑖𝑜𝑛𝑖𝑡 = 𝛽1𝑇𝑢𝑖𝑡𝑖𝑜𝑛𝑖,𝑡−1 + 𝛽2𝑆𝑒𝑙𝑒𝑐𝑡𝑖𝑣𝑖𝑡𝑦𝑖𝑡 + 𝛽3𝑆𝑒𝑙𝑒𝑐𝑡𝑖𝑣𝑖𝑡𝑦𝑖 ,𝑡−1 + 𝜖𝑖𝑡
(i: entity, t: time, εit : error term)
I did not find any statistically significant effect of last year’s tuition on selectivity. I
also did not find any statistically significant effect of last year’s selectivity on this year’s
tuition. However, if I analyze more extended data than those of my capstone project, tuition
may affect some of my independent variables. Further studies need to address the possibility
that causation runs in the opposite direction.
8. Policy implication
When I began this capstone project, I was doubtful whether there is a proper
relationship between the level of university tuition and the quality of education. Especially,
when I asked someone whether universities invest properly on education with financial
resources gained form tuition, they are not sure about it or answered negatively. This study

22
also shows that university tuition is not a function of quality measures in terms of financial
investment, which is related with educational cost.
Many education experts insisted that universities should set their tuition based on
their educational quality especially in terms of cost base. Song & Yun (2011) insisted that
tuition level should be determined by cost analysis. Similarly, Lee, et al. (2011) suggested that
tuition level should be determined by the issues of whether all cost factors are accurately
reflected and whether the tuition is used as originally intended at the time of calculation. As a
government officer who works for Ministry of Education, I agree with this opinion. If there is
no functional relationship between quality measured in terms of educational cost and tuition
level, government could find the justification to regulate universities’ increasing tuition.
Considering the situation where most of Korean people have suffered from the
burden of university tuition, university should make an effort to relieve this burden by setting
rational criteria of tuition level. The criteria should reflect all cost factors as well as they can.
By doing so, they can convince customers (students and families) of their tuition setting.
On the other hand, this study shows that tuition is a function of quality measures in
terms of attractiveness, accomplishment, and satisfaction. This means there might be a
possibility that the policy of tuition regulation would lead to deterioration in education quality.
What is more, government policy is very powerful. This study shows that tuition is reduced
by the policy as intended. Thus, government must be careful when it tries to regulate
university tuition. For the purpose of tuition relief, it seems to be more desirable to use other
tools. Lee et al. (2011) said Korean government is putting various kinds of effort to stabilize
the university tuition. The government has been continuing to extend national scholarship
according to the needs and conditions of students. It also has been trying to improve the

23
student loan system. And the government has tried to invest more on higher education. The
government subsidies to private universities keeps increasing in South Korea. This policy
direction seems to be proper. But the government funding for higher education is still lower
than the average of OECD countries. Thus, Korean government should keep expanding
investment on higher education.
Figure 8.1: Government subsidy (unit: 100,000 dollars)
Figure 8.2: Government funding for higher education compared to GDP (%)
Source: Korean education statistics service, http://khei-khei.tistory.com/600, accessed April 6

24
Lastly, I want to comment one more thing related with universities’ effort to reduce
tuition burden. As shown in the table below, the tuition dependence rate of private
universities in South Korea is over 60 percent. Donations for private universities have even
decreased.
Table 8: Operating revenue of Private university in 2014 fiscal year (unit: 1,000 dollars)
Category Tuition Government
subsidy
Donation Transferred
money
others total
Amount 10,390,484 2,292,895 397,550 1,548,516 1,721,429 14,217,839
Ratio 63.5% 14.0% 2.4% 9.5% 10.5% 100%
Figure 8.3: Donation (unit: 100,000 dollars)
Along with the efforts of making standards for reasonable tuition level, universities
should try to diversify their sources of revenue. If they can get more government subsidies,
donations, and research funding from outside, it becomes easier for them to set a reasonable,
lower tuition level.

25
Acknowledgement
I would like to give special thanks to Dr. J. S. Butler, who worked on this capstone
project with me. I also would like to thank Dr. Edward Jennings and Dr. Jeremy Hall. They
provide excellent lectures which make me know how to do my capstone project.

26
References
Art Markman (2011) Price, Quality, and Value: How do shoppers use price to judge quality
and value, https://www.psychologytoday.com/blog/ulterior-motives/201111/price-
quality-and-value, Accessed Feb 5, 2017
Bo-eun Moon (2012) Analysis of the relative efficiency between the quality of university and
the tuition of university, Sookmyung Women’s University, 2012
Chosun biz, Twenty years since Korea’s joining of the OECD, December 12, 2016, Accessed
March 13, 2017,
http://biz.chosun.com/site/data/html_dir/2016/12/12/2016121200024.html
Douglas C. Bennett (2001) Accessing Quality in Higher Education, Liberal Education Vol 87;
Association of American College & Universities
Don Sillers (2016) How do changes in price affect quantity demanded?
(https://www.quora.com/How-do-changes-in-price-affect-the-quantity-demanded)
Eojin Kim (2016) Analysis on the relationship between the quality factors of university and
the tuition of university, Graduate school of education, Korea university
Fuitoshi Mizutani, Noriyoshi Nakayama, Tomoyasu Tanaka (2015) “Determinants of
University Tuition in Japan”, Graduate School of Business Administration, Kobe
university (Rokko Kobe Japan)
Higher Education in Korea, http://heik.academyinfo.go.kr
Joseph J. Seneca & Michael K. Taussing. Educational Quality (1987) Access, and Tuition
Policy at State University, The Journal of higher Education Vol 58, pp. 25-37
Ju-ho Lee, et al. Positive Change (2011) Ministry of Education, Science and Technology of
South Korea, pp. 438-469
Kichang Song, Hongju Yun (2011) A study on analyzing the determinants of university tuition
and establishing policy directions, The journal of education administration Vol. 29. No.
4, pp 487-512
Koshal, R. K. and Koshal, M., Boyd, R. and Levine (1994) Tuition at Ph. D gathering

27
institutions: A supply and demand model, Education Economics, pp. 29-44
Korean Educational Statistics System, http://kess.kedi.re.kr/index
Korean Statistical Information Service, http:kosis.kr
Korea Higher Education Research Institute Statistics, http://khei-khei.tistory.com
Michael Alison Chandler, S. Korea tries to wrest control from booming private tutoring
industry, The Washington Post, April 3, 2011,
https://www.washingtonpost.com/people/michael-alison-chandler, Accessed Feb 10,
2017
News one, Korea’s university entrance rate is ranked first place among OECD countries,
September 9, 2014, http://www.news1.kr/articles/?1850003, Accessed Feb 10, 2017
Noah Berger and Peter Fisher (2013) A well-educated workforce is key to state prosperity,
Economic Analysis and Research Network
OEDC indicators, Education at a glance 2013, p232
Rajindar K. Koshal and Manjulika Koshal (1998) Determinants of tuition at comprehensive
universities, Applied Economics
Robert B. Archibald and David H. Feldman (2011) Why does college cost so much? Oxford
university press Inc
Seung-Hee Song (2013), Study on the auditing of private universities by the Korean board of
auditing and inspection: focusing on the 2011 inspection of fiscal transparency of
universities, Korea University, PP. 74-75
Joshua blumenstock, fixed effect model, 2016,
http://www.jblumenstock.com/files/courses/econ174/FEModels.pdf, Accessed Feb 5,
2017

28
Appendix
Descriptive Statistics
Category Mean Standard
Deviation Min Max
Tuition
(dollars) 7088.37 1031.35 1,680 10090
Scholarship per student
(dollars) 2216.80 1201.29 0 8829
Student Faculty ratio
(%) 34.46 14.09 1.4 100
Research funding per
faculty from internal
resources (dollars)
3046.41 4217.79 0 60720.9
Drop-out rate
(%) 5.40 3.16 0 33.9
Admission
competition12 7.60 5.47 0 35.2
Incoming student
recruitment rate 94.85 14.97 0 117
Publication in SCI level
Journal per faculty 0.133 0.201 0 1.5
Publication in NRF
registered Journal per
faculty 0.479 0.234 0 1.1
Research funding per full
faculty from external
sources (dollars) 29043.02 56181.19 0 735938.7
12 𝑡ℎ𝑒 𝑛𝑢𝑚𝑏𝑒 𝑜𝑓 𝑎𝑝𝑝𝑙𝑖𝑐𝑎𝑡𝑖𝑜𝑛
𝑠𝑡𝑢𝑑𝑒𝑛𝑡 𝑞𝑢𝑎𝑡𝑎