Quality Management of the Passenger Terminal Services on...
25
3 Quality Management of the Passenger Terminal Services on the Base of Information System Vaira Gromule and Irina Yatskiv JSC „Riga International Coach Terminal”, Transport and Telecommunication Institute, Latvia 1. Introduction Integration of Latvia in the Common European Market and its joining the EU has highlighted new demands to passengers’ transportation – high mobility, inter-modality, comfort observing of passengers’ rights as well as new requirements to the interaction of transport and environment. It is impossible to exercise complete account of all these requirements without a systematic approach and applying the modern instruments to the formation and management of the passengers’ services market. Bus and coach transport today is in hard and constant competition with the other modes of public transport. It is necessary to enlarge the network of transportations by increasing the accessibility of services in order to manage passengers’ transportation by coaches more attractive for passengers than it is done today as well as to increase the number of passengers. In this situation the role of terminal is vital. Following the best examples of passengers’ transportation by air, it would be useful for the terminals to unite in cooperation with transportation companies, and to build a common network of ticketing and information to the passengers of several European states. At the end it will bring to the so- called “virtual” terminal on the basis of using the up-to-date information technologies and general technical standard, thus making a unified Information System for passengers. CARRIERS PASSENGERS TRAINS AIRPLANES FERRIES PUBLIC TRANSPORT COACH TERMINAL INFORMATION NETWORK (VIRTUAL COACH TERMINAL ) INFORMATION SYSTEM Fig. 1. General scheme of a “virtual” terminal www.intechopen.com
Transcript of Quality Management of the Passenger Terminal Services on...

3
Quality Management of the Passenger Terminal Services on the Base of Information System
Vaira Gromule and Irina Yatskiv JSC „Riga International Coach Terminal”,
Transport and Telecommunication Institute, Latvia
1. Introduction
Integration of Latvia in the Common European Market and its joining the EU has highlighted new demands to passengers’ transportation – high mobility, inter-modality, comfort observing of passengers’ rights as well as new requirements to the interaction of transport and environment. It is impossible to exercise complete account of all these requirements without a systematic approach and applying the modern instruments to the formation and management of the passengers’ services market.
Bus and coach transport today is in hard and constant competition with the other modes of public transport. It is necessary to enlarge the network of transportations by increasing the accessibility of services in order to manage passengers’ transportation by coaches more attractive for passengers than it is done today as well as to increase the number of passengers. In this situation the role of terminal is vital. Following the best examples of passengers’ transportation by air, it would be useful for the terminals to unite in cooperation with transportation companies, and to build a common network of ticketing and information to the passengers of several European states. At the end it will bring to the so-called “virtual” terminal on the basis of using the up-to-date information technologies and general technical standard, thus making a unified Information System for passengers.
CARRIERS PASSENGERS
TRAINS AIRPLANES FERRIES PUBLIC TRANSPORT
COACH
TERMINAL
INFORMATION NETWORK
(VIRTUAL COACH TERMINAL )
INFORMATION SYSTEM
Fig. 1. General scheme of a “virtual” terminal
www.intechopen.com

Modern Information Systems
42
Raising the efficiency of the terminal control in conformity to the system approach requirements is greatly liaised with the formation of the coordinated management system including strategic, tactic and operative decisions as well as with the provision of the information-analytical base of managerial decision-making of the above types and working out the corresponding instrumentation based on the monitoring and estimation of the indicators of the inner-organisation development.
Nowadays, the good information system becomes the key moment of the development strategy of transport industry. The development of the information system is also an essential factor for coach terminals, as passengers’ transport infrastructure objects, in their transformation into passenger logistics centres (PLC). By definition a coach terminal is a linear construction consisting of specific buildings, platforms and a territory for the rendering of services to passengers and coaches during the routes. To ensure an effective operation of such a linear construction, to be able to render high quality services both to passengers and to haulers in conformity with their needs, the functions and operational activities of a coach terminal have to be evaluated at a larger scale. We would like to suggest considering a coach terminal as passenger logistics hub, taking the operational and development model of the JSC „Riga International Coach Terminal” (RICT) as a basis.
The objective of the development concept of the JSC “Riga International Coach Terminal” is as follows: „To develop the JSC “Riga International Coach Terminal” as a new passenger modular transfer and service point meeting the future requirements for high culture and diversity of passenger servicing and interlinking with other types of public transport – the railway, urban public transport, sea port and airport”.
To develop an effectively operating hub of logistics, there has to be an assessment of the main critical factors for the successful operation of such hub (Gromule & Yatskiv, 2007a): location, support by government, infrastructure, qualified labour forces, information technologies, etc. The development of information technologies that includes the IT and telecommunication infrastructure, the WEB based easy interface and e-commerce platform allow to ensure the access to both the passengers and hauler companies, thus widening the range of the coach terminal operation and services.
The role of information system in transport is important from the point of view of the quality of service for travellers. Taking into account the fact that the services of a passenger terminal are integrated into the whole chain of passenger transportations and are accepted by the user as a single service of the chain, development of a complex approach to the analysis of the passenger terminal service quality is quite topical. For passengers, there are several important aspects of travel – route, timetable (frequency of trips), time of travel, service reliability, security, etc. Some of these characteristics are objectively estimated and stored in the terminal Information System (IS) (Gromule, 2007); some of them are subjective and need constant questioning of the clients.
The chapter gives overview of the concrete passenger terminal IS and the possibilities of its employment as the decision support system (DSS) and as the basis for realizing of the PLC conception. There is also defined the place of the IS in the quality system. The example given in the chapter is the IS Baltic Lines worked out at the beginning for RICT specially and used now all around Latvia and issued for many Bus and Coach Terminals of the European Union. There are formulated suggestions on the development of the given system and formation on its basis of a virtual logistics hub as the basis and essential part of realizing the PLC conception in the chapter.
www.intechopen.com

Quality Management of the Passenger Terminal Services on the Base of Information System
43
The chapter gives consideration of the quality system existing at the terminal and development of the systematic approach to the analysis of the service quality based on both the objective data stored in the terminal information system and on the subjective data. The methodic of estimating and analysing the index of punctuality as a reliability measure is presented. There is formulated the algorithm suggested for employment in the DSS of the IS Baltic Lines.
For analysing the factors influencing the choice of a coach as a transport mean there is employed the econometric modelling on the basis of the discrete choice models’ theory. In building the models there are considered both the social-economic characteristics of passengers and the characteristics of the given service: time-table, network, etc. The detected key characteristics of the service are analysed from the point of view of their influence on the overall estimation of the quality.
The main accent in the complex approach is made on the formation of an integral (composite) quality indicator (IQI) and the detection, on this basis, of those particular attributes of quality which considerably impact the overall estimation of quality. This approach allows control and management of the service quality, coordination of special practical steps aimed at the correction of particular attributes of quality with the account of their possible influence on the overall estimation of the service quality – on IQI.
2. Review of Information systems for coach and bus transport
Analysing the experience of using information systems for this mode of transport it can be stressed upon that basically the systems provide the sale and refund of tickets, information for passengers and reports. It does not give complete information about all possibilities of travel (routes). Also, in the era of intermodality and co-modality the node of connections (terminal) has become the important part in the process of service quality provision. That’s why the Information system for terminal or system, which covers like the tasks for carriers and for terminal, is needed.
There are the different realizations of such kind of the system but most of them implemented only for realization the tasks of carriers. One of the examples - the system PLUSBUS (Ten facts, 2011) in England that has developed in cooperation of carriers but the functions of terminal are not realized. But in general the chain of passenger services provides the largest passenger flow in terminal. In the terminal a comfortable, fast and convenient service for passengers must be provided while waiting for a transfer and opportunities from one coach to another or other modes of transport. By this it is expedient to introduce additional features in the IS for collecting and processing these services, for instance, dispatch information, information on return tickets, denial of travel, booking sites, and so on.
The German experience can be mentioned as an example of using such systems, DELFI system having started its development in 1996 and its test exploitation happened in 2000. The vision of DELFI – to create an integrated travel information service for the customer out of an apparently integrated information base – has led to the approach of connecting the existing systems by means of communication (DELFI, 2006). Advanced techniques for optimising the “inter-system” search continuous itineraries have been developed. Itinerary information will be created by composing the information of all the participating systems through the open interfaces and harmonised meta information.
www.intechopen.com

Modern Information Systems
44
Another example of bus information system is NextBus that functions in San Francisco and other American cities. The core of the NextBus system is a GPS satellite (How NextBus works, 2008). The system tracks public transportation buses in the real time and dynamically calculates the estimated arrival times of the bus at each stop. This estimated time is displayed on the Internet and on the screen at each bus stop. Users can access the information from their mobile phones or PC. The NextBus system is also used in Finland (in rural areas) and other countries.
The further development of the systems of the kind is to implement the Decision Support System modulus. The task of development of the analytical part of this system is being set. From our point of view, the advanced approach to the development of such kind of the system took place in Bangkok (Borvornvongpitak & Tanaboriboon, 2005). There is the bus transit system with the developed analytical part. The analytical part of bus transit system can be used for evaluating bus performance through the developed bus indicators. Also the index of punctuality, see: (Kho et al., 2005), can be the basis for analysis of the quality of passengers’ service.
The Baltic Lines system (Gromule, 2007), which described below in this chapter, is created to manage information and economic relationship in the sphere of coach transportation for the whole totality of participants of passenger transportation: coach terminals and their branches, coach operators, agencies that sell tickets, passengers, etc. Availability of the flexible tuning of the inner functions of the system both within one company in the industry and for the co-operation of the different coach operators within the same region, as well as ability of fast localization with taking into account specific features of the country is a distinctive feature of the Baltic Lines system.
Parallel to the use of IS „Baltic Lines” in the Terminal for Customer services cashiers working in the other ticketing systems such as Toks (Lithuania); LuxExpress (Estonia); Hansabuss (Estonia) and Norma-A "Ecolines" (Latvia). Some of them are connected to the database level. Tickets and information are available through IS „Baltic Lines”. Connection of the carriers occurs through web interface. All of the systems ensure the sale and refund of tickets, information for passengers and reports. Each of the mentioned system covers only a segment of the market carriage of which serves only a part of the carriers. It does not give complete information to passengers about all the possibilities of travel (routes). IS „Baltic Lines” unites all the information about the possibilities of service from the Riga Coach Terminal.
3. Information system as the basis quality system of terminal services
The main conditions for realizing the conception of a logistics centre lie in the development of a system of the logistics centre management and its integration into a global network that is possible only on the basis of the all-round application of information technologies.
The implementation of the Riga International Coach Terminal (RICT) IS „Baltic Lines” in 2003 made it possible to form an integrated ticket sales/reservation accounting system that ensured a new level of passengers’ and carrier service quality (Gromule, 2007; Gromule & Yatskiv, 2007b). Bringing of the IS Baltic Lines of the terminal into operative allowed creating an integrated system of selling/reserving tickets (Fig.2) that provided servicing passengers and transportation companies at a new quality level.
The IS „Baltic Lines” used by the coach terminal collects, processes, stores, analyses and disseminates the information providing the following principal functions:
www.intechopen.com

Quality Management of the Passenger Terminal Services on the Base of Information System
45
coach timetable and operative information about the changes;
information about the coach movement: arrival, departure, location at the platforms,
delay;
ticket reservation and sales system, including: planning of routes, using services of
several hauler companies and vehicles; different ways of payment and communication;
observation of passengers’ rights in accordance with normative documents;
management and control system of the coach terminal service processes;
processing of operational information in economic activity accounts and control.
Fig. 2. Scheme of functioning of IS Baltic Lines
In order to ensure these functions, the coach terminal must process a large amount of
operatively changing data coming from multiple sources of information, both internal and
external. The data processed in the system is exported both for the internal use at the
enterprise and to external users. The information flow is depicted on Figure 3.
The structure of the IS Baltic Lines is formed by ten modules with the continuous inter-
exchange of information flows as it is shown on Figure 4. Organisation of the outward and
inward information flows of the IS Baltic Lines provides necessary connection between the
users of the system and other IS, such as book-keeping accounting in the IS Navision Attaine,
selling tickets at www.bezrindas.lv and others.
www.intechopen.com

Modern Information Systems
46
Fig. 3. Information flows of the coach terminal information system
The functional structure of the system envisages different users of the system:
At the terminal: system administrator; logistics specialists; administration; dispatchers, cashiers; information service;
www.intechopen.com

Quality Management of the Passenger Terminal Services on the Base of Information System
47
Other users of the system: travelling agencies selling tickets; transportation companies;
employees of the State, Ltd. “Direction of Auto-transport” and clients.
The users’ rights are spelt out in conformity with the users’ functions, performed operations
and levels of responsibility.
Fig. 4. Interaction of information flows in the IS Baltic Lines
The IS of Baltic Lines provides for:
passengers: - A new level of service – possibility of reserving or selling public transport tickets
for all trips in Latvia (no matter what the location of the passenger is);
- Possibility of buying tickets through the Internet (print, send by e-mail or mobile
phone);
transportation companies and terminals: - New possibilities of attracting passengers and raising the number of clients;
- Reduction of the tickets selling costs;
- Improving the efficiency of the work by means of an accelerated and unified
process of tickets selling;
- Quality management;
www.intechopen.com

Modern Information Systems
48
- Increasing the quality of financial accounts;
- Possibility of the operative statistics analysis;
the State Ltd. “Direction of Auto-transport”: - Accessibility to operative statistics;
- Possibility of controlling quality and transportations’ volume;
- Getting finance information.
4. A complex approach to estimating the quality of terminal services
The theoretical basis of the quality system in public transport might be presented in a form
of a „quality loop” (Fig.5), which components might be divided into two parts: customers –
passengers and service providers – carriers. Expected Quality is the level of quality that is
required by the customer.
Fig. 5. The parts of “Quality Loop” (Portal, Written material, 2003)
Targeted Quality is the level of quality, which service provider or manager of mobile system
is aiming to provide to the customers as a consequence of his understanding of the customer
expectation. Delivered Quality is the level of quality effectively achieved in the provision of
mobility services by the different components of system. Perceived Quality – the level of
quality perceived by the user-customer (Portal, Written material, 2003).
The difference between the Expected Quality and Perceived Quality reflects a measure of
the customer satisfaction. The difference between the Targeted Quality and Delivered
Quality reflects problems with the service design or anything else connected with the
provision of service. In our case the Perceived Quality on top level consists of two parts: the
Perceived Quality, which is provided by the direct service provider (carrier companies) and
the Perceived Quality, which is provided by a terminal. The complexity of this particular
case research is connected with the fact that customer often doesn’t divide the Perceived
Quality in two parts and estimates the Perceived Quality as a single whole (placing own
part and carrier’s part on coach terminal).
In 2004 RICT received the Quality Standard ISO 9001:2000 certificate within the operational
sphere of passenger traffic servicing and provision, ticket sales and trip record keeping
management. In 2010 the RICT received the ISO 9001:2008 certificate, which acknowledges
www.intechopen.com

Quality Management of the Passenger Terminal Services on the Base of Information System
49
its high quality management systems compliance with international standards and criteria.
A major part of our attempts to enforce the quality of terminal services is the use of modern
IT systems. The quality management system for the RICT consists of three hierarchical levels
(Fig.6):
1. Documents of policy, which include the formulation of quality assurance guidelines, aims and objectives, organisational structure, the sphere of certification, etc.
2. All processes that concerns the company. 3. A database, which ensures the functions of the company.
Fig. 6. The structure of the quality management system
The IS Baltic Lines constantly storing and processing in real time big volumes of updating
information is used for making decisions at both the level of strategic planning,
management control and tactic planning and the level of operative planning. To support
decision-making in the system of public transport and at all stages of providing services, a
certain volume of information is used at every level of decision-making. While defining the
volume of this information, it is necessary to take into account what actions and processes
are controlled and what level of influence on the whole system is.
Considering the IS Baltic Lines as an example, we can define two stages of its development:
realisation of collecting primary statistic data on technological processes,
providing necessary instrumentation to support management decision-making, (the
analytical part, which included analysis of the statistic data and prognosis of the
indicators of the quality and efficiency).
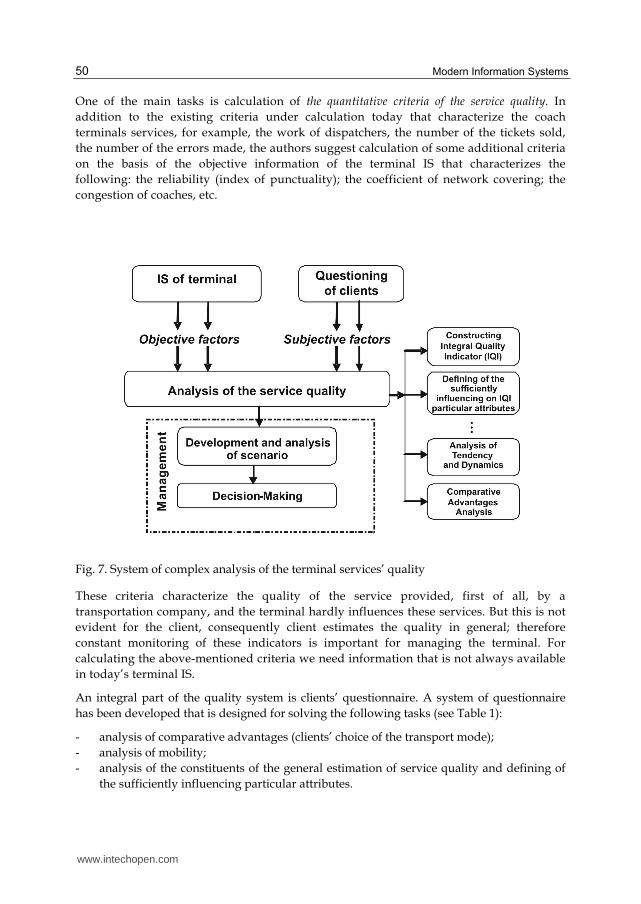
Figure 7 presents the system of complex analysis of the terminal services’ quality that
includes a number of tasks of the quality analysis on the basis of information from the
objective and subjective factors.
www.intechopen.com
Modern Information Systems
50
One of the main tasks is calculation of the quantitative criteria of the service quality. In
addition to the existing criteria under calculation today that characterize the coach
terminals services, for example, the work of dispatchers, the number of the tickets sold,
the number of the errors made, the authors suggest calculation of some additional criteria
on the basis of the objective information of the terminal IS that characterizes the
following: the reliability (index of punctuality); the coefficient of network covering; the
congestion of coaches, etc.
Fig. 7. System of complex analysis of the terminal services’ quality
These criteria characterize the quality of the service provided, first of all, by a
transportation company, and the terminal hardly influences these services. But this is not
evident for the client, consequently client estimates the quality in general; therefore
constant monitoring of these indicators is important for managing the terminal. For
calculating the above-mentioned criteria we need information that is not always available
in today’s terminal IS.
An integral part of the quality system is clients’ questionnaire. A system of questionnaire
has been developed that is designed for solving the following tasks (see Table 1):
- analysis of comparative advantages (clients’ choice of the transport mode);
- analysis of mobility;
- analysis of the constituents of the general estimation of service quality and defining of
the sufficiently influencing particular attributes.
www.intechopen.com

Quality Management of the Passenger Terminal Services on the Base of Information System
51
№ Required Interval
Title Target Group
Task Expected Results
Management Level
1 Once a year
Passenger survey on the
quality of services
Passengers Passenger
satisfaction analysis
Use of the results for the
quality management
system. Development
and improvement of
services
Operational
2 Once a year Carrier survey
on the quality of services
Carriers, coach
drivers
Carrier satisfaction
analysis
Use of the results for the quality mana-
gement system. Development
and improvement of
services
Operational
3 Regular
Consideration of the customers’
applications and complaints
Customers Customer
satisfaction analysis
Service quality improvement
Operational
4 Regular
Consideration of the applications and complaints
from the personnel
Personnel Personnel
satisfaction analysis
Human resources system
improvement Operational
5
At least once a year,
preferably automatically
Register and analysis of
delays, passenger
survey
IS database, passengers
Punctuality index
calculation, analysis of influencing
factors
Analysis and increasing of
reliability
Strategic, operational
6 2-3 years
Transport mode choice and preference
survey
Passengers
Identification of the factors that influence
passenger choice of transport
mode
Determination of the most important factors in attracting
passengers to a certain mode of
transport
Strategic
7 3-5 years
Survey on the level of services
and infrastructure of
the coach terminal
Experts
Identification of important
particular attributes of
quality
Determination of the integral
indicator of service quality and the major
quality influencing
factors
Strategic
Table 1. Surveying system for monitoring of the quality of services provided by the terminal
www.intechopen.com

Modern Information Systems
52
5. Analysis of the transportations reliability on the basis of the punctuality index
One of the considered in (Kittelson et al, 2003) reliability indices is punctuality index. Punctuality of coach operation is quantitative measure of reliability from the viewpoint of users. This index indicates the magnitude of time gap between actual and scheduled arrival times. Research of this index in combination with different factors, influencing on this index; and in an ideal development of the model for evaluation of punctuality is a difficult task, possible only at presence of plenitude of information and its pithiness. By the developed information system of the Riga Coach Terminal the decision of the mentioned task in the designed module of decision-making is not possible.
Punctuality reflects reliability of the transport enterprise activity and is accounted by passengers in choosing a transportation company and a mode of transport. If we consider railways and coach transportations we’ll see that railways are much more reliable means of transportation since its reliability is not dependent on jams and weather conditions. On the other hand, this mode of transport is less available as compared to coaches because not all regions have access to the railway network. In such competitive market, combination of comfort and service may play a deciding role in choosing a transport mode. And if transporting time does not differ greatly, to fall within the timetable may become a problem for the coach transport, especially if we consider realisation of inter-modality of transportations.
The work suggests the method of calculating and analysing the index of punctuality as a
measure of reliability of coach transportations. The index for the i-th trip with the к points of
arrival is calculated as the value of the time interval between the actual time of arrival of the
transport means at the j point for the i-th trip fijt and the planned time of arrival r
ijt :
1
*k
f ri ij jij
j
h t t w
,
where wj – a weighting coefficient for the j point equals
if
if
0,
1,
f rijij
j f rijij
t tw
t t
.
The task of exposure of different factors, stronger than all influencing on this index, is important for top management best of all.
The authors offered the following ways of investigation:
- calculation of the punctuality index for the examined period of time for a sample of the analysed trips on the basis of the data of the terminal IS;
- calculation of the descriptive characteristics of a random value – punctuality index; - investigation, on the basis of the analysis of variance, of the degree of influence on the
punctuality index of the following factors: (1) weather conditions; (2) day of the week; (3) time of the day; (4) direction of entering the city, etc.
www.intechopen.com

Quality Management of the Passenger Terminal Services on the Base of Information System
53
Approbation of the above-mentioned methods on the data of RICT has been performed by the authors only in reference to the final stop since information about the time of arrival and departure of the coaches in the intermediate points of the route is lacking in the current version of IS. The results of the approach application are published in the authors’ papers (Gromule et al., 2008a; Gromule, 2008).
For instance, it is concluded, the significant influence of the direction of entering the city on reliability – the hardest delays have been checked with the trips entering the city in the Latgale direction (see Fig.8). For the data of 2007 the value of the F criterion equals 38.45 and the critical level – F(3,1125)=2.61. As a result, some alternative routes of entering the city in case of jams in the regular directions have been suggested.
Fig. 8. 95% significant intervals for the delay time depending on 4 directions: L-Latgale, Z – Zemgale, K- Kurzeme, V- Vidzeme (July, 2007)
Application of the mentioned methods to the data of the terminal IS gives possibility of
solving the task of influencing on the reliability of both controlled and non-controlled
factors, such as:
Strategies of managing the process, which can be and are used for reacting to the problems of reliability with the purpose of their minimization.
State of transport means and quality of their maintenance.
Sufficiency of transport means and personnel (drivers, dispatchers, etc.) available and required for the trips according the timetable in the given day.
Introduction of priority for coach transportations, for example, a special traffic line for coach transportations, special traffic lights.
Difference in driving skills, knowledge of the route, keeping to the timetable.
www.intechopen.com

Modern Information Systems
54
Length of the route and number of stops, which increase the probability of the coach delay in the route.
Transport conditions (in the streets), including traffic congestions, delays of traffic lights, manoeuvres at parking, different accidents, highways’ building or current repair, etc.
6. Model of an integral indicator of the terminal services quality
Quality has a complex character and depends on many categories and dependence is not constant, therefore, we need a mechanism that tracks the influence of particular categories of quality on the integral indicator of quality.
It is of great importance for running a coach terminal to have internal logistics of its operation, the level of infrastructure, the variety and quality of services rendered. The most significant preconditions are characterised by the following (access possibilities, content and layout of information, comfort and customer service, security and environment).
It is no unique approach to measuring service quality. But, it is accepted that the quality of service is usually a function of several particular quality factors (attributes) and determining of each factor weight is the key moment of measuring quality. The theory of linear composite indicator constructing (Nardo, 2005) and statistical methods are used for definition of weights of aggregation function. In our research we have taken at the basis the approach, which is developed in D.Peña works (Peña, 1997a; Peña & Yohai, 1997b).
Authors suggest an algorithm of building a function for an integral (composite) indicator of quality which benchmarks the quality of different terminals services and revealing important quality categories influencing the total quantity indicator (Gromule et al., 2008b; Gromule et al., 2009; Gromule et al., 2010a). The linear indicator of quality assumes that function may be presented in the form
1
k
i ij ijj
Q X
,
where weight ij measures a relative importance of the attribute Xj in relation to the quality
of service for the i-th client. Selection of a model of type and estimation of the mean weight
of each attribute are the main problems in this task. The given work suggests an algorithm
of calculating weights based on a regression analysis with restrictions on coefficients signs
and values.
So, we have a task of estimating the unknown parameters with these restrictions. Suppose that the estimates of overall quality of service – Yi, (i = 1,…, n) and estimates of attributes (particular quality indexes), which define quality of service – Xij, for k-th concrete attributes (i=1, … , n; j=1, …, k) are made on the basis (0-5) scale. Let the quality of service is unknown variable, which is measured by user’s estimation Yi and determined as follows
Tβ xi i iY Z ,
where xi = (Xi1, …, Xik) – estimations of attributes, made by i-th user,
Tβ 1 , ..., k – vector of unknown weights,
www.intechopen.com

Quality Management of the Passenger Terminal Services on the Base of Information System
55
Zi – error of measuring (residual), which assumption is normally distributed
Zi ~ N(0, 2z ).
Models assumptions are assumptions of the classical regression analysis, with the exception
of the assumption about model coefficients. It is logical to assume that the increase in an
estimation of partial attribute should lead to increase in an estimation of the overall quality.
In this case dependence between the overall quality and partial attributes should be with a
positive sign. The second restriction – usual for weight – on value. Taking these conditions
into account let’s enter the restrictions on parameters (weights for partial attributes of
quality) into model and restriction of the weights vector is the following:
0j for j=1,…, k and 1
1k
jj
.
Therefore, we have a task of estimating the unknown parameters with these restrictions. The
research suggests an algorithm, which is drawn on Figure 9 and presented in publications
(Gromule et al., 2009; Gromule et al., 2010a; Gromule et al., 2010b).
At the first step of algorithm an estimation of a vector-column with unknown parameters is
finding at which value of function f() is minimum and the condition “the sum of these
parameters (weights) are equal 1” is satisfied. If the received vector has negative elements,
transition to the step 2, if not, then transition to the step 3.
At the second step (in case of s negative elements presence in a vector of parameters ( 0i ))
the following updating (modification) of initial matrix Х is made: the lines concerning negative
estimations are excluded from consideration. Transformed matrix Х dimension (k-s)×n goes on
a repeated estimation of parameters, i.e. transition to the step 1 is made.
In case of the component positivity in a vector of parameters (the third step) calculation of
standard purpose function f() in a method of the least squares, which is necessary to
minimize, is made.
At the fourth step search of optimum value of the purpose function is made. Assume that
altogether number of the remained positive parameters equals l. By serial zeroing (all
possible combinations on one, on two, on three etc. on l remained positive parameters) and
searching of all received values of the purpose function at given combinations of parameters
such set is defined at which the purpose function f() is minimum. Answering to the
minimum value of the purpose function f() the vector , which is not containing negative
elements, is the task’s decision.
The result of algorithm work is vector-column (dimension k×l) containing estimations of unknown regression model parameters only with nonnegative signs and the sum of these parameters (weights) is equal 1.
Approbation of the suggested approach was made on the basis of the results of questioning of 44 experts in transport, which was performed in spring 2009. The questionnaire included 22 particular attributes of quality distributed on 7 groups: accessibility (availability); information; time characteristics of service; customer service; comfort; safety; infrastructure
www.intechopen.com

Modern Information Systems
56
Fig. 9. The algorithm of building a function for an integral (composite) indicator of quality
www.intechopen.com

Quality Management of the Passenger Terminal Services on the Base of Information System
57
and environment (Table 2). The overall quality of service was evaluated too. The overall quality service was estimated on a scale 0-5 as well as particular attributes of quality.
Title of chapter in questionnaire
Coding Description of variable Coding
1. Accessibility W1 Accessibility for external participants of traffic X1 Accessibility for terminal passengers X2
Ticket booking X3
2. Information W2 General information in terminal X4 Information about trips in positive aspect X5
Information about trips in negative aspect X6
3. Time W3
Duration of trip X7 Punctuality X8
Reliability/trust X9 Coach time schedule X10
4. Customer service W4
Customer trust to terminal employees X11 Communication with customer X12
Requirements to employees X13 Physical services providing X14 Process of ticket booking X15
Services provided by coach crews during boarding/debarkation
X16
5. Comfort W5
Cleanness and comfort in terminal premises and on terminal square
X17
Additional opportunities/services providing in coach terminal
X18
6. Reliability/safety W6 Protection from crimes X19
Protection from accidents X20
7. Environment W7 Dirtying, its prevention X21 Infrastructure X22
W8 Overall estimation X23
Table 2. Particular Attributes of Quality
The analysis of coordination (consistency) of questionnaire questions was made by means of Cronbach alpha coefficient
2
21
11
ki
i sum
sk
k s
,
where k – amount of questions (in our case – particular quality attributes),
2is – variance of i question and 2
sums – variance of sum of questions.
The results of questionnaire (estimates of particular attributes of quality) have demonstrated high indices of the internal coordination. A value of Cronbach alpha coefficient is equal to 0.933 and the standardized value is 0.93. It has allowed making an assumption about reliability of results. The lowest value of correlation is between resultant estimate and variables x7 («trip duration») and x8 («punctuality»).
www.intechopen.com

Modern Information Systems
58
The results of questionnaire (estimates of particular attributes of quality) have demonstrated high indices of the internal coordination. A value of Cronbach alpha coefficient is equal to 0.933. It has allowed making an assumption about reliability of results. The lowest value of correlation is between overall quality estimate and variables: x7 («trip duration») and x8 («punctuality»).
It is important to analyse the descriptive characteristics of particular attributes of quality,
too. The attributes connected with infrastructure ( 22x =3.035) and environment ( 21x =3.182)
have the lowest estimates. It corresponds to a true situation: today the Coach Terminal is
experiencing difficulties and looking for new squares for moving and further repair of the
existing territory. The following low estimated attributes are «Cleanness and Comfort in
Terminal Premises and on Terminal Square» ( 17x =3.419), «Protection from Crimes»
( 19x =3.500) and «Physical Services Providing» ( 14x =3.550). These attributes also depend
directly on the infrastructure state of the Coach Terminal.
Experts have given the highest estimates to the particular quality attributes of «Coach Time
Schedule» ( 10x =4.409) and «Accessibility/Ticket Booking» ( 3x =4.5) that is also explainable.
The issues of accessibility (opportunity of ticket booking in the terminal ticket offices and in
the Internet and via the mobile telephone) are considered by the management of the Riga
Coach Terminal as priority and therefore high estimations of these attributes are obvious.
The above mentioned fact, that respondents are the high-qualified transport specialists, allowed as to assume that the sample is homogeny and the assumption about equal variance of residual is fulfilled.
The final formula of the developed model according the algorithm showed on Figure 9 is the following:
*1 4 7 8 11 12
13 19 22
0.144 0.082 0.171 0.050 0.133 0.141
0.058 0.128 0.093i i i i i i i
i i i
y x x x x x x
x x x
where x1i – accessibility for external participants of traffic x4i – general information in terminal x7i – duration of trip x8i – punctuality x11i – customer trust to terminal employees x12i – communication with customer x13i – requirements to employees x19i – protection from crimes x22i – infrastructure.
The quality of the obtained model is tested obligatory: the Standard Error of Estimate (SEE) makes about 9% in relation to the mean value of the overall estimate.
Knowledge of the weights allows regulating of the attributes according to their relative importance for the user and shows the key attributes from the point of view of improving quality. For example, revealing the fact of the importance of the x11i and x12i corresponding to the group of quality attributes “Customer service”, underlines the importance of measures of managing the coach terminal personnel. And, the second place according to
www.intechopen.com

Quality Management of the Passenger Terminal Services on the Base of Information System
59
significance X1 – “Accessibility for external participants of traffic” – confirms a correctness of a strategic goal of the terminal’s management – to make it as a modern passenger logistics centre with the high level of intermodality.
The practical result of building the given models is revealing the importance of particular attributes of quality in their influence on the evaluation of the quality provided by a passenger terminal – coach terminal. It will allow the administration to take more grounded measures of improving the quality of service. Figure 10 shows the scheme of possible usage of the quality indicator for decision-making.
CONSTRUCTING AND ANALYSIS OF
INTEGRAL QUALITY INDICATOR
COLLECTION OF NECESSARY
INFORMATION
USING IN STRATEGIC GOALS
USING OF INFORMATION FOR BEST
QUALITY ACHIEVEMENT
CORRECT INTERPRETATION OF
INFORMATION
MORE SUPPORTED DECISION MAKING IN
OPERATIVE MANAGEMENT
INFORMATION FOR SOCIETY AND
SHEARHOLDERS
PRESENTATION OF INFORMATION TO
TOP-MANAGERS
IMPROVEMENT OF SYSTEM
MEASUREMENT
Fig. 10. Scheme of using an integral quality indicator
7. Models of examining the reasons of the transport mode choice by passengers
To make passenger transportations by public transport more attractive for passengers and to increase the number of passengers, it is necessary to enlarge the network of transportations by increasing the accessibility of services. For this, the theory of discrete choice, which is being developed by scientists Ben-Akiva, Lerman (Ben-Akiva & Lerman, 1985) and others (McFadden, 1974), has been used. In the disaggregated models of a discrete choice there are accounted the factors, which influence generation of trips: social status, way of life and other characteristics of an individual. Besides, the behaviour of an individual is influenced by the characteristics of a transport mode, such as: cost and time of transfer, punctuality, comfort, suitability and quality of the transport infrastructure. A discrete choice model predicts a decision made by an individual (such as mode or route choice.) as a function of any number of variables. In the research we have investigated the influence of a wide range of factors to passenger’s choice, estimated their marginal effects. Discovered key factors and their influence directions can be used for improving the services of coach and railway carriers and terminals.
www.intechopen.com

Modern Information Systems
60
To develop models, which allow taking into account influence of numerous factors on the volume of the passenger turnover and transport needs of every individual traveller, it is necessary to have a well developed system of transport research and surveillance.
In this research a discrete choice model (Ben-Akiva & Lerman, 1985) is used for predicting a preferred transportation mode. The mathematical formalization of the model can be presented as:
1 ,TP y x X F X
where y – a discrete variable, which equals to 1 if a passenger accepts an alternative and 0 if he declines it (a binary choice); X – a set of explanatory variables; β – a vector of unknown coefficients to be estimated; F – a function, transforming a set of real numbers into [0, 1].
An econometrical base is different from a simple regression in this case – we need to estimate the conditional probability of a particular choice alternative as a function of the set of explanatory variables. There are no exact practical rules for this selection of the F function form (some recommendations can be found at (Hausman&McFadden, 1984: McFadden., 1984)). Usually F is a standardised normal cumulative distribution function (the model is called probit in this case) or a cumulative logistic distribution function (the model is called logit respectively). Both logit and probit models give similar results for intermediate values of XTβ (the function form makes a difference for larger deviations – the logistic function has fatter tails). There is no systematic difference in the results of logit and probit models estimation in our case, so the logit models only are used in this research.
There is a complication with an analysis of estimated coefficients ̂ . We can calculate the
influence of each explanatory variable xi as:
1 T T
Ti
i i
P y X F Xf X
x x
,
where f is a probability density function.
The majority of explanatory variables are discrete (qualitative) ones in our case, so we can’t use the derivatives for marginal effects calculations and use the discrete change formula instead:
1 , 1 1 , 0T Ti iP y X x P y X x .
To measuring goodness of fit we use an analogue to the R2 – McFadden’s likelihood ratio index (McFadden, 1974):
0
1Ln L
LRILn L
,
where Ln(L) – a value of the likelihood function for the full model, Ln(L0) – a value of the likelihood function for the model with a constant only.
www.intechopen.com

Quality Management of the Passenger Terminal Services on the Base of Information System
61
The authors demonstrate the approach to build a model of choosing a transport mode on the
route Riga-Daugavpils on the basis performed passengers’ questionnaire at the RICT. There
were built two models of the discrete choice of the transport mode for trips to Riga-
Daugavpils (Gromule et al., 2010; Pavlyuk et al., 2011). The first stage choice (“use a car” vs.
“don’t use a car”) represented by an usual discrete choice model (the Model I) estimated on
the base of the full sample, and the second stage (“use a train” vs. “use a coach”)
represented by a conditional discrete choice model (the Model II) estimated on the base of
the restricted sample. There were built two discrete choice models (Fig. 11).
Fig. 11. Two-level scheme of decision (Passenger’s decisions hierarchy)
We suppose that a passenger doesn’t choose a usual transport from all three possible alternatives directly, but his decision includes two steps. At the first step the person decides to use or don’t use his own car (the choice can be restricted with an absence of the own car). At the second stage, if he decided to use a public transport, he chooses either a coach or a train.
As alternatives of modes of transport the following vehicles were used: a car, a train, a
coach. There was considered a consistent model of the discrete choice. The first stage choice
(“use a car” vs. “don’t use a car”) represented by an usual discrete choice model (the Model
I) estimated on the base of the full sample, and the second stage (“use a train” vs. “use a
coach”) represented by a conditional discrete choice model (the Model II) estimated on the
base of the restricted sample. There was examined the influence of a wide range of factors
on the passenger’s choice, evaluated their particular effects. To test this supposition we have
used a procedure developed by Hausman and McFadden (Gromule, 2008), usually called a
test of independence from irrelevant alternatives.
All meaningful coefficients in the models had the explained signs (and therefore, correct
directions of influence). Both models had a high percentage of correctly classified cases.
The final formula for Model II, which includes the significant variables and estimates the
probability for choice “use a train” vs. “use a coach”, is the following:
( _ ) ( )1
x
x
eP vid train Logistic x
e
with
2.919 1.785 _ 12 _ 18 1.976 2.079 _ 2.657 _
1.988 40 _ 60 1.867 1.014 _ 1.178 _ 1.167 _
x time riga why habit why price
age direct freq year destn final alt cheap ,
www.intechopen.com

Modern Information Systems
62
where time_12_18 – a variable «departure time from 12:00 till 18:00»; riga – a variable «a person travels from Riga»; why_habit – a variable «a person states a habit as a reason for coach selection»; why_price – a variable «a person states a price as a reason for coach selection»; age40_60 – a variable «a person is from 40 till 60 years old»; direct – a variable «a trip is a direct one (vs. a return one)»; freg_year – a variable «a person travels this way once a year or rarer»; destn_final – a variable «person’s destination is the terminal point»; alt_cheap – a variable «a person thinks that a train is cheaper than a coach».
There are 86.27% of cases are classified correctly. Also we note a high level of coincidence for the rare alternative (13 of 18 passengers who usually use a train are classified correctly).
On the basis of the built models there were made the conclusions about most attractive features of coach transportation, particular features of passengers, etc. For instance, it was found out that the majority of passengers, preferring city transport, arrived at the Coach Terminal 15–30 minutes before the departure. This time interval may be used to analyse the coach terminal possibilities of offering additional services.
On the basis of the performed econometric modelling with the help of the discrete choice theory, we can make the conclusions:
- considering further possibility of using this kind of analysis on a constant basis in the system of quality of a passenger terminal, we may divide the explaining variables into two parts – observed and non-observed ones. The values of the observed variables (for example, point of destination) can be received without direct contact with person, and the values of the non-observed variables (for example, opinion about service) can be received only by questionnaire. Therefore, practical application of such models for decision-making requires thoroughly planned and wide transport surveillance;
- the detected key factors and their directions of influence are vitally useful for quality monitoring and may be used for improving the quality of services of coach and railway transportation companies and terminals.
8. Conclusions
By the development of IS the passenger terminals can offer integration of the functions of the service provider (terminal, transportation company) including planning, managing and controlling of the whole complex of transportations so as to achieve long-term strategic aims and to promote business development. This aim can be achieved by means of introducing into practice of the direct interaction between the information systems used by the passenger terminal and the information systems used by transportation companies, institutions regulating the industry.
The above-developed analytical instruments make up a system of monitoring of the quality of the terminal services, which aim is improving the manageability of the terminal. Solving the tasks of management in complex systems today lies in the sphere of designing of corporate information systems, the integral part of which is the decision support system (DSS).
The authors have developed the analytical instruments of decision-making, which may become the basis of the DSS for any passenger terminal IS:
www.intechopen.com

Quality Management of the Passenger Terminal Services on the Base of Information System
63
- the methods of the reliability analysis with calculating the punctuality index of the coach traffic and revealing the factors, which influence reliability,
- the discrete-choice models for revealing the factors, which influence the coach transportations from other modes of transport,
- the algorithm for constructing an integral quality indicator, which helps to estimate influence of every particular indicator on the overall estimate of quality.
Use of the analytical instruments developed by the authors on the base of objective and subjective data will allow, by improving the adaptability of the terminal, increasing the competitiveness not only of the terminal but of the passenger transportations under service, too.
Availability of such complex system with the integrated analytical instruments allows making efficient decisions on terminal resources management.
9. References
Ben-Akiva, M., Lerman, S. (1985). Discrete Choice Analysis: Theory and Application to Travel Demand (Transportation Studies). Massachusetts: MIT Press, 1985. 384 p.
Borvornvongpitak, N., Tanaboriboon, Y. (2005). Development of computerized Bangkok bus transit analytical system, Journal of the Eastern Asia Society for Transportation Studies, Vol.6, 2005, pp.505-518.
DELFI documentation: Report on the current status of the DELFI – system implementation / Edited by S.Schnittger, 2006.
Gromule, V. (2007). Development of Information System for Coach Terminal. In: Proceedings of the 7th International Conference “Reliability and Statistics in Transportation and Communication” (RelStat’07). Riga: Transport and Telecommunication Institute, 2007, pp. 44-52.
Gromule, V. (2008). Analysis of the quality of service of the Riga coach terminal from the viewpoint of travellers. In Proceeding of the 8th International Conference Reliability and statistics in transportation and communication (RelStat’08). Riga: Transport and Telecommunication institute, 2008, pp. 87–95.
Gromule, V., Pavlyuk, D. (2010). Discrete Choice Model for a Preferred Transportation Mode. In: Proceedings of the 10th International Conference “Reliability and Statistics in Transportation and Communication” (RelStat’10). Riga: TTI, 2010. pp. 143-151. CD.
Gromule, V., Yatskiv, I. (2007a). Coach Terminal as an important element of transport infrastructure. In: Proceedings of the International Scientific Conference “Transbaltica 2007”, Vilnius 11-12 April 2007. Vilnius, 2007.
Gromule, V., Yatskiv, I. (2007b). Information System Development for Riga Coach Terminal. In: Proceedings of the 6th WSEAS Int. Conference on System Science and Simulation in Engineering (ICOSSSE’07). Venice, Italy, 2007, pp. 173-178.
Gromule, V., Yatskiv, I., Kolmakova, N. (2010a). Estimation of Weights for the Indicators of Quality of Service. In: International Symposium on Stochastic Models in Reliability Engineering, Life Science and Operations Management. Ber-Sheeva, Israel, 2010, pp. 1180-1187.
Gromule, V., Yatskiv, I., Kolmakova, N. (2010b). Public Transport Service Quality Estimation on the Basis of Statistical Analysis. In: The Third International Conference “Problems of Cybernetics and Informatics”. Baku, Azerbaijan, 2010, pp. 232-235.
www.intechopen.com

Modern Information Systems
64
Gromule, V., Yatskiv, I., Kolmakova, N., Pticina, I. (2009). Development of the Indicator of Quality of Service for Riga Coach Terminal. In: Proceedings of the International Conference “Reliability and Statistics in Transportation and Communication” (RelStat`09). Riga: TTI, 2009. pp. 124-133. CD.
Gromule, V., Yatskiv, I., Medvedevs, A. (2008a). Development of quality indicators system as analytical part of information system for Riga coach terminal. In: International Conference Modelling of business, industrial and transport systems. Riga, Latvia: Transport and Telecommunication Institute, 2008, pp. 278–283.
Gromule, V., Yatskiv, I., Medvedevs, A. (2008b). Investigation of bus and coach service quality on the basis of information system for Riga coach terminal, Transport and Telecommunication, Vol. 9, No 2, 2008, pp. 39-45. ISSN 1407-6160
Hausman, J., McFadden, D. (1984). A Specification Test for the Multinomial Logit Model, Econometrica, Vol. 52, 1984, pp. 1219-1240.
How NextBus works, 2008 – http://www.nextbus.com/corporate/works/index.htm Kho, S.-Y., Park, J.-S., Kim, Y.-H., Kim, E.-H. (2005). A development of punctuality index for
bus operation, Journal of the Eastern Asia Society for Transportation Studies, Vol.6, 2005, pp.492-504.
Kittelson, P., Quade, B. Hunter-Zaworski, K. (2003) Transit Capacity and Quality of Service Manual, 2nd edition. Washington, DC: Transportation Research Board, National Academy Press, 2003.
McFadden, D. (1974). The Measurement of Urban Travel Demand, Journal of Public Economics, Vol.3, 1974, pp. 303-328.
McFadden, D. (1984). Econometric Analysis of Qualitative Response Models: Handbook of Econometrics, Vol. 2. Amsterdam: North Holland, 1984 pp. 1395-145.
Nardo, M., a.o. (2005). Handbook on Constructing Composite Indicators: Methodology and User Guide. OECD Statistics Working Paper, 2005. Vol. 3. 108 p.
Pavlyuk, D., Gromule, V. (2011). Application of a Discrete Choice Model to Analysis of Preferred Transportation Mode for Riga-Daugavpils Route. Transport and Telecommunication, Vol. 11, No 1, 2011, pp. 40-49. ISSN 1407-6160
Peña, D. (1997a). Measuring service quality by linear indicators. Managing Service Quality, Vol. II / Edited by Kunst and Lemmink. London: Chapman Publishing, Ltd., pp 35-51.
Peña, D. and V. Yohai (1997b). A Dirichlet random coefficient regression model for quality indicators, Journal of Statistical Planning and Inference, Vol. 136, Issue 3, March 2006, pp. 942-961.
PORTAL – Transport Teaching Material, 2003. Transport and land use. Written material. EU – funded Urban Transport Research Project Results.
Ten facts about PLUSBUS, 2011. http://www.plusbus.info/sites/default/files/pdfs/Facts%20about%20PLUSBUS.pdf
www.intechopen.com

Modern Information SystemsEdited by Dr. Christos Kalloniatis
ISBN 978-953-51-0647-0Hard cover, 166 pagesPublisher InTechPublished online 13, June, 2012Published in print edition June, 2012
InTech EuropeUniversity Campus STeP Ri Slavka Krautzeka 83/A 51000 Rijeka, Croatia Phone: +385 (51) 770 447 Fax: +385 (51) 686 166www.intechopen.com
InTech ChinaUnit 405, Office Block, Hotel Equatorial Shanghai No.65, Yan An Road (West), Shanghai, 200040, China
Phone: +86-21-62489820 Fax: +86-21-62489821
The development of modern information systems is a demanding task. New technologies and tools aredesigned, implemented and presented in the market on a daily bases. User needs change dramatically fastand the IT industry copes to reach the level of efficiency and adaptability for its systems in order to becompetitive and up-to-date. Thus, the realization of modern information systems with great characteristics andfunctionalities implemented for specific areas of interest is a fact of our modern and demanding digital societyand this is the main scope of this book. Therefore, this book aims to present a number of innovative andrecently developed information systems. It is titled "Modern Information Systems" and includes 8 chapters.This book may assist researchers on studying the innovative functions of modern systems in various areas likehealth, telematics, knowledge management, etc. It can also assist young students in capturing the newresearch tendencies of the information systems' development.
How to referenceIn order to correctly reference this scholarly work, feel free to copy and paste the following:
Vaira Gromule and Irina Yatskiv (2012). Quality Management of the Passenger Terminal Services on the Baseof Information System, Modern Information Systems, Dr. Christos Kalloniatis (Ed.), ISBN: 978-953-51-0647-0,InTech, Available from: http://www.intechopen.com/books/modern-information-systems/the-quality-management-of-the-passenger-terminal-services-on-the-base-of-information-system