Quality information - WWF · Quality information ... Scenario A broad narrative describing the...
112
-
Upload
hoangduong -
Category
Documents
-
view
216 -
download
0
Transcript of Quality information - WWF · Quality information ... Scenario A broad narrative describing the...


Quality information
Prepared by Checked by Approved by
Chris White (AECOM)Max Heaver (AECOM)Chris Thoung (CambridgeEconometrics)Petrina Rowcroft (AECOM)Richard Lewney (CambridgeEconometrics)
Petrina Rowcroft (AECOM) Steven Smith (AECOM)
Revision History
Revision Revision date Details Authorised Name Position
1 16/12/2016 Draft Report 16/12/2016 Steve Smith Project Director
2 10/03/2017 Final Draft 10/03/2017 Steve Smith Project Director
3 15/05/2017 Final Report 15/05/2017 Steve Smith Project Director

2 AECOM
Prepared for:WWF-UK
Prepared by: AECOM Infrastructure & Environment UK LimitedAldgate Tower2 Leman StreetLondonE1 8FAwww.aecom.com
Prepared in association with:Cambridge Econometrics
Suggested citation:White, C., Thoung, C., Rowcroft, P., Heaver, M., Lewney, R. & Smith, S. (2017), ‘Developing and piloting a UKNatural Capital Stress Test: Final Report’, prepared by AECOM and Cambridge Econometrics for WWF-UK.
Acknowledgements:AECOM and Cambridge Econometrics would like to thank Annela Anger-Kraavi, Paul Ekins, and PeterCostigan for providing peer review of the work undertaken for this project, as well as to all stakeholders whoprovided feedback on the development of the approach and the pilot results through one-on-one interviewsand group discussions at the workshops held as part of the project. We would also like to extend our thanks toToby Roxburgh and Karen Ellis at WWF-UK for their work in designing and leading the project’s development.
DisclaimerThis document has been prepared by AECOM Infrastructure & Environment UK Limited (“AECOM”) for soleuse of our client (the “Client”) in accordance with generally accepted consultancy principles, the budget forfees and the terms of reference agreed between AECOM and the Client. Any information provided by thirdparties and referred to herein has not been checked or verified by AECOM, unless otherwise expressly statedin the document. No third party may rely upon this document without the prior and express written agreementof AECOM.
© 2016 AECOM Infrastructure & Environment UK Limited. All Rights Reserved.

Contents
Contents .....................................................................................................................................................................1
Glossary .....................................................................................................................................................................2
Acronyms ...................................................................................................................................................................1
Executive Summary ......................................................................................................................................................2
Overview ....................................................................................................................................................................2
Context and rationale for the study...............................................................................................................................2
Aims and approach .....................................................................................................................................................3
Findings ......................................................................................................................................................................3
Conclusions ................................................................................................................................................................7
1. Introduction ............................................................................................................................................................ 10
1.1 Context and rationale........................................................................................................................................... 10
1.2 Aims and objectives ............................................................................................................................................. 12
1.3 Report structure................................................................................................................................................... 13
2. Concept and application ......................................................................................................................................... 14
2.1 Concept of a natural capital stress test ................................................................................................................. 14
2.2 Potential applications ........................................................................................................................................... 14
2.3 Key issues considered during development .......................................................................................................... 16
3. Approach to conducting a stress test .................................................................................................................... 19
3.1 Overview ............................................................................................................................................................. 19
3.2 Methodology ....................................................................................................................................................... 19
4. Analysing the economic impacts of ecosystem service change ........................................................................... 25
4.1 Overview ............................................................................................................................................................. 25
4.2 Focus of the stress test ........................................................................................................................................ 26
4.3 Understanding the economic impacts of changes in ecosystem services ............................................................... 26
4.4 Different types of ecosystem service .................................................................................................................... 28
4.5 Data requirements and the appropriate level of detail............................................................................................ 30
5. Piloting the approach ............................................................................................................................................. 32
5.1 Approach to piloting ............................................................................................................................................. 32
5.2 Headline results................................................................................................................................................... 41
5.3 Supplementary analysis ....................................................................................................................................... 67
6. Conclusions and recommendations....................................................................................................................... 73
6.1 Conclusions ........................................................................................................................................................ 73
6.2 Limitations and caveats ....................................................................................................................................... 75
6.3 Recommendations............................................................................................................................................... 77
Appendix A. Methodology for developing the approach ........................................................................................... 79
Appendix B. Scoping matrices ................................................................................................................................. 101
Appendix C. Industry groupings in the economic impact model ............................................................................ 104

2 AECOM
Glossary
Term Project definition
Acute A subset of impacts in the model which deal with short-term (often severe) changes in serviceprovision e.g. flood events
Adaptation/behaviouralresponse
The existing, planned, or anticipated response to ecosystem service change that is intended tomitigate impacts of that change
Case study An example to demonstrate how the stress test approach may be applied to address a particularquestion of policy interest
Chronic A subset of impacts in the model which deal with longer-term incremental changes in ecosystemservice provision e.g. changes in soil productivity
Drivers Themes that will generate changes in natural capital
Impact The effect on ecosystem service provision from a change in natural capital or the resultingeconomic effects from a change in ecosystem services
International impact The effect that similar changes in natural capital might have worldwide, realised as economy-level changes (e.g. price changes, import availability)
Model The process for quantifying the acute and chronic impacts of changes in ecosystem serviceprovision on the UK economy
Project methodology The steps taken to design and pilot the natural capital stress test in this project
Scenario A broad narrative describing the possible future stresses on natural capital relating to five directdrivers of change
Sensitivity The extent to which changes in variables generate different outcomes
Stress test approach The initial approach put forward for use and development by Government and other users
Shocks Irregular events leading to acute changes in natural capital and ecosystem service provision
Stresses Ongoing pressures leading to chronic changes in natural capital and ecosystem serviceprovision
Variables The quantified changes in ecosystem service provision associated with natural capital impacts;these are used to estimate the total change in service provision which feed into the model

Acronyms
Term Project definition
BEIS Department for Business, Energy & Industrial Strategy
BMV Best and Most Versatile agricultural land
CCRA UK Climate Change Risk Assessment
CICES Common International Classification of Ecosystem Services
Defra Department for Environment, Food & Rural Affairs
GDP Gross Domestic Product
GVA Gross Value Added
NCC Natural Capital Committee
NCST Natural Capital Stress Test
ONS Office for National Statistics
UKNEA UK National Ecosystem Assessment
UKNEA-FO UK National Ecosystem Assessment Follow-On

2 AECOM
Executive Summary
OverviewThis report sets out the results of a study that developed and piloted a new Natural Capital Stress Test(NCST) for the UK, to help the Government to track emerging environmental risk ‘hot spots’ in the economy,pinpointing which business sectors are most at risk, in order to help identify the need for and to prioritisepolicy responses.
The study findings show that the loss or degradation of natural capital could lead to significant impacts on thenational economy by 2050 if actions are not undertaken to curb or adapt to the potential changes. Theseimpacts could be particularly significant for the most at-risk sectors, such as the food and beverages sector.
Degradation of the natural environment, both in the UK and overseas, is already posing mounting risks to oureconomy and businesses (e.g. due to flooding, soil erosion, and air pollution). These findings underline theimportance of developing a better understanding of, and carefully managing, these risks in order to safeguardthe UK’s future economic resilience and prosperity.
Context and rationale for the studyNatural capital is the stock of renewable and non-renewable natural assets (minerals, soil, air, water, and allliving things) that provide benefits to people. These assets contribute to the economy and human wellbeingdirectly and indirectly in many different ways.
The Natural Capital Committee (NCC) has warned that the condition of many of these assets is at high or veryhigh risk.1 Changes in natural capital assets are already imposing significant costs on the UK economy andbusinesses,2 and the growing risks to natural capital could have potentially significant impacts on the futuregrowth of the UK economy.3,4
The NCC also identified a gap in our understanding around the impact of changes in natural capital on UKmacroeconomic performance; recommending further work to promote a better understanding of “the impact ofchanges in natural capital upon the economy, jobs, and growth” in its advice to Government on priorities forresearch.5 The importance of understanding these issues for policymakers was emphasised at a workshopheld as part of this project where one of the participants observed, “ultimately, the issues that keep decisionmakers awake at night are GDP, unemployment, and inflation.”
In light of these recommendations, WWF-UK is interested in drawing on the stress test approach used in thefinancial sector to develop and pilot a ‘natural capital stress test’ (NCST) for the UK. Using the financial stresstesting analogy, an NCST is a scenario analysis exercise in which various impacts associated with one or
1 Natural Capital Committee (2014), ‘The State of Natural Capital: Restoring our Natural Assets’. Report to Economic Affairs Committee.2 Natural Capital Committee (2015) The State of Natural Capital Protecting and Improving Natural Capital for Prosperity and Wellbeing.3 Atkinson G. (2015) Natural Capital and Economic Growth. Natural Capital Committee Discussion Paper [online] available athttp://nebula.wsimg.com/402030805e7bc7a4a9849e7bb3ec3dff?AccessKeyId=68F83A8E994328D64D3D&disposition=0&alloworigin=1(last accessed 10 February 2017)4 Natural Capital Committee (2014), ‘The State of Natural Capital: Restoring our Natural Assets’. Report to Economic Affairs Committee.5 Natural Capital Committee (2015), ‘Advice to Government on research priorities’.

AECOM 3
more plausible but adverse future scenarios are identified. Here, the analysis tests a plausible but relativelyextreme adverse scenario of ecosystem service decline, to gauge the resilience of the economy.
An NCST could therefore be part of a toolkit to provide the UK Government, businesses, and otherstakeholders with a means to systematically track emerging environmental risks affecting the economy, andpinpoint which sectors of the economy are most at risk in order to help identify appropriate policy responses.
Aims and approachThe overall aim of this project was to develop and pilot an NCST methodology that could be applied by the UKGovernment, businesses, and other stakeholders to identify the impacts of environmental degradation ineconomic terms in order to help prioritise and inform efforts to mitigate the most significant risks.
The approach taken to developing and piloting an NCST for the purposes of this project was as follows:
· Reviewing the literature on existing stress testing and related approaches to identify any lessonslearned for applying the concept to natural capital.
· Undertaking a series of semi-structured interviews with stakeholders from Government, academia,and the private sector in order to identify the key decision making processes which an NCST shouldaim to support.
· Developing an outline approach to conducting an NCST based on four key steps: (1) determining thescope of the stress test; (2) formulating a plausible adverse scenario, based on existing evidence, tobe tested; (3) identifying and quantifying the impacts on ecosystem services that would arise in thatscenario; and (4) identifying and valuing the economic impacts of those changes in ecosystemservices.
· Piloting the approach by looking at plausible adverse changes in the provision of three ecosystemservices by 2050: crops and livestock, water supply, and flood regulation.
· Reviewing and revising the approach and pilot results through two workshops with key stakeholdersand a peer review process from relevant technical experts.
FindingsThe UK economy benefits from a wide range of ecosystem services, provided by domestic and internationalnatural capital stocks. Different sectors of economic activity depend to different degrees on different services.For the purposes of developing and piloting the approach developed as part of this project, three ecosystemservices were selected that, prima facie, are likely to be of greater economic significance than other services.These were selected by means of a qualitative assessment of the dependence of each economic sector oneach ecosystem service to first identify which services are of most importance to the economy as a whole.
This qualitative assessment applied a set of criteria to successively filter the ecosystem services identified inthe European Environment Agency’s Common International Classification of Ecosystem Services down to theservices to be taken forward for more detailed investigation as part of the project. Models were thendeveloped for each of the ecosystem services selected in order to quantify, in broad terms, the potentialimpact on economic activity in 2050 of changes in the provision of each ecosystem service under a plausiblescenario of change (see Table 1 below).

4 AECOM
Table 1. Overview of pilot scenario
Pilot scenario
The scenario was developed around the five key drivers of ecosystem change identified in the UK National EcosystemAssessment.Climate change - The international community fails to meet the required reductions in greenhouse gas emissions to limitwarming to two degrees and instead follows a four degrees of warming path. The subsequent impacts cause significantreductions in the amount of water in the environment that can be sustainably withdrawn, while also increasing the demandfor water during the driest months. The frequency and magnitude of floods in the UK also rise significantly and causegrowing costs to a range of economic sectors. Globally, changes in the climate system disrupt food production in the restof the world. International food prices increase as a response to the supply shock, with an assumed doubling of prices,similar to the price hikes of 2007-08.Invasive species - Increasing demand for global imports and a more diverse supply chain, together with changes in theclimate and land use, lead to a significant increase in the frequency and severity of pest and disease outbreaks in the UKand growing costs for the agriculture industry.Habitat change - A reduction in public subsidies for UK agriculture results in abandonment of land with low agriculturalproductivity. Growing demand for housing results in urban expansion into Green Belt and peri-urban farmland areas andonto riverine and coastal floodplains.Nutrient enrichment and pollution – Relaxation of environmental regulations results in increases in livestock stockingdensities and more widespread and intense use of pesticides and fertilisers causing long-term decreases in the quality ofsoils and water and further decline in pollinator populations. This in turn results in increased costs for agriculture, watertreatment and reduced capacity of ecosystems to regulate flooding.Overexploitation of resources – Growth in demand for water exacerbates pressures on increasingly scarce waterresources in some parts of the country. Water shortages become commonplace.
As such, the NCST piloted in this project aimed to answer three key questions related to the three ecosystemservices identified:
· Crops and livestock: What is the potential scale of the impact of a reduction in the output ofagricultural crops and livestock in 2050 due to a combination of acute tail-end shock events such asfloods and disease outbreaks, and chronic declines such as falling soil productivity and a loss ofnatural pollinators?
· Water supply: What is the potential scale of the impact of a reduction in water availability due to anacute drought event in 2050 that is made more severe by chronic growth in demand that exceeds thenatural replenishment of water resources?
· Flood regulation: What is the potential scale of the impact of a one-off repeat of the winter floods of2013/14 given the greater numbers of people and properties at risk of flooding due to ongoingchanges in the climate system and population by 2050?
The answers to these three key questions are summarised in Table 2 and explained in more detail in thefollowing sections.
Table 2. Headline results from the pilot NCST exercise
Ecosystemservice
Scenario Estimated impacts in2050
Crops andlivestock
Output shock in 2050 from disease outbreaks, flood events, wildfires,poor weather events, and heatwaves
0.9% reduction in GDP347,000 jobs lost
Productivity losses over time to 2050 from changes in growingconditions and land use, declines in pollinators, and falling soil productivity
0.2% reduction in GDP66,000 jobs lost

AECOM 5
Ecosystemservice
Scenario Estimated impacts in2050
Watersupply
Three-month UK wide drought in 2050, if there had been continueddepletion of water reserves from now until 2050
1.0% reduction in GDP354,000 jobs lost
Three-month UK wide drought in 2050, if water reserves had beenprotected and maintained at current levels
0.5% reduction in GDP156,000 jobs lost
Floodregulation
Repeat in 2050 of the 2013/14 winter floods with continued populationgrowth and limited action on climate change
70% increase in damagesto £2.2bn (2013/14 prices)
The ability of the stress test to generate such measures of macroeconomic performance goes some way toaddressing the research gap identified by the NCC. Of course, GDP is narrow as an indicator and, in thecontext of the current exercise, may not adequately reflect the longer-term damage to productive capacity(e.g. to the UK capital stock); just the consequences for economic activity. Indeed, were the data available toinclude them in this analysis, mitigation, adaptation and recovery measures could all increase GDP. Onedirection for future work would be to consider what other evidence could complement the indicators above.
Crops and livestock
For the modelling, assumptions needed to be made about the extent to which adaptations could be made inresponse to these changes, and on whom the biggest impacts would fall. For example, for crops andlivestock, the impact, in terms of the loss of economic activity, depends critically on how easily the sectors thatuse agricultural products can adapt to reduced availability without curbing their own production.
One relatively low cost way of adapting is to source the same products from abroad. For a short-term crisis,this means a temporary switch to imports. For chronic declines, it means a persistent increase in dependenceon imported food. However, the pilot exercise assumed that similar trends in natural capital degradation are atwork elsewhere (evidence in the 2005 Millennium Ecosystem Assessment6 bears out this assumption).
A particular crisis event (such as flooding) may not occur in several countries at once, and so it may befeasible to rely on imports to buttress food security. But if, for example, flooding affects much of continentalEurope at the same time as the UK, there will be a substantial loss of supply in this global region and ensuingcompetition for the available exports from the rest of the world. For chronic declines in agricultural output,reliance on imports is a still less plausible solution if other countries are experiencing similar declines.
In a short-term crisis, the scope for adaptation may be limited. Shortage of agricultural inputs may limitproduction in food and beverage manufacturing and possibly in wholesaling, retailing, and catering services.Food shortages will be communicated by higher prices, with more severe impacts on poorer households, whospend a larger proportion of their budget on food. The uncertainties in this kind of exercise are large but, inscenarios modelled in the pilot exercise, the reduction in UK GDP in 2050 could be as large as 0.9%. Whilesmall in aggregate, the reductions in output are concentrated in the agriculture and food-production industries.In some cases, the impacts could exceed 20% of the sector’s gross value added. There would also besmaller, knock-on effects on catering and hospitality services.
In the case of a chronic decline in agricultural output, the question becomes: how does food production adaptover time? Are there mitigating actions (which probably impose higher production costs) that could be taken,
6 Millennium Ecosystem Assessment (2005). Ecosystems and human well-being : synthesis (PDF). Washington, DC: IslandPress. ISBN 1-59726-040-1.

6 AECOM
and what sort of shift in the composition of food production could be expected? The scenario includes reducedlivestock production and clearly the downstream processors, wholesalers, and retailers of meat products anddairy producers would face higher costs, while higher prices would curb household meat and dairyconsumption. What is less clear is the capacity to increase production of the alternatives (say, less land-intensive meats and vegetarian proteins) in the face of other pressures on ecosystem services. In scenariosmodelled as part of the pilot exercise, the annual losses in economic activity from a chronic decline inlivestock production, meat processing, and dairy products could grow to as much as 0.5% of UK GDP by 2050(though the main results, in Table 2, suggest an impact closer to 0.2%). In the meat processing and dairyindustries, gross value added could be 15-20% lower in 2050 than in a ‘no degradation’ case.
Water supply
In the case of an acute water shortage, the cost implications for businesses again depend on how easily thesectors that use water can adapt to reduced availability. However, unlike the crops and livestock case, waterrationing is presently achieved through regulation rather than a price mechanism. At present, a combination ofmeasures to enhance efficiency, restrict certain types of water use, and run down water reserves is typicallysufficient to see out a drought. In the future, with long-term growth in demand exceeding supply, theheadroom provided by reserves would be smaller and, hence, more severe drought management measuresmay be required.
It is difficult to anticipate how this scenario would play out. Water is typically a small input for most sectors, butsmall is not the same as non-essential or easily substitutable. If an economy had to rely on a scaling down ofproduction to reduce water demand, the impact on GDP could be large (it can take a large reduction in outputto achieve quite a small reduction in water use). In the event of a nationwide, three-month drought in 2050, forexample, the modelling undertaken in this study estimated an impact that amounted to around 1% of GDP.Using the same method, but with action taken to maintain the headroom provided by reserves at their currentlevels, the impact could be closer to 0.5% of GDP. In this analysis, with the economy simply scaling downproduction, the most affected sectors in terms of the percentage reduction in gross value added areagriculture, mining and quarrying, and utilities (particularly energy). Were water reserves allowed todeteriorate, these sectors could see reductions in gross value added of 4-5% in the event of a drought in2050. These reductions could be halved were action taken to maintain and protect water reserves at theircurrent levels.
In practice, any reduction in headroom over time would, no doubt, signal the need for action to pre-empt sucha crisis. The point of an NCST would be, amongst other things, to identify areas where early action might benecessary to avoid future risks.
This example illustrates how a long-term (chronic) decline in natural capital (water reserves) can change theseverity of an acute shock (a drought) by reducing the capacity of the system to absorb that shock. For someecosystem services, natural capital decline can make the economy more vulnerable (less resilient) to shocks.A stress test provides a framework with which to understand, and account for, such effects.
Flood regulation
The costs of degraded flood regulation services depend on the extent of physical damage caused by aflooding event as well as losses of production. The scenario examined in this study draws upon the ClimateChange Risk Assessment (CCRA) findings that a flood event of given likelihood (1 in 75 years’ probability), isexpected to have a larger impact in the future because climate change is projected to increase the magnitudeof the event and because land use changes impair flood regulation and put more properties in ‘at risk’ areas.
The results of the pilot exercise suggest that the costs of physical damage to property from such an eventmight be some 70% higher in 2050 than those associated with the 2013/14 experience (£2.2bn rather than£1.3bn, in 2013/14 prices). The analysis suggests that more of the future damage costs would fall on housingand businesses. Together, these two sectors could account for more than half of the total damage costs of a

AECOM 7
flood in 2050 (up from 46% in 2013/14). Under the trends assumed in the scenario, the implication is thatthese sectors would become more exposed over time. However, due to a lack of data, neither the 2013/14estimate nor the projection for 2050 includes the costs of lost production due to disruption to business activity(either because premises are flooded or because infrastructure is damaged).
ConclusionsThe development and piloting of an NCST approach in this study demonstrates that the loss or degradation ofnatural capital could lead to significant impacts on the national economy by 2050 if actions are not undertakento curb the damage or adapt to the potential impacts. These impacts could be particularly significant for themost at-risk sectors, such as the food and beverages sector. In this way, a stress test can help fill the gap inunderstanding highlighted by the NCC with respect to “the impact of changes in natural capital upon theeconomy, jobs, and growth”.7 However, given the significant methodological challenges and data gapsidentified, it is also clear that we still have relatively limited understanding of environmental risks and theireconomic impacts, and that more research and analysis is required to address this.
The pilot NCST undertaken in this project demonstrated that there are significant uncertainties involved inestimating and quantifying the extent of natural capital risks and the impacts they could have on the economy.It should be emphasised that only a small selection of ecosystem services were examined in the pilot exerciseand it was not possible to aggregate the various impacts across the three ecosystem services explored (dueto the different assumptions and approaches used). As such, each estimate only represents a portion of theaggregate impact on the UK economy of changes in natural capital and the estimates should not beinterpreted as comprehensive or even a lower bound for the full range of potential consequences of naturalcapital loss or degradation.
One of the lessons from this exercise has been that particular pathways of impact of ecosystem serviceschange on the economy call for bespoke modelling that is tailored to the particular circumstances envisagedin each case. With the current state of knowledge, no single model appears capable of capturing the keyfeatures of the narrative for different ecosystem service changes. The analysis also encountered uncertaintiesover:
· The scale of loss of ecosystem services that should plausibly be considered.
· The possible breach of tipping-points or thresholds beyond which there would be a sharp deteriorationin service provision.
· The ease with which firms can adapt to temporary or longer-term changes in resource availability orproductivity.
As a result, the quantitative estimates produced by the modelling are inevitably subject to a degree ofuncertainty. Drawing an analogy with financial stress testing, which assesses the resilience of financialinstitutions to tail-risk economic shocks, the aim of the exercise was to identify the potential exposure of theeconomy to a decline in ecosystem services that, as far as present knowledge permits, represents aneventuality that society should plan for. Unlike a financial stress test, this analysis cannot rely significantly onhistorical events to determine the parameters for the test because this is likely to be entering unchartedterritory. Also, the set of potential impacts and interactions with regard to natural capital is far more complex.
7 Natural Capital Committee (2015), ‘Advice to Government on research priorities’.

8 AECOM
Further work could be undertaken to begin to address some of these uncertainties and resolve some of theissues identified through the piloting. This might include, for example:
· Improving the evidence base to better describe the risks to the UK’s natural capital and ecosystemservices. This could involve undertaking primary research or aligning with existing research projects(such as the Climate Change Risk Assessment) to fill in key gaps in understanding.
· Creating a framework for the development of stress test scenarios. Such a framework may not onlyprovide useful guidance for those involved in deploying an NCST, but may also facilitate consistentassessments that could be repeated periodically in the same way as financial stress tests are appliedto banks.
· Expanding the scope of the NCST by piloting additional ecosystem services and exploring the extentto which adaptation and behavioural responses on the part of businesses could be incorporated toprovide a more realistic assessment of the economic impacts of changes in ecosystem serviceprovision.
Critically, the approach developed and piloted in this project could support decision making for a wide range ofGovernment and private sector stakeholders (see Table 3).
Table 3. Potential users of an NCST
Potential user group Decision-making in which an NCST could be of use
HM Treasury Supporting annual budgetary decision-making e.g. informing budgetary allocations andmeasures as well as Spending Reviews and Comprehensive Spending Reviews
Department for Health Supporting decision-making and budget allocations around preparation for natural capitalrelated public health challenges and estimating the potential costs of such impacts
Department for Business,Energy & Industrial Strategy
Informing the UK national infrastructure plan and industrial strategy e.g. identifying thecontribution of natural capital to productivity/growth and mitigating risks
Local Enterprise Partnerships Identifying risks to the growth of local economies and local employment and developinglocal growth strategies which take into account resilience of natural capital stocks
Cabinet Office Updating the UK National Risk Register to account for environmental change andinforming mitigation planning decisions
DefraInforming the 25 Year Environment Plan for restoring natural capital, and identifyingareas where market failures might require intervention and identifying priority metrics formonitoring natural capital (including with respect to economic impacts)
Environment Agency Supporting decision-making relating to crisis preparation and undertaking national levelrisk assessments which incorporate the economic impacts of flood events
Foreign & CommonwealthOffice
Informing the formulation of international economic, trade, security, and environmentalpolicies
National InfrastructureCommission
Understanding the level of resilience of national infrastructure schemes to future naturalcapital risks
UK and international business Identifying key vulnerabilities in cross-sectoral supply chains and developing moreresilient supply chains
In order to improve the applicability of the NCST developed and piloted in this project, a number of practicalsteps could be taken to communicate and refine the approach:
· Workshops could be organised with the relevant Government departments to identify the mostsignificant potential applications of the NCST, who might use the approach and when, and anymodifications that might improve its usability for specific applications.

AECOM 9
· Businesses and sector associations could be invited to comment on the development of scenariosrelevant to particular sectors, explore how the approach could align with the Natural Capital Protocol,8
and collaborate in adapting the process for business use.
· A discussion (or study) could be initiated to assess the extent to which the Government and businesswill be able to adapt and respond to the potential natural capital changes and economic impactsidentified through the NCST, in order to identify appropriate policy responses, particularly in thecontext of the Government’s 25 Year Plan for the Environment.
It is clear that more work is required to develop the natural capital stress testing approach further, to improvethe robustness of results and increase its applicability. However given that the economic risks highlighted inthis first pilot testing exercise are quite significant, some additional investment in this approach would bearguably warranted.
8 Natural Capital Coalition (2016) Natural Capital Protocol [online] http://naturalcapitalcoalition.org/protocol/

10 AECOM
1. Introduction
1.1 Context and rationaleNature is fundamental to human life: it underpins human wellbeing and provides the food, energy, andmaterials that are vital to economic prosperity and development. Natural capital is the stock of renewable andnon-renewable natural resources (geology, soil, air, water, and all living things) that combine to yield a flow ofecosystem services which generate benefits to people.
These ecosystem services contribute to the economy and human wellbeing directly and indirectly in manydifferent ways. They provide products that are sold directly, such as fish or agricultural crops; supply inputs tothe production of goods, such as water; support landscapes and wildlife that promote tourism and recreation;and deliver the wider conditions that underpin a well-functioning economy, such as a healthy environment thatsupports a productive workforce and natural infrastructure that reduces exposure to climate-related impactssuch as floods, landslides, or fires.
Despite the importance of the benefits provided by the UK’s natural capital assets, the Natural CapitalCommittee (NCC) has warned that many of these are at high or very high risk.9 With the UK populationprojected to grow by over nine million people over the next 25 years10, and a significant pipeline of UKinfrastructure investment identified by the Government, pressure on natural assets is likely to increase. This islikely to be further exacerbated by the effects of a changing climate. The most recent Climate Change RiskAssessment for the UK, for example, identifies specific risks to crop and fisheries productivity, the ecologicalhealth of rivers and lakes, and the viability of coastal defences.11
Changes in natural capital assets and the services that flow from them are already imposing significant costson the UK economy and businesses12 – costs which have largely gone unnoticed as the services provided aretypically unpriced and either excluded from, or invisible within, conventional measures of economic growth orbusiness performance.
However, as the extent of the changes grows, the costs are becoming increasingly apparent in increasinglytangible ways: from water shortages to flooding and coastal erosion, declining soil quality and pollinatorabundance which affect arable agriculture, and increasing healthcare costs associated with declining airquality. Ongoing trends and the future state of natural capital assets could therefore have potentiallysignificant impacts on the growth of the UK economy.13,14 The UK also depends (and impacts) on stocks ofnatural capital elsewhere in the world through international trade and supply chains, exposing the economy tofurther risks from natural capital depletion beyond the UK.
9 Natural Capital Committee (2014), ‘The State of Natural Capital: Restoring our Natural Assets’. Report to Economic Affairs Committee.10 ONS (2016) 2014-based national population projections reference volume [online] available athttps://www.ons.gov.uk/peoplepopulationandcommunity/populationandmigration/populationprojections/compendium/nationalpopulationprojections/2014basedreferencevolumeseriespp2/anexecutivesummary2014basednationalpopulationprojectionsreferencevolume (lastaccessed 10 February 2017).11 Brown et al. (2017) UK Climate Change Risk Assessment Evidence Report: Chapter 3, Natural Environment and Natural Assets.Report prepared for the Adaptation Sub-Committee of the Committee on Climate Change, London.12 Natural Capital Committee (2015) The State of Natural Capital Protecting and Improving Natural Capital for Prosperity and Wellbeing.13 Atkinson G. (2015) Natural Capital and Economic Growth. Natural Capital Committee Discussion Paper [online] available athttp://nebula.wsimg.com/402030805e7bc7a4a9849e7bb3ec3dff?AccessKeyId=68F83A8E994328D64D3D&disposition=0&alloworigin=1(last accessed 10 February 2017)14 Natural Capital Committee (2014), ‘The State of Natural Capital: Restoring our Natural Assets’. Report to Economic Affairs Committee.

AECOM 11
This is reflected in the World Economic Forum ‘Global Risks Landscape’ which shows that a cluster ofinterconnected environment-related risks – including extreme weather events, climate change, and watercrises – have consistently featured among the top-ranked global risks for the past seven editions of ‘TheGlobal Risks Report’. Environment-related risks again stand out in this year’s global risk landscape15 and arealso shown to be closely interconnected with other risk categories. Indeed, stark warnings have been madeabout the risks posed by a series of interacting global pressures related to climate change and demands forenergy, water, and food that could coincide to create an unprecedented set of circumstances.16
Recognising the value of natural capital in decision-making has the potential to change the way in which it ismanaged and used. In particular, it could contribute to a better understanding of the potential impacts ofnatural capital depletion, and the potential benefits of efforts to protect and enhance natural capital. In thisway, valuing natural capital could help to facilitate prioritisation of issues to address, and comparison of thecosts and benefits of different policy options. Moreover, placing a value on natural capital could also help toensure that nature is not just seen as a ‘nice to have’ that is unconnected to the economy or wellbeing, but isinstead recognised as a foundation underpinning the UK economy and society.
Through the work of the NCC, TEEB (The Economics of Ecosystems and Biodiversity), the Natural CapitalCoalition, and others, the level of understanding of natural capital has grown considerably over recent years.This understanding has also come to include the potential economic and social impacts of natural capitaldepletion, and the potential benefits of protecting/improving specific assets. This is reflected in, amongst otherthings, the growing number of users of the Natural Capital Protocol, signatories to the Natural Capital FinanceAlliance, and efforts by the UK Government – the Department for Environment, Food and Rural Affairs (Defra)and the Office for National Statistics (ONS) in particular – to monitor the state of natural capital andincorporate it into the System of National Accounts where possible.
The NCC and UK National Ecosystem Assessment Follow-On (UKNEA-FO) have, however, both identified agap in the understanding of the impact of changes in natural capital on UK macroeconomic performance.More specifically, the UKNEA-FO identified a need to improve the Government’s “analytical capability aroundmacroeconomy–environment interactions”17 while the NCC, in its advice to Government on priorities forresearch, recommended further work to promote a better understanding of “the impact of changes in naturalcapital upon the economy, jobs and growth”.18
In particular, the NCC identified the need for empirical and theoretical work to resolve the most relevantquestions for policy-making, which were identified as follows:
· “How do changes in our natural capital affect measures such as national income, growth and jobsboth directly and indirectly?
· What sort of frameworks do we need to examine, measure and model these links effectively?
· How do these changes vary across the short- and long-term?”19
15 World Economic Forum (2017) The Global Risks Report 2017 12th Edition [online] available athttp://www3.weforum.org/docs/GRR17_Report_web.pdf (last accessed 10 February 2017).16 Beddington (2009) and the World Economic Forum’s (2011) Global Risks Report. This is often referred to as the ‘perfect storm’.17 Anger et al. (2014), ‘UK National Ecosystem Assessment Follow-on. Work Package Report 2: Macroeconomic implications ofecosystem service change and management: A scoping study’, UNEP-WCMC, LWEC, UK.18 Natural Capital Committee (2015), ‘Advice to Government on research priorities’.19 Natural Capital Committee (2015), ‘Advice to Government on research priorities’.

12 AECOM
The importance of understanding these issues for policy makers was emphasised at a workshop held as partof the project where one of the participants stated that, “ultimately, the issues that keep decision makersawake at night are GDP, unemployment, and inflation.”
In light of these recommendations, WWF-UK is interested in the possibility of developing and piloting a‘natural capital stress testing’ methodology which aims to contribute to this understanding. A stress testingapproach is fundamentally a scenario analysis exercise in which various impacts associated with one or moreplausible future scenarios are assessed. The analysis involves testing a plausible but relatively extremeadverse scenario, with the intention of testing the resilience of the system.
The Government already requires the financial sector to conduct stress testing in relation to financial shocks.Stress testing is now also being conducted in relation to future climate change impacts20 and the UnitedNations Environment Programme has encouraged the more widespread uptake of ‘sustainability stress tests’– assessments of the impacts on financial assets and institutions of a range of environmental factors such asair pollution, carbon emissions, natural hazards, and water stress.21
WWF-UK has therefore proposed that the UK Government adapts and adopts the concept of stress testingused in other sectors, and applies it to help assess and inform policy related to natural capital management. In2015, WWF-UK commissioned a piece of work by eftec to examine how natural capital stress testing could beconducted.22 The work identified a need to adapt the concept of a financial stress test to a significant extent,and specifically to focus on national or sectoral economic performance metrics (e.g. related to economicproductivity, jobs, and growth), rather than asset values and ratios as measures of potential impact.
1.2 Aims and objectivesThe overall aim of this project was to develop and pilot a methodology for natural capital stress testing thatcould be applied by the UK Government and the private sector in order to help identify and assess the risks(in economic terms) of ongoing or worsening environmental degradation and/or depletion, and to help theGovernment to prioritise and inform efforts to mitigate the most significant risks.
The specific project objectives were to:
· Develop a methodology (and appropriate indicators/metrics) for assessing potential risks to differentsectors of the UK economy and/or on the overall economy from natural capital degradation and/ordepletion.
· Apply this methodology to assess the potential risks under a plausible future scenario based on,among other aspects, extrapolation of existing trends.
The methodology and pilot results presented in this report are intended to demonstrate proof of concept,recognising that there are still gaps in our knowledge of the resilience of many forms of natural capital, andspecifically the thresholds beyond which they become less productive or cease to function, as well as theability to model the complex interactions between various drivers of change and changes in natural capitaland ecosystem services.
20 See, for example, Boston Common Asset Management (2015) Are Banks Prepared for Climate Change [online] available athttps://bostoncommonasset.com/Membership/Apps/ICCMSViewReport_Input_App.ashx?IX_OB=None&IX_mId=18&IX_RD=Y&ObjectId=731308 (last accessed 10 February 2017); and http://www.bankofengland.co.uk/research/Pages/conferences/1116.aspx21 UNEP (2015) Financing the Transition. Our Planet: Global Climate Action Innovations and Best Practice. December 2015. [online]available at http://web.unep.org/ourplanet/december-2015/unep-work/financing-transition (last accessed 10 February 2017).22 eftec (2016), ‘Developing a UK national economy natural capital stress-test’, For WWF-UK.

AECOM 13
1.3 Report structureThe remainder of the report is structured as follows:
· Section 2 describes the concept of an NCST, some of the key issues that were considered indeveloping the approach, as well as some of the potential applications (i.e. how it might be used toinform policy making and the kinds of specific policy questions it could potentially be used to helpanswer).
· Section 3 sets out an approach to conducting an NCST and identifies some of the tools andresources that may be helpful in formulating scenarios, assessing impacts, and quantifying these ineconomic terms.
· Section 4 sets out the principles by which changes in ecosystem services lead to economic impacts.This provides guidance on the kinds of effect that might need to be captured in a quantitativeassessment.
· Section 5 presents the results of an exercise to pilot the approach described in Section 3. It illustrateshow an NCST may be used to derive headline indicators of macroeconomic impact, as well as toaddress specific issues of policy interest at different scales.
· Section 6 seta out the conclusions of the pilot exercise, identifies some of the limitations of theapproach, and provides recommendations for further work to address these issues.
The main report is accompanied by a series of appendices, including the methodology employed to developthe approach outlined in Section 3 and an overview of the process for determining the scope of the pilotNCST. The economic model used for estimating the economic impacts of changes in natural capital andecosystem services is available separately.

14 AECOM
2. Concept and application
2.1 Concept of a natural capital stress testFollowing the 2008 financial crisis, the Bank of England recommended that regular stress testing of the UKbanking system should be undertaken to assess the system's ability to withstand shocks. In this context, thepotential impacts of possible future economic events (including financial crises etc.) on the solvency ofindividual financial institutions are assessed as a way to highlight the potential scale of future shocks andidentify key problem areas, as well as to inform remedial actions to help build resilience of the sector. TheBank of England defines its stress testing approach as follows:
“A stress test examines the potential impact of a hypothetical adverse scenario on the health of the bankingsystem and individual institutions within it. It allows policymakers to assess banks’ resilience to a range ofadverse shocks and ensure they are adequately capitalised, not just to withstand those shocks, but also tosupport the real economy if a stress does materialise.”23
The concept of a stress testing approach is therefore essentially a scenario analysis exercise in which variousimpacts associated with one or more future scenarios are assessed. The analysis involves testing a plausiblebut relatively extreme adverse scenario, with the intention of testing the resilience of a system. The scenariosin stress testing can cover ongoing stresses to particular assets (e.g. increases in the spread of pests anddiseases in the case of natural capital stress testing) as well as particular shock events (e.g. droughts andwater shortages).
The aim of this project was to apply this concept to provide the UK Government with a new approach to helpinform policy making. It is proposed that an NCST could form part of the Government’s policy ‘toolkit’; beingused to systematically track emerging environmental risk ‘hot spots’ in the economy and pinpoint whichbusiness sectors are most at risk and why. This approach could help to identify the need for policy responsesand to prioritise areas of need although could not be used to inform the design of specific policy interventions.In addition to use by the UK Government, the NCST approach could also be useful for businesses as they areamong the main stakeholders who are at risk from natural capital change.
2.2 Potential applicationsGiven the potentially broad scope of an NCST, there is an equally broad range of potential policy applicationsand decisions which could be supported through its use. This section provides an overview of some of the keypolicy questions which could be addressed through the use of an NCST approach:
· What risks do particular natural capital shocks and stresses (either domestic or international) pose tothe UK economy as measured by key macroeconomic indicators (e.g. GDP, productivity, jobs, andinflation)?
· Which economic sectors are likely to be most at risk from these natural capital shocks and stresses?
23 Bank of England (2015). The Bank of England’s approach to stress testing the UK banking system

AECOM 15
· To what extent might different regions of the UK be at risk from natural capital shocks and stresses?
· How do natural capital shocks and stresses from domestic sources compare to international sourcesin terms of the risks they pose to the UK economy?
· Which of the potential natural capital shocks and stresses pose the greatest risks to the UK economy,and might therefore require intervention?
· Which of the potential natural capital shocks and stresses pose the greatest risks to particular UKeconomic sectors (e.g. manufacturing, food/beverages, or agriculture)?
· What is the specific level of risk exposure to natural capital shocks and stresses for particular UKeconomic sectors?
· What is the potential for longer term changes in the resilience of the UK economy due to naturalcapital shocks and stresses?
· How do the risks associated with different natural capital shocks and stresses change over time e.g.which are most pressing over the short term and which may be more significant over the longer term?
Ultimately, an NCST should be able to address each of these policy questions. While the approach developedin this project goes some way to being able to provide answers to the first four questions, there is further workto be done before it can be applied more widely and comprehensively. This includes, for example, extendingthe economic model to cover a wider range of natural capital and ecosystem service impacts and addressingsome of the limitations that became apparent through the process of piloting the approach (see Section 6).
Further, for the purposes of this project risk was defined in terms of the magnitude of an impact multiplied bythe likelihood of it occurring. Drawing on the financial stress test approach, this project did not explicitlyconsider the likelihood of particular events or impacts occurring, but rather looked at the magnitude of theimpacts should they occur. As such, the term ‘risk’ is not applicable to the NCST approach developed in thisproject. Risks could be evaluated using this approach in future, although further work would be needed toquantify the likelihood of potential impacts occurring.
In assessing the potential uses for an NCST, it is also important to consider the potential users of theapproach. A preliminary list of potential users was collated at the start of the project in order to better identifytheir anticipated needs and steer the development process accordingly. The list of potential users wasinformed by interviews, workshops, and a review of UK Government decision-making processes. The resultsare summarised in Table 4. The approach was not designed with one single user group in mind; rather, it triedto address a range of anticipated uses and requirements in order to demonstrate proof of concept. Futureiterations of an NCST approach could incorporate the specific requirements of different users.
Table 4. Potential users of an NCST
Potential usergroup
Information generated by an NCST thatcould be of interest to user group
Decision-making in which this informationcould be of use
Public sector
HM Treasury Potential macroeconomic impacts of ecosystemservice changes, in particular the impacts onGDP, productivity, inflation, and employment(at the economy-wide and sectoral-level), andthe impacts on the UK as an investmentprospect
Supporting annual budgetary decision-makinge.g. informing budgetary allocations andmeasures as well as Spending Reviews andComprehensive Spending Reviews
Department forHealth
Impact on healthcare costs across all of society Supporting decision-making and budgetallocations around preparation for natural

16 AECOM
Potential usergroup
Information generated by an NCST thatcould be of interest to user group
Decision-making in which this informationcould be of use
capital related public health challenges andestimating the potential costs of such impacts
Department forBusiness, Energy &Industrial Strategy
Impacts on productivity, growth, andinfrastructure across all sectors and thestrategic consequences of anticipated impacts
Informing the UK national infrastructure planand industrial strategy e.g. identifying thecontribution of natural capital to productivity /growth and mitigating risks
Local EnterprisePartnerships
Local spatially disaggregated impacts across allsectors and areas
Identifying risks to the growth of localeconomies and local employment anddeveloping local growth strategies which takeinto account resilience of natural capital stocks
Cabinet Office Food and resource supply security, andresilience to international changes in naturalcapital
Updating the UK National Risk Register toaccount for environmental change andinforming mitigation planning decisions
Defra Impacts of changes in ecosystem serviceprovision on different sectors (particularlyfarming, the environment, and rural economies)and areas where market failures may requirepolicy intervention
Identifying areas where market failures mightrequire intervention and identifying prioritymetrics for monitoring natural capital (includingwith respect to economic impacts)
Environment Agency Flood impacts at a national and regional scale Supporting decision-making relating to crisispreparation and undertaking national level riskassessments which incorporate the economicimpacts of flood events
Foreign &CommonwealthOffice
International natural capital impacts anddependencies, their trade implications, andinternational relations/conflict risk identification
Informing the formulation of internationaleconomic, trade, security, and environmentalpolicies
NationalInfrastructureCommission
Impacts on national infrastructure andresilience of UK infrastructure to environmentalchange
Understanding the level of resilience of nationalinfrastructure schemes to future natural capitalrisks
Private sector
UK and internationalbusiness
Sector or supply chain- specific impacts Identifying key vulnerabilities in cross-sectoralsupply chains and developing more resilientsupply chains
2.3 Key issues considered during developmentGiven this overview of the concept and applications of an NCST, there were a number of issues that wereconsidered in developing and piloting the approach. An overview of some of the key issues, and how theywere tackled, is set out below:
· Type of natural capital considered – natural capital provides both ecosystem services (e.g. timber,food, clean air) and abiotic services (e.g. minerals and fossil fuels). Given that the relationshipbetween the extraction and use of minerals and fossil fuels and the UK economy is already wellunderstood and reflected in the national Environmental Accounts, the focus of this project was onecosystem services. Three ecosystem services in particular – crops and livestock, water supply, andflood regulation – were selected for the purposes of piloting the NCST approach. The rationale forfocusing on these three services is set out in Section 5 and in Appendix A.

AECOM 17
· Impacts and dependencies – assessments undertaken at a company or organisational level typicallydistinguish between the impacts the body has on natural capital and the extent to which it depends onnatural capital for its continued operation (see the Natural Capital Protocol24). For this project, theresults of the NCST focused on highlighting the dependence of the UK economy on natural capital,with impacts on natural capital from a range of sources captured as part of the scenario to be tested.
· International vs. domestic dimension – the UK economy is exposed to a range of impacts resultingfrom domestic changes in natural capital (e.g. a national drought event leading to changes in UKmanufacturing output) and international changes (e.g. a global pest outbreak leading to a reduction inagricultural outputs and corresponding changes in international food prices). Both international anddomestic impacts are included within the NCST approach developed for this project. However, for twoof the services piloted (water supply and flood regulation) there were no international impactsidentified that were considered likely to lead to changes in UK service provision. As a result, the focusof the NCST for these two services was on the impacts of a domestic change in natural capital on thedomestic economy (environment-to-economy effects). By contrast, for the crops and livestock service,the international dimension was captured under the assumption that the kinds of effects that mightaffect this service would simultaneously occur abroad. This was captured through an economy-to-economy effect i.e. a change in natural capital in the rest of the world has economic effects in the restof the world, and those economic effects are transmitted to the UK by trade linkages for the productsproduced elsewhere that are most affected by the impact.
· Chronic vs. acute impacts – the aim of this project was to capture the impacts of both natural capitalshocks and stresses. In light of this, the NCST approach included separate calculations for both acuteevents (i.e. short-term, often severe changes in services such as flood events) and chronic events(i.e. long-term incremental changes in service provision such as declines in soil productivity).
· Resilience – in addition to direct impacts (such as a reduction in crop output due to an ongoingdecline in soil productivity), chronic changes in natural capital could have indirect effects in terms ofmaking the UK economy less resilient to acute events in future. For example, an ongoing reduction inwater availability over time could make certain economic sectors more vulnerable to acute droughtevents. This issue of resilience was explored to some extent in the pilot NCST (through the watersupply service) although could be investigated further in future studies.
· Development of the stress test scenario – in order to pilot the NCST approach developed in thisproject, a scenario describing a possible natural capital future in 2050 was formulated. The narrativefor the scenario was structured around the direct drivers of natural capital change identified in theUKNEA. The projected changes in natural capital and ecosystem services were then expressedthrough a series of quantified variables. The scenario was based on a review of the literature andaimed to represent a plausible but extreme adverse future. As noted above, the scenario focused onchanges in UK natural capital with international impacts transmitted through economy-to-economylinkages (e.g. import prices).
· Qualitative vs. quantitative assessments – the focus of this project was on developing an approachwhich could provide quantitative estimates of the impact of changes in natural capital on the UKeconomy. In future, a qualitative approach could be developed alongside this approach which drawson the outputs of the quantitative model to provide indicators of the scale of potential impacts onparticular economic sectors. This approach could, for example, employ a red, amber, green scoringsystem to communicate the potential impacts on the UK economy from natural capital change. Thiscould in turn be used to identify where further assessment may best be focused.
24 Natural Capital Coalition (2016) Natural Capital Protocol [online] http://naturalcapitalcoalition.org/protocol/

18 AECOM
· Impact metrics – ideally, the scale of the impacts should be expressed using metrics that are alreadyfamiliar to the intended users or target audience, and that are comparable to or compatible with themetrics used by other forms of environmental or economic assessments. In light of this, the projecthas focused on presenting the results in terms of standard macroeconomic metrics such as grossdomestic product (GDP), gross value added (GVA), employment, and prices.
· Time horizons – as set out above, the scenario used to pilot the NCST approach used a time horizonof 2050. Future projects could look at alternative time horizons to identify and compare the extent ofshort, medium, and long term impacts.
· Discounting – the scenario used to pilot the NCST approach looked at the impacts of natural capitalshocks and stresses in a particular year (2050). As a result, the economic model did not look at theflow of values over time and there was no discounting of impacts.
· Spatial distribution of impacts – the pilot NCST focused on quantifying the impact of natural capitalshocks and stresses on the UK economy as a whole so impacts were not spatially disaggregated on aregional basis. However, a supplementary analysis was included which looked at the potentialregional impacts in order to illustrate how this approach could be undertaken in future projects.
· Sectoral impacts – the pilot NCST analysed the impacts associated with changes in the provision ofthree ecosystem services. Two of these (crops and livestock, and water supply) are examples ofprovisioning services, which generate flows of resources that can be used productively in theeconomy. Other products are derived from those resources and feed through supply chains toproduce final goods and services. Scenarios that consider provisioning services are thereforeinherently scenarios of sectoral dependency and impact. By contrast, the third service (floodregulation) is a regulating service which has a different impact pathway through the economy. Thepilot NCST applied a model developed specifically for this project to show one way (but only one way)that the sectoral impacts might be analysed for this regulating service.
· Aggregation of impacts – the NCST approach developed for this project was designed to addressthe cumulative impacts or combined effects on the UK economy arising from multiple natural capitalshocks and stresses occurring over the same time period. In light of this, the estimates of change inservice provision were based on aggregates of a range of natural capital changes impacting on eachof the three services (e.g. estimating the combined change in crop output based on changes inprecipitation, land use, and crop diseases etc.), although data limitations meant that aggregation of allpotential impacts was not possible. It was intended that the impacts on each ecosystem service wouldthen be aggregated to estimate the combined effects on the UK economy; however, due to thedifferent types of modelling approaches required for each service, the uncertainties involved wereconsidered too large to reasonably allow for an aggregate estimate of the total impact to bepresented.
· Selection and application of appropriate approaches and models – while, for the purposes of thepilot NCST, an economic model was developed specifically for the analysis of the ecosystem servicesconsidered, this is by no means the only quantitative assessment approach available. The modeldeveloped for this project embodied specific assumptions that have a bearing on the final results.There are a range of techniques that could be applied to a stress test and each has its own strengthsand weaknesses. Moreover, different scenarios and ecosystem services pose different challengesand questions in a stress test. Later sections of this report emphasise the importance of selectingtools that are fit for particular purposes, rather than trying to apply a single approach in all cases. Inthe future, a full NCST would benefit from an inventory of approaches and models to aid selection ofthe best approach.

AECOM 19
3. Approach to conducting a stress test
3.1 OverviewIn order to provide an overview of how an NCST could be used by Government or other users, a preliminaryapproach to conducting an NCST was developed as summarised in Figure 1. Further details on each of thesteps involved are set out in the sections that follow. It is important to note that this is a preliminary approachwhich will require further development and refinement over time in order to make sure the approach is usefuland practical for decision makers.
Figure 1. Outline approach to conducting an NCST
3.2 Methodology
Step 1. Determine the scope of the stress test
Aim
It is proposed that the first step of an NCST should be to define the scope of the stress test and the specificquestions to be addressed. Given that an NCST can be a complex and resource intensive undertaking, ascoping process can help to prioritise work on those sectors and services deemed to be of most interest, atgreatest risk, or where the impacts are likely to be most significant. Ultimately, the purpose of the scoping stepis to focus the user’s effort and available resources on the natural capital impacts that are most material to theUK economy.
Approach
A preliminary approach to determining the scope of an NCST is set out as follows:
· Economic sector review – qualitatively assess the dependency of each economic sector on a rangeof ecosystem services in order to identify the services which are of most importance to the economy.This could be done using the Economic Sector Review matrix developed for this project which

20 AECOM
provides a list of economic sectors (UK Standard Industrial Classification of Economic Activities200725) that are scored against a list of ecosystem services (CICES Version 4.326) using a three-pointscale (High, Medium, Low). In this matrix the strength of the sector-service interaction is assessedaccording to the extent to which a change in the supply of one or more ecosystem services mightcause significant impacts (positive or negative) on one or more economic sectors. The matrixpopulated as part of the pilot exercise in this project could provide a basis for future scoping exercisesalthough it should be updated periodically to capture changes in natural capital or the UK economyover time.
· Ecosystem service prioritisation – build on the economic sector review above to assess the list ofecosystem services against a wider range of criteria in order to identify a priority list of services to beincluded within the NCST. This could be done using the Ecosystem Service Prioritisation matrixdeveloped for this project which sets out a range of criteria for prioritising services for inclusion. Asabove, the values within the matrix populated as part of this project could be reviewed and revised toallow the scoping process to reflect the needs of the user.
Useful resources
· Common International Classification of Ecosystem Services (CICES) (2016), ‘CICES Version 4.3’.
· Companies House (2007), ‘Standard industrial classification of economic activities (SIC) 2007’.
· Economic Sector Review matrix (see Appendix B and Excel workbook which is available separately).
· Ecosystem Service Prioritisation matrix (see Appendix B and Excel workbook which is availableseparately).
· Natural Capital Committee (ongoing), ‘State of natural capital’ reports.
· UKNEA-FO (2014) ‘Work Package Report 2: Macroeconomic implications of ecosystem servicechange and management: A scoping study’.
Step 2. Formulate stress test scenario
Aim
Once the scope of the stress test has been determined, it is proposed that the next step should be toformulate the scenario to be tested. The Bank of England defines the scenarios used for financial stresstesting as follows:
“The stress scenarios incorporated in the Bank’s concurrent stress tests are not forecasts. Rather, they arecoherent ‘tail-risk’ scenarios designed to be severe and broad enough to assess the resilience of UK banks toadverse shocks, which can occur even when risks are not elevated.”27
As such, the scenario should aim to describe a possible future in which a range of natural capital shocks andstresses occur. The scenarios used in stress testing are not, therefore, probabilistic predictions of what islikely to happen, but are, instead, descriptions of a series of adverse shocks and stresses which could occur.
25 Available to download at: https://www.gov.uk/Government/publications/standard-industrial-classification-of-economic-activities-sic26 Available to download at: http://cices.eu/27 Bank of England (2016), ‘Stress testing the UK banking system: key elements of the 2016 stress test’.

AECOM 21
Approach
A preliminary approach to formulating a scenario is set out as follows:
· Select the time horizon for the assessment – when selecting an appropriate time horizon, it isimportant to bear in mind the purpose for which the stress test is being applied as there are potentialtrade-offs between the use of shorter and longer term horizons. A five year time horizon may, forexample, feed into investment planning cycles although it may fail to identify natural capital stresseswhich build up over longer time periods, such as changes in the global climate system.
· Identify the key drivers of change around which the scenario is to be built – the UKNEAidentified five direct drivers of ecosystem change which provide a useful framework for constructingscenarios for natural capital stress testing: invasive species; climate change; habitat change; nutrientenrichment and pollution; and overexploitation of resources.
· Prepare a narrative (storyline) to describe the projections for drivers of change within theselected timescale – the scenario narrative can be developed based on a review of the literature orthrough a group workshop discussion where users can identify the issues of most interest and the‘what if’ questions that they would like the stress test to answer. Involvement of users can also help toestablish credibility and legitimacy, as well as the saliency of the storylines that are developed.28 Thescenario should be conceivable or plausible (i.e. have a reasonable probability of actually occurring)in order that it is seen as credible, yet sufficiently extreme (in the ‘tail’ of the probability distribution)such that it tests the resilience of the system. When developing the scenario narrative it is alsoimportant to be clear about the extent to which behavioural responses (adaptation) are built in(particularly over longer time horizons) and how influences outside the UK may drive changes in thecondition and extent of the UK’s natural capital stocks.
Useful resources
· Beddington (2012), ‘Food, energy, water and the climate: A perfect storm of global events?’.
· Cabinet Office (2015), ‘National Risk Register for civil emergencies - 2015 edition’.
· Committee on Climate Change (2017), ‘Climate change risk assessment 2017’.
· Environment Agency (2006), ‘Environment Agency scenarios 2030’.
· Environment Agency and Natural Resources Wales (2013), ‘Current and future water availability –addendum. A refresh of the Case for Change analysis’.
· Foresight Land Use Futures Project (2010), ‘Final project report’.
· Lloyds (2015), ‘Food system shock: The insurance impacts of acute disruption to global food supply’.
· McKenzie & Rosenthal (2012), ‘Developing scenarios to assess ecosystem service tradeoffs:Guidance and case studies for InVEST users’.
· UKNEA (2011), ‘Chapter 25 scenarios: Development of storylines and analysis of outcomes’.
28 Rounsevell, M. & Metzger, M. (2010) Developing qualitative scenario storylines for environmental change assessment. WileyInterdisciplinary Reviews: Climate Change, 1(4), 606–619.

22 AECOM
Step 3. Identify and quantify impacts on ecosystem services
Aim
Once the scenario narrative is set out, it is proposed that the next step should be to map out the pathwaysthough which these drivers could impact on ecosystem services and to quantify the extent of change in aformat which can be input into the economic model. An outline of the process of linking a qualitative scenarionarrative with an economic model is set out in Figure 2. This process can also help to identify any gaps in theevidence base which may inform the specific aspects which may need further research.
Figure 2. Overview of the link between a qualitative scenario narrative and an economic model
Approach
A preliminary approach to identifying and quantifying impacts on service provision is set out as follows:
· Establish impact pathways – map out the pathways though which the high level drivers of changecould impact on natural capital, ecosystem service provision, and macroeconomic indicators in orderto identify all of the potential linkages that could be quantified in the stress test.
· Quantify changes in natural capital – populate the impact pathway by quantifying, where possible,the extent of changes in natural capital resulting from changes in the high level drivers. This is likely torequire a detailed literature review together with the use of spreadsheets to estimate the extent of anychanges. It is likely that the quantitative assessment will need to draw on a wide range of sources,each of which may apply different sets of assumptions (e.g. around population growth, rates ofclimatic change, and time horizons) in deriving estimates of the changes in natural capital. It istherefore important to be clear on how the estimates reported in the various sources have beenderived and under what assumptions, as well as to consider whether any adjustments could or shouldbe made, and the implications for analysis and interpretation of the stress test results. Given thecomplexity of bringing together multiple different sources, which draw on their own underlyingassumptions and calculations, expert review may be useful at this point.
· Quantify changes in ecosystem service provision – quantify the cumulative change in ecosystemservice provision arising from the changes in natural capital. Capturing the cumulative impacts isimportant because of the many interactions between ecosystem services, which mean that focusingon one particular service or one particular change in natural capital may underestimate the total extentof any change. For example, a scenario focused solely on modelling the impacts of a reduction inwater availability on crop output would fail to capture important natural capital interactions such as theimpact of crop pests and diseases or changes in flood events on crop output. This approach wouldalso fail to capture important cumulative effects across different services, such as the combinedimpact on the economy from a loss of crop output and a reduction in water availability for other usessuch as residential and industrial. Where possible the impacts on service provision can be drawn fromthe literature; however, in most cases additional calculations will be required to combine different datasets to generate an understanding of cumulative impacts.
High level drivers ofchange drawn e.g.
climate change
Lead to a range ofimpacts on natural
capital e.g. changes inprecipitation patterns
Which in turn lead toimpacts on
ecosystem servicese.g. lower crop output
That lead to impactson the economy and
macroeconomicindicators such as GDP

AECOM 23
Useful resources
There is a sizeable evidence base that can be used to estimate changes in natural capital and ecosystemservice provision under different scenarios. For example, the CCRA 2017 evidence base includes severalcomprehensive modelling exercises which estimate changes in water supply and flood events over a range oftime horizons (2030, 2050, and 2080). The models draw on a similar set of underlying assumptions (withrespect to rates of population growth, climate change trajectories, and levels of adaptation) which allows directcomparison and aggregation of changes in service provision.
However, one limitation with this resource is that the focus is limited to two specific services and similarresources are not available for other services such as crops and livestock. This therefore requires drawing onadditional studies which use different sets of assumptions which, as noted above, can introduce uncertaintyinto any estimate of aggregate impacts.
Step 4. Identify and value economic impacts
Aim
Having developed the scenario of changes in ecosystem service provision in the earlier steps, it is proposedthat the final part of the stress test should seek to understand the implications for the economy. This willusually involve quantitative analysis to gauge the impacts and, if relevant and possible, their distributionacross different sectors and regions etc.
The availability and quality of the data and evidence will vary greatly by scenario and ecosystem service. Thisshould be borne in mind when applying particular techniques or models. Improper application may lead tofalse confidence in the precision of any results (in the face of uncertainty) or misinterpretation of the results(which may hinge on particular assumptions). The selection of techniques and models matters and there is nosingle approach or model that can be universally applied: different approaches fit different situations. For thestress test, quantitative analysis is therefore a pragmatic exercise to explore the potential economicimplications of a scenario and gauge the level of exposure to trends/changes in natural capital and ecosystemservices. Careful synthesis and interpretation are crucial, and complexity is not always a virtue.
As a formal approach to impact analysis, this step may help to highlight areas of uncertainty as well as gaps inboth the evidence base and the existing inventory of techniques/models. In this way, the results from a stresstest can also highlight priorities for future research.
Approach
A preliminary approach to identifying and valuing economic impacts is set out as follows:
· Identification and quantification of the direct economic impacts – having quantified the impactson ecosystem services, it is necessary to translate those impacts into their economic equivalents. Thisinvolves an identification of the entry points for ecosystem services into the economy and an exerciseto map those impacts to the economic data. The categorisation of ecosystem services (intoprovisioning, regulating, and cultural services) can guide this process (see Section 4). For example, achange in a provisioning ecosystem service such as crops represents a reduction in crop output. Thisreduces the (potential) level of production in the agriculture industry. However, because the definitionof the agriculture industry in the economic data is wider than just crops, the value of the directeconomic impact may need to account for crops’ share of the industry’s total output (if the originalecosystem service assumption was specified as a percentage, for example). Other steps here mightinclude conversions to or from real terms etc.

24 AECOM
· Identification of transmission mechanisms through the economy – it is the transmissionmechanisms that give rise to indirect (‘knock-on’) effects. The analyst should specify the linkages (ifany) that might lead to impacts elsewhere in the economy. This is largely a question ofinterdependency. Using the crops example from before, this step would involve an identification ofwhich industries depend on agricultural output; here, mostly food manufacturing.
· Identification of likely behavioural responses – agents often alter their behaviour as responses tochange. Households might switch to other sources of goods and services or reduce theirconsumption. Firms might also substitute, or raise prices, or find other ways to economise on inputs.An assessment of the possible behavioural responses provides a list of actions that could mitigate oramplify certain effects.
· Selection and application of quantitative techniques – the previous steps define the economiclogic of the scenario. It is here that the analyst operationalises the economic framework by applyingone or more techniques or models. The availability and suitability of data and tools will vary byscenario and ecosystem service. Because of this, there is unlikely to be one single approach that isapplicable to all cases. Moreover, the analysis of the economic impacts of ecosystem-service changeis still a relatively unexplored area of research. Particular tools might only capture limited aspects of aparticular problem. There may be cases where a combination of approaches is required. It is at thisstage that the analyst must make an informed judgment as to which approaches would be mostappropriate and whether there are any substantial sources of uncertainty in the results.
· Assessment of sensitivity to key assumptions (if applicable/possible) – sensitivity analysis(varying key input assumptions and examining the change in the results) helps to identify which inputsmost affect the final outcome. In cases where uncertainty is high, it can also help to bound the resultsin a way that helps to establish the order of magnitude, even if no numerical result can be consideredindividually robust.
· Synthesis and interpretation of the final results – having completed the analysis for one or moreecosystem services, the final part of the stress test is to draw conclusions (including limitations) fromthe individual assessments and, if appropriate, aggregate those results.
Useful resources
It is difficult to recommend any specific approaches or models because much depends on the scenario andecosystem service under investigation. The quantitative assessment requires judgment as to which tools aremost appropriate. Instead, Section 4 provides some guidance as to the kind of economic logic that might needto be considered and reflected in a credible approach.
In addition to ensuring a plausible set of direct impacts (which follows from the scenario design), channels forindirect impacts, and behavioural responses, Section 4 also emphasises the importance of a level of detailthat is appropriate (detailed enough) for the ecosystem service. This is applicable to both economic data (e.g.by industry and/or region) and environmental/physical data (e.g. to identify the spatial distribution of waterresources or assets exposed to flooding events).
In terms of economic data, the most important UK source is the ONS which publishes disaggregated industrialdata (such as input-output tables). Any credible analysis would need to use or be consistent with such data.
There are a wide range of models available that could be applied to an assessment. These have differingstrengths and weaknesses and are therefore fit for different purposes. A suitable level of detail is critical (asabove) but so are the assumptions that underpin these models. In the absence of a suitable existingapproach/model, options range from a synthesis of existing research (possibly to establish simple rules ofthumb to apply to the assessment) to the development of new approaches and models. Where modellingmight be costly to do, or where much analysis has already been done (such as in climate change research),synthesis of existing evidence may well represent the best use of resources.

AECOM 25
4. Analysing the economic impacts ofecosystem service change
4.1 OverviewEcosystem services are diverse in the range of goods and benefits they provide, including their economicgoods and benefits. Because of this diversity, changes in different ecosystem services can have very differentimpacts. Consequently, an assessment approach that is appropriate for one service may not be appropriatefor another. The problem of variation in effects is compounded by differences in the availability and quality ofthe evidence across services. For some ecosystem services, the evidence base and data may be too limitedto support sophisticated analysis. Consequently, there is unlikely to be one approach or model that can beapplied to assess the economic impact of a change in any ecosystem service.
Different approaches will be suited to different applications and combinations of approaches may be required.It would be inadvisable to depend on (or advocate) a single approach or model as being applicable in everycase. In this light, quantitative assessments in the stress test should be understood as pragmatic exercises togauge the level of sectoral exposure to changes in natural capital and, in turn, ecosystem services. This isentirely compatible with the idea and motivation of a stress test but the user should appreciate the uncertaintythat comes with quantitative analyses of this type.
These concerns aside, a quantitative approach has the advantage of requiring a formal framework withinwhich to assess the impacts of ecosystem service change. This process forces the analyst to be explicit in therelationships captured by their approach and in the assumptions that underpin the analysis. Such frameworkscan be scrutinised and tested.
Given the diversity of ecosystem services, the analytical approaches in a stress test must fit, as far aspossible, the circumstances of the individual ecosystem services. These circumstances include:
· The narrative of the scenario itself, and the evidence to support it.
· The availability of data/evidence to inform and specify the changes in ecosystem services. Thisincludes any uncertainty about these changes.
· The translation of changes in ecosystem services into their corresponding concepts in economicstatistics.
· Assumptions about the scope for, and likely, behavioural responses. These could either mitigate oramplify the impacts.
· The level of uncertainty that arises and compounds from the above, affecting the level of confidencewith which the final results can be interpreted.
Given the uncertainty at various points in the evidence collection and analysis, and the diversity of ecosystemservices, it is particularly difficult to be prescriptive about the economic assessment approach.
Section 4.2 sets out various considerations when designing an economic impact analysis. It first justifies thefocus of the stress test on observable macroeconomic indicators, rather than other work that seeks to attachvalues to the benefits of ecosystem services. The section then goes on to explain the broad logic by whichchanges in ecosystem services lead to economic impacts. This covers the sources of impact and thetransmission and feedback mechanisms that might operate to determine the overall impacts. In this way, the

26 AECOM
section provides a way of thinking about the sources of exposure to natural capital degradation.
Section 4.3 then elaborates on the economic impacts that might be most relevant for each of the threecategories of ecosystem service. The section ends by emphasising the importance of using data at a sufficientlevel of detail to conduct a credible assessment.
Finally, Section 4.4 focuses on including industrial disaggregation in the assessment if supply chains mightmatter and argues that some ecosystem services can only be adequately assessed in spatial terms. In thisway, the section provides some high-level guidance on what might make for a credible and sufficientlycomprehensive piece of economic analysis.
4.2 Focus of the stress testThe stress test developed in this project emphasises the impact on observable macroeconomic indicators.This sets it apart from other work that has tried to understand the economic implications of changes in naturalcapital as if those costs (externalities) were priced in. An approach that uses observable indicators seemsmore relevant to a stress test because it explores what could happen in the event of a change in ecosystemservices. Such an approach can highlight how large the changes in economic activity and jobs might be, andthe distribution of those impacts across the economy. The stress test plays out a scenario and makes anassessment in terms of potential (observable) economic damage.
In contrast, an externality-pricing approach asks ‘by how much are ecosystem services undervalued inmonetary terms?’. Such an approach has something to say about the value of ecosystem services. However,what it highlights is the extent of the benefits that people enjoy without necessarily having to pay for them(financially). It sheds light on the value of natural capital but does not so clearly highlight the economicconsequences of natural capital degradation. It is those consequences that are of relevance in a stress testand which provide the justification for the approach set out here.
Of course, by narrowing the stress test to observable economic indicators, the approach adopts a similarlynarrow view of the value of ecosystem services, albeit a view that is still relatively unexplored in existingresearch. A stress test that focuses on these indicators will necessarily only capture part of the fullcontribution of ecosystem services to human wellbeing. The aim of an economic assessment along the linesset out in Section 3 is to recognise the dependence of the economy on largely unpriced ecosystem services,and not to attempt to address wider impacts on wellbeing. This deliberately limited scope should not beinterpreted as a judgement about which impacts are most important: rather, this analysis simply representsone part of the picture.
4.3 Understanding the economic impacts of changes inecosystem servicesFigure 3 sets out the broad effects that any economic assessment of changes in ecosystem services mustcapture. The diagram shows how:
· Changes in ecosystem services alter the flow of benefits into the economic system, identifying thecross-over from the natural environment domain (the source of ecosystem services) to the economydomain.

AECOM 27
· Changes in the flows of benefits directly affect specific parts of the economy through their impacts onone or more sources of economic value. Broadly, these sources can be categorised as: inputs toproduction; regulation/maintenance of productive assets; and sources of intrinsic/intangible value.29
Sectors that benefit directly in any of these ways are the entry points for ecosystem services into theeconomic system. As discussed earlier, a focus on observable macroeconomic indicators leaves thelast of these broad ecosystem service categories (relating to intrinsic/intangible value) largely outsidethe scope of the stress test developed here.
Economic impacts are not necessarily confined to particular industries or sectors at the interface between thenatural environment and the economy. Because of supply-chain dependencies and income/expenditureeffects, impacts in one sector may be transmitted through the wider economy. It is by this mechanism, forexample, that a reduction in water supply (which reduces output of the water industry) can constrain output inmanufacturing industries that produce food and drink. In turn, the hospitality industry might see a consequentreduction in (domestic) supply. Lower output in all these sectors will tend to lower employment and incomes.Because of these interactions, a narrow assessment of only the direct impacts will fail to capture the widereconomic effects and system vulnerabilities of a change in ecosystem services.
Figure 3. How changes in ecosystem services lead to economic impacts
The labels on the left-hand side of Figure 3 distinguish between the two sources of economic impact from achange in ecosystem services:
· The pattern of shocks in ecosystem services.
· The socio-economic structure of the economy.
The first of these concerns the way in which natural capital degradation might lead to more or larger shocks toecosystem services; that is, a change in the pattern of the shocks that originate in the natural environment.Examples of this include an increase in the severity of a drought or a change in the frequency (likelihood) of aflood. These represent changes in the flow of benefits from the ecosystem services. Analyses of these kindsof shocks focus on the economic impacts of changes in natural capital; a failure to maintain or preservenatural capital generates larger environmental impacts that are transmitted to the economy. The economy istherefore more exposed to external (environmental) shocks and trends.
29 These correspond to the three categories of ecosystem services.

28 AECOM
The second is about the structure of the economy itself and how this increases or reduces vulnerability toeconomic impacts that arise from a given change in an ecosystem service. Factors here include populationgrowth in water-stressed areas and urbanisation. In both cases, these trends increase the population thatwould be affected by a water shortage or a reduction in air quality. Similarly, a less resource-efficient (or moreresource-dependent) economy would be more affected by a disruption to its natural capital. An economy thatis more reliant on imports is more vulnerable to impacts in the rest of the world, while an economy that is morereliant on domestic resources would be more vulnerable to events that affect a substantial part of nationalproduction.
This point about import dependency touches on the wider issue of international sources of economic impacts.One way to think about the international dimension is to imagine a system as depicted in Figure 3, but foreach country. The question is then how impacts in one country might cross over into another. In most cases,the transmission mechanism is likely to take the form of an economy-to-economy interaction. By this channel,a change in natural capital abroad leads to an economic impact abroad. It is that economic impact that feedsinto the UK economy, via trade. In many cases, it is therefore probably sufficient to analyse internationaleffects as the economic consequences for the UK of economic effects abroad. This does not mean that thereshould be no work to understand the effects of foreign natural capital (this is necessary to develop a crediblescenario) but that the quantitative problem during the economic assessment part of the stress test could bereduced to an economy-to-economy modelling issue.
4.4 Different types of ecosystem serviceThere are many ways in which natural capital can provide benefits (ecosystem services) to people. The latestversion of the European Environment Agency’s Common International Classification of Ecosystem Services(CICES) groups these services into three broad categories (‘Sections’).30 These categories yield quitedifferent forms of economic value. For each of these categories, Table 5 lists example ecosystem services,along with a description of the type of value the service brings to the economy, and how the depletion ordegradation of the underlying natural capital assets affects that economic value.
Table 5. Sources of economic value from ecosystem services
Category Examples Source of economic value Direct implications of depletion /degradation
Provisioning - Crops and livestock
- Fisheries
- Water supply
- Timber
- Inputs toproduction/directconsumption
- Lower/costlier production
Regulation andmaintenance
- Air quality regulation
- Flood regulation
- Global climate regulation
- Maintenance/protectionof human and physicalassets
- Impaired productive capacity
- Costs of defence/repair
- Costs of alternatives
Cultural - Recreation - Intrinsic (amenity) value - Lost welfare/wellbeing
- Costs of maintenance/repair
30 European Environment Agency (2013), ‘Common International Classification of Ecosystem Services’, Version 4.3 (January 2013).

AECOM 29
Provisioning ecosystem services are the most straightforward to understand because the benefits enter theeconomy as physical flows e.g. agricultural products and water. These services also represent resources foruse in the production process. It is comparatively straightforward to establish the direct value of these servicesbecause agents (farmers, water companies etc.) incur costs to extract/harvest the resources and sell them onto other producers or consumers. These services therefore have a market value, although this does notnecessarily represent the ‘full’ value of the services. For example, extraction activities often generateexternalities (such as pollution) but such costs are not always borne by the extractors unless there has been aspecific intervention that internalises these costs (such as carbon pricing or environmental regulation).
As a flow of services that crosses the boundary between the natural environment and the economy, changesin flows of these ecosystem services (or the requirements of their services) are straightforward to understandas impacts that either:
· Constrain output e.g. through reductions in farmland that limit domestic agricultural production.
· Raise extraction costs, such as the need to transport water from further afield.
In contrast to provisioning services, the benefits of regulating ecosystem services do not themselves enter theeconomy. Instead, natural capital assets that provide these benefits serve to maintain and protect otherassets, whether these are natural (pest/disease control, pollination etc.), human (health), or physical (‘fixed’capital, such as buildings, machinery and infrastructure). Degradation of the underlying natural capital haseconomic impacts because it generates higher costs, usually by requiring an economic response. An exampleof this is flood regulation. In the absence of (existing) natural flood protection, the alternatives are:
· Invest actively in flood prevention such as planting trees and vegetation to slow water flows.
· Construct defences to protect against future flooding.
· Accept the damage to assets (which may well impair future economic activities) and, possibly, incurfurther costs of repair, replacement, or remediation.
In other cases, degradation may generate a requirement for an (artificial) alternative like pesticides orfertilisers, also at a cost.
One issue to be aware of with this category of ecosystem service is that any response to degradation comesat a cost to fund that response. This matters because, except for complete inaction, a response alters thegrowth path of the economy. If the economy is operating at full capacity (i.e. there are no further resourcesthat can be mobilised), then resources will be diverted from other activities. This will not necessarily changeGDP in the short run, but could alter the distribution of income. If resources are diverted from investment innew productive capacity, the long-run growth rate may be reduced. If the economy is operating far from fullcapacity, the alternatives above would generate more economic activity and raise GDP.31 Flood defencesrequire more construction activity and therefore support more jobs and higher income. What is missing from aGDP-only assessment is the damage to the underlying assets (in effect, the impact on the balance sheet ofthe economy) and the consequent reduction in productive capacity. For the purposes of a stress test, anychange in economic activity arising from mitigation or adaptation activities should be interpreted as a ‘cost’ inthe sense that it is compensating for the consequences of natural capital degradation.
What is also missing from a GDO-only assessment is any comparison with a counterfactual case in which,say, early action (at some cost): avoids the cost of accumulated damage, or, alternatively, finances to address
31 The result has simply been to ‘marketise’ a service previously provided by the natural environment.

30 AECOM
the consequences of degradation are diverted from other activities. In the extreme, this may also result insubstantial pressure on other aspect of the economic system (such as insurance, to cover the cost of lossesand finance to pay for new investment). By putting such pressure on these systems, natural capital stress mayin turn stress other systems (such as financial buffers). In this respect, it is important to bear in mind that theimpacts of changes in regulating ecosystem services often represent a problem of hidden or opportunity cost.As with the GDP impacts of repair and reconstruction, it may be sufficient to understand the impacts as being(marketised) costs, rather than attempt to construct a full counterfactual. That said, an analysis of the costs of(in)action would be a worthwhile future goal, in the same way as has been carried out previously for climatechange. Different approaches may be able to handle this in different ways. It remains an open question as towhether this should be captured in an NCST or if it is best dealt with in existing financial stress tests. The twoare not mutually exclusive, however.
The final CICES category concerns cultural ecosystem services. These services typically include significant‘non-use’ values. This poses some difficulties for valuation because there are typically no market transactionsinvolved and, moreover, some of the benefits may come from the continued presence of the asset, even ifsome people do not use them.32 Methods to establish the value of such services may focus on estimatingpeople’s ‘willingness to pay’ for a benefit or, conversely, their ‘willingness to accept’ (how much they wouldneed to be compensated for the loss of a good or service).
This third category does have some bearing on production and conventional macroeconomic aggregates, forexample, through benefits to human health and in supporting the tourism industry, and these effects could beanalysed using the approach developed in this report. However, since much of the value is embedded in theamenity, the service itself is not a directly observable macroeconomic benefit and is difficult to value. This pilotproject did not attempt an analysis of any cultural ecosystem services. Further research would be needed todevelop an appropriate quantitative approach.
4.5 Data requirements and the appropriate level of detailAs mentioned in the previous section, it is difficult to be prescriptive about the precise approach or model thatshould be used because of the diversity of ecosystem services.
That said, the clearest requirement of any economic analysis of ecosystem services is a sufficient level ofdetail to represent the most salient effects. That level of detail may well be high because the benefits ofecosystem services tend to be specific and there are usually few, if any, substitutes. For example, certainly forthe first two categories of ecosystem service (provisioning; and regulating), interdependencies betweenindustries are critical to understanding the transmission of economic impacts. This requires industrially-disaggregated data and methods that can account for the interdependencies.
Disruptions to provisioning services interrupt the flow of resources into the economy. This affects not only theindustry that acts as the conduit for resources to flow from the natural environment into the economy but alsothe industries that rely on products derived from those resources. Disruptions from changes in regulatingservices (such as hazard regulation) also interrupt resource flows but in a different way. In this case, it isbecause of damage to economic assets, which serve as delivery channels. Disruptions to these channels canhinder the production, transport, and consumption/conversion of natural and economic resources. They may
32 In addition to the value from use, UK Government guidance on appraisal and evaluation also identifies the ‘option’ and ‘existence’ valueof a good. Option value is the benefit that arises from the availability of a good i.e. the ability to use the good at a future date. Existence(or ‘bequest’) value, on the other hand, refers to the value that comes from the continued existence of something to the benefit of presentand/or future generations. For more information see HM Treasury (2003), ‘The Green Book: Appraisal and evaluation in centralGovernment’

AECOM 31
also raise the costs of operation.
For these reasons, it is unlikely that an approach that fails to capture industrial detail could reasonablyquantify the economic impacts. Approaches without this level of detail are unlikely to be suitable in isolation,although they could complement other techniques as part of a more holistic assessment.
Approaches that do capture economic structure typically incorporate an input-output table. These tables aredepictions of the transactions between industries and are central to the construction of consistent nationalaccounts. Moreover, there are well-established methods for carrying out analysis using these tables, althoughtechniques to analyse changes in demand are more developed than those to analyse changes in supply.33
More sophisticated applications of input-output models are also available.34 Such models have more detailedbehavioural responses and some even have explicit treatments of resource use in physical terms. They mayalso be able to assess impacts over time. However, these models are data-intensive and often designed to beapplicable to a wide range of economic issues. It will not necessarily be the case that the detail in thesemodels will be sufficient to capture the specificities of certain ecosystem services. Finally, these models willembody assumptions about how the economy functions that are inherent to the models’ design andunderlying economic philosophy. These assumptions must be considered carefully before the models areapplied. The consequent trade-off is between sophistication and applicability. There may also be resourceconcerns because of the level of expertise required to apply such models.
The other main data consideration in an economic assessment of ecosystem services is the level ofgeographical detail. Certain ecosystem services provide localised benefits. Some services cannot be carriedvery far, requiring economic activities to locate nearby. An example of this is water supply, for whichreductions in one area cannot easily be compensated for by a transfer from somewhere else.
Other ecosystem services, like hazard regulation, might only be relevant to a specific location. Any reasonableassessment of the impacts requires an understanding of local conditions such as the:
· Characteristics (for example the footprint) of, say, a flooding event.
· Economic structure of the area such as the number and type of the assets on a floodplain. Flooding offarmland has very different economic consequences to flooding in an area populated by offices.Similarly, the loss of connectivity from a flooded road will have very different implications if theconnection is between rural rather than urban areas.
The location-specific features of some ecosystem services make it hard to generalise some impacts to a UKlevel. A more comprehensive assessment would require spatially-disaggregated:
· Environmental data on water resources, floodplains etc.
· Economic data, to understand the kinds of economic activity that take place in different areas.
· Data on infrastructure and buildings, to identify assets like road networks and housing.
Analysis at such levels of detail does, however, come at higher cost (assuming data availability), involvingcombined economic and GIS analysis. The level of effort that goes into such exercises should beproportionate to the aims of the assessment.
33 The consequences of natural capital degradation tend to be supply restrictions.34 These include Computable General Equilibrium and macroeconometric input-output models.

32 AECOM
5. Piloting the approachThis section of the report shows how the NCST approach described in Section 3 was applied in practice in thepilot exercise. A results section then provides indicative estimates of the nature and significance of economicimpacts associated with changes in three ecosystem services: crops and livestock, water supply, and floodregulation. A series of brief case studies are also presented to illustrate how the outputs of the NCST might beanalysed and interpreted to answer specific questions of interest.
5.1 Approach to piloting
Step 1. Determine the scope of the stress test
The first step of the project was to determine the scope of the NCST to be piloted. To begin, a mappingexercise was undertaken to identify the level of ecosystem service dependence by economic sector. Once ahigh level overview of the dependence of each sector on ecosystem services had been established, the nextstep was to draw on this information to identify which services should be prioritised for developing and pilotingthe NCST approach. This was done using the matrices provided in Appendix B. Further details on themethodology used are set out in Appendix A.
On the basis of this scoping exercise, eight services were identified as making potentially significantcontributions to the UK economy. These were then subjected to further deliberative assessment, includingconsideration of practical aspects such as the availability of methods and data to support quantification of bothphysical and economic impacts. Through this process, ‘crops and livestock’, ‘water supply’ and ‘floodregulation’ were identified as the three services to be investigated further in the pilot NCST (see Table 6).
Table 6. Identifying the ecosystem services to be included in the pilot stress test
Ecosystemservice
Rationale Selected formodelling?
Crops andlivestock
High policy relevance, significant impacts on future provision, good approaches forquantification, and demonstrated impact on macroeconomy (2007/08 food price spikes) ü
Fisheries Similar type of service to ‘crops and livestock’ although more challenging to detect animpact on the wider economy and more difficult to quantify impacts on future provision û
Timber Challenging to identify a scenario leading to a change in timber provision that isdetectable at an economy wide level û
Water supply Significant impacts on future provision of service and potential for diffuse impactswhereby the whole economy becomes more vulnerable as a result of water scarcity ü
Air qualityregulation
Growing policy interest in this service although challenging to link to macroeconomicindicators û
Floodregulation
Key issue for a range of economic sectors, significant future impacts on this servicefrom a changing climate, and likely to be possible, although challenging, to quantify ü
Global climateregulation
While an important service, a stress test would be unlikely to add value given previousand ongoing efforts in this area û
Tourism andrecreation
Significant economic sector although challenging to identify natural capital scenarioswhich impact the ‘quantity’ rather than the ‘quality’ of the service û

AECOM 33
Step 2. Formulate stress test scenario
A literature review was then undertaken to put together a high-level narrative description of the potentialchange in each of the five UKNEA drivers that would describe the scenario to be used as the basis of themodel in the pilot NCST. The resulting narrative is set out below – the evidence base supporting each aspectof the narrative is set out in Appendix A.
Climate change
Globally, the international community fails to meet the required reductions in greenhouse gas emissions tolimit warming to two degrees. The resulting climate scenario in the UK follows the projections set out in theUKCP09 ‘High Emissions’ scenario on the four degrees of warming path. The subsequent impacts causesignificant reductions in the amount of water in the environment that can be sustainably withdrawn, while alsoincreasing the demand for water during the driest months. The frequency and magnitude of floods in the UKalso rises significantly and cause growing costs to a range of economic sectors. Globally, changes in theclimate system lead to a doubling of international food prices.
Invasive species
Increasing demand for global imports and a more diverse supply chain, together with changes in the climateand land use, lead to a significant increase in the frequency and severity of pest and disease outbreaks in theUK and growing costs for the agriculture industry.
Habitat change
Greater emphasis on competing in the international market and securing trade deals leads to cuts in publicsubsidies for UK agriculture and there is a marked shift from subsidising food production towards allowing themarket to determine the level of agricultural output. This shift leads to a widespread abandonment ofagricultural land in upland areas with limited agricultural productivity. At the same time, the UK populationcontinues to grow which leads to growing demand for housing resulting in the relaxation of Green Beltrestrictions and widespread urban expansion into farmland areas surrounding cities, increased developmentof housing infrastructure on floodplains and coastal margins, and the creation of new towns on areaspreviously used for agriculture.
Nutrient enrichment and pollution
Environmental regulations are also relaxed in order to support intensification of the remaining farms to allowthem to compete with less constrained international producers. This leads to increases in livestock stockingdensities and a spike in the use of pesticides and fertilisers which causes short term productivity boosts andlonger term increases in soil degradation, water pollution, and loss of natural pollinators. Combined, thiscreates rising costs for agricultural productivity and water treatment, and reduced capacity of ecosystems toregulate surface water flows during flood events.
Overexploitation of resources
Demand for residential water use grows in line with the increase in population and creates additionalpressures on already-stretched water resources in some parts of the country. In the drier areas of the countrywater shortages become commonplace leading to frequent restrictions. These pressures are furtherexacerbated by increasing demand for irrigation water due to the changing climate and the growing demandfor water to meet the energy needs of a growing population.

34 AECOM
Step 3. Identify and quantify impacts on ecosystem services
A more detailed literature review was then undertaken in order to map out the pathways though which thedrivers could impact on ecosystem services, and to use these pathways to move from a descriptive narrativeto a quantitative estimate of the extent of change in natural capital and ecosystem service provision.
This process also highlighted gaps in the evidence base and helped to re-frame the aspects of the scenariothat could be quantified and modelled in the pilot exercise based on the available data. An outline of theprocess for each of the three services is set out below.
Crops and livestock
The impact pathway for the crops and livestock service is set out in Figure 4.
Figure 4. Impact pathway for ‘crops and livestock’ service
A series of assumptions and calculations were then used to estimate the change in the provision of crops andlivestock resulting from each of the natural capital impacts identified in the impact pathway. An overview of theprocess is set out in Table 7 with more details on the assumptions involved provided in Appendix A.

AECOM 35
Table 7. Overview of impacts on natural capital from high level drivers and resulting impacts on cropsand livestock
Key impacts Impact on natural capital by 2050s Impact on crops and livestock Quantified
Change in spread ofpests and disease
Increased impacts on winter wheat andbarley from diseases such as BarleyYellow Dwarf virus due to climaticchanges and activity of aphid vectors38
Acute reduction in crop yields of10.3% of total value by 2050 perdisease outbreak35,36,37
ü
Increased impacts on livestock due todiseases such as bluetongue and liverfluke38
Acute reduction in livestockproduction of 1.0% of total value by2050 per disease outbreak39,40,41
ü
Change in droughtand flood risk
Increase in the area of Best and MostVersatile (BMV) land at high risk offlooding to 790,000 ha42
Acute reduction in crop yields of18.3% of total value by 2050 perflood43
ü
Increase in water supply deficits duringlow flow events and restrictions onagricultural water use
Impacts on agricultural output due todrought events are captured in the‘water supply’ service
û
Change in risk ofwindthrow / wildfire /storm damage
Increase in wildfire risk44 and loss ofcrops to fire damage
Acute reduction in crop yields of 0.2%of total value by 2050 per fire45 ü
Change inprecipitation /temperature / CO2
concentrations
More frequently waterlogged soils inwinter and reduced soil moisture insummer leading to increase in weatherpatterns seen in 2012 where poorweather (wet winter/spring, dry summer)led to reduced wheat and potato yields46
Acute reduction in crop yields of 5.9%of total value by 2050 per year withpoor weather event47
ü
Increase in wheat and sugar beet yieldsdue to better growing conditions togetherwith decrease in potato yields48
Chronic increase in crop yields of1.1% of total value by 205049 ü
Increase in heatwave events which leadto loss of milk yield from livestock50
Acute reduction in livestockproduction of 0.2% by 205051 ü
35 Crop Bayer Science http://www.bayercropscience.co.uk/our-products/seed-treatment/redigo-deter/bydv/36 Farmers Weekly http://www.fwi.co.uk/arable/spring-wheat-now-makes-up-5-of-uk-wheat-area.htm37 Defra (2015) ‘Provisional 2015 cereal and oilseed rape production estimates’.38 Brown et al. (2017) UK Climate Change Risk Assessment Evidence Report: Chapter 3, Natural Environment and Natural Assets.Report prepared for the Adaptation Sub-Committee of the Committee on Climate Change, London.39 Veterinary Record http://veterinaryrecord.bmj.com/content/161/16/571.640 Pfizer Animal Health http://beefandlamb.ahdb.org.uk/wp/wp-content/uploads/2013/06/Liver-fluke-in-cattle-costs-and-control.pdf41 AHDB Dairy https://dairy.ahdb.org.uk/market-information/farming-data/milk-yield/average-milk-yield/#.WH5PiNWLS7142 Sayers et al. (2015), ‘Climate Change Risk Assessment 2017: Projections of future flood risk in the UK’.43 Sayers et al. (2015), ‘Climate Change Risk Assessment 2017: Projections of future flood risk in the UK’.44 Gazzard et al. (2016), ‘Wildfire policy and management in England: an evolving response from Fire and Rescue Services, forestry andcross-sector groups’45 Brown et al. (2017) UK Climate Change Risk Assessment Evidence Report: Chapter 3, Natural Environment and Natural Assets.Report prepared for the Adaptation Sub-Committee of the Committee on Climate Change, London.46 Brown et al. (2017) UK Climate Change Risk Assessment Evidence Report: Chapter 3, Natural Environment and Natural Assets.Report prepared for the Adaptation Sub-Committee of the Committee on Climate Change, London.47 Brown et al. (2017) UK Climate Change Risk Assessment Evidence Report: Chapter 3, Natural Environment and Natural Assets.Report prepared for the Adaptation Sub-Committee of the Committee on Climate Change, London.48 CCRA (2012), ‘Climate Change Risk Assessment for the Agriculture Sector’.49 Brown et al. (2017) UK Climate Change Risk Assessment Evidence Report: Chapter 3, Natural Environment and Natural Assets.Report prepared for the Adaptation Sub-Committee of the Committee on Climate Change, London.50 Dunn et al. (2014), ‘Analysis of heat stress in UK dairy cattle and impact on milk yields’.

36 AECOM
Key impacts Impact on natural capital by 2050s Impact on crops and livestock Quantified
Change in sea levelsAverage increase in sea levels of 0.34metres52 leading to loss of 0.1% of BMVland through costal erosion53
Chronic reduction in crop yields of0.04% of total value by 205054 ü
Change in naturalpollinator population
Decline in natural pollinator populationsand distributions to the extent thatpollinator visits to crops fall55
Chronic reduction in crop yields of4.9% of total value by 205056,57 ü
Change in extent offarmlands /moorlands /grasslands
Subsidy reductions take all LessFavoured Area (LFA) land in England outof production
Chronic reduction in livestockproduction of 19.6% of total value by205058,59
ü
Increase in development of agriculturalland to meet growth in housing demand
Chronic reduction in crop yields andlivestock production not quantifieddue to limitations of evidence base
û
Change in soildegradation rates
Widespread deterioration in soil qualitydue to erosion, loss of soil organiccontent, and compaction60,61,62
Chronic reduction in crop yields of3.8% of total value by 2050 ü
The impacts on natural capital were then aggregated to provide an estimate of the cumulative change inecosystem service provision (see Section 5.5). As set out in Table 7, it was not possible to quantify each ofthe impacts of natural capital change on the provision and crops and livestock and the resulting scenariomodelled in the pilot NCST was as follows:
· What is the potential scale of the impact of a reduction in the output of agricultural crops and livestockin 2050 due to a combination of acute tail-end shock events including disease outbreaks, floodevents, wildfires, poor weather events, and heatwaves?
· What is the potential scale of the impact of a reduction in the output of agricultural crops and livestockin 2050 due to a chronic change in productivity resulting from improved growing conditions for certaincrops, loss of agricultural land through coastal erosion, declines in natural pollinator populations,reduction in farming in upland areas, and falling soil productivity?
Water supply
The impact pathway for the water supply service is set out in Figure 5 and the estimates of change in naturalcapital and ecosystem service provision are set out in Table 8.
51 Dunn et al. (2014), ‘Analysis of heat stress in UK dairy cattle and impact on milk yields’.52 Sayers et al. (2015), ‘Climate Change Risk Assessment 2017: Projections of future flood risk in the UK’.53 Ramsbottom et al. (2012), ‘UK 2012 Climate Change Risk Assessment for the Floods and Coastal Erosion Sector’.54 Brown et al. (2017) UK Climate Change Risk Assessment Evidence Report: Chapter 3, Natural Environment and Natural Assets.Report prepared for the Adaptation Sub-Committee of the Committee on Climate Change, London.55 Brown et al. (2017) UK Climate Change Risk Assessment Evidence Report: Chapter 3, Natural Environment and Natural Assets.Report prepared for the Adaptation Sub-Committee of the Committee on Climate Change, London.56 Biesmiejer et al. (2006), ‘Parallel Declines in Pollinators and Insect-Pollinated Plants in Britain and the Netherlands’.57 UK NEA (2011), ‘Chapter 14: Regulating Services’.58 RBR (2016), ‘Farm Business Survey 2014/2015 Hill Farming in England’.59 Defra Soil Research Programme ‘Review of the weight that should be given to the protection of best and most versatile (BMV) landTechnical Report SP1501/TR Final Report’.60 UK National Ecosystem Assessment Follow-On (2014), ‘Work Package Report 1: Annex 4 – Case studies’.61 Cranfield University (2013) for the Adaptation Sub-Committee. Work for the ‘Managing the land in a changing climate’ report62 Graves et al. (2015), ' The total costs of soil degradation in England and Wales’.

AECOM 37
Figure 5. Impact pathway for ‘water supply’ service
Table 8. Overview of impacts on natural capital from high level drivers and resulting impacts on watersupply
Key impacts Impact on natural capital by 2050s Impact on water supply Quantified
Change in spread ofpests and disease
Increased incidence of invasive species(especially aquatic plants andinvertebrates)63
Chronic increase in water treatmentcosts not quantified due to limitationsof evidence base
û
Change inprecipitation /temperature / CO2concentrations
Change in precipitation patternscontributes to lower flows in summermonths64
Chronic reductions in supply of waterwhich increase the impacts of acutedrought events based on theevidence base set out in the CCRA
ü
Assuming acute drought event occursfor a 3 month period ü
Change in sea levelsAverage increase in sea levels of 0.34metres65
Chronic increase in groundwatersaline intrusion into aquifers notquantified due to limitations ofevidence base
û
Change in extent ofurban areas/freshwaters /peatlands
Increase in population leading toincrease in intensification of remainingagricultural land and urbanisation of rivercatchment which reduces capacity ofecosystems to regulate water quality
Chronic increase in water treatmentcosts not quantified due to limitationsof evidence base
û
63 Dawson et al. (2016), ‘Climate Change Risk Assessment 2017: Infrastructure’64 Dawson et al. (2016), ‘Climate Change Risk Assessment 2017: Infrastructure’65 Sayers et al. (2015), ‘Climate Change Risk Assessment 2017: Projections of future flood risk in the UK’.

38 AECOM
Key impacts Impact on natural capital by 2050s Impact on water supply Quantified
Change in soildegradation rates
Continued erosion of sedimentscontributing to sedimentation of water
Chronic increase in water treatmentcosts not quantified due to limitationsof evidence base
û
Changes in waterquality classification
Intensified agriculture and wetterautumns and winters increases theseverity of diffuse agricultural pollutionand low summer river flows lesseffectively dilute pollutants
Chronic increase in water treatmentcosts not quantified due to limitationsof evidence base
û
Change in demandfor food / water / rawmaterials
Increase in population of 10% to 83million people leading to the demand forwater across the UK to increase by 9%66
Chronic increase in demand for waterwhich can emphasise the impacts ofacute shocks during drought eventsbased on the evidence base set out inthe CCRA 2017
ü
Given the limitations of the evidence base, the impacts on water supply for the purposes of the pilot NCSTwere focused on quantifying the chronic changes in the demand and supply of water, and how these ongoingchronic changes could lead to greater exposure to acute drought events in future. More specifically, the pilotaimed to answer the question, how much greater could the magnitude of impacts from a drought event in2050 be due to chronic declines in water availability based on a comparison between:
· The impacts of a three-month drought event in 2050 (assumed here to be a period when water levelsare at low flows for three months) if water availability declines to the extent projected by CCRA 2017.
· The impacts of a similar drought event in 2050 if water availability was maintained at its current levels.
Flood regulation
The impact pathway for the flood regulation service is set out in Figure 6 and the estimates of change innatural capital and ecosystem service provision are set out in Table 9.
Figure 6. Impact pathway for ‘hazard regulation’ service
66 HY Wallingford (2015), CCRA2: Updated projections for water availability for the UK Final Report’.

AECOM 39
Table 9. Overview of impacts on natural capital from high level drivers and resulting impacts on floodregulation
Key impacts Impact on natural capital by 2050s Impact on hazard regulation Quantified
Change inprecipitation /temperature / CO2
concentrations
Average increase in peak river flows of23%67 and events of intense rainfallbetween 1 to 6 hours duration of 20%68
Increase in risk of acute fluvial floodevents based on the evidence baseset out in CCRA 2017
ü
Increase in risk of surface water floodevents based on the evidence baseset out in CCRA 2017
ü
Assuming increase in risk of acuteflood events based on the evidencebase set out in CCRA 2017
ü
Change in sea levels Average increase in sea levels of 0.34metres69
Increase in risk of acute coastal floodevents based on the evidence baseset out in CCRA 2017
ü
Change in extent ofwoodland / urbanareas / wetlands
Increase in population of 10% to 83million people70 leading to an increase inurbanisation mainly at the expense ofagricultural land although someadditional development on floodplains
Chronic increase in number ofproperties at risk from flooding duringacute events
ü
Chronic decrease in capacity ofecosystems to regulate water flowsnot quantified due to limitations ofevidence base
û
Change in soildegradation rates
Increase in soil degradation and loss ofcapacity to store water
Chronic decrease in capacity ofecosystems to regulate water flowsnot quantified due to limitations ofevidence base
û
Given the available evidence base, the impacts on flood regulation in the pilot NCST were focused onquantifying the chronic changes in the numbers of properties at risk of flood events and the change in theextent and magnitude of acute flood events by 2050. More specifically, the pilot exercise looked at thepotential scale of the impact of a one-off repeat of the winter floods of 2013/14 given the greater numbers ofpeople and properties at risk of flooding due to ongoing changes in the climate system and population by2050.
Step 4. Identify and value economic impacts
Having developed the assumptions about changes in ecosystem services, the final part of the pilot was tocarry out the economic impact analysis.
In the case of the two provisioning ecosystem services (crops and livestock and water supply), a model wasdeveloped and applied specifically for this pilot. The model is a static input-output model that calculates the
67 Sayers et al. (2015), ‘Climate Change Risk Assessment 2017: Projections of future flood risk in the UK’.68 Sayers et al. (2015), ‘Climate Change Risk Assessment 2017: Projections of future flood risk in the UK’.69 Sayers et al. (2015), ‘Climate Change Risk Assessment 2017: Projections of future flood risk in the UK’.70 Sayers et al. (2015), ‘Climate Change Risk Assessment 2017: Projections of future flood risk in the UK’.

40 AECOM
economy-wide impacts of changes in demand. These economy-wide impacts arise from effects transmittedthrough industrial supply chains and changes in income that drive changes in consumption.71 Having identifiedthe output reductions that follow from a change in ecosystem services, it is up to the user to specify how anysupply restrictions fall on individual industries; the model then calculates the extent to which this reduceddemand from the (direct and indirect) users of crops and livestock or water is consistent with the assumptionfor reduced supply. The user can either specify the level of reductions themselves (e.g. ‘£5bn of output wouldbe affected in the accommodation services industry’) or impose assumptions that set the distribution of anyreductions across industries (e.g. ‘7% of whatever output reduction is required is assumed to come from thefruit and vegetable processing industry’).
The analysis of shocks to, and chronic degradation of, natural capital is largely uncharted territory andhistorical experience gives an incomplete picture as to how these effects might play out and how people andthe economy might react. As such, a natural capital stress test is subject to a much wider range ofuncertainties than a financial stress test. The analysis presented in this pilot is necessarily reliant onassumptions. Moreover, changes in provisioning ecosystem services mostly concern supply effects. Theseare distinct from demand effects and industrially-disaggregated analysis of supply effects is much lessexplored as an area of research than demand effects. Few existing models capture such supply impactsadequately and models that do will still be subject to parameters based on historical experience, which maybe less suited to the analysis of adverse events. Given the complexity of the possible effects, and given thatthis is a pilot project, a simple model was preferred to explore the problem of ecosystem service change andits implications for the UK economy.
Because of the preference for simplicity/transparency, the model does not embody automatic responses ofdemand to changes in price (to bring demand into line with supply). Instead, it is up to the analyst to specify achange in output (translated from a change in ecosystem services, from the evidence) and a change in pricesthat together form a coherent scenario. This makes it easier to isolate different effects. The model thereforehas a separate module to calculate the impacts on the consumer price index of price changes in the UK andthe rest of the world.
The input-output model itself is based on the latest UK input-output table, for 2010. The underlying input-output table has been aggregated to 67 industries in a way that still permits analysis at broader industrygroupings (corresponding to the individual sections of SIC 2007). Appendix C provides a table that lists the fullname of each industry and its correspondence to the SIC Sections. The impact model itself, implemented in aMicrosoft Excel workbook, contains a more-detailed mapping between the industries and other industrygroupings. The input-output table is for 2010 and the 2050 baseline has been constructed by combining thatdata with output and employment projections from Cambridge Econometrics’ MDM-E3 model of the UKeconomy. The projections are consistent with Cambridge Econometrics’ November 2016 forecast andextrapolated to 2050. Unless otherwise stated, all monetary values reported in the macroeconomic analysisare in real terms (2010 prices).
Because uncertainty pervades the entire stress test approach, the quantitative estimates that follow arenecessarily imprecise. Further, as will be seen in the case of the first two ecosystem services (crops andlivestock, and water supply), the size of the impact depends critically on which industries are assumed toabsorb the reductions in ecosystem service flows, and the extent to which industries might be able to adapt tothe losses in service flows while maintaining production.
While the model is a substantive output of this pilot project, it is important to understand its role as an aid to astress test analysis. Its value to analysts and decision makers comes from the ability to run meaningful
71 The model incorporates a set of Type II output, GVA and employment multipliers.

AECOM 41
scenarios and interpret the results. As the approach in Section 3 and the discussion in Section 4 make clear,different approaches will be necessary to examine different scenarios and ecosystem services. Hence, theresults in this section should be viewed as an illustration of the kind of approach that might inform a stress testand, as importantly, how those results should be interpreted when drawing conclusions from the analysis.
For hazard regulation, a lack of data prevented a detailed assessment and modelling along the lines set outabove. Instead, a different kind of analysis was conducted in which assumptions were applied to analyse whatthe impacts of a past series of flood events would be if they were to happen in the future (when the socio-economic structure of the UK would be different and perhaps more vulnerable to such events).
5.2 Headline resultsHaving identified three ecosystem services from the earlier prioritisation exercise, the NCST piloted hereconsidered three questions:
· Crops and livestock: What is the potential scale of the impact of a reduction in the output ofagricultural crops and livestock in 2050 due to a combination of acute tail-end shock events such asfloods and disease outbreaks, and chronic declines such as falling soil productivity and a loss ofnatural pollinators?
· Water supply: What is the potential scale of the impact of a reduction in water availability due to anacute drought event in 2050 that is made more severe by chronic growth in demand that exceeds thenatural replenishment of water resources?
· Flood regulation: What is the potential scale of the impact of a one-off repeat of the winter floods of2013/14 given the greater numbers of people and properties at risk of flooding due to ongoingchanges in the climate system and population by 2050?
The answers to these three questions are summarised in Table 10. Headline results from the pilot NCSTexercise are explained in more detail in the following sections.
Table 10. Headline results from the pilot NCST exercise
Ecosystemservice
Scenario Estimated impacts in2050
Crops andlivestock
Output shock in 2050 from disease outbreaks, flood events, wildfires,poor weather events, and heatwaves
0.9% reduction in GDP347,000 jobs lost
Productivity losses over time to 2050 from changes in growingconditions and land use, declines in pollinators, and falling soil productivity
0.2% reduction in GDP66,000 jobs lost
Watersupply
Three-month UK wide drought in 2050, continued depletion of waterreserves
1.0% reduction in GDP354,000 jobs lost
Three-month UK wide drought in 2050, water reserves protected andmaintained at current levels
0.5% reduction in GDP156,000 jobs lost
Floodregulation
Repeat in 2050 of the 2013/14 winter floods with continued populationgrowth and limited action on climate change
70% increase in damagesto £2.2bn (2013/14 prices)

42 AECOM
Crops and livestock
Change in service provision
The scenario tested in the pilot NCST aimed to quantify the potential scale of the impact of a reduction in theoutput of agricultural crops and livestock in 2050 due to a combination of acute tail-end shock events andchronic changes in productivity. An overview of the estimates of ecosystem service change is set out in Table11 and further details are available in Appendix A.
Table 11. Cumulative change in crops and livestock
Service Current output(2015 prices)
Acute change in output forshock event in 2050 (%)
Chronic change in outputby 2050 (%)
Crops £7,595,000,000 -34.6% -7.7%
Livestock £10,811,000,000 -1.2% -19.6%
These results suggest that a combination of acute tail-end shock events including disease outbreaks, floodevents, wildfires, poor weather events, and heatwaves occurring in the year 2050 could lead to a 34.6% and1.2% reduction in crops and livestock output respectively. In addition, a chronic change in productivityresulting from improved growing conditions for certain crops, loss of agricultural land through coastal erosion,declines in natural pollinator populations, reduction in farming in upland areas, and falling soil productivitycould lead to a 7.7% and 19.6% reduction in crops and livestock output by 2050.
However, it is important to note that existing studies do not provide a consistent overview of the cumulativeimpacts of various natural capital changes on crops and livestock provision by 2050. A number of differentstudies were drawn upon which used multiple different sets of assumptions and methodologies. This createsissues when trying to combine like with like; for instance some estimates for the extent of change in 2050account for the change in magnitude of a particular impact (e.g. greater loss of milk yield from dairy cows dueto an increase in the number of heatwave events), whereas others do not, instead assuming that events whichhave happened previously occur again in the future (e.g. replication of poor weather events in 2010/11).
The estimates do not account for the likelihood of an event occurring, and instead focus on the magnitude ofthe impact should an event occur. As such, some of the figures are likely to be over or under estimates of theactual magnitude. For example, the estimate of flood risk to agricultural land draws on CCRA 2017 workwhich suggests that 790,000 ha of BMV agricultural land could be at high risk of flooding by 2050. Theestimates provided above look at the magnitude of the impact if all of this area was flooded within a singleyear, an event which has a low likelihood.
These issues mean that the pilot exercise should be taken as indicative of how the potential approach couldbe undertaken, rather than providing definitive estimates of what may actually happen in 2050. As a priority,research should be undertaken to build the evidence base around aggregate impacts of changes inecosystem service provision.
Change in macroeconomic indicators
The narrative of an acute shock to crops and livestock supply is a series of impacts that falls largely on crops(as set out above): a confluence of events such as flooding, disease, and cold/wet weather. This reducesoutput in both the UK and (by assumption) abroad and causes a global price spike in 2050, the year of theshock. Countries do divert some of their exports to support domestic consumption and so importers of foodface reduced supply. Both households (who purchase fruit and vegetables) and food manufacturers (whoprocess crops) are affected.
The main features of this narrative for the quantitative economic analysis are, in 2050, as follows:

AECOM 43
· A reduction in agriculture output in that year, of £2.9bn in real terms (2010 prices).72 Thisrepresents around 6% of the industry’s gross output in 2050. This is the direct impact of the change inecosystem services that is transmitted into the economy.
· This reduction is associated with higher prices. Global agriculture prices in 2050 are assumed todouble from the supply shock. This is discussed further below.
· Of that total reduction in output, £0.5bn of UK exports are reduced (diverted to maintain domesticsales). This is around 12.5% of total exports. The percentage reduction is assumed to be twice thescale of the reduction in UK production, to reflect diversion to the domestic market.
· Despite the diversion of supply from exports, households still bear some reduction inconsumption. It is assumed that direct sales to households are reduced by just over 3%: half theoverall percentage reduction in UK supply.
· As it is assumed that the crisis occurs in multiple countries, it is also assumed that (temporary) importsubstitution is not possible. Moreover, producers in other countries adopt a similar policy as in theUK, diverting some of their exports to domestic consumption. This amounts to a 12.5% reduction inthe supply of foreign agricultural products to UK households in 2050: around £1.7bn in real terms. Thereduction in imports is larger than that of exports because the UK is relatively more dependent onfood imports than other countries are on UK food exports. The overall lower availability of food toconsumers is therefore the combination of lower domestic consumption and the lower availability ofimported food. This represents a reduction in households’ material circumstances (they are not able toconsume as much as before) though only the first is reflected in a reduction in GDP.73
Because the purpose of the stress test was to analyse tail-risk (and therefore extreme adverse) events, thechanges in ecosystem services identified in earlier parts of the stress test are necessarily of a scale that iseither at the extreme of, or beyond, historical experience. Deep uncertainty characterises many of thepossible future changes in natural capital and leads, in turn, to uncertainty about how the flow of ecosystemservices might change and the consequences for the economy. Because of this uncertainty, and reflecting theresources available for this pilot stress test, the analysis aims to be as simple and as transparent as possible.This is reflected in the reliance on key assumptions at various points in the process and the need to carefullyinterpret results in light of those assumptions.
It is for these reasons that the economic impact model was developed for this scoping study, to test theapproach on two of the selected ecosystem services (crops and livestock, here; and water supply, presentedlater). As explained earlier in this report, because of the lack of evidence/experience to properly understand allthe effects, it was not clear that there would be much initial benefit in the pilot from immediately deploying amore sophisticated economic model. This is particularly the case in the analysis of supply restrictions (as isrequired here), which are not so well-represented in existing models. Moreover, in the narratives developedhere, supply restrictions are imposed as combinations of price effects (to curb demand) and quantitativerationing (so that the burden is shared among households rather than borne by those with least ability to payhigher prices). In winter 2016/17, when rain and cold weather in Europe reduced the availability of certainkinds of produce, both higher prices and rationing (by food retailers) were applied. Finally, in the kinds of tail-risk scenarios of interest here, the impacts are more likely to lie outside of the historical experience on which
72 The figures in nominal terms from the previous section have been converted to 2010 real terms as this is the base year of theunderlying input-output table.73 In national accounting terms, the assumption of a reduction in the direct supply of imports to households (with no domestic alternative)requires changes in both domestic consumption and the foreign production to meet it. This appears as a simultaneous reduction in boththe consumption and imports components of GDP as measured by the expenditure approach. There is no net change in GDP though itdoes represent lower expenditure by households.

44 AECOM
existing models are based. This makes it less clear that the relationships that underpin these models willcontinue to hold under more extreme conditions.
Consequently, and in the interests of simplicity and transparency, the model developed and applied here doesnot attempt to simultaneously model changes in demand/supply and prices. Changes in supply do not lead tochanges in price, nor do changes in price lead to changes in demand; as might be incorporated in a modelwith a set of price elasticities. Instead, it was necessary to develop a set of supply and price assumptions that,together, formed a coherent scenario.
The reductions in agricultural output that might occur in the event of an acute shock are detailed above, basedon a range of sources. The nature of these changes in ecosystem services is largely uncharted territory andthe evidence on how these might affect (increase) prices is even sparser. Given the limited state of knowledgein this area, the global price spike modelled in the analysis assumes a doubling of global food prices. Thebasis for this assumption is the international food price hike of 2007-08. During this period, a combination ofsupply-demand imbalances in food, increases in the oil price, and depreciation of the US Dollar contributed toincreases in commodity prices of 80-105% for the main traded cereal crops. The UN Food and AgricultureOrganisation’s cereals price index shows a near-doubling over the period.74 In the pilot stress test, thisdoubles the cost of imports to industry (with the size of the effect depending on each industry’s importdependence). As price-takers, prices of UK agriculture output also double, increasing producers’ profits.Prices are modelled under the assumption of full cost-price pass-through and the results are, in that sense,towards the upper bound of the likely impacts.
As set out in Table 12, the economic analysis of the acute shock involves a combination of price effects(reflecting some market forces to curb demand) but also some rationing. Of the overall £2.9bn reduction inagricultural output, £0.9bn is met by reductions in direct sales to households (£0.4bn) and for export (£0.5bn).The remaining loss of £2bn of crops and livestock production is met by reductions in output in industries thatdepend on that produce. This generates further impacts in downstream industries, ultimately reducing theavailability of other goods and services for purchase by households etc. For example, a lower availability ofcrops can affect the supply chain by reducing the availability of wheat. This restricts flour production and, inturn, the production of baked goods. Economy-wide, the lower industrial output generates further effects bylowering household incomes and therefore leading to lower consumption on top of the original restrictions inpurchases of fruit and vegetables.
Table 12. Economic assumptions for an acute shock to crops and livestock in 2050
£2010bn Share of 2050 baseline (%)
Reduction in agriculture industry gross output -2.9 -6.2 (of gross output)
Of which met by reduced consumption byhouseholds
-0.4 -3.1 (of domestic consumption of agriculturalproducts)
Of which diverted from exports -0.5 -12.4 (of exports of agricultural products)
Remainder met by lower supply to industry -2.0 -
Reduction in imports (from similar shocks abroad) -1.7 -12.4 (of consumption of imported agriculturalproducts)
Note: This scenario also assumes a doubling in global prices of agricultural products.
74 This mirrors the assumption in United Nations Environment Programme (2016) ERISC Phase II: How food prices link environmentalconstraints to sovereign risk [online] available at http://www.footprintfinance.org/portfolio/erisc2-report/ (last accessed 27 February 2017).

AECOM 45
How the £2bn reduction in agricultural output falls on downstream industries (i.e. which industries bearmore/less in the way of restrictions) is a critical final assumption in the analysis and a further source ofuncertainty.75 The analysis that follows considers two alternative assumptions about which industries seereductions in the availability of agricultural products. This is to illustrate the sensitivity of the results to suchassumptions but also to show how an analyst might interpret the results from the pilot stress test.
The first set of assumptions comprises a set of reductions by individual industry based on the analyst’s ownjudgment. The analyst must manually specify the industries that might be most affected by a reduction in theavailability of agricultural products. In the input-output model developed for the pilot, these changes must bespecified as reductions in the availability of goods and services for purchase by final users such ashouseholds. This is, in practice, an iterative process in which the analyst would continue to adjust the changesin demand until the model yields a set of results consistent with those required by the scenario; in this case,until the model produces results consistent with the outcomes specified in Table 12. This approach isamenable to stakeholder engagement/participation to develop a plausible, industry-tested piece of analysis. Ina future stress test, such an approach is potentially time- and resource-intensive, but may yield substantialbenefits if it can take advantage of such industry expertise. For this pilot, Table 13 reports the reductions infinal demand by this approach.
Table 13 presents the amount by which production in specific industries is assumed to fall. These reductionsachieve the overall reduction in agriculture industry output of £2.9bn. Alongside the monetary values, the tablealso reports how large these reductions are as a percentage of final demand in 2050. This gives an indicationof the extent to which the availability of these products might need to fall to be consistent with a £2.9bnreduction in agricultural production. The £0.9bn reduction in agriculture in the first row follows directly from thenarrative of the scenario. All other reductions in industry production had to be specified by the analyst.
Table 13. Analyst-led distribution of output reductions by industry for an acute shock to crops andlivestock in 2050
£2010 bn Share of 2050final demand (%)
Agriculture (Crop and animal production, hunting and related service activities) -0.9 -4.5
Processing and preserving of fish, crustaceans, molluscs, fruit and vegetables -2.0 -40.0
Grain mill products, starches and starch products -1.5 -40.1
Bakery and farinaceous products -4.9 -39.9
Other food products -4.8 -40.0
Prepared animal feeds -1.3 -39.8
Accommodation -5.1 -7.4
Food and beverage service activities -9.9 -7.5
The non-agriculture reductions in Table 13 were set in a way that reduced the availability of:
· Certain food products that depend on crops. The changes were chosen to achieve similar percentagereductions, which ended up being around 40%. These reductions in the availability of such goods to
75 More sophisticated economic models might, for example, apply a set of price elasticities to simulate how the market might reconcile thisproblem but, as already mentioned, it is difficult to say whether this is a valid approach in an adverse scenario and, in any case, at leastsome restrictions would come about through rationing rather than prices.

46 AECOM
households are clearly substantial under the assumption of fixed coefficients but this seemsreasonably plausible as an implication because these products simply could not be manufacturedwithout the crops.
· Accommodation and food/beverage services, by around 7.5%. The percentage reductions weresmaller here to reflect some combination of: greater scope for substitution (these industries mightserve alternatives if other products are not available) and/or a likely greater acceptance of any priceincreases (such firms may be willing to pay higher prices as long as they can keep serving theircustomers, because food inputs represent a smaller proportion of their overall costs).
The alternative set of assumptions is derived from the historical data on industrial usage of agriculturalproducts. The model’s underlying input-output table (for 2010, the latest available year of data) identifiestransactions between industries, depicting the supply-chain dependencies of the UK economy. The tabletherefore shows the value of, for example, purchases of agricultural products by the fruit and vegetable-processing industry and how these purchases of inputs compare to those by the grain industry. Using thisinformation, it is possible to develop a set of assumptions that constrain industry output in a way that reflectshow significant each industry is as a purchaser of agricultural products.
For example, in the data, fruit and vegetable processing76 accounts for 7% of industrial demand foragricultural products. In modelling the economy-wide impacts of the reduction in agricultural output, fruit andvegetable processing would account for 7% of the overall reduction in final demand. Because the raw datashow meat77 and dairy78 products to dominate industrial purchases of agricultural products (and rememberingthat the acute ecosystem service shock falls largely on crops), in this case, these shares were set to zero(these industries faced no direct constraint on their production) and re-allocated to the other food-productionindustries.79
The only other modification to what would otherwise have been a set of assumptions derived entirely from thedata, was to set the share of oils and fats production80 to zero. This final adjustment was made because thisindustry is small and any direct constraints on output would quickly become implausibly large. The (small)share was re-allocated to other food-production industries in a similar manner. The clear advantage of thisapproach is that it is quick and transparent. However, it will not necessarily be as good a reflection of thespecificities of any particular scenario. This is because this data-derived approach simply applies behaviouralresponses consistent with the idea that industry output is constrained according to historical usage ofagricultural products.
In the results that follow, the estimated impacts from the assumptions based entirely on analyst judgment arelabelled as ‘analyst-led’ and should be considered to be the central headline results from the pilot stress test.The results using assumptions based on the historical data are labelled ‘data-derived’. While not acomprehensive sensitivity test, the results from this second set of assumptions give some sense of thepossible range of outcomes.
One other sensitivity test carried out during the pilot was to see what the economic impacts might be if all thereduction in agricultural output was met by restricting sales to households and for export. Such a decisionminimises the economic impacts by avoiding any downstream constraints on the supply chain. In fact, it is the
76 In the model, strictly, Industry 6: 'Processing and preserving of fish, crustaceans, molluscs, fruit and vegetables'.77 Industry 5: 'Processing and preserving of meat and production of meat products'.78 Industry 8: 'Dairy products'.79 Specifically, Industries 6 ('Processing and preserving of fish, crustaceans, molluscs, fruit and vegetables'), 9 ('Grain mill products,starches and starch products'), 10 ('Bakery and farinaceous products'), 11 ('Other food products') and 12 ('Prepared animal feeds'). Thisre-allocation was done in proportion to these industries' relative shares of agricultural purchases.80 Industry 7: 'Vegetable and animal oils and fats'.

AECOM 47
lowest possible economic impact that is still consistent with a reduction in agricultural output. The impacts onGVA/GDP and employment were small (barely 0.1%). But the possibility that households and foreignpurchasers might bear the entirety of any production losses was considered unrealistic and so these resultsare not presented below. Table 14 summarises the economic impacts from the analyst-led and data-derivedversions of the analysis.
Table 14. Summary economic impacts of an acute shock to crops and livestock in 2050
Analyst-led Data-derived
Change in GVA (£2010bn)(% of projected UK total in 2050; approximately equal to percentageof GDP)
-29.5(-0.9%)
-15.2(-0.5%)
Change in domestic final demand (£2010bn)(% of projected UK total in 2050)
-30.4(-0.8%)
-16.3(-0.4%)
Change in imports (£2010bn)(% of projected UK total imports for final use)
-1.7(-0.3%)
Change in employment ('000s)(% of projected UK total in 2050)
-347(-1.1%)
-158(-0.5%)
Change in CPI (%)(from the doubling in agricultural product prices) +3.4%
The results in Table 14 give a range of GDP impacts in 2050, with the largest estimated reductionapproaching 1% (analyst-led results) and the smaller (data-derived) one around half that, at 0.5%.81 The scaleof the employment impacts is in a similar range (0.5% to 1.1%); or between 158,000 and 347,000 jobs. Theoverall macroeconomic effect is relatively small although some industries do see larger impacts than others.
The estimated impact on the CPI as a result of the doubling in global agriculture prices is an increase of 3.4%.While not modelled in the analysis above, the distributional impacts of this price increase would fall harder onlower-income households. These households spend a larger proportion of their budget on food (food has alarger weight in the basket of goods for these income groups). Consequently, these households will see alarger increase in the average price of goods and services that they buy. Conversely, higher-income groupswill be relatively less affected, because food makes up a smaller proportion of their budget.
Figure 7 and Figure 8 report the gross value added (GVA) impacts by broad industry (SIC Section) for the twocases. Figure 7 reports the impacts from the analyst-allocated industry reductions, spread across elements offood processing and catering/hospitality. The distribution of the impacts follows largely from that allocationwith reductions in GVA in manufacturing and accommodation/food services of close to £8bn. Wholesale/retailsees a fall in GVA of around £2bn and some other services in the wider economy (finance, business andprofessional services etc.) see similar reductions. These reductions in services were not specified by theanalyst and are instead the consequence of supply-chain effects and how lower output reduces householdincomes and consumption. However, in percentage terms, the industries most affected are agriculture (whichis small but the scenario involves a reasonably-sized reduction in crop output) and accommodation and foodservices. Manufacturing is relatively less affected in percentage terms because food is only a part of the wholeUK manufacturing industry.
81 Strictly, the results reported are for GVA. GDP is GVA plus taxes less subsidies on products. The taxes/subsidies component varies byproduct but, in aggregate, and for the purposes of this exercise, the share is usually small and stable enough to interpret percentagechanges in GVA as percentage changes in GDP.

48 AECOM
Figure 7. GVA impacts of an acute shock to crops and livestock in 2050 by SIC Section (analyst-led)
In contrast, the data-derived approach leads to much lower impacts on accommodation and food services butalso a somewhat lower reduction on manufacturing (see Figure 8). This can be explained by the way in whichthese assumptions constrain production among direct purchasers of agricultural products (such as foodproduction) over industries whose dependence is less direct (accommodation and food services will tend tobuy more from food production than directly from agriculture). This difference in the length of the supplychains also explains why the analyst-led results generates larger economic impacts than this data-derivedcase: longer supply chains require larger reductions in output to eventually transmit changes in demand backto the agriculture sector. Moreover, GVA tends to account for a larger proportion of gross output in servicesthan in manufacturing. A given reduction in output will reduce GVA by relatively more in services (likeaccommodation and food services). Indeed, most of the difference in GVA impact between the two sets ofresults comes from the reductions in accommodation and food services.
Figure 8. GVA impacts of an acute shock to crops and livestock in 2050 by SIC Section (data-derived)
-10,000
-8,000
-6,000
-4,000
-2,000
0A B C D E F G H I J K L M N O P Q R S
£201
0m
-10%
-5%
0%
A B C D E F G H I J K L M N O P Q R S
Diff
eren
cefro
m20
50ba
selin
e(%
)
Other services
Accommodationand food services
Wholesale/retail
Agriculture
Manufacturing
-10,000
-8,000
-6,000
-4,000
-2,000
0A B C D E F G H I J K L M N O P Q R S
£201
0m
-10%
-5%
0%
A B C D E F G H I J K L M N O P Q R S
Diff
eren
cefro
m20
50ba
selin
e(%
)
Wholesale/retail
Agriculture
Manufacturing

AECOM 49
Figure 9 and Figure 10 present more detailed results for individual industries in the model. Figure 9 shows theresults for manufacturing, and accommodation and food services from the analyst-led assumptions. While themonetary value of the reductions in accommodation and food services is large, because these industries arethemselves large, the percentage reductions are comparatively mild.
In manufacturing, small reductions in GVA can represent much larger proportions of the industries’ output;20% or more in some cases. These are large impacts and serve to highlight industries that would be exposedwere such reductions in crop output to feed through to food production. No specific reduction was applied tothe tobacco industry but the GVA reduction is large in percentage terms because the industry is projected tobe so small in economic terms by 2050. At this scale, even small changes in output in monetary terms willgenerate large percentage changes.
Figure 9. GVA impacts of an acute shock to crops and livestock in 2050 for selected industries(analyst-led)
In comparison, Figure 10 shows a narrower range of industries affected. This allocation rule largely ignoresdownstream services like accommodation and food services and concentrates more of the impacts in fish, fruitand vegetables; grain, starches and starch products; and animal feed. The impacts on tobacco are, again,large in percentage terms owing to the small size of that industry by 2050.
-6,000
-4,000
-2,000
05 6 7 8 9 10 11 12 13 14 15 16 17 18 19 20 21 22 23 24 25 26 27 28 29 46 47
£201
0m
-40%
-30%
-20%
-10%
0%
5 6 7 8 9 10 11 12 13 14 15 16 17 18 19 20 21 22 23 24 25 26 27 28 29 46 47
Diff
eren
cefro
m20
50ba
selin
e(%
)
Accommodationand food services
Accommodation
Food and beverageservices
Tobacco
Fish, fruit andvegetables
Baked goods
Other food
Manufacturing
Grain, starches and starchproducts
Animal feeds

50 AECOM
Figure 10. GVA impacts of an acute shock to crops and livestock in 2050 for selected industries (data-derived)
In comparing the two sets of results it is clear that some industries will have to bear heavy reductions inoutput. Which industries will bear those reductions is an assumption that warrants further testing but the sizeof the GVA reductions in individual industries under the data-derived rule would seem to suggest that, withoutaction, some of the impacts could be substantial (25-40% of these industries’ GVA).
While these reductions follow from the previously-described analysis of the historical data, the scale of theeffects makes it hard to believe that these effects could be allowed to happen without further responses.82 Inthat sense, the figures reported here highlight the importance of action and/or response measures. However,some of those measures are likely already available as options in some industries, and a further question in afuture stress test would be how large the difference is between the likely actions undertaken and the requiredactions.
From the analysis above, it seems reasonable to conclude that:
· The impact of an acute shock to crops and livestock in 2050 could reduce UK GDP by up to 1%, withan alternative set of assumptions (derived from the historical data) suggesting a somewhat lowerimpact of around 0.5%.
· By industry, the largest percentage losses in GVA are likely to be in the food-production industries;perhaps as large as 20% in some cases (from the analyst-led results). Smaller percentage reductions
82 Remembering that the modelling framework assumes that inputs and outputs move in fixed proportions, precluding substitution or otherways to mitigate the effects.
-10,000
-8,000
-6,000
-4,000
-2,000
05 6 7 8 9 10 11 12 13 14 15 16 17 18 19 20 21 22 23 24 25 26 27 28 29
£201
0m
-50%
-40%
-30%
-20%
-10%
0%
5 6 7 8 9 10 11 12 13 14 15 16 17 18 19 20 21 22 23 24 25 26 27 28 29
Diff
eren
cefro
m20
50ba
selin
e(%
)
Tobacco(>100%)
Fish, fruit andvegetables
Other food
Grain, starches and starchproducts
Animal feeds

AECOM 51
could occur in catering and hospitality services but, because these are much larger industries, anylosses in economic activity here would lead to larger reductions in GVA and jobs.
· Which industries bear the reductions most matters. Greater reductions in food production industriesrather than catering/hospitality lead to relatively smaller economy-wide impacts. However, such anoutcome implies substantial losses in individual industries, probably beyond the point where theymight continue to be viable. Conversely, catering and hospitality services are larger industries, suchthat the necessary reductions constitute a smaller proportion of total output. However, the supplychains that lead back to the agriculture industry are longer, leading to an overall larger reduction ineconomic activity.
· Assuming a doubling of global agriculture prices in response to the shocks in multiple countries, anupper-range estimate for the increase in the CPI is around 3.5%. Lower-income households wouldlikely face a larger average price increase than higher-income households.
In contrast to the acute case, the narrative for chronic degradation focuses mainly on livestock, as a result ofland-use change (particularly the loss of upland livestock farming). Reductions in pollinators and soil qualitycontribute to some losses in crop output over time but the overall impacts on crops are much less than thoseon livestock. No additional costs were modelled to account for the possibility of attempts to maintain output inthe face of these trends.
As with the acute scenario, lower production in the UK and abroad leads to higher prices. Because the input-output model is static and only looks at one year, the modelling approach is similar to the acute case in that itonly looks at one year: 2050. However, the interpretation differs because the impacts examined in 2050 areassumed to have accumulated steadily over time rather than to have occurred suddenly in 2050. The analysisof chronic degradation should be interpreted as the impact by 2050, rather than in 2050. As in the acutescenario, the UK also diverts some exports to support domestic consumption. Unlike the acute scenario, theremay be some scope to compensate with higher imports.
The narrative of the chronic decline in crops and livestock comprises, by 2050:
· A reduction in agriculture output that increases to £2.9bn in real terms (2010 prices), representingaround 6% of the industry’s gross output in 2050. As it happens, this is a similar scale of reduction tothat in the acute case, but is assumed to be the cumulative impact by 2050, rather than the effect of ashock in 2050.
· Declining supply around the world leads to persistent increases in prices. As with the acute shock,in the absence of any further evidence to inform an assumption, global agriculture prices are assumedto grow to double what they might otherwise have been in 2050. This is, again, based on theexperience of 2007-08 and the outcome for 2050 will be the same as in the analysis of an acuteeffect, though here it will have arisen steadily over time.
· Of that total reduction, £0.5bn of exports are reduced (diverted to maintain domestic sales). Thisis around 12.5% of total exports. The percentage reduction is assumed to be twice that of the overallreduction to reflect UK producers’ preference and attempts to support their domestic market.

52 AECOM
Table 15 summarises these assumptions and, as with the acute shock to crops and livestock, the analysisconsiders both an analyst-led set of assumptions about how changes in agricultural output constrain otherindustries’ output (implying reductions in final demand of around 25% in meat and dairy products; see Table16) and a data-derived set based on the historical economic data. Because the historical data already reflectsthe dominance of meat and dairy products as purchasers of agricultural output, the only adjustment to theoriginal calculation was to, again, set the share of oils and fats production to zero, reallocating it to the otherfood-production industries.

AECOM 53
Table 15. Economic assumptions for chronic degradation to crops and livestock by 2050
£2010bn Share of 2050 baseline (%)
Reduction in agriculture industry gross output -2.9 -6.2 (of gross output)
Of which diverted from exports -0.5 -12.4 (of exports of agricultural products)
Remainder met by lower supply to industry -2.4 -
Note: This scenario also assumes a doubling in global prices of agricultural products.
Table 16. Analyst-led distribution of output reductions by industry under chronic degradation of cropsand livestock by 2050
£2010bn Share of 2050final demand (%)
Agriculture (Crop and animal production, hunting and related service activities) -0.5 -2.4
Processing and preserving of meat and production of meat products -4.2 -24.4
Dairy products -2.2 -24.1
The model has nothing to say about the extent to which the UK might import additional food to maintainconsumption. Assuming chronic decline in crops and livestock elsewhere in the world, it may not be plausiblefor the UK to make up the entire implied deficit with imports. In the analysis that follows, the results include anindicative figure for the additional imports that would be required to maintain household consumption. In afuture stress test, the proportion of that figure that could reasonably be met in this way would be a matter ofjudgment on the part of the analyst.
The main results are presented in Table 17. These impacts are generally smaller than in the acute shockbecause supply chains for meat and dairy products are shorter and, compared to other food production,agricultural products make up a larger share of the meat and dairy industries’ inputs to production. In thiscase, the analyst-led results suggest a reduction in GDP of 0.2% and a similar percentage reduction inemployment (equivalent to 66,000 jobs). In contrast to the analysis of acute impacts, the results using theassumptions derived from the historical data are slightly larger than those from the analyst-led estimates:0.3% of GDP and employment (just over 100,000 jobs).
Table 17. Summary economic impacts of chronic degradation to crops and livestock in 2050
Analyst-led Data-derived
Change in GVA (£2010bn)(% of projected UK total in 2050; approximately equal to percentage of GDP)
-6.1(-0.2%)
-9.0(-0.3%)
Change in domestic final demand (£2010bn)(% of projected UK total in 2050)
-6.9(-0.2%)
-9.9(-0.2%)
Change in employment ('000s)(% of projected UK total in 2050)
-66(-0.2%)
-102(-0.3%)
Change in CPI (%)(from the doubling in agricultural product prices) +3.4%
Food imports required to compensate for lost domestic production (£2010bn)(% of projected UK total imports for final use)
6.4(1.2%)
7.1(1.3%)
The analyst-led set of results are somewhat larger than the data-derived ones because the data-derivedassumptions spread out more of the impacts across the economy. The analyst-led assumptions concentrate

54 AECOM
the impacts in two industries (as listed in Table 16). This is clear at both:
· The broad industry level (Figure 11 and Figure 12) at which the data-derived assumptions generatemore impacts beyond manufacturing, including wholesale/retail and other services.
· Within manufacturing (Figure 13 and Figure 14), with the analyst-led approach limiting the reductionsto two food production industries while the data-derived approach applies reductions to a range ofindustries, not all of which might plausibly bear such reductions in a scenario of livestock decline(such as tobacco, as highlighted previously).
Figure 11. GVA impacts of chronic degradation to crops and livestock by 2050 by SIC Section(analyst-led)
Figure 12. GVA impacts of chronic degradation to crops and livestock by 2050 by SIC Section (data-derived)
-2,500
-2,000
-1,500
-1,000
-500
0A B C D E F G H I J K L M N O P Q R S
£201
0m
-10%
-5%
0%
A B C D E F G H I J K L M N O P Q R S
Diff
eren
cefro
m20
50ba
selin
e(%
)
Agriculture
Manufacturing
Other services
Wholesale/retail
-3,000
-2,000
-1,000
0A B C D E F G H I J K L M N O P Q R S
£201
0m
-10%
-5%
0%
A B C D E F G H I J K L M N O P Q R S
Diff
eren
cefro
m20
50ba
selin
e(%
)
Agriculture
Manufacturing
Wholesale/retail
Other services

AECOM 55
To the extent that the analyst-led assumptions are arguably more plausible for the current narrative (of chronicdecline in livestock), these results are perhaps closest to what could happen under this scenario. In any case,the two sets of impacts are quite small in aggregate though, again, GVA reductions approaching 20% wouldsuggest that some industries could be left quite exposed if no further action is taken (or is possible).
Figure 13. GVA impacts of chronic degradation to crops and livestock by 2050 for selected industries(analyst-led)
Figure 14. GVA impacts of chronic degradation to crops and livestock by 2050 for selected industries(data-derived)
-1,200
-800
-400
05 6 7 8 9 10 11 12 13 14 15 16 17 18 19 20 21 22 23 24 25 26 27 28 29
£201
0m
-20%
-10%
0%
5 6 7 8 9 10 11 12 13 14 15 16 17 18 19 20 21 22 23 24 25 26 27 28 29
Diff
eren
cefro
m20
50ba
selin
e(%
)
Meat products
Tobacco
Dairy products
Othermanufacturing
Animal feeds
-800
-600
-400
-200
05 6 7 8 9 10 11 12 13 14 15 16 17 18 19 20 21 22 23 24 25 26 27 28 29
£201
0m
-30%
-20%
-10%
0%
5 6 7 8 9 10 11 12 13 14 15 16 17 18 19 20 21 22 23 24 25 26 27 28 29
Diff
eren
cefro
m20
50ba
selin
e(%
)
Tobacco(>100%)
OthermanufacturingMeat products
Dairy products
Fish, fruit andvegetables
Grain, starchesand starchproducts
Animal feeds
Other food

56 AECOM
From the results of the chronic crops and livestock analysis, one might conclude that:
· The reduction in GDP by 2050 is likely to be no more than 0.5%. This is smaller than the estimatedimpacts from an acute shock to crop production because supply chains for meat and dairy productstend to be shorter, limiting the wider economic impacts.
· Individual industries, however, could see moderate-to-large reductions in GVA. In the meatprocessing and dairy industries, the reduction could be 15-20% lower if chronic degradation is allowedto occur.
· A possible (adaptation) effect not captured in the analysis is the extent to which industries mightrestructure to produce alternatives such as less land-intensive livestock (e.g. poultry) or vegetableproteins. The analysis above assumes a simple reduction in productive potential under existingbusiness models. While the impacts are small, they may be smaller still if industries shift their focus toalternative products.
· As with an acute shock, an eventual doubling of global agriculture prices as production falls couldincrease the CPI by as much as 3.5%. Again, lower-income households would likely face a largeraverage price increase than higher-income households.
Discussion and scope for improvement
The results from the analysis of acute and chronic effects on crops and livestock suggest that the overallimpact in or by 2050 would be small at the level of the whole economy. There is no strong evidence tosuggest that the impact could much exceed 1% of GDP or employment, although this is perhaps more afeature of the structure of the UK economy (the rest of the economy, particularly services, is just so muchlarger) than an observation about the unimportance of these ecosystem services. Moreover, at the level ofindividual industries, some of the impacts (assuming no action or response measures) could be large. Even ifsome of those impacts verge on implausibly large, the implication is clear that these industries are exposed tonatural capital change and, one way or another, things could not continue as they are.
Of note with respect to the acute shock is that the 2007-08 crisis (the basis for the price effect analysed) wasaccompanied by socio-political unrest in countries in North Africa, the Middle East and South East Asia. Thequantitative analysis did not attempt to interpret the results in the light of possible unrest. This is, however, afactor that that would need to be borne in mind were the stress test approach deployed in the future. Thequestion here would be whether the impacts are likely to be of a magnitude that some threshold is crossed,leading to a social or political crisis.
Importantly, what the chronic analysis does not consider is the additional costs that agricultural producersmight be willing to incur to offset at least some reductions in productivity. The scope for this is clearer for thesmall amount of lost crop output, for which farmers may choose to increase their use of pesticides andfertilisers. This would help to limit some of the output losses (at least for a time) and, depending on globalprice trends, such actions might squeeze profits (if higher costs cannot be passed on through higher prices) orlead to higher inflation (if costs are passed on to consumers).
Water supply
Change in service provision
The scenario tested in the pilot NCST aimed to quantify the potential scale of the impact of a reduction inwater availability due to an acute drought event in 2050 made more severe by chronic growth in demand thatexceeds the natural replenishment of water resources. Unlike crops and livestock, acute and chronic effects inwater supply are not separable in this analysis. It is the chronic deterioration of the natural capital (paired withcontinued increases in water demand) that changes the severity of an acute shock, by reducing the capacityof the system to absorb that shock.

AECOM 57
The chronic impact on water availability was estimated based on the CCRA 2017 projection that the balanceof water supply relative to demand during low flow events will switch from a UK-wide surplus to a deficit by the2050s83 assuming: four degrees warming, a population increase of 10% to 83 million people, and acontinuation of the current levels of adaptation. The figures are derived from an earlier piece of scenarioanalysis conducted by HR Wallingford. For the pilot stress test, the figures from the HR Wallingford analysishave been aggregated (approximately) to the twelve NUTS regions84 of the UK. Water deficits by those twelveregions have then been calculated as the difference between projected supply and demand in 2050.
A summary of the results is set out in Table 18. The figures in the table set out the water deficit for a singleday at low flows i.e. the level of river flow that is equalled or exceeded for 95% of the time (in this casecalculated from 30-years of data). Zeroes indicate regions that would maintain a water surplus (i.e. incur nodeficit) in the event of a low-flow event. The two columns of Table 18 correspond, respectively, to:
· A ‘no degradation’ case in which water reserves are maintained at their current levels to 2050.85
· A ‘degradation’ case in which water reserves are assumed to deteriorate over time, leading toprogressively lower water availability to 2050.86
Water demand in 2050 is the same in the two cases and reflects an increase in demand over time from theassumed population growth in the overarching scenario, to 83 million people in that year. By holding demandconstant in the two cases, the figures in Table 18 show how progressive degradation over time reduces theheadroom (excess supply) in the system. In the event of a drought, the consequence of this chronicdeterioration is more regions suffering a water deficit in the ‘degradation’ case compared to the ‘nodegradation’ case. In this way, the chronic effect exacerbates the impacts of a drought. Were no degradationto occur, a drought in 2050 would push just four regions into deficit, implying a shortfall of just over 2,800Ml/day (about 18% of projected daily water demand in that year). In contrast, were water reserves allowed todeteriorate, a drought in 2050 would push all but two regions into deficit, leading to an overall shortfall ofalmost 6,400 Ml/day (41% of daily demand).
The full set of calculations that underpins Table 18 is available in a separate Excel spreadsheet.
Table 18. Comparison of water availability in a low-flow event, with and without chronic degradation inwater supply87
Region
No degradation:
Water deficits during low flows in2050 assuming water availability is
maintained (Ml/day)
Degradation:
Water deficits during low flows in2050 assuming water availability
declines (Ml/day)
East Midlands -138 -387
East of England -867 -1,196
London -1,261 -1,292
83 Hall et al. (2015), ‘CCRA2: Updated projections for water availability for the UK Final Report.84 The Nomenclature of Territorial Units for Statistics (NUTS) is a geocode standard used by Eurostat for referencing the subdivisions ofthe United Kingdom of Great Britain and Northern Ireland for statistical purposes. There are 9 first level regions within England and onefor each of Scotland, Wales and Northern Ireland.85 This case uses the water-availability figures from HR Wallingford’s baseline/current analysis, based on data for 2014.86 This corresponds to Scenario 15 in the HR Wallingford analysis, representing a climate-change trajectory consistent with an eventualincrease in global warming of four degrees Celsius and a continuation of current levels of adaptation.87 Hall et al. (2015), ‘CCRA2: Updated projections for water availability for the UK Final Report.

58 AECOM
Region
No degradation:
Water deficits during low flows in2050 assuming water availability is
maintained (Ml/day)
Degradation:
Water deficits during low flows in2050 assuming water availability
declines (Ml/day)
North East 0 -32
North West 0 -397
Northern Ireland 0 -54
Scotland 0 -532
South East -549 -917
South West 0 -422
Wales 0 -1,162
West Midlands 0 0
Yorkshire and the Humber 0 0
Total -2,816 -6,392
Deficit as % of total demand -18.1% -41.0%
By considering the change in water reserves only, the analysis that follows isolates the supply effect of achange in natural capital and how it alters the severity of a drought. In this way, the stress test applied hereassesses the implications of no action to preserve UK water reserves. In this pilot case, the analysis assumesthat a drought event in 2050 lasts three months.
Change in macroeconomic indicators
The changes in service provision above give the amount by which a drought in 2050 would create a watershortfall each day the drought continues. In the macroeconomic impact analysis, the annualised impact of adrought in 2050 is assessed on the assumption that a drought lasts for three months. Further, it is assumedthat the drought is managed partly by some further depletion of water reserves, rather than wholly by areduction in water supply to match the change in flow.88 In percentage terms, were a drought to occur, theimplied reduction in output of the water-supply industry in 2050 would be one-eighth of the deficits relative tototal demand from Table 18.89
Table 19 summarises the input assumptions to the economic analysis. Reading from the top, Table 19reproduces the totals and percentages from the earlier table of water deficits. The annual reduction in water-supply industry output is then given, at -2.3%, were a drought to occur but water reserves were maintained atcurrent levels; and -5.1%, were a drought to occur and water reserves allowed to deteriorate. The impact ofsuch a drought is roughly doubled by chronic degradation.
In monetary terms, the impact of a drought in 2050 without chronic degradation is a reduction in water-supplyindustry output of £234m (in 2010 prices). Chronic degradation would exacerbate the impact, leading to areal-terms reduction of £532m. Because water prices are regulated, no price changes have been modelled as
88 This may further erode water reserves and reduce resilience to future droughts. The longer-term effects are, however, beyond thescope of the current pilot, which focuses on 2050 only.89 The percentages are divided by four, to reflect the three-month duration of the drought, and then halved, to represent the furtherdepletion of water reserves to mitigate some of the reduced flow.
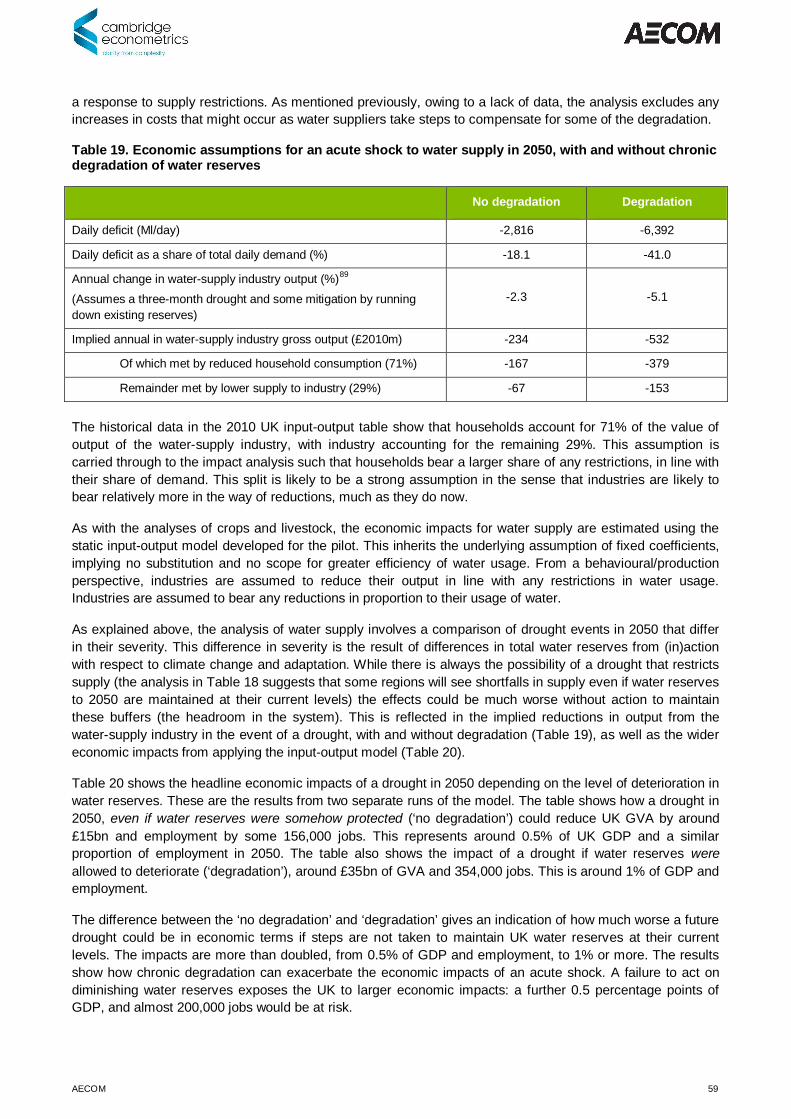
AECOM 59
a response to supply restrictions. As mentioned previously, owing to a lack of data, the analysis excludes anyincreases in costs that might occur as water suppliers take steps to compensate for some of the degradation.
Table 19. Economic assumptions for an acute shock to water supply in 2050, with and without chronicdegradation of water reserves
No degradation Degradation
Daily deficit (Ml/day) -2,816 -6,392
Daily deficit as a share of total daily demand (%) -18.1 -41.0
Annual change in water-supply industry output (%)89
(Assumes a three-month drought and some mitigation by runningdown existing reserves)
-2.3 -5.1
Implied annual in water-supply industry gross output (£2010m) -234 -532
Of which met by reduced household consumption (71%) -167 -379
Remainder met by lower supply to industry (29%) -67 -153
The historical data in the 2010 UK input-output table show that households account for 71% of the value ofoutput of the water-supply industry, with industry accounting for the remaining 29%. This assumption iscarried through to the impact analysis such that households bear a larger share of any restrictions, in line withtheir share of demand. This split is likely to be a strong assumption in the sense that industries are likely tobear relatively more in the way of reductions, much as they do now.
As with the analyses of crops and livestock, the economic impacts for water supply are estimated using thestatic input-output model developed for the pilot. This inherits the underlying assumption of fixed coefficients,implying no substitution and no scope for greater efficiency of water usage. From a behavioural/productionperspective, industries are assumed to reduce their output in line with any restrictions in water usage.Industries are assumed to bear any reductions in proportion to their usage of water.
As explained above, the analysis of water supply involves a comparison of drought events in 2050 that differin their severity. This difference in severity is the result of differences in total water reserves from (in)actionwith respect to climate change and adaptation. While there is always the possibility of a drought that restrictssupply (the analysis in Table 18 suggests that some regions will see shortfalls in supply even if water reservesto 2050 are maintained at their current levels) the effects could be much worse without action to maintainthese buffers (the headroom in the system). This is reflected in the implied reductions in output from thewater-supply industry in the event of a drought, with and without degradation (Table 19), as well as the widereconomic impacts from applying the input-output model (Table 20).
Table 20 shows the headline economic impacts of a drought in 2050 depending on the level of deterioration inwater reserves. These are the results from two separate runs of the model. The table shows how a drought in2050, even if water reserves were somehow protected (‘no degradation’) could reduce UK GVA by around£15bn and employment by some 156,000 jobs. This represents around 0.5% of UK GDP and a similarproportion of employment in 2050. The table also shows the impact of a drought if water reserves wereallowed to deteriorate (‘degradation’), around £35bn of GVA and 354,000 jobs. This is around 1% of GDP andemployment.
The difference between the ‘no degradation’ and ‘degradation’ gives an indication of how much worse a futuredrought could be in economic terms if steps are not taken to maintain UK water reserves at their currentlevels. The impacts are more than doubled, from 0.5% of GDP and employment, to 1% or more. The resultsshow how chronic degradation can exacerbate the economic impacts of an acute shock. A failure to act ondiminishing water reserves exposes the UK to larger economic impacts: a further 0.5 percentage points ofGDP, and almost 200,000 jobs would be at risk.

60 AECOM
Table 20. Summary economic impacts of an acute shock to water supply in 2050, with and withoutdegradation of water reserves
No degradation Degradation Difference
Change in GVA (£2010bn)(% of total UK GVA in 2050; approximately equal to %change in GDP)
-15.2(-0.5%)
-34.5(-1.0%)
-19.3(-0.5 percentage
points)
Change in domestic final demand (£2010bn)(% of UK total in 2050)
-15.6(-0.4%)
-35.4(-0.9%)
-19.8(-0.5 percentage
points)
Change in employment ('000s)(% of projected UK total in 2050)
-156(-0.5%)
-354(-1.1%)
-198(-0.6 percentage
points)
A feature of these results that should be noted is the size of the overall economic impact compared to theinitial shock. Depending on the case, the total GVA impact is a reduction of £15-35bn, from an initial change inwater-supply output of £0.2-0.5bn (representing £0.2-0.4bn of GVA). The economy-wide GVA impact isalmost 100 times larger than the initial GVA losses in the water-supply industry. The reasons for this arestraightforward to identify in the modelling approach and rest on the underlying assumptions about howrestrictions on water availability constrain production. What is less straightforward (and will be discussed inmore detail later) is how some of these assumptions might be relaxed in future stress tests.
By broad industry group, Figure 15 shows the largest percentage reductions in GVA in Mining and quarrying(Section B), Electricity and gas (Section D), and Agriculture (Section A). However, these sectors are quitesmall in GVA terms and therefore contribute relatively little to the overall reduction in monetary terms. LargerGVA reductions in monetary terms take place in Manufacturing (Section C; £2.5-5.6bn), which is perhaps notsurprising, depending on the specific industries, but also some services:
· Financial and insurance activities (Section K): £1.6-3.7bn.
· Public administration and defence; compulsory social security (Section O): £1.3-2.9bn.
· Education (Section P): £1.3-3.0bn.
Other services to see relatively larger GVA impacts from a drought include real estate, and variousprofessional and business services (Sections L, M and N).
Because the economic model applied in this assessment is linear, chronic degradation of water reservesaccentuates the industry-level impacts such that a doubling in size of the initial shock doubles each of theindustry-level impacts.

AECOM 61
Figure 15. GVA impacts of a drought in 2050, with and without degradation of water reserves, by SICSection
Figure 16 shows the more-detailed distribution of GVA impacts by individual industry from the input-outputmodel. This chart shows how the GVA impacts in monetary terms are concentrated in the ‘Othermanufacturing’ industry and various private and public services (consistent with the results by broad industrygrouping). As with the earlier analysis of crops and livestock, the baseline that underpins the analysis projectssustained decline in the tobacco industry such that, by 2050, the industry is so small that even slight changesin output (of a few millions of pounds sterling in real terms) can represent large percentage changes.
Figure 16. GVA impacts of a drought in 2050, with and without degradation of water reserves, byindustry
-6,000
-4,000
-2,000
0A B C D E F G H I J K L M N O P Q R S
£201
0m
-10%
-5%
0%
A B C D E F G H I J K L M N O P Q R S
Diff
eren
cefro
m20
50ba
selin
e(%
)
No degradation DegradationAgriculture
Mining and quarrying
Manufacturing
Electricity and gas
Water supply
Wholesale/retail
Other services
Finance/insurance
Publicadministration/
defence
Education
-3,000
-2,000
-1,000
01 6 11 16 21 26 31 36 41 46 51 56 61 66
£201
0m
-20%
-15%
-10%
-5%
0%
1 6 11 16 21 26 31 36 41 46 51 56 61 66
Diff
eren
cefro
m20
50ba
selin
e(%
)
No degradation DegradationTobacco(>50%)
Manufacturing
Othermanufacturing
Mining andquarrying
Agriculture Leather
Dyestuffs, agro-chemicals
Electricity, gas and water
Wholesale/retail
Public/non-marketservices
Financial/professional/business services

62 AECOM
Discussion and scope for improvement
The review of possible changes in this ecosystem service yielded relatively little evidence on how somechanges in natural capital might affect water supply. Just three of the eight possible impacts could bequantified (see Table 35 of Appendix A). Of those impacts, there was insufficient evidence to identify the needfor, and associated costs of, additional water storage and treatment measures to compensate for naturalcapital losses. However, while the range of ecosystem-service changes quantified in this pilot might benarrow, there are reasons to think that those effects that were subsequently modelled yield estimates for theeconomic impacts that are at the upper end of the likely range.
On the face of it, the analysis of water supply above suggests that a relatively small change in water supply(up to £0.5bn or 5% of the water-supply industry’s output in 2050) can lead to much larger impacts in theeconomy as a whole. The implied initial change in water-supply industry GVA (up to £0.4bn) can have aneconomy-wide impact almost 100 times larger (some £35bn), based on the idea that water is an essentialinput. Moreover, as mentioned previously, the assumption here is that households bear more of the restrictionin water supply (71%) than businesses, in line with households’ share of total water demand. This is a strongassumption because it is likely that businesses would bear relatively more of the reductions, as they do now.This would further increase the total economic impact by generating even larger knock-on effects throughsupply chains.90
Further investigation would be worthwhile, most likely with stakeholders, to better understand how supplyrestrictions might fall on businesses (particularly on specific industries) and households in the event of futuredroughts. This would improve on the treatment of supply restrictions used here (derived purely from the data)and give a better idea as to precisely where the initial impacts might fall, based on regulatory factors and thekinds of arrangements with water suppliers that different industries might have. The application of an input-output model could then be applied, as it was here, to identify the wider economic impacts.
Even without a more stakeholder-informed distribution of restrictions, the scale of the impacts seems on thelarge side, but is straightforward to explain in modelling terms. In a modelling approach in which changes inindustry output are proportional to changes in the availability of inputs to production (the fixed-coefficientsassumption), a restriction in supply for a small input can generate very large changes in output. Water is onesuch input, accounting for less than 1% of the value of any individual industry’s output, and with just twoindustries for which that share exceed 0.5%. It therefore takes a large reduction in output across the economyto meet quite modest water-supply restrictions. This result is striking in the way that it yields large outputreductions in industries like financial and public services; industries that one would not normally imagine asbeing dependent on water in the way that say beverage production is.
Despite the explanation from a modelling perspective, given the large size of the impacts for such a modestrestriction on water-supply industry output, it is worth considering the economic logic of the underlying fixed-coefficients assumption. As already stated, the assumption of fixed coefficients (an assumption embedded inthe input-output model) means that a change in the availability of an input to production translates, one forone, into a change in output. Such an assumption precludes:
· Substitution: In the absence of an input (or an increase in its price), firms in an industry cannot switchto alternative production methods that make use of more readily-available resources. Firms could not,for example, employ more labour to compensate for reductions in other inputs.
90 At the other extreme, the water-supply restriction could fall entirely on households, leading to GVA impacts of £0.2-0.5bn and between1,000 and 2,000 jobs. Impacts of this scale barely register at an economy-wide level. However, such an outcome does not constitute aplausible lower bound because water-supply restrictions that protect businesses at the expense of households in this way would beuntenable.

AECOM 63
· Increases in the efficiency with which firms use inputs to production or better management ofresources in the event of a disruption: If these were options, firms would be able to produce the sameamount of output for a smaller quantity of input(s) e.g. by taking steps to reduce waste or stockpilesome resources.
In both cases, the fixed-coefficients assumption means that a reduction in the availability of an input forcesfirms to ratchet down their production. Of the two, a lack of substitutability could be reasonable for manyprovisioning ecosystem services. Crops are necessary to produce and sell certain fruit and vegetables. It isthe second effect that seems harder to justify. This is because the fixed-coefficients assumption suggests thatfirms have no way of responding to a reduction in supply, not even on a temporary basis. In this situation,firms would have to reduce production rather than, for example, encouraging staff to work from home or,longer term, find ways to use water more efficiently.
While there is uncertainty as to how much efficiency is possible in the use of water (both in terms of theefficiency of supply through the network as well as by individual water consumers), it is hard to see therebeing no way at all to improve efficiency or manage an interruption in the ecosystem service. Given theregulated nature of water supply and the pricing of water, market forces to encourage efficiency are likely tobe weaker and less able to incentivise agents to economise on usage. This is what sets water supply apartfrom crops and livestock, and why it seems harder to accept that there is little-to-no scope for efficiency gains.
Moreover, because the analysis concerns a heavy drought in over 30 years’ time, it seems unlikely that theeconomy would be completely unprepared for such an event. Smaller droughts in the intervening years wouldsurely signal the (growing) need for adaptation measures. It is for this reason that the impacts presentedabove are likely to be at the upper end of the possible range, by showing the potential losses of economicactivity in the absence of any action on the part of businesses (or Government on their behalf) to cope withwater shortages of growing frequency and severity over time. By assuming fixed coefficients in the analysis,the results would seem to highlight the need for action though, realistically, one would expect businesses tohave at least some means to manage through a drought, and to be able to take some actions to lessen theimpacts.
In this light, future work to improve the economic analysis of water supply carried out in this pilot couldinclude:
· Improvements in the treatment of how water supply restrictions would fall on different consumers inthe event of a drought, to identify more specifically, who would bear more or less of the initial impact.
· An extended modelling approach to relax the assumption that precludes the possibility of firmsimproving the efficiency of their water usage, whether generally (as it becomes apparent that watersupplies are dwindling over time) or in the event of a drought. While the analysis here is able to showthe potentially large impacts of no change in behaviour on the part of businesses, it would be useful tocapture the response measures already available and used by businesses, so as to better gauge howmuch more action would be required to withstand a future drought.
· Work to better understand the scope for water efficiency at a system level (e.g. the extent of leakage)and the associated costs, to see where intervention on the part of the Government or Ofwat might benecessary.
· As was briefly mentioned before, one action included in the modelling is further depletion of waterreserves to maintain at least some supply during the drought. This may have longer-termconsequences by further eroding water reserves and increasing vulnerability to future droughts.Indeed, were this a standard response in the years leading up to 2050, the drought in that year couldbe worse than the modelling here indicates. It might be worth considering how a dynamic model ofwater stocks and flows could be linked to an economic impact model, or if there are ways to carry outthe assessment using a wider range of methods.

64 AECOM
In conclusion, while the analysis does suggest potentially large impacts relative to the modelled changes inwater supply, these impacts represent a case in which no action is possible by firms to economise on waterusage. The results therefore represent estimates towards the upper end of the likely range and should betreated with some caution in that respect. Given the remit of this pilot work, a relatively simple and transparentapproach sheds some light on the issue but there is clear scope for improvement in the future. Future analysisto develop the approach would benefit from work to better understand what efficiency measures are alreadyfeasible and explore the implications of the fixed-coefficients assumption in the analysis carried out here. Thisfurther work would help to identify the need for further coordinated action, beyond what is alreadypossible/likely.
Hazard regulation
Change in service provision
The scenario piloted in the pilot NCST aimed to quantify the chronic changes in the numbers of properties atrisk of flood events and the change in the extent and magnitude of acute flood events by 2050. This wasestimated based on the CCRA 2017 projections91 of the changes in flood risk by 2050 assuming four degreeswarming, a population increase of 10% to 83 million people, and a reduction in the current levels ofadaptation.92
The results are set out in Table 21 and represent a combination of the change in the likelihood of acute floodevents due to changes in the climate system, and a change in the magnitude of the associated impacts due topopulation growth, a reduction in the level of planned adaptation, and changes in the climate system.
Table 21. Cumulative change in flood regulation93
Aspect Current 2050s % change
No. residential properties at high risk of flooding94 1,073,286 2,454,715 129%
No. non-residential properties at high risk 533,590 772,041 45%
No. clean and wastewater sites at high risk 299 185 -38%
No. rail stations at high risk 580 685 18%
Length of road at high risk (km) 6,585 11,115 69%
Length of railway at high risk (km) 2,397 3,703 54%
No. power stations at high risk 24 16 -33%
No. substations at high risk 327 277 -15%
No. mobile phone masts at high risk 1,753 2,829 61%
91 Sayers et al (2016). The analysis of future flood risk in the UK using the Future Flood Explorer (FFE). Proceedings of Floodrisk2016.Paul Sayers, Matt Horritt, Edmund Penning-Rowsell, Andrew McKenzie and David Thompson. E3S Web Conf., 7 (2016) 21005 DOI:http://dx.doi.org/10.1051/e3sconf/2016072100592 This scenario assumes that the adaptation effort as a whole reduces. Investment in traditional defences reduces (reflecting a reductionin the willingness to pay for defences from national tax revenues as flooding is increasingly seen as less of a national risk and more of alocal one, but local funding fails to replace centralised investments). There is little take up of innovative catchment-based or urban run-offmeasures occurs, spatial planning becomes less rigorous (resulting in new development on the floodplain than currently is the case), andflood forecasting and warning systems and receptor level protection see low(er) levels of effectiveness and performance.93 Sayers et al (2016). The analysis of future flood risk in the UK using the Future Flood Explorer (FFE). Proceedings of Floodrisk2016.Paul Sayers, Matt Horritt, Edmund Penning-Rowsell, Andrew McKenzie and David Thompson. E3S Web Conf., 7 (2016) 21005 DOI:http://dx.doi.org/10.1051/e3sconf/2016072100594 ‘High risk’ defined as at risk of flooding more frequent than 1:75 years.

AECOM 65
Aspect Current 2050s % change
No. care homes at high risk 438 780 78%
No. schools at high risk 1,112 1,652 48%
No. emergency services at high risk 249 410 65%
No. hospitals at high risk 94 127 36%
No. GP surgeries at high risk 563 993 76%
No. landfill sites at high risk 398 423 6%
Change in macroeconomic indicators
The original narrative for the hazard regulation analysis involved one or more flood events that cause damageto physical assets (housing, business premises, infrastructure etc.), leading to damage (and possiblyinsurance/financial) costs. The damage to these economic assets, in turn, disrupts productive and connectivecapacity in the impact area, leading to reductions in economic activity. A further source of costs would likelyarise from emergency responses in the aftermath of the event(s) and the costs of recovery and reconstruction.
As Section 4.5 made clear, flooding is a local issue and a comprehensive assessment would likely involvecase-by-case analyses of areas prone to flooding. This was a larger exercise than could be undertaken forthis pilot. The alternative, adopted here, was to examine the economic impacts from a repeat of a past event,under assumptions about the future socio-economic structure of the economy. This contrasts with theanalyses of the other two ecosystem services, which examined the impact of a natural capital shock, ratherthan the transmission mechanism. Across the three ecosystem services, there is therefore some analysis thattries to assess both sources of natural capital exposure (patterns of shocks from the environment, andtransmission of shocks through the economy).
The analysis took, as its starting point, the impacts identified in a study for the Environment Agency on theimpacts of the 2013/14 winter floods in England and Wales.95 This impact is the result of a flood in a particularlocality over a particular time period. The question the analysis then sought to ask was: ‘under assumedchanges in the configuration of the local economy (more houses and businesses on the floodplain), how mightthe impacts of the 2013/14 differ were an event of that magnitude to occur again?’.
A comprehensive assessment would likely apply GIS techniques to map out the area affected by the floodsand then overlay the economic assets. From there, it would be possible to project a future version of that area,accounting for new build etc. and to (re)simulate the flood. In lieu of that, the analysis presented in Table 22applies the growth assumptions from analysis for the 2017 CCRA96 (as in Table 21), at the UK level, ratherthan at the level of regions affected by the 2013/14 floods. As an example, the analysis for the EnvironmentAgency suggested a cost of damage to residential properties of £320m. The CCRA 2017 analysis in theselected scenario (four degrees warming; a population increase of 10% to 83 million people, and a reductionin the current levels of adaption) projects an increase in the number of properties of 129%. Assuming no
95 Chatterton, J., Clarke, C., Daly, E., Dawks, S., Elding, C., Fenn, T., Hick, E., Miller, J., Morris, J., Ogunyoye, F., Salado R. (2016), ‘Thecosts and impacts of the winter 2013 to 2014 floods’, Report for the Environment Agency, SC140025/R1:https://www.gov.uk/Government/uploads/system/uploads/attachment_data/file/501784/The_costs_and_impacts_of_the_winter_2013_to_2014_floods_-_report.pdf96 Sayers et al (2016). The analysis of future flood risk in the UK using the Future Flood Explorer (FFE). Proceedings of Floodrisk2016.Paul Sayers, Matt Horritt, Edmund Penning-Rowsell, Andrew McKenzie and David Thompson. E3S Web Conf., 7 (2016) 21005 DOI:http://dx.doi.org/10.1051/e3sconf/20160721005

66 AECOM
change in the (real) average value of those properties97, the potential damage of a similar series of floods in2050 is estimated at £733m. Put another way, if the number of at-risk properties increases by 129%, thedamage of a similar series of floods also increases by 129%.
This approach gives an indication of the likely change in impact as economic exposure increases. Moreover,the composition of that change in damage may also be revealing.
The first column of Table 22 reports the estimates directly from the analysis for the Environment Agency. Thesecond column then reports the growth rates (change in extent) from the 2017 CCRA. The third column is theresult of applying the growth rates to the historical damage estimates i.e. the estimated damage projected in2050. The final two columns then calculate the share of each damage category in the final totals, in 2013/14and 2050.
The results in the table suggest an overall increase in damage of 71%, from £1.3bn to £2.2bn (in 2013/14prices). The two rightmost columns in the table compare the distribution of that damage across categories.The figures show that more of the damage is concentrated in housing (rising from 25% to 33%). The growth issimilar for businesses but starting from a lower base (21% to 29%). Table 22 does, however, only applygrowth rates to some element of the 2013/14 impacts. It is likely that some other components would also growover time, such as those costs that relate to emergency measures.
Discussion and scope for improvement
Impacts that are not captured in this approach because of a lack of data/evidence are:
· The consequent losses in economic activity from the damage/disruption to economic assets.
· Increases in insurance costs (in effect, the annuitised version of the insurable damage costs).
It is important to note that this analysis does not show the impact of a UK-wide flood event. Instead, theanalysis essentially replays the flooding seen previously in the south of England but with a differentcomposition of economic assets on the floodplains. It is this that yields the alternative damage measure.
Table 22. Comparison of economic impacts of a flood in 2013/14 and 205098,99
Category 2013/14(£m)
Change inextent (%)
2050(£m)
2013/14(%)
2050 (%)
Residential properties 320 129 733 25 33
Businesses 270 135 635 21 29
Temporary accommodation 50 - 50 4 2
Motor vehicles, boats, caravans 37 - 37 3 2
Local authorities/local Government infrastructure 58 - 58 4 3
97 This is fine to the extent that no inflation figures are applied on top of these impacts.98 Chatterton, J., Clarke, C., Daly, E., Dawks, S., Elding, C., Fenn, T., Hick, E., Miller, J., Morris, J., Ogunyoye, F., Salado R. (2016), ‘Thecosts and impacts of the winter 2013 to 2014 floods’, Report for the Environment Agency, SC140025/R1:https://www.gov.uk/Government/uploads/system/uploads/attachment_data/file/501784/The_costs_and_impacts_of_the_winter_2013_to_2014_floods_-_report.pdf99 Sayers et al (2016). The analysis of future flood risk in the UK using the Future Flood Explorer (FFE). Proceedings of Floodrisk2016.Paul Sayers, Matt Horritt, Edmund Penning-Rowsell, Andrew McKenzie and David Thompson. E3S Web Conf., 7 (2016) 21005 DOI:http://dx.doi.org/10.1051/e3sconf/20160721005

AECOM 67
Category 2013/14(£m)
Change inextent (%)
2050(£m)
2013/14(%)
2050 (%)
Emergency services 3.3 65 5.5 0 0
Flood risk management infrastructure/service 147 - 147 11 7
Utilities: energy 0.8 -24 0.6 0 0
Utilities: water 29 -38 18 2 1
Transport: road 180 69 304 14 14
Transport: rail 110 36 150 8 7
Transport: ports 1.8 - 1.8 0 0
Transport: air 3.2 - 3.2 0 0
Other communications (telecom) - 61 - - -
Public health and welfare 25 63 41 2 2
Education 1.6 48 2.4 0 0
Agriculture 19 39 26 1 1
Wildlife sites 2.4 27 3.1 0 0
Heritage sites 7.4 - 7.4 1 0
Tourism and recreation 3.5 - 3.5 0 0
TOTAL 1,300 71 2,226 100 100
5.3 Supplementary analysisFor the first two ecosystem services considered in the pilot (provisioning services for crops and livestock, andfor water supply), the analysis used input-output tables from the Office for National Statistics (ONS) to modelthe interdependencies between industries. It was by this approach that the analysis examined how changes inecosystem services could have wider economic impacts through supply chains and from income/expenditureeffects. The ONS only publishes such tables at the UK level and, consequently, the model developed for thisproject only generates impacts at a UK level. The model does not, by itself, provide estimates of anyeconomic impacts at a regional level.
The first two pieces of analysis in this section show how the UK-level impacts from the main analysis could bedisaggregated by region. This is shown for the acute shock to crops and livestock, and the effects of droughton water supply. The final piece of analysis assesses the sensitivity of the CPI in the crops and livestockcases to alternative price effects. This shows how the impacts in the model are (by design) linear such that a50% increase in prices leads to a CPI impact that is half that from a doubling (100% increase) in prices.
Regional impacts of an acute shock to crops and livestock in 2050
Using ONS data on regional GVA and employment (for 2010), Table 23 and Table 24 disaggregate the GVAand employment impacts from the analysis of the acute shock to crops and livestock (the analyst-led results).The implicit assumption is that the impact by region is proportional to each region’s share of industry GVA. Forexample, in 2010, Scotland accounted for 16% of GVA in agriculture, forestry and fishing (SIC Section A). Inthe disaggregation of the UK-level results, that means that 16% of the UK reduction in agriculture GVA isassumed to occur in Scotland. The method is the same for employment, but using regional employment data,rather than regional GVA.

68 AECOM
This is, of course, a relatively unsophisticated approach. A more detailed analysis would distinguish thedifferent kinds of activity within agriculture, forestry and fishing in each region and form judgements about therelative exposure of each activity to the type of shock that is being tested, but this is beyond the scope of thepresent pilot.
As regions that account for higher shares of UK agriculture, areas like Scotland and the East of England bearlarger reductions in agriculture GVA and employment than regions in which agriculture is smaller (such as theNorth East, and especially London). However, the UK-level analysis earlier in this report highlighted thesupply-chain effects of the shock to crops and livestock. A region may still be exposed to economic impactsthrough these supply chains, even if there is relatively little agriculture in that region. This can be seen in thesmall reductions in agriculture GVA and employment in London but larger impacts in manufacturing (whichincludes food and beverage production) and especially accommodation / food services. The results for theNorth West tell a similar story, with a greater impact in manufacturing (the food, drink and tobacco component)than in accommodation / food services.
Based on the (proportional) disaggregation approach applied here, the column totals at the bottom of Table 23and Table 24 suggest that, while agriculture-heavy regions in the UK could see large impacts on theiragriculture industries, other regions may be indirectly exposed because of the way in which reductions in theavailability of agriculture products have knock-on effects to other industries. The results suggest that, whilethe impacts on agriculture are larger in Scotland and the East of England (because their agriculture industriesare larger), other regions might ultimately see larger total impacts, especially those that have large hospitalityand catering industries.

AECOM 69
Table 23. GVA impacts of an acute shock to crops and livestock in 2050, by industry and region (£2010m)
LONDON SOUTH
EAST
EAST OF
ENGLAND
SOUTH
WEST
WEST
MIDLANDS
EAST
MIDLANDS
YORKSHIRE
AND THE
HUMBER
NORTH
WEST
NORTH
EAST
WALES SCOTLAND NORTHERN
IRELAND
A - Agriculture, forestry and fishing -6 -128 -173 -138 -98 -109 -111 -67 -36 -25 -183 -52
B - Mining and quarrying -3 -3 -1 -6 -1 -3 -3 -3 -3 -1 -35 -1
C – Manufacturing -601 -591 -750 -563 -650 -875 -851 -915 -231 -364 -1,007 -397
D - Electricity, gas, steam and air conditioning supply -55 -65 -20 -37 -44 -36 -42 -37 -27 -21 -54 -7
E - Water supply; sewerage, waste management/remediation -18 -27 -20 -18 -18 -13 -14 -17 -6 -11 -19 -4
F – Construction -95 -93 -63 -48 -46 -38 -43 -57 -18 -22 -50 -14
G - Wholesale and retail trade -315 -350 -219 -167 -168 -154 -154 -231 -62 -67 -160 -63
H - Transportation and storage -241 -157 -106 -76 -83 -80 -86 -109 -31 -32 -86 -21
I - Accommodation and food service activities -1,659 -1,056 -581 -716 -575 -373 -503 -792 -221 -279 -658 -159
J - Information and communication -370 -223 -66 -52 -56 -31 -41 -70 -22 -17 -42 -11
K - Financial and insurance activities -776 -163 -86 -99 -88 -44 -88 -115 -27 -29 -113 -21
L - Real estate activities -499 -234 -149 -136 -101 -64 -87 -110 -33 -59 -116 -27
M - Professional, scientific and technical activities -562 -268 -150 -103 -78 -68 -72 -144 -29 -30 -106 -19
N - Administrative and support service activities -270 -160 -95 -76 -77 -71 -70 -104 -27 -29 -74 -16
O - Public administration and defence; compulsory socialsecurity
-22 -20 -11 -16 -9 -9 -11 -13 -6 -7 -13 -5
P – Education -71 -70 -39 -34 -40 -29 -35 -46 -17 -19 -36 -12
Q - Human health and social work activities -30 -26 -16 -16 -17 -13 -17 -23 -9 -10 -20 -6
R - Arts, entertainment and recreation -50 -28 -18 -12 -11 -11 -12 -19 -5 -5 -18 -4
S - Other service activities -53 -43 -25 -21 -18 -15 -15 -25 -7 -8 -16 -5
Total -5,697 -3,704 -2,590 -2,334 -2,178 -2,037 -2,255 -2,897 -817 -1,035 -2,805 -846

70 AECOM
Table 24. Employment impacts of an acute shock to crops and livestock in 2050, by industry and region (‘000s)
LONDON SOUTH
EAST
EAST OF
ENGLAND
SOUTH
WEST
WEST
MIDLANDS
EAST
MIDLANDS
YORKSHIRE
AND THE
HUMBER
NORTH
WEST
NORTH
EAST
WALES SCOTLAND NORTHERN
IRELAND
A - Agriculture, forestry and fishing 0.0 -2.1 -2.5 -3.6 -3.0 -1.4 -1.6 -1.8 -0.6 -1.7 -3.6 -2.0
B - Mining and quarrying 0.0 -0.1 0.0 -0.1 0.0 -0.1 -0.1 0.0 0.0 0.0 -0.6 0.0
C – Manufacturing -3.1 -3.5 -4.0 -4.3 -4.8 -6.6 -6.1 -6.6 -1.8 -2.5 -5.5 -1.5
D - Electricity, gas, steam and air conditioning supply -0.1 -0.6 -0.1 -0.4 -0.3 -0.3 -0.3 -0.4 -0.2 -0.2 -0.6 0.0
E - Water supply; sewerage, waste management/remediation -0.1 -0.1 -0.1 -0.1 -0.1 0.0 0.0 -0.1 0.0 0.0 -0.1 0.0
F – Construction -0.9 -1.4 -0.9 -0.7 -0.7 -0.6 -0.7 -0.9 -0.3 -0.4 -0.7 -0.3
G - Wholesale and retail trade -2.9 -3.5 -2.5 -2.2 -2.2 -1.8 -2.0 -2.7 -0.8 -1.1 -1.9 -0.7
H - Transportation and storage -2.4 -1.7 -1.4 -1.0 -1.2 -1.1 -1.2 -1.6 -0.4 -0.5 -1.1 -0.3
I - Accommodation and food service activities -25.6 -20.2 -12.0 -16.5 -11.3 -9.4 -11.8 -16.0 -5.1 -8.0 -14.4 -4.1
J - Information and communication -1.5 -0.9 -0.4 -0.3 -0.3 -0.2 -0.3 -0.4 -0.1 -0.1 -0.3 -0.1
K - Financial and insurance activities -1.1 -0.4 -0.2 -0.3 -0.2 -0.1 -0.3 -0.3 -0.1 -0.1 -0.3 -0.1
L - Real estate activities -1.1 -0.6 -0.5 -0.4 -0.3 -0.3 -0.3 -0.4 -0.2 -0.1 -0.3 -0.1
M - Professional, scientific and technical activities -4.1 -2.6 -1.5 -1.2 -0.9 -0.9 -0.9 -1.6 -0.5 -0.5 -1.1 -0.2
N - Administrative and support service activities -2.9 -1.9 -1.4 -1.0 -1.1 -1.1 -1.1 -1.6 -0.5 -0.5 -1.2 -0.3
O - Public administration and defence; compulsory socialsecurity
-0.3 -0.2 -0.1 -0.1 -0.1 -0.1 -0.1 -0.2 -0.1 -0.1 -0.2 -0.1
P – Education -1.0 -1.2 -0.7 -0.7 -0.7 -0.5 -0.7 -0.8 -0.3 -0.4 -0.5 -0.2
Q - Human health and social work activities -0.3 -0.4 -0.2 -0.3 -0.2 -0.2 -0.3 -0.4 -0.1 -0.1 -0.3 -0.1
R - Arts, entertainment and recreation -1.0 -0.7 -0.5 -0.6 -0.4 -0.3 -0.4 -0.6 -0.2 -0.2 -0.5 -0.1
S - Other service activities -0.9 -0.8 -0.5 -0.5 -0.4 -0.4 -0.4 -0.6 -0.2 -0.2 -0.4 -0.1
Total -49.3 -42.9 -29.5 -34.1 -28.3 -25.3 -28.6 -36.9 -11.5 -16.8 -33.5 -10.3

AECOM 71
Regional impacts of a drought in 2050, depending on degradation to water reserves
The regional disaggregation of the economic impacts of droughts applies a different method based on thepattern of water deficits in the ‘degradation’ and ‘no degradation’ cases. Table 25 reproduces the analysis ofwater deficits by region from the previous section (Table 17) and also reports:
· Each region’s share of the water deficit in a drought, with and without degradation of water reserves.
· The GVA impacts by region from sharing out the UK-level results (from the analyst-led approach)using the deficit shares.
Note that the underlying assumption of this approach is that the economic impacts of a drought are confinedto the regions that incur a water deficit. In practice this is an oversimplification: it is unlikely that the tworegions that appear able to withstand a drought regardless of deterioration to water reserves would see noeconomic impact whatsoever, because its firms may form part of the supply chain related to producers inregions that are directly affected.
As an example, a reduction in water supply in the East of England would certainly reduce beverageproduction in the region, but the consequent reduction in beverage supply could affect a hotel or restaurant inthe West Midlands, say. However, as a first approximation it seems reasonable to focus on the regions withthe most severe water deficit.
Table 25. GVA impacts of a drought in 2050, with and without degradation of water reserves, by region
WATER DEFICIT (ML/DAY) SHARE OF TOTAL DEFICIT (%) GVA IMPACT (£2010M)
NO
DEGRADATION
DEGRADATION NO
DEGRADATION
DEGRADATION NO
DEGRADATION
DEGRADATION
East Midlands -138 -387 4.9 6.1 -744 -2,087
East of England -867 -1,196 30.8 18.7 -4,671 -6,451
London -1,261 -1,292 44.8 20.2 -6,794 -6,968
North East 0 -32 0.0 0.5 0 -173
North West 0 -397 0.0 6.2 0 -2,141
Northern Ireland 0 -54 0.0 0.8 0 -291
Scotland 0 -532 0.0 8.3 0 -2,869
South East -549 -917 19.5 14.3 -2,958 -4,946
South West 0 -422 0.0 6.6 0 -2,276
Wales 0 -1,162 0.0 18.2 0 -6,267
West Midlands 0 0 0.0 0.0 0 0
Yorkshire and the Humber 0 0 0.0 0.0 0 0
Total -2,816 -6,392 100.0 100.0 -15,172 -34,476
By the method set out above, Table 25 highlights London’s largely-unchanged (but also large) exposure to theeconomic consequences of a drought, whether or not local water reserves are protected at their currentlevels. In both cases, London seems exposed to the largest regional impact. In contrast, if water reserveswere not maintained then most other regions see either an increase in the size of the GVA impact (a near-tripling for the East Midlands) or move from no exposure to some exposure. The impacts on Wales areparticularly striking: -£6.3bn if water reserves are allowed to deteriorate. This impact would place it third, afterLondon and the East of England. What makes this results striking is that Wales has a much smaller regional

72 AECOM
economy than the aforementioned areas, representing a larger impact relative to its size. These results followfrom the initial analysis of water deficits.
Sensitivity of the UK CPI to changes in global agriculture prices
In the crops and livestock analyses, a doubling of global agriculture prices was modelled, based on the2007-08 food crisis. This led to an increase in the CPI of 3.4%; an estimate at the upper end of the rangeowing to the assumption of 100% cost-price pass-through. The response of the CPI in the model to changesin prices is linear such that:
· A doubling (100% increase) in global agriculture prices (as in the main analysis for this pilot)increases the CPI by 3.4%, with 0.4 percentage points of that increase attributable to increases inimport prices. The rest comes from domestic producers also doubling their prices.
· A 50% increase in global agriculture prices increases the CPI by 1.7%, with 0.2 percentage points ofthe increase coming from import prices. This is half the effect of the doubling in the main analysis.
In terms of the plausibility of any sensitivities, there is little evidence on the potential increases in prices as aresult of the kinds of effects modelled above. What evidence is available from past reviews and modellingstudies suggests that a doubling of prices as seen in 2007-08 is currently among the most extreme examplesof global price increases. The effect of larger price increases would follow linearly but the extent to which suchincreases are likely, and might accompany such shocks, remains an area of further research.

AECOM 73
6. Conclusions and recommendations
6.1 ConclusionsThe development and piloting of an NCST approach in this study demonstrates that the loss or degradation ofUK’s natural capital could lead to significant impacts on the national economy by 2050 if actions are notundertaken to curb or adapt to the potential changes. These impacts could be particularly significant for themost at risk sectors, such as the food and beverages sector.
The study also demonstrates proof of concept for a stress test type approach to gauging the impacts ofchanges in natural capital on the economy. In particular, it demonstrates a method to prioritise the impactpathways selected for analysis; map the logic of cause-and-effect between changes in natural capital andeconomic impacts; establishes a model to trace through those impacts to macroeconomic indicators such asGDP and employment; and identifies the challenges posed to comprehensive quantitative modelling imposedby limitations on the present state of knowledge.
Critically, the approach developed and piloted in this project could support decision making for a wide range ofGovernment and private sector stakeholders (see Table 26).
Table 26. Potential users of an NCST
Potential user group Decision-making in which an NCST could be of use
HM Treasury Supporting annual budgetary decision-making e.g. informing budgetary allocations andmeasures as well as Spending Reviews and Comprehensive Spending Reviews
Department for Health Supporting decision-making and budget allocations around preparation for natural capitalrelated public health challenges and estimating the potential costs of such impacts
Department for Business,Energy & Industrial Strategy
Informing the UK national infrastructure plan and industrial strategy e.g. identifying thecontribution of natural capital to productivity/growth and mitigating risks
Local Enterprise Partnerships Identifying risks to the growth of local economies and local employment and developinglocal growth strategies which take into account resilience of natural capital stocks
Cabinet Office Updating the UK National Risk Register to account for environmental change andinforming mitigation planning decisions
DefraInforming the 25 Year Environment Plan for restoring natural capital, and identifyingareas where market failures might require intervention and identifying priority metrics formonitoring natural capital (including with respect to economic impacts)
Environment Agency Supporting decision-making relating to crisis preparation and undertaking national levelrisk assessments which incorporate the economic impacts of flood events
Foreign & CommonwealthOffice
Informing the formulation of international economic, trade, security, and environmentalpolicies
National InfrastructureCommission
Understanding the level of resilience of national infrastructure schemes to future naturalcapital risks
UK and international business Identifying key vulnerabilities in cross-sectoral supply chains and developing moreresilient supply chains
In order to improve the applicability of the NCST developed and piloted in this project, a number of practicalsteps could be taken to communicate and refine the approach:

74 AECOM
· Workshops could be organised with the relevant Government departments to identify the mostsignificant potential applications of the NCST, who might use the approach and when, and anymodifications that might improve its value for specific applications.
· Businesses and sector associations could be invited to comment on the development of scenariosrelevant to particular sectors, explore how the approach could align with the Natural Capital Protocol,and collaborate in adapting the process for business use.
· A multi-lateral discussion (or study) could be initiated to assess the extent to which Government andbusiness will be able to adapt and respond to the potential natural capital changes and economicimpacts identified through the NCST, in order to identify appropriate policy responses.
The pilot NCST undertaken in this project also demonstrated that there are significant uncertainties involved inestimating and quantifying the extent of natural capital risks and the impacts they could have on the economy.It should be emphasised that only a small selection of ecosystem services were examined in the pilot exerciseand it was not possible to aggregate the various impacts across the three ecosystem services explored (dueto the different assumptions and approaches used). As such, each estimate only represents a portion of theaggregate impact on the UK economy of changes in natural capital and the estimates should not beinterpreted as a comprehensive estimate of the cumulative consequences of natural capital loss ordegradation.
One of the lessons from this exercise has been that particular pathways of impact of ecosystem serviceschange on the economy call for bespoke modelling that is tailored to the particular circumstances envisagedin each case. With the current state of knowledge, no single model seems capable of capturing the keyfeatures of the narrative for different ecosystem service changes. The analysis also encountered uncertaintiesover:
· The scale of loss of ecosystem services that should plausibly be considered.
· The possible breach of tipping-points or thresholds beyond which there would be a sharp deteriorationin service provision.
· The ease with which firms can adapt to temporary or longer-term changes in resource availability orproductivity.
As a result, the quantitative estimates produced by the modelling are inevitably subject to a degree ofuncertainty. Drawing an analogy with financial stress testing, which assesses the resilience of financialinstitutions to tail-risk economic shocks, the aim of the exercise was to identify the potential exposure of theeconomy to a decline in ecosystem services that, as far as present knowledge permits, represents aneventuality that society should plan for. Unlike a financial stress test, this analysis cannot rely significantly onhistorical events to determine the parameters for the test because this is likely to be entering unchartedterritory. Also, the set of potential impacts and interactions with regard to natural capital is far more complex.
Further work could be undertaken to begin to address some of these uncertainties and resolve some of theissues identified through the piloting. This might include, for example:
· Improving the evidence base to better describe the risks to the UK’s natural capital and ecosystemservices. This could involve undertaking primary research or aligning with existing research projects(such as the Climate Change Risk Assessment) to fill in key gaps in understanding.
· Creating a framework for the development of stress test scenarios. Such a framework may not onlyprovide useful guidance for those involved in deploying an NCST, but may also facilitate consistentassessments that could be repeated periodically in the same way as financial stress tests are appliedto banks.
· Expanding the scope of the NCST by piloting additional ecosystem services and exploring the extent

AECOM 75
to which adaptation and behavioural responses on the part of businesses could be incorporated toprovide a more realistic assessment of the economic impacts of changes in ecosystem serviceprovision.
6.2 Limitations and caveatsWhile progress has been made through this study, particularly in linking impact metrics to existing economicindicators, it is important to clearly acknowledge that natural capital stress testing is a relatively novel conceptand the approach set out here is necessarily exploratory. The process of designing and testing the approachhas revealed a number of challenges, not all of which could be resolved within the scope of the currentproject, but none of which are considered insurmountable. Some of the key limitations with the approach setout in this report are identified below.
Step 1. Determining the scope of the stress test
· As it stands, the stress test is not designed with any one particular user in mind. Rather, it wasdesigned to demonstrate proof of concept more generally. Future users of the NCST approach mighttherefore wish to tailor the approach to meet their specific needs.
· The pilot was limited to exploring three ecosystem services, which were selected through a rapidprioritisation process. This process assessed the magnitude of potential impacts or sectordependencies using a high, medium, low scale informed by a review of the literature and on the basisof expert judgment.
· The criteria used to determine the relevance of each ecosystem service to the economy, while allrelevant, may unintentionally bias the selection of services to be included in the quantitativeassessment. This is because only one criterion relates to the importance of the ecosystem service tothe economy while four criteria relate to the availability of methodologies and data that allow for thequantification of impacts on ecosystem services. The current approach to scoring each ecosystemservice using the criteria therefore introduces a bias towards including those ecosystem services(typically provisioning services) which are relatively well studied and more straightforward to model.
· There are generally few examples in the literature of analyses which identify the full range of naturalcapital impacts/dependencies relevant to a particular sector. In the absence of this understanding, itmay be that important ecosystem service impacts/dependencies were missed with implications for theprioritisation of services for investigation through the modelling.
· Sectors were only assessed for vulnerability at the Standard Industrial Classification sector level.However, as noted in Section 5.5, it is at the individual industry level that the scale of impacts beginsto clearly emerge. Using sub-sectors rather than top-tier sectors in the qualitative assessment wouldalso provide a more detailed picture of relative exposure and, more importantly, a more accuraterepresentation of the overall dependence of the sector (and overall economy) on each ecosystemservice.
Step 2. Formulating the stress test scenario
· Formulating a ‘tail-risk’ scenario for natural capital is a highly subjective task. Professional/expertjudgement must be applied to maintain the plausibility of the scenario, but the severity of the scenariomust ultimately be set by the NCST user. The risk of subjectivity was addressed in the pilot throughthe application of already documented scenarios or projections, but this approach limits the scope ofthe scenarios where existing estimates of ‘tail-risk’ impacts are not available.
· The scenario development process drew on various projections for the 2050s. This decade wasselected (rather than 2080s) for its greater anticipated relevance to decision-makers. However, thismay risk ignoring longer-term impacts of current natural capital degradation trends.

76 AECOM
· The scenario did not include anticipated responses from policy-makers or sectors. This approach wastaken in order to limit the amount of speculation involved in the scenario development process, butmight mean that some of the consequences associated with changes in natural capital are somewhatoverstated. Nonetheless, it serves to highlight the scale of impact that might occur in the absence ofadaptation responses, which, in turn, shows the importance of implementing those measures. TheNCST therefore has an important role to play in highlighting the risks that policy-makers andbusinesses need to be aware of so they can put in place measures to manage those risks.
Step 3. Quantifying ecosystem service changes
· No modelling of the physical changes in ecosystem service provision was undertaken for thepurposes of this project. Rather, this project drew on the findings of published scientific studies thathave devoted significant resources to understanding and modelling the relationships between naturalcapital and ecosystem service flows. The quantification of changes in ecosystem service provision inthis study is therefore limited to the information that is readily available in the published literature.
· The available literature rarely documents the likelihood of declines in ecosystem services occurring ina systematic fashion. While the stress test does not require an indication of likelihood, an indication ofprobability is important to select ecosystem service changes that are compliant with the ‘tail-risk’criteria and consistent with the plausible-worst case scenario.
· Changes to ecosystem service provision over time were assumed to be linear and therefore ignoreany potential threshold effects or tipping points, for example, where ecosystems are stressed beyondthe point from which they are able to recover, or where there is a step-change in ecosystem serviceproductivity as a result of a shock or stress.
· Due to data limitations, it was not possible to quantify all of the potentially significant changes to thepiloted ecosystem services. Likewise, the loss of biodiversity and the related loss of resilience are notrepresented in the quantification due to the complexity of the task and the paucity of data.
· The scenario assumes the occurrence of several different negative effects taking place in oneparticular year (e.g. agricultural disease outbreak, flooding etc.). The likelihood of these eventsoccurring simultaneously is not quantified and may be low.
Step 4. Valuing economic impacts
· International ecosystem service change impacts are less well documented than UK ecosystemservice changes. Given the UK trade balance, these changes could have significant impacts on theUK economy. However, there are few robust projections of how such changes would affect worldmarkets and import availability.
· The allocation rules (that is, how reductions in outputs are distributed across final consumers) werekept purposefully simple for this exercise. The allocation rules can, however, make a large differenceto the overall impacts and therefore further work to develop the sophistication and realism of theallocation rules based on additional market information is warranted. Likewise, the economic impactmodelling (for water supply) assumes that there are no substitution effects and no changes to theefficiency with which water supplies are used as an input to production.
· In a more comprehensive stress test, the allocation rules and assumptions with regard tosubstitutability would ideally better reflect regulatory factors (for example, some industries might cometo arrangements or be required to bear more or less of the burden associated with ecosystem servicechange) or other behavioural factors (in the event of extreme changes, firms might find substitutes oreconomise on inputs).
· The range and extent of behavioural responses (including adaptation) included in the modelling andanalysis are limited, largely by the availability of data. As noted in Section 3.2, certain actions(behavioural responses) could mitigate or amplify certain effects which means that some of the

AECOM 77
impacts reported in the pilot exercise may be somewhat overstated. However, this is offset by the factthat many aspects of risk have been excluded in the analysis, due to lack of information as discussedabove, and which would lead the analysis to under-estimate potential economic impacts.
6.3 RecommendationsThe results of the pilot exercise (Section 5) demonstrate that an NCST is a feasible approach for exploring thescale of the impacts on the economy associated with changes in natural capital, although there are limitations.An overview of the key recommendations for addressing these limitations is set out below.
Step 1. Determining the scope of the stress test
· As the ability to model ecosystem service changes improves, the feasibility of modelling shouldbecome less of a priority when selecting the ecosystem services to include. The full value of an NCSTwill be realised with the inclusion of progressively more ecosystem services.
· The sector review process might be conducted more robustly if sector associations or businessesfrom several sectors were involved in the scoping process.
· The sector review would be improved by splitting sectors into sub-sectors, as exposure to naturalcapital risk can vary significantly within sectors.
· The lack of sector-specific natural capital risk assessments (at time of writing) makes the scopingprocess more labour-intensive. Such assessments would be valuable resources for sectors, and couldcontribute to the individual efforts of businesses applying the Natural Capital Protocol.
Step 2. Formulating the stress test scenario
· The scenario used for the purposes of the NCST should be developed to be able to address thespecific interests of the user. These should be clarified at the outset, and the scope of the test (interms of the plausibility and severity of the changes) should be similarly fixed. An expert workshopmight offer an effective and efficient way of defining the parameters of the scenario and, as notedpreviously, can help to establish credibility.
Step 3. Quantifying ecosystem service changes
· The CCRA and other assessments that are conducted and published on a regular basis and thatmake use of consistent approaches have the potential to provide an ideal evidence base for a NCST.Where there are specific policy questions to be addressed by an NCST that could be evidencedthrough these routine assessments, there may be an opportunity to ascertain whether the scope andoutputs of these assessments could be adjusted in such a way that they could provide the datanecessary to inform more routine application of stress testing.
· Future research commissioned on UK ecosystem service change could be encouraged, whereappropriate, to include projections or scenarios that are compatible with CCRA evidence.
Step 4. Valuing economic impacts
· The current assumptions around substitution effects (and potentially substitution between forms ofcapital) and resource efficiency could be refined to provide a more realistic assessment of theeconomic impacts of changes in ecosystem service provision.
· More sophisticated allocation rules could be developed to represent more accurately the distributionof reductions in outputs across final consumers.
· More work is required to understand and model behavioural responses of different users to changesin ecosystem service provision.

78 AECOM
Next steps
Following the release of this report, and the NCST approach which it contains, an appropriate next step maybe for the intended users of the NCST to pilot the approach, report back on its fitness-for-purpose, andrecommend how the approach could be fine-tuned to better address their specific needs.
In addition, there are several areas of work that could be undertaken more immediately to refine the approachprior to its uptake by decision-makers. These include:
· Holding a meeting/workshop to present and discuss the report findings with UK Governmentdepartments, and discuss next steps that could be taken. For example, this could involve the UKGovernment (perhaps led by HM Treasury and/or the NCC) setting up an initiative to explore how theNCST developed in this project could be further developed/adapted by Government departments.
· Undertaking further piloting with all of the eight identified priority ecosystem services. This wouldbetter demonstrate the capacity of the NCST to comprehensively describe potential impacts ofchanges in ecosystem service provision that happen in combination.
· Developing a framework for formulating stress test scenarios. This might involve the design of expertworkshops and a process for systematically reviewing recent peer-reviewed and grey literature. Sucha framework could not only provide useful guidance for those involved in deploying an NCST, butmight also facilitate consistent assessments that could be repeated periodically in much the same wayas financial stress testing is applied to banks.
· Undertaking ecological modelling to better describe the non-linearity in UK ecosystem service deliveryas natural capital deteriorates (this could align with any existing projects).
· Adapting the approach to better address the needs of business users, perhaps through a jointcollaboration with the Natural Capital Coalition.
· Developing guidance for research institutions to better steer natural capital and ecosystem services-related research towards generating outputs that facilitate natural capital stress testing.
It is clear that more work is required to develop the natural capital stress testing approach further, toimprove the robustness of results and increase its applicability. However given that the economic riskshighlighted in this first pilot testing exercise are quite significant, some additional investment in thisapproach appears to be warranted.

AECOM 79
Appendix A. Methodology for developingthe approachOverview
This section provides a more detailed overview of the method taken in this project to develop and pilot anapproach to undertaking an NCST.
Initial review
In order to inform the design of the approach to undertaking an NCST and identify where it might be useful todecision makers, a review of the literature was undertaken drawing on the following key sources:
· Anger et al. (2014), ‘UK National Ecosystem Assessment Follow-on. Work Package Report 2:Macroeconomic implications of ecosystem service change and management: A scoping study’.
· eftec (2016), ‘Developing a UK national economy natural capital stress-test’.
· HSBC (2013), ‘Natural Capital: Identifying implications for economies’.
· Natural Capital Declaration (2015), ‘Towards including natural resource risks in cost of capital: state ofplay and the way forward’.
· Nous Group (2014), ‘The Future Economy Project: The economic impact of diminishing natural capitalin Victoria’.
· Ofwat (2016), ‘Monitoring financial resilience’.
· Stern (2007), ‘The Economics of Climate Change: The Stern Review’.
· The Bank of England financial stress testing reports.
· The Natural Capital Committee ‘State of Nature’ natural capital reports.
· Trucost reports on natural capital exposure risk for various economic sectors.
In addition to the literature review, a series of semi-structured interviews were held with key stakeholders andtechnical experts including:
· Annela Anger-Kraavi – Lecturer in Economics at Cambridge University and lead author of theUKNEA-FO work package on macroeconomic implications of ecosystem service change.
· Colin Smith – Economic Advisor, Defra.
· Helen Dunn – Former Economic Advisor, Defra.
· Mark Gough – Executive Director, Natural Capital Coalition.
· Paul Ekins OBE – Professor of Energy and Environment Policy, University College London.
· Peter Costigan – Former Deputy Director and Science Co-ordinator for Natural EnvironmentEvidence, Defra.
Two workshops were held on 13 December 2016 and 23 January 2017, respectively, to discuss the proposed

80 AECOM
scope and methodology with key stakeholders from a range of Government departments, academicinstitutions, private sector organisations, and NGOs. A full list of attendees is set out in Table 27.
Table 27. Workshop attendees
No. Name Organisation
1 Karen Ellis WWF-UK
2 Toby Roxburgh WWF-UK
3 Steve Smith AECOM
4 Petrina Rowcroft AECOM
5 Chris White AECOM
6 Max Heaver AECOM
7 Richard Lewney Cambridge Econometrics
8 Chris Thoung Cambridge Econometrics
9 Annela Anger-Kraavi University of Cambridge
10 Julian Harlow Natural Capital Committee Secretariat
11 Peter Costigan Former Deputy Director at Defra
12 Colin Smith Defra
13 Alastair Johnson Defra
14 Henry Leveson-Gower Defra
15 Neha Dutt Defra
16 John Ayre Defra
17 Phil Cryle eftec
18 Eoin Sinnott Valuing Nature Initiative
19 Steve Arnold Environment Agency
20 Hannah Pitts World Business Council on Sustainable Development
21 Ulrike Hotopp Simetrica
22 Katherine Bolt RSPB
23 Michael Sheren Bank of England
24 Richard Hardwicke Trucost / Standard & Poor’s
The results of this exercise confirmed that natural capital stress testing is a new and emerging area whichcould be undertaken in a number of different ways and could have a range of different policy applications andpotential users.
The broad consensus that emerged from the scoping exercise was that there is currently a gap in theevidence in terms of establishing clear, quantifiable links between changes in natural capital andmacroeconomic indicators. This was raised in eftec (2016) ‘Developing a UK national economy natural capitalstress-test’, in the UKNEA-FO report on the macroeconomic implications of ecosystem service change, aswell as by the NCC in their advice to the Government on research priorities which stated:

AECOM 81
“The impact of changes in natural capital upon conventional measures of UK economic performance remainsan open empirical question…this topic explicitly focusses upon conventional financial measures of jobs,growth, and economic activity. It therefore excludes non-market economic and socio-cultural measures ofwellbeing.
Key questions:
· How do changes in our natural capital affect measures such as national income, growth and jobs bothdirectly and indirectly?
· What sort of frameworks do we need to examine, measure and model these links effectively?
· How do these changes vary across the short- and long-term?”100
It was also identified during the scoping phase that understanding the impact of potential changes in naturalcapital on macroeconomic indicators would be a useful and important policy question to answer for decisionmakers in Defra, Treasury, and other Government departments; with one of the workshop respondents statingthat, “ultimately, the issues that keep decision makers awake at night are GDP, unemployment, and inflation”.
From this exercise it was decided that the primary focus of an NCST for the UK should be on developing amethod that could be used to assess how future changes in natural capital could potentially affect theheadline macroeconomic indicators for the UK economy.
A further issue that was raised during the scoping phase was that one of the challenges with this approach isthat it may be difficult to identify observable impacts on macroeconomic indicators at a UK wide level fromnatural capital change, and that relying on UK wide indicators might mask important impacts on particulareconomic sectors. Providing more detailed analysis on a sectoral level was therefore identified as being usefulin providing a clearer picture of the risks. It was also identified that this might encourage businesses operatingwithin high risk sectors to undertake more detailed stress testing to identify the extent of the risks to theiroperations. As such, in addition to the headline figures provided for the UK economy, it was decided thatsectoral impacts of changes in natural capital would also be explored using the stress test approach.
Identifying sector dependence on ecosystem services
Alongside the literature review, interviews, and workshops, a mapping exercise was undertaken to identify thelevel of ecosystem service dependence by economic sector. This task was based on a recommendation setout in the UKNEA-FO which states:
“Given the complexity of ecosystems and the economic system and that the stocks and flows of natural capitalare still largely unknown, a reasonable first step would be identifying the links between final ecosystemservices and economic sectors. This could be done by constructing a matrix with ecosystems services (rows)and economic sectors (columns) in order to map the potential inputs from ecosystem services to economicsectors.”101
Following the UKNEA-FO guidance, a matrix was developed using the Common International Classification ofEcosystem Services (CICES) Version 4.3102 (note this does not include abiotic services from natural capital
100 Natural Capital Committee (2015), ‘Advice to Government on research priorities’.101 Anger et al. (2014), ‘UK National Ecosystem Assessment Follow-on. Work Package Report 2: Macroeconomic implications ofecosystem service change and management: A scoping study’, UNEP-WCMC, LWEC, UK.102 Available to download at: http://cices.eu/

82 AECOM
such as minerals or fossil fuels) and the UK Standard Industrial Classification of Economic Activities 2007.103
The dependence of each economic sector on each ecosystem service was then assessed using a simplescoring system: High = 2; Medium = 1; and Low = 0.
The scores were aggregated across the services to give a total score for each economic sector. The sectorwas ranked as ‘high’ if the score was in the top tertile, medium if in the middle tertile, and low if in the bottomtertile. A similar process was also used to identify the aggregate level of dependence of the UK economy oneach ecosystem service.
The assessment was undertaken using professional judgement, with rapid literature reviews being undertakenfor sectors for which there was a significant degree of uncertainty. The scores were then reviewed and sense-checked internally. A summary of the results is provided in Table 28 and the full results are available inAppendix B.
Table 28. Economic sectors with high (l) or medium (l) dependence on ecosystem services
Economic sector
l = Agriculture, forestry and fishing
l = Water supply; sewerage, waste management and remediation activities
l = Manufacturing
l = Accommodation and food service activities
l = Arts, entertainment and recreation
The findings were presented at the workshop on 13 December 2016 and there was a general consensus that,while this is a simplistic, qualitative scoring approach, the findings nonetheless provided a reasonablereflection of the dependence of the UK economy on ecosystem services.
In order to build on this approach it was noted that future assessments could be undertaken whichdisaggregated each economic sector by sub-sector. Further assessments could also be undertaken whichmove beyond a simplistic high, medium, low scoring system and draw more heavily on quantitative data toestablish sector dependence; potentially drawing on the results of the quantitative stress test model oncedeveloped.
Identifying priority services
Once a high level overview of the dependence of each economic sector on ecosystem services in the UK hadbeen established, the next step was to draw on this information to identify which services should form thestarting point for developing and piloting the NCST approach. Identifying a core number of priority services tofocus on in more detail was important at this stage given that CICES v4.3 includes 48 distinct ecosystemservices, some of which have limited relevance to the UK economy and some of which are relevant but aredifficult to quantify in economic terms.
A prioritisation exercise was therefore undertaken using the method set out in Khan et al. (2013)104 and White
103 Available to download at: https://www.gov.uk/Government/publications/standard-industrial-classification-of-economic-activities-sic104 Khan, J., Greene, P. and Wei Hoo, K. (2013) Measuring UK Woodland Ecosystem Assets and Ecosystem Services [online] availableat http://www.ons.gov.uk/ons/guide-method/user-guidance/well-being/publications/measuring-the-uk-woodlands-ecosystem.pdf

AECOM 83
et al. (2015).105 This approach involved assigning a score to each ecosystem service of: High (2); Medium (1);and Low (0) against the following criteria:
· Whole-economy relevance (drawing on the results from Step 1).
· Policy relevance.
· Relative risk to future provision.
· Availability of methods for physical terms analysis.
· Availability of methods for monetary terms analysis.
· Availability of data for physical analysis.
· Availability of data for monetary analysis.
An aggregate score was calculated and each service was ranked as ‘high’ if the score was between 9 and 14;‘medium’ if between 5 and 9; and ‘low’ if between 0 and 5. The scoring was based on professional judgementand was ‘sense checked’ through an internal review process.
As set out in Table 29, the results of the prioritisation exercise identified eight ‘high’ priority services (note, forease of interpretation a simplifying classification framework has been used to present the results, the fullresults using the CICES v4.3 classification, are available in Appendix B). A further prioritisation exercise wasthen undertaken to identify three services to focus on for the purposes of piloting the NCST approach. Theselected services were identified as: crops and livestock; water supply; and flood regulation. The reasoning forthe selection of these three services is set out in Table 29.
Table 29. Ecosystem services prioritised for inclusion in the pilot stress test
Ecosystemservice
Further prioritisation exercise Selected forpiloting?
Crops andlivestock
High policy relevance, significant impacts on future provision, good approaches forquantification, and demonstrated impact on macroeconomy (2007/08 food price spikes) ü
Fisheries Similar type of service to ‘crops and livestock’ although more challenging to detect animpact on the wider economy and more difficult to quantify impacts on future provision û
Timber Challenging to identify a scenario leading to a change in timber provision that isdetectable at an economy wide level û
Water supply Significant impacts on future provision of service and potential for diffuse impactswhereby the whole economy becomes more vulnerable as a result of water scarcity ü
Air qualityregulation
Growing policy interest in this service although challenging to link to macroeconomicindicators û
Floodregulation
Key issue for a range of economic sectors, significant future impacts on this servicefrom a changing climate, and likely to be possible, although challenging, to quantify ü
Global climateregulation
While an important service, a stress test would be unlikely to add value given previousand ongoing efforts in this area û
105 White et al. (2015), ‘Developing ecosystem accounts for protected areas in England and Scotland: Main Report’, Department for Food,Environment & Rural Affairs/The Scottish Government.

84 AECOM
Ecosystemservice
Further prioritisation exercise Selected forpiloting?
Tourism andrecreation
Significant economic sector although challenging to identify natural capital scenarioswhich impact the ‘quantity’ rather than the ‘quality’ of the service û
The findings were presented at the workshop on 13 December 2016 and there was a general consensus thatthe three services identified for inclusion within the NCST approach were reasonable given that they reflectedboth chronic and acute effects and are associated with relatively un-contested approaches to monetaryvaluation and, as such, would allow demonstration of proof of concept.
Developing an underlying structure for the NCST
With the priority services identified for inclusion within the model, the next step was to develop a framework forlinking high level drivers of change in natural capital (under various scenarios) to macroeconomic impacts inorder to provide the underlying logical structure for developing the NCST approach. An outline of theframework developed is set out in Figure 17.
Figure 17. Outline of underlying logic framework
Using this structure, impact pathways were developed for each of the three services as set out in thediagrams overleaf.
The proposed logical structure of the approach using the three impact pathways was presented at theworkshop on 13 December 2016 and there was a general consensus that it provided a coherent underlyinglogic to the development of the NCST approach and that there were no fundamental gaps in the pathwaysidentified.
However, it was noted that it is important to recognise that the linear impact pathways set out in the diagramsare more likely to be circular in practice as economic impacts and responses generate feedbacks to naturalcapital. As such, it was stressed that it is important to separate out ‘impacts’ and ‘responses’ when developingthe scenarios. For example, providing clarity over whether policy decisions are included as drivers of naturalcapital change or responses to such changes.
High level drivers ofchange drawn from the
UKNEA e.g. climatechange
Lead to a range ofimpacts on natural
capital e.g. changes inprecipitation patterns
Which in turn lead toimpacts on
ecosystem servicese.g. lower crop output
That lead to impactson the economy and
macroeconomicindicators such as GDP

AECOM 85
Figure 18. Impact pathway for ‘crops and livestock’ service

86 AECOM
Figure 19. Impact pathway for ‘water supply’ service

AECOM 87
Figure 20. Impact pathway for ‘hazard regulation’ service

88 AECOM
Developing scenarios
In addition to the issue of separating out impacts and responses, a number of additional points were alsoraised during the interviews and workshops for consideration when developing the scenarios. Some of the keypoints included:
· Capturing the cumulative impacts on the economy when developing scenarios due to theinteractions of multiple factors affecting output of a particular service, and the cumulative effect ofchanges in multiple services on economic output. For example, a scenario focusing solely onmodelling the impacts of a reduction in water availability on crop output and the agricultural sectorwould fail to capture important interactions such as the impact of crop pests and diseases or changesin flood risk on crop output, as well as important cumulative effects across multiple services, such asthe combined impact on the economy from a loss of crop output and a reduction in water availabilityfor other uses such as residential and industrial.
· Considering both acute and chronic impacts such as a gradual ongoing change in serviceprovision as well as changes in the extent and frequency of acute ‘shock’ events. For example,scenarios should capture both an ongoing decline in crop output due to factors such as declining soilproductivity, as well as changes in shock events such as lost output due to flooding or drought events.The combined impacts on overall resilience (i.e. chronic degradation may make the economy morevulnerable to acute events), could also be captured within the scenarios.
· Clarifying the time horizons which the pilot will consider bearing in mind that departments suchas Treasury tend to work in 5-year cycles while bodies such as Defra, the National InfrastructureCommission, DfT, and DCLG tend to plan over longer term horizons.
· Designing scenarios which are plausible to decision makers in order that the outputs are seen ascredible and usable.
In light of this feedback on the underlying structure and development of the scenarios, the approach todeveloping the scenarios began with the five broad drivers of ecosystem change identified in the UKNEA:invasive species, climate change, habitat change, nutrient enrichment and pollution, and overexploitation ofresources. For each of these drivers a literature review was undertaken to identify high level, qualitativenarratives on the extent to which they might change in the future. In order to design scenarios that were likelyto be seen as credible, they were largely drawn from existing scenarios and projections developed for the UKcontext including:
· Beddington (2012), ‘Food, Energy, Water and the Climate: A Perfect Storm of Global Events?’.
· Committee on Climate Change reports on risk assessment, projections of future flood risk, projectionsfor water availability, assessment of climate change impacts on natural capital, and the developmentof climate scenarios.
· Environment Agency (2006), ‘Environment Agency Scenarios 2030’.
· Environment Agency and Natural Resources Wales (2013) ‘Current and future water availability –addendum. A refresh of the Case for Change analysis’
· Foresight Land Use Futures Project (2010), ‘Final Project Report’.
· Lloyds (2015) ‘Food System Shock: The insurance impacts of acute disruption to global food supply’.
· McKenzie & Rosenthal (2012), ‘Developing scenarios to assess ecosystem service tradeoffs:Guidance and case studies for InVEST users’.
· UKNEA chapters on ‘Drivers of change’ and ‘Scenarios: Development of Storylines and Analysis ofOutcomes’.

AECOM 89
An outline of the proposed scenario was presented at the workshop on 23 January 2017. Based on thefeedback gathered it was decided that, for the purposes of the pilot, a time horizon of 2050 would be usedwhich aligned with several of the reports set out above.
In terms of distinguishing between impacts and responses, it was decided that the scenario would encompassthe ‘first order’ impacts of broad policy changes on natural capital such as potential relaxation ofenvironmental legislation or changes in land-use cover in the UK. It was further decided that the scenariowould include assumptions around ‘second order’ effects i.e. how the economy might respond to suchchanges in natural capital such as through changes in the quantity of food imported from internationalmarkets. Finally, it was also decided that the scenario would not include ‘third order’ policy responses to anyof the ecosystem service changes captured within the model such as increasing subsidies in response to adecline in agricultural output or changing the level of adaptation.
Based on the initial literature review and the discussions at the workshop, the finalised scenario narrative foreach of the five drivers was developed as follows:
· Climate change: Globally, the international community fails to meet the required reductions ingreenhouse gas emissions to limit warming to two degrees. The resulting climate scenario in the UKfollows the projections set out in the UKCP09 ‘High Emissions’ scenario on the four degrees ofwarming path. The subsequent impacts cause significant reductions in the amount of water in theenvironment that can be sustainably withdrawn, while also increasing the demand for water during thedriest months. The frequency and magnitude of floods in the UK also rise significantly and causegrowing costs to a range of economic sectors. Globally, changes in the climate system lead to adoubling of international food prices.
· Invasive species: Increasing demand for global imports and a more diverse supply chain, togetherwith changes in the climate and land use, lead to a significant increase in the frequency and severityof pest and disease outbreaks in the UK and growing costs for the agriculture industry.
· Habitat change: Greater emphasis on competing in the international market and securing trade dealsleads to cuts in public subsidies for UK agriculture and there is a marked shift from subsidising foodproduction towards allowing the market to determine the level of agricultural output. This shift leads toa widespread abandonment of agricultural land in upland areas with limited agricultural productivity. Atthe same time, the UK population continues to grow which leads to growing demand for housingresulting in the relaxation of Green Belt restrictions and widespread urban expansion into farmlandareas surrounding cities, increased development of housing infrastructure on floodplains and coastalmargins, and the creation of new towns on areas previously used for agriculture.
· Nutrient enrichment and pollution: Environmental regulations are also relaxed in order to supportintensification of the remaining farms to allow them to compete with less constrained internationalproducers. This leads to increases in livestock stocking densities and a spike in the use of pesticidesand fertilisers which cause short term productivity boosts and longer term increases in soildegradation, water pollution, and loss of natural pollinators. Combined, this creates rising costs foragricultural productivity and water treatment, and reduced capacity of ecosystems to regulate surfacewater flows during flood events.
· Overexploitation of resources: Demand for residential water use grows in line with the increase inpopulation and creates additional pressures on already-stretched water resources in some parts of thecountry. In the drier areas of the country water shortages become commonplace leading to frequentrestrictions. These pressures are further exacerbated by increasing demand for irrigation water due tothe changing climate and the growing demand for water to meet the energy needs of a growingpopulation.
· Quantifying impacts on natural capital and ecosystem services: A more detailed literature reviewwas then undertaken in order to quantify the extent of change in natural capital and the resultingchange in service provision. An outline of the results for each of the three services: crops and

90 AECOM
livestock, water supply, and flood regulation is set out below.
Crops and livestock
Defra statistics on the value of production of different crop and livestock outputs in 2015 were combined with aseries of assumptions and calculations to estimate the resulting change in the provision of crops and livestockresulting from each of the natural capital impacts identified in the impact pathway. An overview of the results isset out in Table 30.
Table 30. Overview of impacts on natural capital from high level drivers and resulting impacts oncrops and livestock
Key impacts Impact on natural capital by 2050s Impact on crops and livestock Quantified
Change in spread ofpests and disease
Increased impacts on winter wheat andbarley from diseases such as BarleyYellow Dwarf virus due to climaticchanges and increased activity of aphidvectors38
- Assuming a 28% reduction inaffected wheat yields and a 75%reduction in affected barleyyields due to an outbreak of theBarley Yellow Dwarf virus106
- Assuming that 95% and 40% ofyields (i.e. winter output) areaffected107,108
- Leads to acute reduction in cropyields of 10.3% of total value by2050 per disease outbreak
ü
Increased impacts on livestock due todiseases such as bluetongue and liverfluke109
- Assuming a bluetongue mortalityrate of 0.06% of dairy and beefcows and 1.25% of sheep110
- Assuming 76% exposure of cowsto liver fluke 111 and loss of milkyield of 3.2% for affected cows112
- Leads to acute reduction inlivestock production of 1.0% oftotal value by 2050 per diseaseoutbreak
ü
Change in risk ofwindthrow / wildfire /storm damage
Increase in wildfire risk113 and loss ofcrops to fire damage
- Assuming repeat of wildfiredamage in 2010/11 where37,380 ha of land burned114
- Assuming 18% of UK land undercrops
ü
106 Crop Bayer Science http://www.bayercropscience.co.uk/our-products/seed-treatment/redigo-deter/bydv/107 Farmers Weekly http://www.fwi.co.uk/arable/spring-wheat-now-makes-up-5-of-uk-wheat-area.htm108 Defra (2015) ‘Provisional 2015 cereal and oilseed rape production estimates’.109 Brown et al. (2017) UK Climate Change Risk Assessment Evidence Report: Chapter 3, Natural Environment and Natural Assets.Report prepared for the Adaptation Sub-Committee of the Committee on Climate Change, London.110 Veterinary Record http://veterinaryrecord.bmj.com/content/161/16/571.6111 Pfizer Animal Health http://beefandlamb.ahdb.org.uk/wp/wp-content/uploads/2013/06/Liver-fluke-in-cattle-costs-and-control.pdf112 AHDB Dairy https://dairy.ahdb.org.uk/market-information/farming-data/milk-yield/average-milk-yield/#.WH5PiNWLS71113 Gazzard et al. (2016), ‘Wildfire policy and management in England: an evolving response from Fire and Rescue Services, forestry andcross-sector groups’114 Brown et al. (2017) UK Climate Change Risk Assessment Evidence Report: Chapter 3, Natural Environment and Natural Assets.Report prepared for the Adaptation Sub-Committee of the Committee on Climate Change, London.

AECOM 91
Key impacts Impact on natural capital by 2050s Impact on crops and livestock Quantified
- Leads to acute reduction in cropyields of 0.2% of total value by2050 per fire
Change inprecipitation /temperature / CO2
concentrations
Increase in the area of Best and MostVersatile (BMV) land at high risk offlooding to 790,000 ha115
- Assuming crop distribution onBMV land is equal to the nationaldistribution and that all crops inhigh risk areas are flooded
- Leads to acute reduction in cropyields of 18.3% of total value by2050 per flood
ü
Increase in water supply deficits duringlow flow events and restrictions onagricultural water use
- Assuming impacts on agriculturaloutput due to drought events arecaptured in the ‘water supply’service
û
More frequently waterlogged soils inwinter and reduced soil moisture insummer leading to increase in weatherpatterns seen in 2012 where poorweather (wet winter/spring, dry summer)led to reduced wheat and potato yields116
- Assuming replication of weatherevents in 2012 which lead to15% reduction in wheat and 26%reduction in potatoes117
- Leads to acute reduction in cropyields of 5.9% of total value by2050 per year with poor weatherevent
ü
Increase in wheat and sugar beet yieldsdue to better growing conditions togetherwith decrease in potato yields118
- Assuming increased wheat yieldsof 79%, sugar beet 39%, andpotatoes -5%119
- Assuming climate conditionsaccount for 5% of yields120
- Leads to chronic increase in cropyields of 1.1% of total value by2050
ü
Increase in heatwave events which leadto loss of milk yield from livestock121
- Assuming 20% reduction in milkyields during heatwaves andnumber of heat stress daysincreases to 10 per year122
- Leads to acute reduction inlivestock production of 0.2% by2050 due to heatwaves
ü
115 Sayers et al. (2015), ‘Climate Change Risk Assessment 2017: Projections of future flood risk in the UK’.116 Brown et al. (2017) UK Climate Change Risk Assessment Evidence Report: Chapter 3, Natural Environment and Natural Assets.Report prepared for the Adaptation Sub-Committee of the Committee on Climate Change, London.117 Brown et al. (2017) UK Climate Change Risk Assessment Evidence Report: Chapter 3, Natural Environment and Natural Assets.Report prepared for the Adaptation Sub-Committee of the Committee on Climate Change, London.118 CCRA (2012), ‘Climate Change Risk Assessment for the Agriculture Sector’.119 CCRA (2012), ‘Climate Change Risk Assessment for the Agriculture Sector’.120 Brown et al. (2017) UK Climate Change Risk Assessment Evidence Report: Chapter 3, Natural Environment and Natural Assets.Report prepared for the Adaptation Sub-Committee of the Committee on Climate Change, London.121 Dunn et al. (2014), ‘Analysis of heat stress in UK dairy cattle and impact on milk yields’.122 Dunn et al. (2014), ‘Analysis of heat stress in UK dairy cattle and impact on milk yields’.

92 AECOM
Key impacts Impact on natural capital by 2050s Impact on crops and livestock Quantified
Change in sea levelsAverage increase in sea levels of 0.34metres123 leading to loss of 0.1% of BMVland through costal erosion124
- Assuming that 40% ofagricultural land is BMV and thatcrop output is distributed similarlyacross BMV land and totalnational output
- Leads to chronic reduction incrop yields of 0.04% of totalvalue by 2050125
ü
Change in naturalpollinator population
Decline in natural pollinator populationsand distributions to the extent thatpollinator visits to crops fall126
- Assuming 29% fall in pollinatorpopulations127
- Assuming 25% oilseed rape,85% field beans, 45% freshvegetables, and 65% fresh fruityields dependent onpollination128
- Leads to chronic reduction incrop yields of 4.9% of total valueby 2050
ü
Change in extent offarmlands /moorlands /grasslands
Subsidy reductions take all LessFavoured Areas (LFA) land in Englandout of production
- Assuming average of 82 cowsand 683 sheep per LFAfarm129,130
- Leads to chronic reduction inlivestock production of 19.6% oftotal value by 2050
ü
Increase in development of agriculturalland to meet growth in housing demand
- Chronic reduction in crop yieldsand livestock production notquantified due to limitations ofevidence base
û
Change in soildegradation rates
Widespread deterioration in soil qualitydue to erosion, loss of soil organiccontent, and compaction131,132,133
- Assuming total cost of soildegradation relating toagriculture of £290 million134
- Leads to chronic reduction incrop yields of 3.8% of total valueby 2050
ü
123 Sayers et al. (2015), ‘Climate Change Risk Assessment 2017: Projections of future flood risk in the UK’.124 Ramsbottom et al. (2012), ‘UK 2012 Climate Change Risk Assessment for the Floods and Coastal Erosion Sector’.125 Brown et al. (2017) UK Climate Change Risk Assessment Evidence Report: Chapter 3, Natural Environment and Natural Assets.Report prepared for the Adaptation Sub-Committee of the Committee on Climate Change, London.126 Brown et al. (2017) UK Climate Change Risk Assessment Evidence Report: Chapter 3, Natural Environment and Natural Assets.Report prepared for the Adaptation Sub-Committee of the Committee on Climate Change, London.127 Biesmiejer et al. (2006), ‘Parallel Declines in Pollinators and Insect-Pollinated Plants in Britain and the Netherlands’.128 UK NEA (2011), ‘Chapter 14: Regulating Services’.129 RBR (2016), ‘Farm Business Survey 2014/2015 Hill Farming in England’.130 Defra Soil Research Programme ‘Review of the weight that should be given to the protection of best and most versatile (BMV) landTechnical Report SP1501/TR Final Report’.131 UK National Ecosystem Assessment Follow-On (2014), ‘Work Package Report 1: Annex 4 – Case studies’.132 Cranfield University (2013) for the Adaptation Sub-Committee. Work for the ‘Managing the land in a changing climate’ report133 Graves et al. (2015), ' The total costs of soil degradation in England and Wales’.134 Graves et al. (2015), ' The total costs of soil degradation in England and Wales’.

AECOM 93
The impacts where then aggregated to estimate the cumulative potential change if all of the potential acuteshocks occurred in the year 2050 i.e. a UK wide flooding of agricultural land, an outbreak of various diseases,a heatwave event etc.; and the cumulative chronic change given the ongoing impacts on output due tochanges such as pollinator decline and land use change etc. The results are set out in the tables below.
Table 31. Acute impact on crops
Crop typeCurrent output(2015 prices)
Impactof
flooding
Impactof
wildfires
Impactof
weather
Impactof
disease
Change inoutput
(2015 prices)
Changein output
(%)
Wheat £2,033,000,000 -4.9% - -4.0% -7.0% -£1,207,331,074 -15.9%
Barley £824,000,000 -2.0% - - -3.3% -£398,799,827 -5.3%
Oats £86,000,000 -0.2% - - - -£15,705,039 -0.2%
Oilseed rape £706,000,000 -1.7% - - - -£128,927,416 -1.7%
Linseed £9,000,000 -0.02% - - - -£1,643,551 -0.02%
Sugar £173,000,000 -0.4% - - - -£31,592,695 -0.4%
Peas £13,000,000 -0.03% - - - -£2,374,018 -0.03%
Field beans £97,000,000 -0.2% - - - -£17,713,823 -0.2%
Fresh vegetables £1,277,000,000 -3.1% - - - -£233,201,572 -3.1%
Plants and flowers £1,149,000,000 -2.8% - - - -£209,826,630 -2.8%
Potatoes £547,000,000 -1.3% - -1.9% - -£242,111,355 -3.2%
Fresh fruit £681,000,000 -1.6% - - - -£124,361,997 -1.6%
Total £7,595,000,000 -18.3% -0.2% -5.9% -10.3% -£2,625,242,915 -34.6%
Table 32. Acute impact on livestock
Livestocktype
Current output(2015 prices)
Impact ofbluetongue
Impact ofliver fluke
Impact ofheatwaves
Change inoutput
(2015 prices)
Change inoutput (%)
Dairy cows £3,663,000,000 -0.02% -0.8% -0.2% -£112,168,090 -1.0%
Beef cows £2,739,000,000 -0.02% - - -£1,643,400 0.0%
Pigs £1,078,000,000 - - - - -
Sheep £1,105,000,000 -0.13% - - -£13,812,500 -0.1%
Poultry £2,226,000,000 - - - - -
Total £10,811,000,000 -0.16% -0.8% -0.2% -£127,623,990 -1.2%
Table 33. Chronic impact on crops
Crop typeCurrent output(2015 prices)
Impact ofclimate
Impact ofpollina-
tion
Impact ofcoastalerosion
Impact ofsoil
decline
Change inoutput
(2015 prices)
Changein output
(%)
Wheat £2,033,000,000 1.1% - -0.01% - £79,490,300 1.0%
Barley £824,000,000 - - -0.004% - -£329,600 -0.004%

94 AECOM
Crop typeCurrent output(2015 prices)
Impact ofclimate
Impact ofpollina-
tion
Impact ofcoastalerosion
Impact ofsoil
decline
Change inoutput
(2015 prices)
Changein output
(%)
Oats £86,000,000 - - -0.0005% - -£34,400 -0.0005%
Oilseed rape £706,000,000 - -0.7% -0.004% - -£51,467,400 -0.7%
Linseed £9,000,000 - - -0.00005% - -£3,600 -0.00005%
Sugar £173,000,000 0.04% - -0.001% - £3,304,300 0.044%
Peas £13,000,000 - - -0.0001% - -£5,200 -0.0001%
Field beans £97,000,000 - -0.3% -0.001% - -£23,949,300 -0.3%
Fresh vegetables £1,277,000,000 - -2.2% -0.01% - -£167,159,300 -2.2%
Plants and flowers £1,149,000,000 - - -0.01% - -£459,600 -0.01%
Potatoes £547,000,000 -0.02% - -0.003% - -£1,586,300 -0.02%
Fresh fruit £681,000,000 - -1.7% -0.004% - -£128,640,900 -1.7%
Total £7,595,000,000 1.1% -4.9% -0.04% -3.82% -£581,154,524 -7.7%
Table 34. Chronic impact on livestock
Livestock type Current output(2015 prices)
Impact of land-usechange
Change in output(2015 prices)
Change in output(%)
Dairy cows £3,663,000,000 - - -
Beef cows £2,739,000,000 -16.9% -£1,832,289,703 -16.9%
Pigs £1,078,000,000 - - -
Sheep £1,105,000,000 -2.7% -£291,072,339 -2.7%
Poultry £2,226,000,000 - - -
Total £10,811,000,000 -19.6% -£2,123,362,042 -19.6%
It is important to note the lack of studies providing a consistent overview of the cumulative impacts of variousnatural capital changes on crops and livestock provision by 2050. As such a number of different studies weredrawn upon which used multiple different sets of assumptions and methodologies. This creates issues whentrying to combine like with like; for instance some estimates for the extent of change in 2050 account for thechange in magnitude of a particular impact (e.g. greater loss of milk yield from dairy cows due to an increasein the number of heatwave events), whereas others do not, instead assuming that events which havehappened previously occur again in the future (e.g. replication of poor weather events in 2010/11).
The estimates also not account for the likelihood of an event occurring, and instead focus on the magnitude ofthe impact should an event occur. As such, some of the figures are likely to be over or under estimates of theactual magnitude. For example, the estimate of flood risk to agricultural land draws on CCRA work whichsuggests that 790,000 ha of BMV land could be at high risk of flooding by 2050. The estimates providedabove look at the magnitude of the impact if all of this area was flooded within a single year, an event whichhas a low likelihood.
These issues mean that the piloting exercise should be taken as indicative of how the potential approachcould be undertaken, rather than providing prescriptive estimates of what may actually happen in 2050. As apriority, research should be undertaken to build the evidence base around aggregate impacts of natural capitalchange in service provision.

AECOM 95
Water supply
A similar approach was adopted for the water supply service and the estimates of change in natural capitalare set out in Table 35. Note for a number of the potential impacts it was not possible to develop quantitativeestimates of change, again highlighting the limitations of the underlying evidence base and the fact that thequantitative estimates do not fully reflect the narrative of the scenario.
Table 35. Overview of impacts on natural capital from high level drivers and resulting impacts onwater supply
Key impacts Impact on natural capital by 2050s Impact on water supply Quantified
Change in spread ofpests and disease
Increased incidence of invasive species(especially aquatic plants andinvertebrates)135
Chronic increase in water treatmentcosts not quantified due to limitationsof evidence base
û
Change inprecipitation /temperature / CO2concentrations
Change in precipitation patternscontributes to lower flows in summermonths135
Assuming chronic reductions insupply of water which increase theimpacts of acute drought eventsbased on the evidence base set out inthe CCRA 2017
ü
Assuming acute drought event occursfor a 3 month period ü
Change in sea levelsAverage increase in sea levels of 0.34metres136
Chronic increase in groundwatersaline intrusion into aquifers notquantified due to limitations ofevidence base
û
Change in extent ofurban areas/freshwaters /peatlands
Increase in population leading toincrease in intensification of remainingagricultural land and urbanisation of rivercatchment which reduces capacity ofecosystems to regulate water quality
Chronic increase in water treatmentcosts not quantified due to limitationsof evidence base
û
Change in soildegradation rates
Continued erosion of sedimentscontributing to sedimentation of water
Chronic increase in water treatmentcosts not quantified due to limitationsof evidence base
û
Changes in waterquality classification
Intensified agriculture and wetterautumns and winters increases theseverity of diffuse agricultural pollutionand low summer river flows lesseffectively dilute pollutants
Chronic increase in water treatmentcosts not quantified due to limitationsof evidence base
û
Change in demandfor food / water / rawmaterials
Increase in population of 10% to 83million people leading to the demand forwater across the UK to increase by9%137
Assuming chronic increase in demandfor water which can emphasise theimpacts of acute shocks duringdrought events based on theevidence base set out in the CCRA2017
ü
135 Dawson et al. (2016), ‘Climate Change Risk Assessment 2017: Infrastructure’136 Sayers et al. (2015), ‘Climate Change Risk Assessment 2017: Projections of future flood risk in the UK’.137 HY Wallingford (2015), CCRA2: Updated projections for water availability for the UK Final Report’.

96 AECOM
Given the limitations of the evidence base, the impacts on water supply for the purposes of pilot NCST werefocused on quantifying the chronic changes in the demand and supply of water, and how these ongoingchronic changes could lead to greater exposure to acute drought events in future. More specifically, the pilotaimed to answer the question, how much greater could the magnitude of impacts from a drought event in2050 be due to chronic declines in water availability based on a comparison between:
· The impacts of a three month drought event in 2050 (assumed here to be a period where water levelsare at low flows for three months) if water availability declines to the extent projected by the CCRA2017.
· The impacts of a similar drought event in 2050 if water availability was maintained at its current levels.
The chronic impact on water availability was estimated based on the CCRA 2017 projection that the balanceof water supply relative to demand during low flow events will switch from a UK-wide surplus to a deficit by the2050s138 assuming: four degrees warming, a population increase of 10% to 83 million people, and acontinuation of the current levels of adaptation. The figures are derived from a scenario analysis conducted byHR Wallingford, which calculated deficits for each of twelve water catchments corresponding (approximately)to the twelve NUTS regions139 of the UK. A summary of the results are set out in Table 36, the full set ofcalculations are available in a separate Excel spreadsheet.
Table 36. Comparison of water availability based on chronic changes in water supply and demand140
RegionWater deficits during low flows in
2050 assuming water availability ismaintained (Ml/day)
Water deficits during low flows in2050 assuming water availability
declines (Ml/day)
East Midlands -138 -387
East of England -867 -1,196
London -1,261 -1,292
North East 0 -32
North West 0 -397
Northern Ireland 0 -54
Scotland 0 -532
South East -549 -917
South West 0 -422
Wales 0 -1,162
West Midlands 0 0
Yorkshire and the Humber 0 0
Total -2,816 -6,392
Deficit as % of total demand -18.1% -41.0%
138 Hall et al. (2015), ‘CCRA2: Updated projections for water availability for the UK Final Report.139 The Nomenclature of Territorial Units for Statistics (NUTS) is a geocode standard used by Eurostat for referencing the subdivisions ofthe United Kingdom of Great Britain and Northern Ireland for statistical purposes. There are 9 first level regions within England and onefor each of Scotland, Wales and Northern Ireland.140 Hall et al. (2015), ‘CCRA2: Updated projections for water availability for the UK Final Report.

AECOM 97
The figures above set out the water deficit for a single day at low flows i.e. the level of river flow that isequalled or exceeded for 95% of the time (in this case calculated from 30-years of data). These chronicchanges in water availability lead to impacts of different magnitudes during acute drought events. In this pilotcase, it is assumed that a drought event lasting for a period of three months occurs meaning that a low flowevent occurs for a three month period.
Flood regulation
The same approach was then adopted for the flood regulation service. The estimates of the change in naturalcapital are set out in Table 35.
Table 37. Overview of impacts on natural capital from high level drivers and resulting impacts on floodregulation
Key impacts Impact on natural capital by 2050s Impact on hazard regulation Quantified
Change inprecipitation /temperature / CO2
concentrations
Average increase in peak river flows of23%141 and events of intense rainfallbetween 1 to 6 hours duration of 20%142
Assuming increase in risk of acutefluvial flood events based on theevidence base set out in CCRA 2017
ü
Assuming increase in risk of surfacewater flood events based on theevidence base set out in CCRA 2017
ü
Assuming increase in risk of acutegroundwater flood events based onthe evidence base set out in CCRA2017
ü
Change in sea levels Average increase in sea levels of 0.34metres143
Assuming increase in risk of acutecoastal flood events based on theevidence base set out in CCRA 2017
ü
Change in extent ofwoodland / urbanareas / wetlands
Increase in population of 10% to 83million people144 leading to an increasein urbanisation mainly at the expense ofagricultural land although someadditional development on floodplains
Assuming chronic increase in numberof properties at risk from floodingduring acute events
ü
Chronic decrease in capacity ofecosystems to regulate water flowsnot quantified due to limitations ofevidence base
û
Change in soildegradation rates
Increase in soil degradation and loss ofcapacity to store water
Chronic decrease in capacity ofecosystems to regulate water flowsnot quantified due to limitations ofevidence base
û
The impacts on flood regulation are focused on quantifying the chronic changes in the numbers of propertiesat risk of flood events and the change in the extent and magnitude of acute flood events by 2050. This was
141 Sayers et al. (2015), ‘Climate Change Risk Assessment 2017: Projections of future flood risk in the UK’.142 Sayers et al. (2015), ‘Climate Change Risk Assessment 2017: Projections of future flood risk in the UK’.143 Sayers et al. (2015), ‘Climate Change Risk Assessment 2017: Projections of future flood risk in the UK’.144 Sayers et al. (2015), ‘Climate Change Risk Assessment 2017: Projections of future flood risk in the UK’.

98 AECOM
estimated based on the CCRA 2017 projections145 of the changes in flood risk by 2050 assuming four degreeswarming, a population increase of 10% to 83 million people, and a reduction in the current levels ofadaptation.
The results are set out in Table 38 and represent a combination of the change in the likelihood of acute floodevents due to changes in the climate system, and a change in the magnitude of the associated impacts due topopulation growth, a reduction in the level of planned adaption, and changes in the climate system.146
Table 38. Cumulative change in flood regulation147
Aspect Current 2050s % change
No. residential properties at high risk of flooding148 1,073,286 2,454,715 129%
No. non-residential properties at high risk 533,590 772,041 45%
No. clean and wastewater sites at high risk 299 185 -38%
No. rail stations at high risk 580 685 18%
Length of road at high risk (km) 6,585 11,115 69%
Length of railway at high risk (km) 2,397 3,703 54%
No. power stations at high risk 24 16 -33%
No. substations at high risk 327 277 -15%
No. mobile phone masts at high risk 1,753 2,829 61%
No. care homes at high risk 438 780 78%
No. schools at high risk 1,112 1,652 48%
No. emergency services at high risk 249 410 65%
No. hospitals at high risk 94 127 36%
No. GP surgeries at high risk 563 993 76%
No. landfill sites at high risk 398 423 6%
Developing and applying the economic impact approach
Having identified the three ecosystem services to be analysed in the pilot, specified the scenario, andquantified the extent of change, the final step involved the development of approaches to assess theeconomic impacts. This began with some initial work to set out the framework by which changes in ecosystemservices lead to economic impacts. This framework identified:
145 Sayers et al (2016). The analysis of future flood risk in the UK using the Future Flood Explorer (FFE). Proceedings of Floodrisk2016.Paul Sayers, Matt Horritt, Edmund Penning-Rowsell, Andrew McKenzie and David Thompson. E3S Web Conf., 7 (2016) 21005 DOI:http://dx.doi.org/10.1051/e3sconf/20160721005146 This scenario assumes that the adaptation effort as a whole reduces. Investment in traditional defences reduces (reflecting a reductionin the willingness to pay for defences from national tax revenues as flooding is increasingly seen as less of a national risk and more of alocal one, but local funding fails to replace centralised investments). There is little take up of innovative catchment-based or urban run-offmeasures occurs, spatial planning becomes less rigorous (resulting in new development on the floodplain than currently is the case), andflood forecasting and warning systems and receptor level protection see low(er) levels of effectiveness and performance.147 Sayers et al (2016). The analysis of future flood risk in the UK using the Future Flood Explorer (FFE). Proceedings of Floodrisk2016.Paul Sayers, Matt Horritt, Edmund Penning-Rowsell, Andrew McKenzie and David Thompson. E3S Web Conf., 7 (2016) 21005 DOI:http://dx.doi.org/10.1051/e3sconf/20160721005148 ‘High risk’ defined as at risk of flooding more frequent than 1:75 years.

AECOM 99
· The components of the logic chain: translation of changes in ecosystem services into direct impacts;indirect impacts through economic dependencies; and behavioural responses.
· Factors that lead to changes in the impacts: changing patterns of natural capital shocks and changingsocio-economic structure.
· The different channels (corresponding to the three categories of ecosystem services) by whichchanges in natural capital might alter the flow of benefits into the economy.
The framework was presented at the first workshop on 13 December 2016 alongside an example that set outthe logic chain for a reduction in the availability of crops and livestock. The example elaborated the economiccomponent of the impact pathway for that ecosystem service (extending the detail of the rightmost column ofthe impact pathway in Figure 18).
The workshop provided an opportunity for stakeholders to comment on the approach and logic chain and tosay if the economic logic was missing any critical effects. The discussion did not highlight any specificelements that were missing from the draft economic pathway for crops and livestock although there was somediscussion as to how best to incorporate financial and insurance impacts into the hazard regulation analysisand other scenarios that may involve some kind of crisis that leads to insurance claims etc.149 Section 4 in themain body of the report sets out the economic logic of the approach to the impact analysis.
The discussion also emphasised the ways in which such economic assessments could be more challengingbecause of the characteristics of natural capital. These characteristics include the relatively low share ofprovisioning ecosystem services in inputs to production but typically a limited degree of substitutability, makingsuch services essential even if they constitute a small proportion of total value. The implication is thatecosystem services and the industries that depend on them directly may not, at first glance, appear tocontribute much to total economic activity. However, this is simply because the rest of the economy (in theUK, largely services) is so much larger.
Without much scope for substitution, the loss of ecosystem services like food and water could in fact causesubstantial disruption because such services are ‘lifelines’. A breakdown of the results by industry wasconsidered important to understand knock-on effects through the economy but also because some impactsare likely to affect some sectors much more than others. While the impacts of a stress test may not show upvery clearly at the aggregate level, some sectors could be greatly affected.
Difficulties were also noted as to how to show the relative importance of these services given high levels ofuncertainty about behavioural responses under severe environmental stress, the potential for technologicalchange and adaptation in the long term, and the presence of non-linearities and threshold effects. There wasrelatively little of this that could be addressed in the pilot although the economic impacts have been reportedin a way that attempts to convey approximate scale, rather than a precise estimate of the impacts.
The discussion during the workshop also supported the aim of the stress test to focus on observableeconomic indicators and to avoid non-market values, which are less robust and more contestable.Stakeholders felt that the use of the latter might undermine confidence in the results of a stress test. This alsosupported the earlier decision not to attempt an assessment of any cultural ecosystem services (whichgenerally generate non-monetised amenity values).
Having agreed the logic/narrative of the crops and livestock analysis, an impact model was developed in Excel
149 In the end, data limitations prevented an assessment of these effects in the pilot but it is something that should be considered in moredetail in future work.

100 AECOM
to embed that economic logic. The model takes, as inputs:
· The anticipated reduction in an industry’s output that arises from a change in an ecosystem service.
· A set of assumptions to determine the extent to which the impacts are to be borne by final users(households, foreign purchasers etc.) and by individual industries. The industry-level impacts may beset either: by the analyst based on prior knowledge of how a scenario might constrain output inspecific industries (the ‘analyst-led’ approach reported in the crops and livestock results); or byapplying a set of assumptions to distribute the output constraints according to some rule (an exampleof this is the ‘data-derived’ approach reported in both crops and livestock, and water supply).
· If required, a set of changes to domestic prices (increasing industry profits) and import prices, tocalculate the impact on the consumer price index.
The underlying model is quite general, so that it can be used in scenario analysis beyond the life of thisproject. However, because the model is so general, each scenario examined in the pilot took a version of thatmodel as a template. The individual models were then tailored to the specific scenario, with a sheet of controlsthat only contained the key inputs for that ecosystem service.
Initial results from an early version of that model (that only incorporated the first two of the above) werepresented at the second workshop on 23 January 2017, to show early results from an acute shock to cropsand livestock. There was agreement that the work was going in the right direction. The remaining narrativesfor the other ecosystem services were also presented to broad agreement.
Following the second workshop, the model was further developed and applied to the scenario of chronicdegradation of crops and livestock. A version of the model was then developed to analyse water supply.
Because of a lack of detailed spatial data, in the end, no model was developed for flood regulation. Ideally,such an analysis would have considered the location-specific impacts of a particular flooding event and tracedthrough the consequences for economic activity and the costs of recovery. In lieu of this, the approach takenwas less detailed and involved taking the estimated costs of the 2013/14 winter floods in England and Walesand scaling them up using assumptions about future economic development and climate change. Implicitly,this approach attempts to project the future impacts of a series of events like the 2013/14 floods were they tooccur in the future (2050) when the structure of the economy in those areas (number of households comparedto number of businesses etc.) might be different and the extent of flood magnitude might also change. Thischanges both the total costs but also the composition of those impacts.
The results of the stress test and the interpretation of those results are presented in Section 5 of the mainreport.

AECOM 101
Appendix B. Scoping matricesOverview
This section provides an overview of the scoping matrices used to develop and pilot the approach to naturalcapital stress testing. Copies of the Economic Sector Review and the Ecosystem Service Prioritisationmatrices are set out in Figure 21 and Figure 22, respectively. Full versions are available separately in Excelspreadsheets.
Economic Sector Review matrix
The first step of the scoping process is to qualitatively assess the dependency of economic sectors on a rangeof ecosystem services in order to identify the services which are of most importance to the economy. This canbe done using the Economic Sector Review matrix.
In this matrix a list of economic sectors (UK Standard Industrial Classification of Economic Activities 2007) isset on the horizontal axis against a list of ecosystem services (CICES, Version 4.3) on the vertical axis of thematrix. Scores on a three-point scale (High, Medium, Low) are then entered by the user to indicate thestrength of interaction between each ecosystem service and each economic sector. This matrix is to becompleted with the application of the best available evidence and preferably with the advice of sectoral andecosystem service experts. Previous inputs from the piloting of this approach may be retained and updatedwhere appropriate; this iterative revision of scores may continue throughout the application of the NCST toreduce the required effort for each application.
The strength of the service-sector interaction should not be assessed on the perceived risk of ecosystemservice change, or the nature of the interaction, but on the extent to which a change in ecosystem serviceprovision might cause significant impacts (positive or negative) on activities within economic sectors. For asector-specific application, or more comprehensive application, the user might consider sub-sectorclassifications. This is because ecosystem service change can be expected to cause more severe impacts incertain sub-sectors (for example food supply impacts on food and beverage manufacturing may be significantwhile wider manufacturing impacts might be more limited).
Ecosystem Service Prioritisation matrix
The second step is to build on the economic sector review to further assess the list of ecosystem services inorder to identify a priority list of services to be included within the NCST. This can be done using theEcosystem Service Prioritisation matrix which sets out a range of criteria for prioritising services for inclusion.
In this matrix the user assigns a score to each ecosystem service of: High (2); Medium (1); and Low (0)against the following criteria: whole economy relevance (drawing on the results from Step 1); policy relevance;relative risk to future provision; availability of methods for physical and monetary analysis; and availability ofdata for physical and monetary analysis.
Each cell should be completed by the user, aside from those of the first criterion (whole economy relevance)which is automatically filled from the previous scoping step. Given the high level of this assessment, it can becompleted on the basis of professional judgement and should be ‘sense checked’ through internal or externalreview processes. On completion of the matrix, an Ecosystem Service Priority Score will be presented. Ahigher score represents a higher priority for inclusion in the stress test. However, the interpretation and use ofthis score will depend on the user’s required scope. It is suggested that the user selects a greater number ofservices at this point than can be assessed in detail later, and then further narrows their selection ofecosystem services through more deliberative methods (for example, through a workshop for expertstakeholders).

102 AECOM
Figure 21. Economic Sector Review matrix
AG
RIC
ULT
UR
E,FO
RES
TRY
AND
FIS
HIN
G
MIN
ING
AND
QU
AR
RYI
NG
MA
NU
FAC
TUR
ING
ELE
CTR
ICIT
Y,G
AS,
STEA
MAN
DAI
RC
ON
DIT
ION
ING
SU
PPLY
WAT
ERS
UPP
LY;S
EW
ERAG
E,W
ASTE
MAN
AGEM
EN
TAN
DR
EMED
IATI
ON
ACTI
VITI
ES
CO
NST
RU
CTI
ON
WH
OLE
SALE
AND
RET
AIL
TRA
DE;
REP
AIR
OF
MO
TOR
VEH
ICLE
SA
ND
MO
TO
RC
YCLE
S
TR
ANSP
OR
TAT
ION
AND
STO
RA
GE
AC
CO
MM
OD
ATIO
NAN
DF
OO
DS
ERV
ICE
ACTI
VIT
IES
INF
OR
MA
TIO
NAN
DC
OM
MU
NIC
ATIO
N
FIN
ANC
IAL
AND
INS
UR
ANC
EA
CTI
VITI
ES
REA
LE
STAT
EAC
TIVI
TIE
S
PR
OFE
SSIO
NAL
,SC
IEN
TIFI
CAN
DT
ECH
NIC
ALAC
TIVI
TIE
S
AD
MIN
ISTR
ATIV
EAN
DSU
PPO
RT
SER
VIC
EAC
TIV
ITIE
S
PU
BLIC
AD
MIN
ISTR
ATIO
NAN
DD
EFE
NC
E;C
OM
PULS
OR
YSO
CIA
LS
ECU
RIT
Y
ED
UC
ATI
ON
HU
MAN
HEA
LTH
AND
SOC
IAL
WO
RK
AC
TIVI
TIES
AR
TS,E
NTE
RTA
INM
ENT
AND
REC
RE
ATIO
N
OT
HER
SER
VIC
EAC
TIVI
TIES
AC
TIVI
TIES
OF
HO
USE
HO
LDS
ASE
MPL
OYE
RS
AC
TIVI
TIES
OF
EXT
RAT
ERR
ITO
RIA
LO
RG
ANIS
ATIO
NS
AND
BO
DIE
S
Ecos
yste
mSe
rvic
eM
ater
ialit
ySc
ore
Ecos
yste
mSe
rvic
eM
ater
ialit
yRa
ting
UK Standard Industrial Classification of Economic Activities 2007
CICES 4.3 Ecosystem Services UK Specific Example Broad Classification A B C D E F G H I J K L M N O P Q R S T UProvisioning ServicesCultivated crops Crops Crops & livestock High Low Medium Low Medium Low Medium Low Medium Low Medium Low Low Low Low Low Low Low Low Low Low 7 MediumReared animals and their outputs Livestock Crops & livestock High Low Medium Low Medium Low Medium Low Medium Low Medium Low Low Low Low Low Low Low Low Low Low 7 MediumWild plants, algae and their outputs Mushrooms & berries Wild foods Low Low Low Low Low Low Low Low Low Low Low Low Low Low Low Low Low Low Low Low Low 0 LowWild animals and their outputs Fisheries Fisheries High Low Medium Low Low Low Medium Low Medium Low Low Low Low Low Low Low Low Low Low Low Low 5 MediumPlants and algae from in-situaquaculture
Seaweed Aquaculture Low Low Low Low Low Low Low Low Low Low Low Low Low Low Low Low Low Low Low Low Low 0 LowAnimals from in-situ aquaculture Farmed salmon Aquaculture Medium Low Low Low Low Low Medium Low Medium Low Low Low Low Low Low Low Low Low Low Low Low 3 LowSurface water for drinking Drinking water Water supply High Medium High Medium High Medium Medium Low Medium Low Low Low Low Low Low Low Low Low Low Low Low 11 HighGround water for drinking Drinking water Water supply High Medium High Medium High Medium Medium Low Medium Low Low Low Low Low Low Low Low Low Low Low Low 11 HighFibres and other materials fromplants, algae and animals for direct
Timber Timber High Low Medium Low Low Medium Medium Low Low Low Low Low Low Low Low Low Low Low Low Low Low 5 MediumMaterials from plants, algae andanimals for agricultural use
Fodder Crops & livestock Low Low Low Low Low Low Low Low Low Low Low Low Low Low Low Low Low Low Low Low Low 0 LowGenetic materials from all biota Genetic resources Genetic resources High Low Low Low Low Low Low Low Low Low Low Low Low Low Low Low Low Low Low Low Low 2 LowSurface water for non-drinkingpurposes
Other water uses Water supply High Medium High Medium High Medium Medium Low Medium Low Low Low Low Low Low Low Low Low Low Low Low 11 HighGround water for non-drinkingpurposes
Other water uses Water supply High Medium High Medium High Medium Medium Low Medium Low Low Low Low Low Low Low Low Low Low Low Low 11 HighPlant-based resources (for energyproduction)
Woodfuel/biomass Energy Low Low Low Medium Low Low Low Low Low Low Low Low Low Low Low Low Low Low Low Low Low 1 LowAnimal-based resources (for energyproduction)
Manure/slurry Energy Low Low Low Low Low Low Low Low Low Low Low Low Low Low Low Low Low Low Low Low Low 0 LowAnimal-based energy Oxen Energy Low Low Low Low Low Low Low Low Low Low Low Low Low Low Low Low Low Low Low Low Low 0 LowRegulating ServicesBio-remediation by micro-organisms,algae, plants, and animals
Bio-remediation Soil quality regulation Low Low Low Low Medium Low Low Low Low Low Low Low Low Low Low Low Low Low Low Low Low 1 LowFiltration/sequestration/storage/accumulation by micro-organisms, algae,
Detoxification Water quality regulation Low Low Low Low High Low Low Low Low Low Low Low Low Low Low Low Low Medium Low Low Low 3 LowFiltration/sequestration/storage/accumulation by ecosystems
Pollution absorption Air quality regulation Medium Low Low Low Medium Low Low Low Low Low Low Low Low Low Low Low High Low Low Low Low 4 LowDilution by atmosphere, freshwaterand marine ecosystems
Waste dilution Water quality regulation Low Low Low Low High Low Low Low Low Low Low Low Low Low Low Low Low Medium Low Low Low 3 LowMediation of smell/noise/visualimpacts
Vegetation screening Cultural & spiritual values Low Low Low Low Low Low Low Low Low Low Low Low Low Low Low Low Low Low Low Low Low 0 LowMass stabilisation and control oferosion rates
Erosion control Soil quality regulation Medium Low Low Low Medium Low Low Low Low Low Low Low Low Low Low Low Low Low Low Low Low 2 LowBuffering and attenuation of massflows
Sediment transport Water quality regulation Low Low Low Low Medium Low Low Low Low Low Low Low Low Low Low Low Low Medium Low Low Low 2 LowHydrological cycle and water flowmaintenance
Environmental flows Water supply High Medium High Medium High Medium Medium Low Medium Low Low Low Low Low Low Low Low Low Low Low Low 11 HighFlood protection Flood protection Flood regulation High Low Medium Medium Medium High Medium Medium Low Low High Medium Low Low Low Low Medium Low Low Low Low 13 HighStorm protection Shelter belts Storm regulation Low Low Low Low Low Low Low Low Low Low Low Low Low Low Low Low Low Low Low Low Low 0 LowVentilation and transpiration Ventilation Air quality regulation Medium Low Low Low Medium Low Low Low Low Low Low Low Low Low Low Low High Low Low Low Low 4 LowPollination and seed dispersal Pollination Pollination High Low Low Low Low Low Low Low Low Low Low Low Low Low Low Low Low Low Low Low Low 2 LowMaintaining nursery populations andhabitats
Nursey habitats Fisheries High Low Medium Low Low Low Medium Low Medium Low Low Low Low Low Low Low Low Low Low Low Low 5 MediumPest control Pest control Disease & pest control High Low Low Low Medium Low Low Low Low Low Low Low Low Low Low Low Low Low Low Low Low 3 LowDisease control Disease control Disease & pest control High Low Low Low Medium Low Low Low Low Low Low Low Low Low Low Low High Low Low Low Low 5 MediumWeathering processes Soil regulation Soil quality regulation Medium Low Low Low Low Low Low Low Low Low Low Low Low Low Low Low Low Low Low Low Low 1 LowDecomposition and fixing processes Soil regulation Soil quality regulation Medium Low Low Low Low Low Low Low Low Low Low Low Low Low Low Low Low Low Low Low Low 1 LowChemical condition of freshwaters River water quality Water quality regulation Low Low Low Low High Low Low Low Low Low Low Low Low Low Low Low Low Medium Low Low Low 3 LowChemical condition of salt waters Bathing water quality Water quality regulation Medium Low Low Low Medium Low Low Low Low Low Low Low Low Low Low Low Low Medium Low Low Low 3 LowGlobal climate regulation by reductionof greenhouse gas concentrations
Carbon sequestration Global climate regulation High Low Medium Medium High Low Low Low Low Low High Low Low Low Low Low Low Medium Low Low Low 9 HighMicro and regional climate regulation Temperature regulation Local climate regulation Medium Low Low Medium Low Low Low Low Low Low Low Low Low Low Low Low Medium Low Low Low Low 3 LowCultural ServicesExperiential use of plants, animalsand land-/seascapes in different
Wildlife watching Tourism & recreation Low Low Low Low Low Low Low Medium Medium Low Low Low Low Low Low Low Medium High Low Low Low 5 MediumPhysical use of land-/seascapes indifferent environmental settings
Nature based recreation Tourism & recreation Low Low Low Low Low Low Low Medium Medium Low Low Low Low Low Low Low Medium High Low Low Low 5 MediumScientific Scientific values Science & knowledge values Low Low Low Low Low Low Low Low Low Low Low Low High Low Low Low Low Low Low Low Low 2 LowEducational Educational values Science & knowledge values Low Low Low Low Low Low Low Low Low Low Low Low Low Low Low Medium Low Low Low Low Low 1 LowHeritage, cultural Cultural values Cultural & spiritual values Medium Low Low Low Low Low Low Low Medium Low Low Low Low Low Low Low Low High Low Low Low 4 LowEntertainment Entertainment values Cultural & spiritual values Low Low Low Low Low Low Low Low Low Low Low Low Low Low Low Low Low High Low Low Low 2 LowAesthetic Aesthetic values Cultural & spiritual values Low Low Low Low Low Low Low Low Medium Low Low Medium Low Low Low Low Low High Low Low Low 4 LowSymbolic Symbolic values Cultural & spiritual values Low Low Low Low Low Low Low Low Low Low Low Low Low Low Low Low Low Low Low Low Low 0 LowSacred and/or religious Religious values Cultural & spiritual values Low Low Low Low Low Low Low Low Low Low Low Low Low Low Low Low Low Low Low Low Low 0 LowExistence Existence values Cultural & spiritual values Low Low Low Low Low Low Low Low Low Low Low Low Low Low Low Low Low Low Low Low Low 0 LowBequest Bequest values Cultural & spiritual values Low Low Low Low Low Low Low Low Low Low Low Low Low Low Low Low Low Low Low Low Low 0 LowTotal Score
Overall sector materiality score 41 5 17 9 29 8 12 3 14 0 6 2 2 0 0 1 10 16 0 0 0Overall sector materiality rating High Low Medium Low High Low Low Low Medium Low Low Low Low Low Low Low Low Medium Low Low Low

AECOM 103
Figure 22. Ecosystem Service Prioritisation matrix
Who
le-e
cono
my
rele
vanc
e
Pol
icy
rele
vanc
e
Rel
ativ
eris
kto
futu
repr
ovis
ion
Met
hods
forp
hysi
calt
erm
san
alys
is
Met
hods
form
onet
ary
term
san
alys
is
Ava
ilabi
lity
ofda
tafo
rphy
sica
lte
rms
Ava
ilabi
lity
ofda
tafo
rmon
etar
yte
rms
Eco
syst
emS
ervi
ceP
riorit
yS
core
Eco
syst
emS
ervi
ceP
riorit
yR
atin
g
CICES 4.3 Ecosystem Services UK Specific Example Broad Classification a b c d e f g h iProvisioning Services
Criteria for Prioritisation
Cultivated crops Crops Crops & livestock Medium High Medium High High High High 12 HighReared animals and their outputs Livestock Crops & livestock Medium High Medium High High High High 12 HighWild plants, algae and their outputs Mushrooms & berries Wild foods Low Low Low High High Low Low 4 LowWild animals and their outputs Fisheries & game Fisheries Medium High Medium High High High High 12 HighPlants and algae from in-situaquaculture
Seaweed Fisheries Low Low Low High High Low Low 4 LowAnimals from in-situ aquaculture Farmed salmon Fisheries Low Low Low High High High High 8 MediumSurface water for drinking Drinking water Water supply High High High High High High Medium 13 HighGround water for drinking Drinking water Water supply High High High High High High Medium 13 HighFibres and other materials fromplants, algae and animals for direct
Timber Timber Medium Low Medium High High High High 10 HighMaterials from plants, algae andanimals for agricultural use
Fodder Crops & livestock Low Low Low Medium Medium Low Low 2 LowGenetic materials from all biota Genetic resources Genetic resources Low Medium Low Low Low Low Low 1 LowSurface water for non-drinkingpurposes
Other water uses Water supply High High High High High High Medium 13 HighGround water for non-drinkingpurposes
Other water uses Water supply High High High High High High Medium 13 HighPlant-based resources (for energyproduction)
Woodfuel/biomass Energy Low Medium Low High High Medium Low 6 MediumAnimal-based resources (for energyproduction)
Manure/slurry Energy Low Low Low Low Low Low Low 0 LowAnimal-based energy Oxen Energy Low Low Low Low Low Low Low 0 LowRegulating ServicesBio-remediation by micro-organisms,algae, plants, and animals
Bio-remediation Soil quality regulation Low Low Low Low Low Low Low 0 LowFiltration/sequestration/storage/accumulation by micro-organisms, algae,
Detoxification Water quality regulation Low Low Low Low Low Low Low 0 LowFiltration/sequestration/storage/accumulation by ecosystems
Pollution absorption Air quality regulation Low High High High Medium High Medium 10 HighDilution by atmosphere, freshwaterand marine ecosystems
Waste dilution Water quality regulation Low Medium High High Medium Low Medium 7 MediumMediation of smell/noise/visualimpacts
Vegetation screening Cultural & spiritual values Low Medium Medium Low Medium Low Low 3 LowMass stabilisation and control oferosion rates
Erosion control Soil quality regulation Low High High Low Low Low Low 4 LowBuffering and attenuation of massflows
Sediment transport Water quality regulation Low Low Medium Low Low Low Low 1 LowHydrological cycle and water flowmaintenance
Environmental flows Water supply High Low Low Low Low Low Low 2 LowFlood protection Flood protection Flood regulation High High High Medium High Medium Medium 11 HighStorm protection Shelter belts Storm regulation Low High High Medium High Low Medium 8 MediumVentilation and transpiration Ventilation Air quality regulation Low Low Low Low Low Low Low 0 LowPollination and seed dispersal Pollination Pollination Low High High Medium Medium Medium Medium 8 MediumMaintaining nursery populations andhabitats
Nursey habitats Fisheries Medium Medium Low Medium Low Medium Low 4 LowPest control Pest control Disease & pest control Low Medium Medium Medium Medium Low Low 4 LowDisease control Disease control Disease & pest control Medium Medium Medium Medium Medium Low Low 5 MediumWeathering processes Soil regulation Soil quality regulation Low Low Low Low Low Low Low 0 LowDecomposition and fixing processes Soil regulation Soil quality regulation Low Low Low Low Low Low Low 0 LowChemical condition of freshwaters River water quality Water quality regulation Low High Medium High Low High Low 7 MediumChemical condition of salt waters Bathing water quality Water quality regulation Low High Medium High Low High Low 7 MediumGlobal climate regulation by reductionof greenhouse gas concentrations
Carbon sequestration Global climate regulation High High Medium High High High High 13 HighMicro and regional climate regulation Temperature regulation Local climate regulation Low Low Low Medium Medium Low Low 2 LowCultural ServicesExperiential use of plants, animalsand land-/seascapes in different
Wildlife watching Tourism & recreation Medium Medium Low High High High High 10 HighPhysical use of land-/seascapes indifferent environmental settings
Nature based recreation Tourism & recreation Medium Medium Low High High High High 10 HighScientific Scientific values Science & knowledge values Low Low Low Low Low Low Low 0 LowEducational Educational values Science & knowledge values Low Medium Low High Medium High Medium 7 MediumHeritage, cultural Cultural values Cultural & spiritual values Low Medium Medium Medium Medium Low Low 4 LowEntertainment Entertainment values Cultural & spiritual values Low Low Low Medium Low Medium Low 2 LowAesthetic Aesthetic values Cultural & spiritual values Low High Medium Medium Medium Medium Medium 7 MediumSymbolic Symbolic values Cultural & spiritual values Low Low Low Low Low Low Low 0 LowSacred and/or religious Religious values Cultural & spiritual values Low Low Low Low Low Low Low 0 LowExistence Existence values Cultural & spiritual values Low Medium High High Low High Low 7 MediumBequest Bequest values Cultural & spiritual values Low Medium High High Low High Low 7 Medium

104 AECOM
Appendix C. Industry groupings in theeconomic impact modelTable 39 below lists the 67 industries identified in the economic impact model that was developed for the pilotstress test and the correspondence between these industries and broader industry groupings. The broadergroupings correspond to the sections of the Standard Industrial Classification (SIC) 2007.
The letters and numbers for the groups and industries below match those in the labels of the results charts inSection 5, in the main body of the report.
Table 39. Correspondence between SIC Sections and model industries
SIC Section Industries in the model
A Agriculture, forestry and fishing 1 Crop and animal production, hunting and related service activities
2 Forestry and logging
3 Fishing and aquaculture
B Mining and quarrying 4 Mining and quarrying
C Manufacturing 5 Processing and preserving of meat and production of meat products
6 Processing and preserving of fish, crustaceans, molluscs, fruit andvegetables
7 Vegetable and animal oils and fats
8 Dairy products
9 Grain mill products, starches and starch products
10 Bakery and farinaceous products
11 Other food products
12 Prepared animal feeds
13 Alcoholic beverages
14 Soft drinks; production of mineral waters and other bottled waters
15 Tobacco products
16 Textiles
17 Wearing apparel
18 Leather and related products
19 Wood and products of wood and cork, except furniture; Articles of straw andplaiting materials
20 Paper and paper products
21 Printing and reproduction of recorded media
22 Coke and refined petroleum products
23 Industrial gases, inorganics and fertilisers (all inorganic chemicals) -20.11/13/15

AECOM 105
SIC Section Industries in the model
24 Petrochemicals - 20.14/16/17/60
25 Dyestuffs, agro-chemicals - 20.12/20
26 Paints, varnishes and similar coatings, printing ink and mastics
27 Soap and detergents, cleaning and polishing preparations, perfumes andtoilet preparations
28 Other chemical products
29 Other manufacturing
D Electricity, gas, steam and airconditioning supply
30 Electric power generation, transmission and distribution
31 Gas; distribution of gaseous fuels through mains; Steam and air conditioningsupply
E Water supply; sewerage, wastemanagement and remediationactivities
32 Water collection, treatment and supply
33 Sewerage
34 Waste collection, treatment and disposal activities; materials recovery
35 Remediation activities and other waste management services
F Construction 36 Construction (construction of buildings, civil engineering, and specialisedconstruction activities)
G Wholesale and retail trade;repair of motor vehicles andmotorcycles
37 Wholesale and retail trade and repair of motor vehicles and motorcycles
38 Wholesale trade, except of motor vehicles and motorcycles
39 Retail trade, except of motor vehicles and motorcycles
H Transportation and storage 40 Rail transport
41 Land transport services and transport services via pipelines, excluding railtransport
42 Water transport
43 Air transport
44 Warehousing and support activities for transportation
45 Postal and courier activities
I Accommodation and foodservice activities
46 Accommodation
47 Food and beverage service activities
J Information and communication 48 Information and communication
K Financial and insuranceactivities
49 Financial service activities, except insurance and pension funding
50 Insurance and reinsurance, except compulsory social security; and pensionfunding
51 Activities auxiliary to financial services and insurance activities
L Real estate activities 52 Real estate activities
M Professional, scientific andtechnical activities
53 Legal, accounting, head offices, and management consultancy
54 Architectural and engineering activities; Technical testing and analysis
55 Scientific research and development
56 Other professional, scientific and technical activities

106 AECOM
SIC Section Industries in the model
N Administrative and supportservice activities
57 Administrative and support service activities
O Public administration anddefence; compulsory socialsecurity
58 Public administration and defence; Compulsory social security
P Education 59 Education
Q Human health and social workactivities
60 Human health activities
61 Social care services (residential care activities, and social work activitieswithout accommodation)
R Arts, entertainment andrecreation
62 Creative, arts and entertainment activities
63 Libraries, archives, museums and other cultural activities
64 Gambling and betting activities
65 Sports activities and amusement and recreation activities
S Other service activities 66 Other service activities

AECOM 107
AECOM Infrastructure & Environment UK LimitedAldgate Tower2 Leman StreetLondonE1 8FAaecom.com