Quality indicators for phase 1 errors - Home | Stats NZ
18
Quality indicators for phase 1 errors 1 Appendix 2: Quality indicators for phase 1 errors Guide to reporting on administrative data quality is the source document for appendix 2. Appendix 2 lists 25 quality indicators and measures useful to measure different aspects of a dataset’s quality, for phase 1 of the error framework. Not all these indicators would be measured and reported on for any given output. Instead, after you’ve completed a basic assessment of the sources of error in phase 1, use this list to provide suggestions for how to measure or monitor the error sources that appear to be the most important for a particular dataset. The indicators in this document are quite generic and most apply to almost any dataset. In some cases more specific or tailored indicators might be better for measuring particular sources of error. However, the generic indicators may provide ideas for the kind of measurements to make. Having a well-defined data dictionary would help to assess the errors present in phase 1. For administrative data, Statistics NZ has developed a metadata information spreadsheet to provide the information needed to calculate the required quality indicators in phase 1. The template helps to draw attention to the most relevant issues and helps you move from an ad hoc inspection to a more systematic way of looking at the data. The key and minimal information required of an administrative dataset includes: typical administrative use of the data definition of the target and actual populations definition of administrative collection unit types(s) and events, whichever is appropriate definitions of the target concept and corresponding operational target measures (including reference time period) of key variables available geographical coverage collection process, data entry and processes, and changes over time frequency of collection. We’ve organised the indicators in this document into six groups based on the error types in the phase 1 framework. These errors can lead to variance and bias when the dataset is used for a statistical output. In general, the risk of bias and variance varies by error source: Variance Bias Validity error Low High Measurement error High High Processing error High High Frame (coverage) error Low High Selection (sampling) error High Low Missing/redundancy (non-response) error Low High Sampling error is normally irrelevant for administrative data as, most of the time, the data are supposed to cover each unit subjected to the administrative regulation. Other error sources are not always under direct control.
Transcript of Quality indicators for phase 1 errors - Home | Stats NZ

Quality indicators for phase 1 errors
1
Appendix 2: Quality indicators for phase 1 errors Guide to reporting on administrative data quality is the source document for appendix 2.
Appendix 2 lists 25 quality indicators and measures useful to measure different aspects of a
dataset’s quality, for phase 1 of the error framework. Not all these indicators would be measured
and reported on for any given output. Instead, after you’ve completed a basic assessment of the
sources of error in phase 1, use this list to provide suggestions for how to measure or monitor the
error sources that appear to be the most important for a particular dataset.
The indicators in this document are quite generic and most apply to almost any dataset. In some
cases more specific or tailored indicators might be better for measuring particular sources of error.
However, the generic indicators may provide ideas for the kind of measurements to make.
Having a well-defined data dictionary would help to assess the errors present in phase 1. For
administrative data, Statistics NZ has developed a metadata information spreadsheet to provide the
information needed to calculate the required quality indicators in phase 1.
The template helps to draw attention to the most relevant issues and helps you move from an ad
hoc inspection to a more systematic way of looking at the data. The key and minimal information
required of an administrative dataset includes:
typical administrative use of the data
definition of the target and actual populations
definition of administrative collection unit types(s) and events, whichever is appropriate
definitions of the target concept and corresponding operational target measures (including
reference time period) of key variables
available geographical coverage
collection process, data entry and processes, and changes over time
frequency of collection.
We’ve organised the indicators in this document into six groups based on the error types in the
phase 1 framework. These errors can lead to variance and bias when the dataset is used for a
statistical output.
In general, the risk of bias and variance varies by error source:
Variance Bias
Validity error Low High
Measurement error High High
Processing error High High
Frame (coverage) error Low High
Selection (sampling) error High Low
Missing/redundancy (non-response) error Low High
Sampling error is normally irrelevant for administrative data as, most of the time, the data are
supposed to cover each unit subjected to the administrative regulation. Other error sources are not
always under direct control.

Quality indicators for phase 1 errors
2
List of quality indicators by error type
Validity error
Recommended quality indicators to assess validity errors.
1 Percent of items that deviate from target concept definition
Description
This indicator provides information on the proportion of items from the dataset which deviate from the target concepts. In this context ‘items’ are variables or fields which are to be filled on the final unit record dataset. This indicator presumes that standard international definitions are the ‘gold standard’ for measuring a given target concept. If the output has been designed (possibly as a compromise) to use a non-standard classification or measure it is a sign that the dataset may have some error. Note: When assessing the usability of the variables for a statistical output, this indicator could be calculated relative to the variables needed for the statistical output.
How to calculate
𝑵𝒐. 𝒐𝒇 𝒊𝒕𝒆𝒎𝒔 𝒕𝒉𝒂𝒕 𝒅𝒆𝒗𝒊𝒂𝒕𝒆𝒇𝒓𝒐𝒎 𝒕𝒉𝒆 𝒕𝒂𝒓𝒈𝒆𝒕 𝒄𝒐𝒏𝒄𝒆𝒑𝒕
𝑻𝒐𝒕𝒂𝒍 𝒏𝒐. 𝒐𝒇 𝒊𝒕𝒆𝒎𝒔 𝐱 𝟏𝟎𝟎%
The data required in the formula can be obtained from the ‘Variables’ worksheet of the metadata information spreadsheet. If similar variables exist in datasets in the organisation, one way of facilitating the computation for this indicator is to put side by side the definitions of the variables given by the administrative data provider and the variable definitions available from datasets within the organisation. Graphical representation techniques to compare the distribution of the variables in the administrative dataset with the distribution of similar variables in existing datasets can also provide information on this indicator. If these methods will not provide the desired information, another technique is to link the administrative dataset with an existing dataset with similar variables may provide the desire information. Variable descriptions from the administrative source can sometimes be rather technical, eg composed of references to other variables. Usually the data are collected in response to an administrative decision or regulation, sometimes accompanied by explanatory notes. These texts can sometimes give a more comprehensive view on what is exactly included and what is not included in the variable. Comparison of definitions may have already been done in the past. Feedback from subject matter areas help to validate and refine the first conclusions. Staff handling the administrative data are probably the best source of information on variable definitions if they are willing to help. People who have used the data in other contexts, possibly in the business community, academics, or users in other agencies can be very valuable too. Expert opinions can differ of course, depending on the angle they look from. Taking GST data as an example, experts could be people working at the tax office, but also accountants, tax consultants, lawyers, auditors. Note: When assessing the usability of the variables for a statistical output, this indicator could also be weighted in terms of whether or not the variables are key to the statistical output.

Quality indicators for phase 1 errors
3
2 Percent of items that deviate from Statistics NZ/international standards or definitions
Description
This indicator provides information on the proportion of items from the administrative data which deviate from Statistics NZ/international standards or definitions. In this context ‘items’ are variables or fields which are to be filled on the final unit record dataset. This indicator presumes that standard Statistics NZ or international standards or definitions are the ‘gold standard’ for measuring a given target concept. If the output has been designed (possibly as a compromise) to use a non-standard classification or measure it is a sign that the dataset may have some error. This indicator will facilitate comparison of variables across different datasets that are available for a statistical output. The data required in the formula can be obtained from the ‘Variables’ worksheet of the metadata information spreadsheet. Note: When assessing the usability of the variables for a statistical output, this indicator could be calculated relative to the variables needed for the statistical output.
How to calculate
𝑵𝒐. 𝒐𝒇 𝒊𝒕𝒆𝒎𝒔 𝒕𝒉𝒂𝒕 𝒅𝒆𝒗𝒊𝒂𝒕𝒆𝒔 𝒇𝒓𝒐𝒎 𝒂𝒈𝒓𝒆𝒆𝒅 𝒔𝒕𝒂𝒏𝒅𝒂𝒓𝒅𝒔 𝒐𝒓 𝒅𝒆𝒇𝒊𝒏𝒊𝒕𝒊𝒐𝒏𝒔
𝑻𝒐𝒕𝒂𝒍 𝒏𝒐. 𝒐𝒇 𝒊𝒕𝒆𝒎𝒔 𝐱 𝟏𝟎𝟎%
The methods presented in the previous indicator can also be used to provide information for this indicator. Note: When assessing the usability of the variables for a statistical output, this indicator could also be weighted in terms of whether or not the variables are key to the statistical output.
3 Percent of inconsistent records
Description
This indicator provides information on the proportion of units (or records) from the administrative data which violate logical, legal, accounting or structural relationships between variables in a record. This indicator looks at the consistency of values for combinations of variables in the administrative dataset. It focuses on the extent to which the values for variables in the data source are not (or cannot be made) internally consistent. Examples of inconsistencies are a person in the data source that is male and pregnant or a person who is 10 years old and married. Note: When assessing the usability of the administrative dataset for a statistical output, this indicator could be computed using the relevant variables for the statistical output.

Quality indicators for phase 1 errors
4
How to calculate
𝑵𝒐. 𝒐𝒇 𝒓𝒆𝒍𝒆𝒗𝒂𝒏𝒕 𝒖𝒏𝒊𝒕𝒔 𝒕𝒉𝒂𝒕 𝒇𝒂𝒊𝒍 𝒄𝒐𝒏𝒔𝒊𝒔𝒕𝒆𝒏𝒄𝒚 𝒄𝒉𝒆𝒄𝒌𝒔
𝑻𝒐𝒕𝒂𝒍 𝒏𝒐. 𝒐𝒇 𝒓𝒆𝒍𝒆𝒗𝒂𝒏𝒕 𝒖𝒏𝒊𝒕𝒔 𝒄𝒉𝒆𝒄𝒌𝒆𝒅 𝐱 𝟏𝟎𝟎%
An edit rule facilitates the detection of inconsistencies in unit values. It is important to note that for new data sources, it may be difficult to make immediate judgments on relationships between variables or set limits on a variable to satisfy a relationship with another variable as soon as data arrives. These require good knowledge of the data. This is obviously something that has to be built up over time. In general, it can be stated that inconsistent values are all values that do not satisfy relations that hold by definition or a combination of values that is not logical is erroneous.
4 Percent of items affected by respondent comprehension of questions asked in collection
process
Description
This indicator provides information on the proportion of items from the administrative data which are affected by the quality of questions asked in the data collection process. Assistance may be required from experts from Questionnaire Methodology and Development. Note: When assessing the usability of the variables for a statistical output, this indicator could be calculated relative to the variables needed for the output.
How to calculate
𝑵𝒐. 𝒐𝒇 𝒊𝒕𝒆𝒎𝒔 𝒂𝒇𝒇𝒆𝒄𝒕𝒆𝒅 𝒃𝒚 𝒓𝒆𝒔𝒑𝒐𝒏𝒅𝒆𝒏𝒕 𝒄𝒐𝒎𝒑𝒓𝒆𝒉𝒆𝒏𝒔𝒊𝒐𝒏
𝑻𝒐𝒕𝒂𝒍 𝒏𝒐. 𝒐𝒇 𝒊𝒕𝒆𝒎𝒔 𝐱 𝟏𝟎𝟎%
The data required in the formula can be obtained from the ‘Variables’ worksheet of the Metadata Information spreadsheet. Note: When assessing the usability of the variables for a statistical output, this indicator could also be weighted in terms of whether or not the variables are key to the statistical output.
Related qualitative indicators:
Qualitative indicators Description
Describe the primary purpose of the data collection for each source
Providing information on the primary purpose of a data collection enables users to assess whether the administrative data are relevant to their needs.
Describe the main uses of the administrative dataset
This indicator should capture how well the administrative data support users’ needs.
Describe differences in concepts, definitions, and classifications
Gaps between the target concepts and operational definitions and classifications can have an effect on the relevance of an administrative data to the user. Any gaps and reasons for the differences should be

Quality indicators for phase 1 errors
5
described. Any methods used to fill the gaps should be stated.
Describe the data collection method This indicator provides information on how well target concepts are measured.
Describe the reference time period for the data collection
This indicator provides information on how well target concepts are measured.
Describe changes over time in the administration of data collection and assess the likely impact of these on the definition of concepts and classifications
These can include changes in concepts, definitions, data collection purposes, data collection methods, file structure and format of the administrative data over time, as such changes can cause problems with comparability over time. Changes should be highlighted and an explanation of their effects on the definition of concepts and classifications explained to enable the user to assess comparability over time. This also enables users to assess whether the administrative data are still relevant to their needs after these changes have been carried out.
Measurement error
Contacting people who not only know the theory but are also acquainted with some of the practical
aspects of the administrative data collection is an opportunity to see how customers use the data
and the procedures, and can highlight points of interest that need to be investigated. This is one
technique that can be used to assess measurement errors.
People with day-to-day knowledge of the administrative data collection will be able to point out
major quality issues. “We know that changes in variable x are usually not reported,..” or “second
quarter data arrive later because...”
Recommended quality indicators to assess measurement errors are below.
5 Item non-response
Description
This indicator provides information on the extent of missing values for a variable. Knowing the proportion of units that have missing values for a variable is useful in determining the suitability of a variable for a statistical output since nonresponse is a potential for bias. Notes: 1. If a dataset has a large number of variables, this indicator may be calculated only for key
variables. 2. When assessing the usability of the variables for a statistical output, this indicator could be
calculated only for variables needed for the output.

Quality indicators for phase 1 errors
6
How to calculate
𝑵𝒐. 𝒐𝒇 𝒖𝒏𝒊𝒕𝒔 𝒕𝒉𝒂𝒕 𝒉𝒂𝒗𝒆 𝒎𝒊𝒔𝒔𝒊𝒏𝒈 𝒗𝒂𝒍𝒖𝒆𝒔
𝑻𝒐𝒕𝒂𝒍 𝒏𝒐. 𝒐𝒇 𝒖𝒏𝒊𝒕𝒔 𝐱 𝟏𝟎𝟎%
The user needs to be aware of the fact that for some objects that no value is expected for one or more variables. The variables for which this is the case need to be excluded from the evaluation. This method should only focus on a limited number of variables and not all variables. A unit with all variables missing is referred to as unit non-response and is assessed in the representation side. Graphical methods can also be used to identify missing values. Note: Do not count valid zeroes as missing.
6 Item imputation rate
Description
This indicator provides information on the impact of the values of a variable modified by editing and imputation by the administrative data provider. Knowing the proportion of units that have been imputed for a variable is useful in determining the suitability of a variable for a statistical output. Notes: 1. If a dataset has a large number of variables, this indicator may be calculated only for key
variables. 2. When assessing the usability of the variables for a statistical output, this indicator could be
calculated only for variables needed for the output.
How to calculate
𝑵𝒐. 𝒐𝒇 𝒊𝒎𝒑𝒖𝒕𝒆𝒅 𝒖𝒏𝒊𝒕𝒔
𝑻𝒐𝒕𝒂𝒍 𝒏𝒐. 𝒐𝒇 𝒖𝒏𝒊𝒕𝒔 𝐱 𝟏𝟎𝟎%
This rate can only be calculated when the imputed cells are marked by the data source provider. When the data source provider does not mark imputed values, the alternative option is to contact the data source holder and request this information.
7 Percentage of records from proxies
Description
This indicator provides information on the proportion of units from the administrative data whose data were provided by proxies. It is acknowledged that a proxy response is more often of inferior quality to self-response. Proxy response has the same potential as nonresponse from a respondent; ie, it has a potential for non-response bias. A proxy response is usually of similar quality as a self-response if the questions are objective and public circumstances or events. When the questions are more subjective or delve into private circumstances or events, a proxy response is more often of inferior quality to self-response. Therefore, if proxy response rates are high for a variable, the usability of the variable may be doubtful. Note: When assessing the usability of the administrative dataset for a statistical output, this indicator could be computed using the relevant variables for the statistical output.

Quality indicators for phase 1 errors
7
How to calculate
𝑵𝒐. 𝒐𝒇 𝒖𝒏𝒊𝒕𝒔 𝒘𝒉𝒐𝒔𝒆 𝒅𝒂𝒕𝒂 𝒘𝒆𝒓𝒆 𝒑𝒓𝒐𝒗𝒊𝒅𝒆𝒅 𝒃𝒚 𝒑𝒓𝒐𝒙𝒊𝒆𝒔
𝑻𝒐𝒕𝒂𝒍 𝒏𝒐. 𝒐𝒇 𝒓𝒖𝒏𝒊𝒔 𝐱 𝟏𝟎𝟎%
8 Lagged time between reference period and receipt of data
Description
The timeliness of the data is important since this allows the customer to determine the value of the information from the time it is available and the event or phenomenon it describes. The next three indicators are used to measure the timeliness of an administrative dataset. This indicator provides information on the lapsed time between the end of the reference period and the time of receipt of the data source. Data sources that can only deliver information after the time this information was needed in producing statistics are useless for the user. Note: When assessing the usability of the administrative dataset for a statistical product, the effects of any lack of timeliness on the statistical product should be described.
How to calculate
𝑫𝒂𝒕𝒆 𝒐𝒇 𝒓𝒆𝒄𝒆𝒊𝒑𝒕 𝒃𝒚 𝑺𝒕𝒂𝒕𝒊𝒔𝒕𝒊𝒄𝒔 𝑵𝒁− 𝑫𝒂𝒕𝒆 𝒐𝒇 𝒕𝒉𝒆 𝒆𝒏𝒅 𝒐𝒇 𝒕𝒉𝒆 𝒓𝒆𝒇𝒆𝒓𝒆𝒏𝒄𝒆 𝒑𝒆𝒓𝒊𝒐𝒅 𝒐𝒗𝒆𝒓 𝒘𝒉𝒊𝒄𝒉 𝒕𝒉𝒆 𝒅𝒂𝒕𝒂 𝒑𝒓𝒐𝒗𝒊𝒅𝒆𝒓 𝒓𝒆𝒑𝒐𝒓𝒕𝒔
9 Punctuality
Description
This indicator gives details of the time lag between the scheduled (or expected/agreed upon with Statistics NZ) and actual delivery date of the data. The punctuality indicator focuses on the possible time lag between the actual delivery date of the administrative data and the date it should have been delivered. This difference greatly affects the usability of the data source by Statistics NZ. For frequently produced statistics, such as monthly statistics, the timely availability of administrative data is vital. Any delay in delivery affects the balance between the timeliness of the output and the quality of the statistics produced. Note: When assessing the usability of the administrative dataset for a statistical product, any reasons for the delay should be documented along with their effects on the statistical product.
How to calculate
𝑫𝒂𝒕𝒆 𝒐𝒇 𝒓𝒆𝒄𝒆𝒊𝒑𝒕 𝒃𝒚 𝑺𝒕𝒂𝒕𝒊𝒔𝒕𝒊𝒄𝒔 𝑵𝒁 − 𝑫𝒂𝒕𝒆 𝒂𝒈𝒓𝒆𝒆𝒅 𝒖𝒑𝒐𝒏 𝒂𝒔 𝒔𝒕𝒊𝒑𝒖𝒍𝒂𝒕𝒆𝒅 𝒊𝒏 𝑴𝑶𝑼

Quality indicators for phase 1 errors
8
10 Overall time lag
Description
This indicator provides information on how soon after the end of the reference period for the administrative data Statistics NZ can use the data. This includes the predicted time to needed to assess the quality of the administrative data. Efficient methods are needed to evaluate data sources required in the production of frequently produced statistics, eg monthly statistics. Note: When assessing the usability of the administrative dataset for a statistical product, any reasons for the overtime lag should be documented along with their effects on the statistical product.
How to calculate
𝑷𝒓𝒆𝒅𝒊𝒄𝒕𝒆𝒅 𝒅𝒂𝒕𝒆 𝒂𝒕 𝒘𝒉𝒊𝒄𝒉 𝑺𝒕𝒂𝒕𝒊𝒔𝒕𝒊𝒄𝒔 𝑵𝒁 𝒅𝒆𝒄𝒍𝒂𝒓𝒆𝒔 𝒕𝒉𝒂𝒕 𝒕𝒉𝒆 𝒔𝒐𝒖𝒓𝒄𝒆 𝒅𝒂𝒕𝒂 𝒄𝒂𝒏 𝒃𝒆 𝒖𝒔𝒆𝒅− 𝑫𝒂𝒕𝒆 𝒐𝒇 𝒕𝒉𝒆 𝒆𝒏𝒅 𝒐𝒇 𝒕𝒉𝒆 𝒓𝒆𝒇𝒆𝒓𝒆𝒏𝒄𝒆 𝒑𝒆𝒓𝒊𝒐𝒅 𝒐𝒗𝒆𝒓 𝒘𝒉𝒊𝒄𝒉 𝒕𝒉𝒆 𝒅𝒂𝒕𝒂 𝒑𝒓𝒐𝒗𝒊𝒅𝒆𝒓 𝒓𝒆𝒑𝒐𝒓𝒕𝒔
11 Percent of units in administrative data which fail checks
Description
This is a standard indicator which can be used for all kinds of datasets. Edit rules are most often used to detect errors in unit values. However, there are more efficient editing techniques available to detect other types of errors like outliers and influential errors than edit rules. The proportion of units that fail one or more of these edits is a good indicator of issues such as reporting or processing inconsistencies in a dataset. It is good practice to flag units that fail edit checks to help customers determine the best method to resolve these errors. This checking can either be based on a model, checking against other data sources (admin or survey), internet research, or through direct contact with the units. Notes: 1. If a dataset has a large number of variables, this indicator may be calculated only for key
variables. 2. When assessing the usability of the variables for a statistical output, this indicator could be
calculated only for variables needed for the output.
How to calculate
%100xchecked units relevant of no. Total
failed and checked data admin in units relevant of No.
Notes: 1. This indicator could be applied to each edit check, or a class of edit checks which are likely to
pick up problems with a certain aspect of the data. 2. If the validation is done automatically and the system does not flag or record this in some way,
this should be noted. 3. Users should state the number of checks done, and the proportion of data covered by these
checks.

Quality indicators for phase 1 errors
9
12 Stability of variables
Description
This indicator provides information on the changes of variables or values over time which we don’t expect to change much over time. Thus, this indicator is only meaningful for a variable that is present (and whose definition does not change) in the dataset for some period of time. This indicator is especially useful for a variable that defines essential classifications which should remain stable between reporting periods. Examples of these variables are: sex, region (geographical), ANZSIC code, and occupation code. The stability of a variable depends on the level at which its values are observed. This indicator provides information on the extent to which values of a variable, which is expected to be stable over a period of time, change in some direction.
How to calculate
%100xchecked units relevant of no. Total
failed and checked data admin in units relevant of No.
The percent change in the values of a variable is one of three ways the indicator, stability of variables, can be measured. Another technique to provide this information is through the use of graphical methods, like a bar plot and scatter plot. The third method is through the use of a correlation coefficient. A variable highly correlated with the stable variable is required. The required variable should have data for the reporting periods being compared. For categorical data, use of Cramer’s V is recommended.
Related qualitative indicators:
Qualitative indicators Description
Describe processes employed by the administrative data provide to reduce measurement error
Describing processes to reduce measurement error indicates to users the accuracy and reliability of the measures.
Context bias (aka Selectivity from Blue ETS)
Are there particular circumstances in which the information is being collected affects the response that is given? For example, it is known that many New Zealanders think government departments swap information and this may affect, for example, how they give their income to a government agency. Statistics NZ-sponsored research has shown that Māori can change their ethnicity depending on the context in which the information is collected. There may be under-reporting of income or over-reporting of expenses.

Quality indicators for phase 1 errors
10
How to assess: Check the level and distribution of a particular variable in your dataset with some other statistical dataset that collects the same information to assess whether context is causing bias. This can be done using histograms.
Noise / seasonal variation
If noise or seasonal variation exists in the administrative data, check if seasonal adjustment helps to explain value movements. Describe the solution found.
Rounding error and rounding / heaping Check for excessive rounding error and receipt of rough estimates
Detecting missing values Describe methods for detecting missing values
Imputation methods Describe how missing values are handled
Processing error
Processing errors may also arise during the preparation for transmission of the data to Statistics NZ.
Recommended quality indicators to assess processing errors are below.
13 Percent of transcription errors
Description
This indicator provides information on the proportion of units of a variable coded or recorded incorrectly. Notes: 1. If a dataset has a large number of variables, this indicator may be calculated only for key
variables 2. When assessing the usability of the variables for a statistical output, this indicator could be
calculated only for variables needed for the output. 3. When assessing the usability of the variables for a statistical output, this indicator could be
classified as a selection error. This will hold if the variable is used for classifying units into groups. In this case, this is more referred to as misclassification rate.
How to calculate
𝑵𝒐. 𝒐𝒇 𝒓𝒆𝒍𝒆𝒗𝒂𝒏𝒕 𝒖𝒏𝒊𝒕𝒔 𝒕𝒉𝒂𝒕 𝒉𝒂𝒗𝒆 𝒃𝒆𝒆𝒏 𝒄𝒐𝒅𝒆𝒅 𝒊𝒏𝒄𝒐𝒓𝒓𝒆𝒄𝒕𝒍𝒚
𝑻𝒐𝒕𝒂𝒍 𝒏𝒐. 𝒐𝒇 𝒓𝒆𝒍𝒆𝒗𝒂𝒏𝒕 𝒖𝒏𝒊𝒕𝒔 𝐱 𝟏𝟎𝟎%
The data required in the formula can be obtained from the ‘Data Collection’ worksheet of the metadata information spreadsheet.

Quality indicators for phase 1 errors
11
14 Modification rate
Description
This indicator provides information on the rate of editing changes done on a variable in the administrative data. Editing changes refer to changes to non-missing values being changed to other non-missing values, which in most cases will be the result of editing. Knowing the proportion of units that have been changed for a variable is useful in determining the suitability of a variable for a statistical output. Notes: 1. If a dataset has a large number of variables, this indicator may be calculated only for key
variables 2. When assessing the usability of the variables for a statistical output, this indicator could be
calculated only for variables needed for the output.
How to calculate
𝑵𝒐. 𝒐𝒇𝒓𝒆𝒍𝒆𝒗𝒂𝒏𝒕 𝒖𝒏𝒊𝒕𝒔 𝒕𝒉𝒂𝒕 𝒉𝒂𝒗𝒆 𝒖𝒏𝒅𝒆𝒓𝒈𝒐𝒏𝒆 𝒆𝒅𝒊𝒕𝒊𝒏𝒈 𝒄𝒉𝒂𝒏𝒈𝒆𝒔
𝑻𝒐𝒕𝒂𝒍 𝒏𝒐. 𝒐𝒇 𝒓𝒆𝒍𝒆𝒗𝒂𝒏𝒕 𝒖𝒏𝒊𝒕𝒔 𝐱 𝟏𝟎𝟎%
A user is only able to determine this when the modified cells are marked by the data source provider. When the data source provider does not mark edited values, the alternative option is to contact the data source holder and request this information.
15 Readability
Description
This indicator provides information on the proportion of records that can be accessed using existing software for reading data. The readability indicator focuses on the accessibility of the file and the data in the file. Examples of problems in this area are a file of an unknown format, a corrupted file, a file with an unfamiliar character set, or a file that cannot be decoded. Since a data source delivery can consist of a number of files, all files need to be dealt with.
How to calculate
𝑵𝒐. 𝒐𝒇𝒓𝒆𝒍𝒆𝒗𝒂𝒏𝒕 𝒖𝒏𝒊𝒕𝒔 𝒘𝒊𝒕𝒉 𝒖𝒏𝒓𝒆𝒂𝒅𝒂𝒃𝒍𝒆 𝒅𝒂𝒕𝒂
𝑻𝒐𝒕𝒂𝒍 𝒏𝒐. 𝒐𝒇 𝒓𝒆𝒍𝒆𝒗𝒂𝒏𝒕 𝒖𝒏𝒊𝒕𝒔 𝐱 𝟏𝟎𝟎%
or
𝑵𝒐. 𝒐𝒇 𝒇𝒊𝒍𝒆𝒔 𝒘𝒊𝒕𝒉 𝒂𝒏 𝒖𝒏𝒌𝒏𝒐𝒘𝒏 𝒆𝒙𝒕𝒆𝒏𝒔𝒊𝒐𝒏, 𝒄𝒐𝒓𝒓𝒖𝒑𝒕𝒆𝒅 𝒐𝒕 𝒄𝒂𝒏𝒏𝒐𝒕 𝒃𝒆 𝒐𝒑𝒆𝒏𝒆𝒅
𝑻𝒐𝒕𝒂𝒍 𝒏𝒐. 𝒐𝒇 𝒓𝒆𝒄𝒆𝒊𝒗𝒆𝒅 𝒇𝒊𝒍𝒆𝒔 𝐱 𝟏𝟎𝟎%
or
𝑺𝒊𝒛𝒆 𝒐𝒇 𝒖𝒏𝒓𝒆𝒂𝒅𝒂𝒃𝒍𝒆 𝒇𝒊𝒍𝒆 (𝑴𝑩/𝑮𝑩)
𝑻𝒐𝒕𝒂𝒍 𝒔𝒊𝒛𝒆 𝒐𝒇 𝒇𝒊𝒍𝒆 𝒓𝒆𝒄𝒆𝒊𝒗𝒆𝒅 (𝑴𝑩/𝑮𝑩) 𝐱 𝟏𝟎𝟎%

Quality indicators for phase 1 errors
12
Related qualitative indicators:
Qualitative indicators Description
Describe the main sources of processing error
Processing error is the error that occurs when processing data. It includes errors in data capture, coding, editing, and tabulation of the data. It is not usually possible to calculate processing error exactly. However, outputs should be accompanied by a definition of processing error and a description of the main sources of the error.
Describe the data processing known to be required on the administrative data source in terms of the types of edits carried out
Data processing may sometimes be required to check or improve the quality of the administrative data or create new variables to be used for statistical purposes. The user should be made aware of how and why data processing is used.
Describe the data processing known to be required on the administrative data source to deal with non-response
Data processing is often required to deal with non-response. The user should be made aware of how and why particular data processing methods are used. Comment on methods used.
Quality control This informs users of the mechanisms in place to minimise processing error by ensuring accurate data transfer and processing.
Skill level of coders / editors Assess their training, attitude, & error rate.
System bias Check if the software processing logic is correct and not biased.
Use of standard classifications Check if standard or ad hoc classifications are used.
Extent of data manipulation Assess changes to original files (edits, reformats, aggregations, derivations, discards, storage).
Confidentialisation method Is it automated? Which method is used? Is consequential work done?
System changes Have new systems been implemented?
Frame error
Recommended quality indicators to assess frame errors are below.
16 Lag in updating population changes
Description
This indicator provides information in delays in registration.
How to calculate
𝑫𝒂𝒕𝒆 𝒐𝒇 𝒄𝒂𝒑𝒕𝒖𝒓𝒊𝒏𝒈 𝒕𝒉𝒆 𝒄𝒉𝒂𝒏𝒈𝒆 𝒃𝒚 𝒅𝒂𝒕𝒂 𝒑𝒓𝒐𝒗𝒊𝒅𝒆𝒓
− 𝑫𝒂𝒕𝒆 𝒄𝒉𝒂𝒏𝒈𝒆 𝒐𝒄𝒄𝒖𝒓𝒓𝒆𝒅 𝒊𝒏 𝒕𝒉𝒆 𝒑𝒐𝒑𝒖𝒍𝒂𝒕𝒊𝒐𝒏

Quality indicators for phase 1 errors
13
The next two indicators measure coverage of the administrative data. Coverage is closely related to the definition of the administrative target concept, as the concept is usually defined in operational terms (by how it is measured). The following sample criteria describe what unit is ‘in’ and what is ‘out’ or not covered. Some of the most common sources of over- or undercoverage are:
Thresholds in size or quantity: a good known example is the GST threshold. If the volume of turnover is below a defined limit, no GST declaration is required.
Geographic criteria: different possibilities exist. When the administrative source holds data that is subject to regional differences in legislation or administrative practices, the chance exists that at least part of the variables do not cover the whole territory.
Reporting delay can be another source of under- or overcoverage. Are respondents expected to register and deregister in time? In many cases there is little or no incentive to deregister and inactive units accumulate in the administrative register. Inactive units are sometimes kept for administrative purposes and show false signs of activity due to the administrative handling of the units.
It is important to distinguish problems of under- and overcoverage, since a dataset which suffers from both may appear to have the right number of objects despite the fact that it does not represent the target population well. For example, if we use the list of taxpayers in a country to measure the permanent resident population there would be permanent residents that don’t pay tax (undercoverage), and non-permanent residents that do pay tax (overcoverage), and reporting the raw count of people compared with a census count would make the dataset look better than it really is for this purpose.
Where a reliable population count or list is available (eg a census or business frame) it can be used as the target population.
17 Undercoverage
Description
Undercoverage occurs when there are units in the target population that are not on the accessible set.
How to calculate
𝑵𝒐. 𝒐𝒇𝒓𝒆𝒄𝒐𝒓𝒅𝒔 𝒊𝒏 𝒕𝒉𝒆 𝒕𝒂𝒓𝒈𝒆𝒕 𝒑𝒐𝒑𝒖𝒍𝒂𝒕𝒊𝒐𝒏 𝒃𝒖𝒕 𝒏𝒐𝒕 𝒊𝒏 𝒕𝒉𝒆 𝒂𝒄𝒄𝒆𝒔𝒔𝒊𝒃𝒍𝒆 𝒔𝒆𝒕
𝑻𝒐𝒕𝒂𝒍 𝒏𝒐. 𝒐𝒇 𝒖𝒏𝒊𝒕𝒔 𝒊𝒏 𝒕𝒉𝒆 𝒕𝒂𝒓𝒈𝒆𝒕 𝒑𝒐𝒑𝒖𝒍𝒂𝒕𝒊𝒐𝒏
18 Overcoverage
Description
Overcoverage occurs when there are units in the accessible set that are not in the target population.
How to calculate 𝑵𝒐. 𝒐𝒇𝒓𝒆𝒄𝒐𝒓𝒅𝒔 𝒊𝒏 𝒕𝒉𝒆 𝒂𝒄𝒄𝒆𝒔𝒔𝒊𝒃𝒍𝒆 𝒔𝒆𝒕 𝒃𝒖𝒕 𝒏𝒐𝒕 𝒊𝒏 𝒕𝒉𝒆 𝒕𝒂𝒓𝒈𝒆𝒕 𝒑𝒐𝒑𝒖𝒂𝒍𝒕𝒊𝒐𝒏
𝑻𝒐𝒕𝒂𝒍 𝒏𝒐. 𝒐𝒇 𝒖𝒏𝒊𝒕𝒔 𝒊𝒏 𝒕𝒉𝒆 𝒕𝒂𝒓𝒈𝒆𝒕 𝒑𝒐𝒑𝒖𝒍𝒂𝒕𝒊𝒐𝒏
Quality indicators for phase 1 errors
14
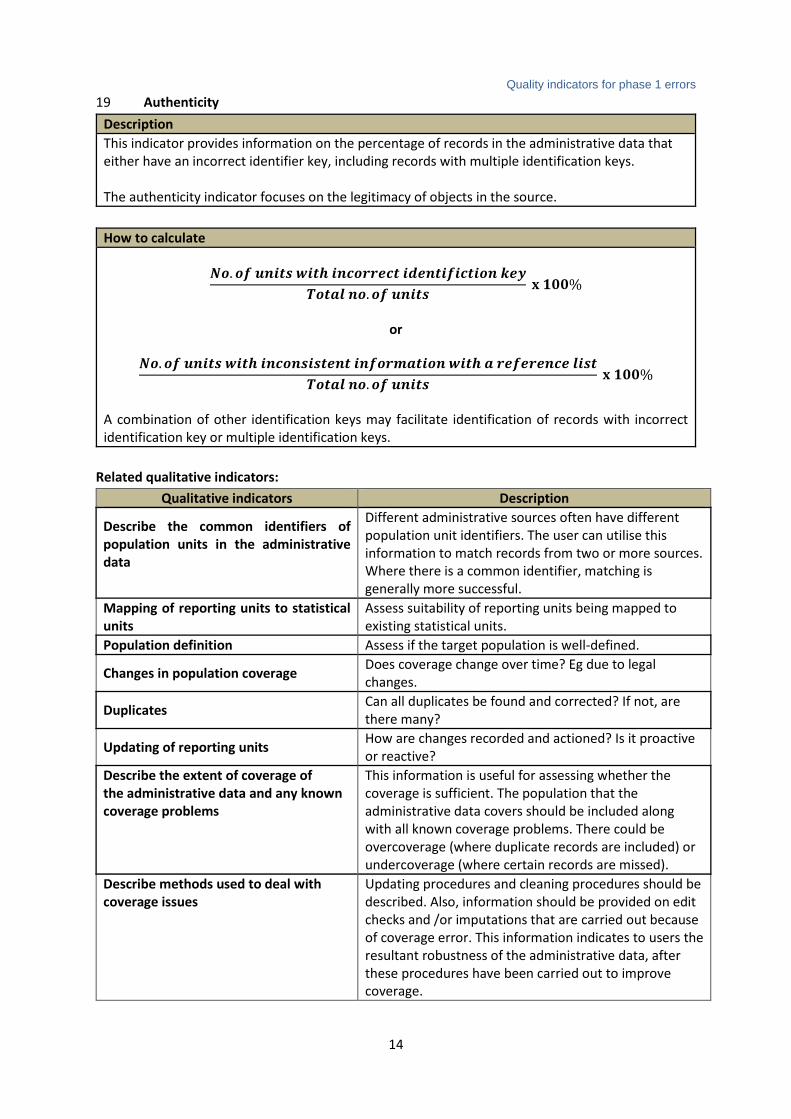
19 Authenticity
Description
This indicator provides information on the percentage of records in the administrative data that either have an incorrect identifier key, including records with multiple identification keys. The authenticity indicator focuses on the legitimacy of objects in the source.
How to calculate
𝑵𝒐. 𝒐𝒇 𝒖𝒏𝒊𝒕𝒔 𝒘𝒊𝒕𝒉 𝒊𝒏𝒄𝒐𝒓𝒓𝒆𝒄𝒕 𝒊𝒅𝒆𝒏𝒕𝒊𝒇𝒊𝒄𝒕𝒊𝒐𝒏 𝒌𝒆𝒚
𝑻𝒐𝒕𝒂𝒍 𝒏𝒐. 𝒐𝒇 𝒖𝒏𝒊𝒕𝒔 𝐱 𝟏𝟎𝟎%
or
𝑵𝒐. 𝒐𝒇 𝒖𝒏𝒊𝒕𝒔 𝒘𝒊𝒕𝒉 𝒊𝒏𝒄𝒐𝒏𝒔𝒊𝒔𝒕𝒆𝒏𝒕 𝒊𝒏𝒇𝒐𝒓𝒎𝒂𝒕𝒊𝒐𝒏 𝒘𝒊𝒕𝒉 𝒂 𝒓𝒆𝒇𝒆𝒓𝒆𝒏𝒄𝒆 𝒍𝒊𝒔𝒕
𝑻𝒐𝒕𝒂𝒍 𝒏𝒐. 𝒐𝒇 𝒖𝒏𝒊𝒕𝒔 𝐱 𝟏𝟎𝟎%
A combination of other identification keys may facilitate identification of records with incorrect identification key or multiple identification keys.
Related qualitative indicators:
Qualitative indicators Description
Describe the common identifiers of population units in the administrative data
Different administrative sources often have different population unit identifiers. The user can utilise this information to match records from two or more sources. Where there is a common identifier, matching is generally more successful.
Mapping of reporting units to statistical units
Assess suitability of reporting units being mapped to existing statistical units.
Population definition Assess if the target population is well-defined.
Changes in population coverage Does coverage change over time? Eg due to legal changes.
Duplicates Can all duplicates be found and corrected? If not, are there many?
Updating of reporting units How are changes recorded and actioned? Is it proactive or reactive?
Describe the extent of coverage of the administrative data and any known coverage problems
This information is useful for assessing whether the coverage is sufficient. The population that the administrative data covers should be included along with all known coverage problems. There could be overcoverage (where duplicate records are included) or undercoverage (where certain records are missed).
Describe methods used to deal with coverage issues
Updating procedures and cleaning procedures should be described. Also, information should be provided on edit checks and /or imputations that are carried out because of coverage error. This information indicates to users the resultant robustness of the administrative data, after these procedures have been carried out to improve coverage.

Quality indicators for phase 1 errors
15
Selection error
Recommended quality measures to assess selection errors are below.
20 Adherence to reporting period
Description
This indicator provides information on the proportion of units that provide data for a different period than the required reporting period for the administrative dataset. This may be due to lags, delay, or non-compliance with reporting period. If the periods are not for the appropriate reporting period, then some imputation may be necessary for a statistical output using this administrative dataset. Therefore, when assessing the usability of an administrative dataset for a statistical output, this will have a negative impact on the quality of the statistical output.
How to calculate
𝑵𝒐. 𝒐𝒇 𝒖𝒏𝒊𝒕𝒔 𝒕𝒉𝒂𝒕 𝒅𝒐 𝒏𝒐𝒕 𝒂𝒅𝒉𝒆𝒓𝒆 𝒕𝒐 𝒕𝒉𝒆 𝒓𝒆𝒑𝒐𝒓𝒕𝒊𝒏𝒈 𝒑𝒆𝒓𝒊𝒐𝒅
𝑻𝒐𝒕𝒂𝒍 𝒏𝒐. 𝒐𝒇 𝒖𝒏𝒊𝒕𝒔 𝐱 𝟏𝟎𝟎%
21 Dynamics of births and deaths
Description
This indicator provides information on changes in birth and death rates of units in administrative data over time.
How to calculate
% 𝒐𝒇 𝑩𝒊𝒓𝒕𝒉𝒔 𝒕 =𝑩𝒊𝒓𝒕𝒉𝒔 𝒕
𝑻𝒐𝒕𝒂𝒍 𝒏𝒐. 𝒐𝒇 𝒖𝒏𝒊𝒕𝒔 𝒕 𝐱 𝟏𝟎𝟎% =
𝑩𝒊𝒓𝒕𝒉𝒔 𝒕
𝑩𝒊𝒓𝒕𝒉𝒔 𝒕 + 𝑨𝒍𝒊𝒗𝒆 𝒕𝒙𝟏𝟎𝟎%
% 𝒐𝒇 𝑫𝒆𝒂𝒕𝒉𝒔 𝒕 − 𝟏 =𝑫𝒆𝒂𝒕𝒉𝒔 𝒕
𝑻𝒐𝒕𝒂𝒍 𝒏𝒐. 𝒐𝒇 𝒖𝒏𝒊𝒕𝒔 𝒕 − 𝟏 𝐱 𝟏𝟎𝟎% =
𝑫𝒆𝒂𝒕𝒉𝒔 𝒕
𝑨𝒍𝒊𝒗𝒆 𝒕 + 𝑫𝒆𝒂𝒕𝒉𝒔 𝒕𝒙𝟏𝟎𝟎%
𝑪𝒉𝒂𝒏𝒈𝒆 𝒊𝒏 𝒖𝒏𝒊𝒕𝒔 =𝑩𝒊𝒓𝒕𝒉𝒔 𝒕 − 𝑫𝒆𝒂𝒕𝒉𝒔 𝒕
𝑨𝒍𝒊𝒗𝒆 𝒕 + 𝑫𝒆𝒂𝒕𝒉𝒔 𝒕𝒙𝟏𝟎𝟎%

Quality indicators for phase 1 errors
16
22 Inconsistent objects/units
Description
This indicator provides information on the overall consistency of the objects in the administrative dataset. It focuses on the extent to which the objects in the administrative dataset are not (or cannot be made) internally consistent. Examples are objects involved in non-logical relations with other (aggregates of) objects in the data source. The indicator is meaningful only when multiple objects are included in the data source. The indicator checks the inconsistency of objects within the data source; eg internal inconsistency. An example of such an error is a person in the data source that is assigned to multiple households or a local business unit that is assigned to more than one enterprise. In general, it can be stated that inconsistencies are errors that one is certain of.
How to calculate
𝑵𝒐. 𝒐𝒇 𝒊𝒏𝒄𝒐𝒏𝒔𝒊𝒕𝒆𝒏𝒕 𝒖𝒏𝒊𝒕𝒔
𝑻𝒐𝒕𝒂𝒍 𝒏𝒐. 𝒐𝒇 𝒖𝒏𝒊𝒕𝒔 𝐱 𝟏𝟎𝟎%
Related qualitative indicator:
Qualitative indicator Description
Describe any issues with classification and how these issues are dealt with
Whereas a statistical institution can decide upon and adjust the classifications used in its own surveys to meet user needs, the institution usually has little or no influence over those used by administrative sources. Issues with classification and how these issues are dealt with should be described so that the user can decide whether the source meets their needs.
Missing/redundancy error
Recommended quality indicators to assess missing/redundancy errors are below.
23 Unit non-response rate
Description
This is a standard indicator and provides information on the completeness of the data provided in the administrative data.
How to calculate
𝑵𝒐. 𝒐𝒇 𝒖𝒏𝒊𝒕𝒔 𝒕𝒉𝒂𝒕 𝒉𝒂𝒗𝒆 𝒏𝒐 𝒅𝒂𝒕𝒂
𝑻𝒐𝒕𝒂𝒍 𝒏𝒐. 𝒐𝒇 𝒖𝒏𝒊𝒕𝒔 𝐱 𝟏𝟎𝟎%

Quality indicators for phase 1 errors
17
24 Percentage of duplicate records
Description
This indicator provides information on the proportion of duplicate records present in the administrative data. Duplicate records include units with the same identification number, or units with the same values for a selection of variables or units with the same values for all variables.
How to calculate
𝑵𝒐. 𝒐𝒇 𝒖𝒏𝒊𝒕𝒔 𝒕𝒉𝒂𝒕 𝒉𝒂𝒗𝒆 𝒅𝒖𝒑𝒍𝒊𝒄𝒂𝒕𝒆 𝒓𝒆𝒄𝒐𝒓𝒅𝒔
𝑻𝒐𝒕𝒂𝒍 𝒏𝒐. 𝒐𝒇 𝒖𝒏𝒊𝒕𝒔 𝐱 𝟏𝟎𝟎%
Multiple rows with the same identification key are easily detected and an obvious sign of duplicates. It may however be possible to find more than one candidate identification key. Apart from an identification code there can be a logical key; for example, a combination of name and address that ought to be unique for each row. Testing these natural keys may bring up duplicate records. A typical example is the situation where id numbers are assigned by regional offices. An example is a unit of interest that moves from one region to another and gets a new id number before it is deregistered in its previous region. Capture-recapture techniques allow us to estimate the number of duplicates in the administrative data. These methods involve two (or more) separately compiled but incomplete lists of the members of a population. Comparing the presence of units in the lists gives an estimate of the number of duplicates within a database. Situations where the procedure can be used: to evaluate datasets with the same type of information compiled from different sources and merged, either by the administrative data source or the statistical office. An example is: regionally managed administrative datasets with units listed in more than one region, either with the same or a different identification number. When identification of duplicates is not straightforward, different blocking criteria can be used to match records in the dataset. Comparing the correct matches for the two criteria gives the input for the estimation of the total number of duplicates.
25 Percentage of units that have to be adjusted to create statistical units
Description
This indicator provides information on the proportion of units that have to be adjusted in order to create statistical units. For example, the proportion of data at enterprise group level which therefore need to be split to provide reporting unit data. Note: This is only assessed if reporting units can suitably be mapped to a statistical unit.
How to calculate
𝑵𝒐. 𝒐𝒇 𝒖𝒏𝒊𝒕𝒔 𝒕𝒉𝒂𝒕 𝒉𝒂𝒗𝒆 𝒃𝒆𝒆𝒏 𝒂𝒅𝒋𝒖𝒔𝒕𝒆𝒅
𝑻𝒐𝒕𝒂𝒍 𝒏𝒐. 𝒐𝒇 𝒖𝒏𝒊𝒕𝒔 𝐱 𝟏𝟎𝟎%
Quality indicators for phase 1 errors
18
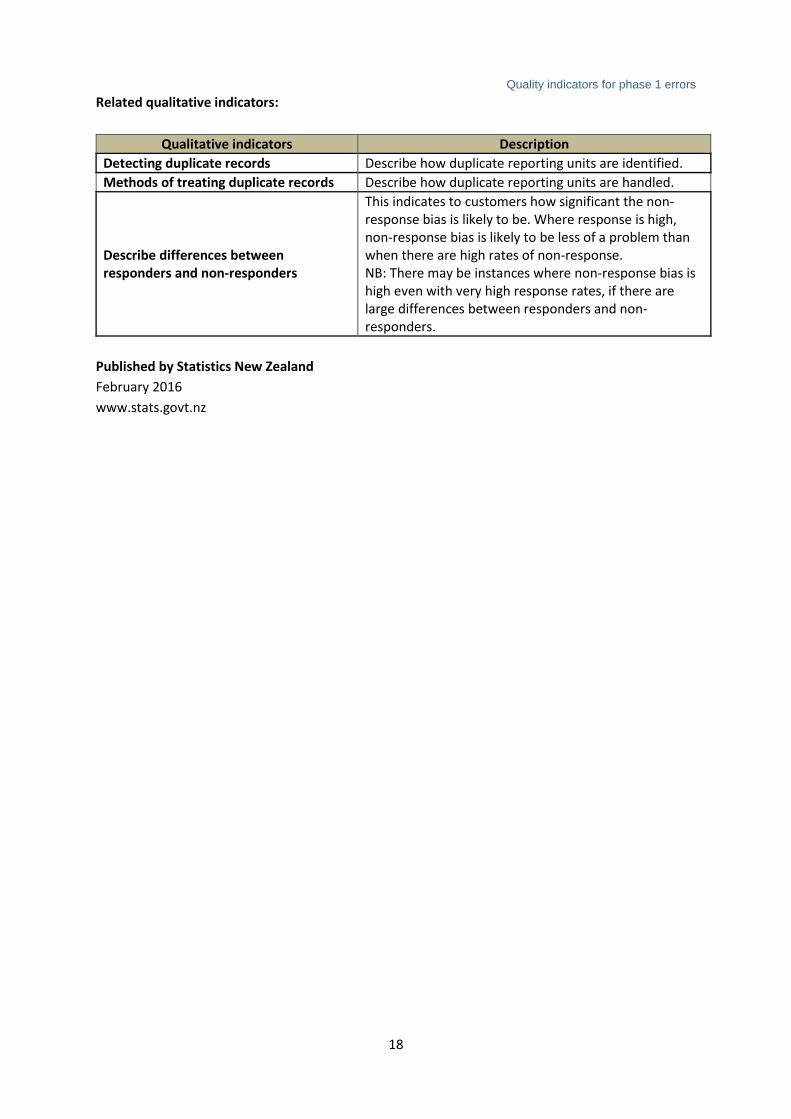
Related qualitative indicators:
Qualitative indicators Description
Detecting duplicate records Describe how duplicate reporting units are identified.
Methods of treating duplicate records Describe how duplicate reporting units are handled.
Describe differences between responders and non-responders
This indicates to customers how significant the non-response bias is likely to be. Where response is high, non-response bias is likely to be less of a problem than when there are high rates of non-response. NB: There may be instances where non-response bias is high even with very high response rates, if there are large differences between responders and non-responders.
Published by Statistics New Zealand
February 2016
www.stats.govt.nz