Quality in U.S. Fruit, Vegetable Marketing - Texas Agricultural Market
49
QUALijiN u.s. FRUIT AND GETABLE MAR TING John P. Nichols· TAMRC Consumer and Product Market Research Report No. CP-1-93 March 1993 • Dr. John P. Nichols is Professor of Agricultural Marketing and Associate Head for Research in the Department of AgriC1,Jltural Economics at Texas A&M University.
Transcript of Quality in U.S. Fruit, Vegetable Marketing - Texas Agricultural Market
QUALijiN u.s. FRUIT AND GETABLE
MAR TING
John P. Nichols·
TAMRC Consumer and Product Market Research Report No. CP-1-93
March 1993
• Dr. John P. Nichols is Professor of Agricultural Marketing and Associate Head for Research in the Department of AgriC1,Jltural Economics at Texas A&M University.

QUALTIY IN U.S. FRUIT ANI) VEGETABLE MARKETING
Texas Agricultural Market Research Center (TAMRC) Consumer and Product Market Research Report No. CP-1-93, by Dr. John P. Nichols, Texas Agricultural Market Research Center, Department of Agricultural Econo~, Texas A&M University, College Station, Texas, March 1993.
ABSTRACT:
Among the most perishable of agricultural commodities, fresh produce is subject to significant variability in quality. Fruits, vegetables and pulses account for approximately 26% of the value of all crops produced in the United States but only 2.6% of cropland. Quality grading is carried out by USDA throqgh the Cooperative Federal-State Inspection System. Quality attributes emphasize exte~ appearance factors including size, shape, color, and defects. Issues of emerging impor~ce include: (1) concern for intrinsic qualities such as nutritive content, (2) improved cOII1IUunication of product-specific quality factors, (3) use of pesticides to achieve cosmetic grade standards, and (4) regulation of quality attributes in international trade.
The Tems Agricultural Market Resean:h CenteIt (TAMRC) has been providing timely, unique, and professional research on a wide range of issues relating to agricultural markets and commodities of importance to Texas and the napon for more than two decades. TAMRC is a market research service ofthe Texas AgrlculturaliExperiment Station and the Texas Agricultural Extension Service. The main TAMRC objective 'is to conduct research leading to expanded and more efficient markets for Texas and U.S. agricultural products. Major TAMRC research divisions include International Market ResearCh, Consumer and Product Market Research, Commodity Market Research, and Contemportlf)' Market Issues Research.
i

QUALI1Y IN U.S. FRUIT AND VEGETABLE MARKETING
EXECUTIVE SUMMARY
Quality plays a central role in the frui~ and vegetable industry. Among the most perishable of agricultural commodities, fresh produce is subject to significant variability in quality and rapid loss of condition in post-harvest handling and distribution.
Fruits, vegetables, and pulses account for approximately 26% of the value of all crops produced in the United States but only 2.6% of cropland. Production is concentrated in a few specialized regions with California and Florida in the lead. Other important areas include the Great Lakes states, the Pacific Northwest, and Texas. Separate production and marketing channels have developed for fresh and processed products. Significant contracting and vertical integration exists in processing channels to facilitate coordination, including quality considerations. Fresh market channels depend on market forces and a system of grades and standards to deliver the quality ch~acteristics desired by consumers.
Quality of fresh produce may be specifi~d in contracts or purchasing arrangements. Official grading is carried out by the USDA Agricultural Marketing Service and the Cooperative Federal-State Inspection system. l1SDA grade standards have been developed for approximately 135 fresh produce items an4 150 processed products. USDA grading is voluntary except where marketing orders hav~ been approved by producers and handlers.
Quality attributes used in USDA grad~ standards emphasize external appearance factors including size, shape, color, and defects. Tolerances for defects are more restrictive for products moving into fresh market channe~. Much of the inspection of fresh fruit and vegetable quality is done by visual examinatiOIl-. Chemical and physical evaluation is more common for products moving into processing pr final processed products. Quality factors for processed products may include sugar ¢ontent, acidity or consistency which lend themselves to mechanical or chemical evaluation techniques.
Consumers indicate that freshness or ripeness is their primary criteria for selecting fresh fruits and vegetables. Taste and appearance or condition were equally important. Nutrition and price were listed less frequently. Sensory inspection of externally apparent factors is the primary way in which consumers ~aluate fresh produce quality. Grade factors have evolved to assist the wholesale trade in sorting and selecting fresh fruits and vegetables to match the consumer's selection process anq preferences.
ii
Of increasing importance is the concern for nutritive content and other intrinsic dimensions of fruit and vegetable quality. Methods of incorporating nutritive content into grade standards available to consumers have not been, and are not likely to be, developed.
Additional issues in communication of quality relate to the nomenclature used in describing grades and the availability of consu$er grades. Grade nomenclature is evolving toward a more simplified system. Consumer gr~es, though available for processed products and some pre-packaged fresh produce items, remain relatively undeveloped for the bulk of fresh fruits and vegetables. The current approach is to provide consumers with more information regarding nutritive content and th~ selection, purchase, and use fresh fruits and vegetables more consistently.
Grades and standards are also being reconsidered in light of the emergence ofviable market channels for organically produced fruits and vegetables. The emphasis of external appearance factors in USDA grade standards ¢tay lead to an over-use of pesticides to meet the standards, according to some critics. Separate certification of organic production is now being developed as a means of identifying produce destined to serve this market segment.
Imports have become an increasingly important source of supply. Controversy has developed over the use ofgrade standards, in conjunction with marketing orders, to regulate the quality of imported produce. Such concerns are evaluated in light of GAIT rules. The recently negotiated North American Free Trade Agreement will keep quality issues in the foreground as phytosanitary provisions of the agreement are implemented, enforced, and monitored.
Production patterns for fruits and vegetables are changing in response to new technology, environmental factors, and consumer demand. Marketing channels are becoming increasingly dominated by large-scale distribution and food retailing firms. The effects of theses changes will be substantial in terms of increased product availability. The average quality offered to consumers may improve as a result. However, the relative balance among important quality attributes, the methods of measuring and quality, the U.S. grading system itself are not likely to be changed greatly.
Fruits and vegetables are an increasingly important component of the consumer's diet. Taste and health or dietary preferences are reinforcing each other. Consistent high levels of quality, as always, will be difficult to achieve for such a diverse and perishable set of products. Consumers have been evolving their concepts of important quality attributes. Challenges to an existing fIXed system of grades and standards will continue to come from both consumers and new suppliers seeking a larger share of the market.
iii

QUALflY IN U.S. FRUIT AND VEGETABLE MARKETING
TABLE OF CONTENTS
ABSTRACf i
EXE.C'UTIVE SUMMARY. . . . . . . . . . . . . . . . . . . . . . . . . . . . . . . . . . . . . . . . . .. ii
T,ABLE OF CON1ENTS . . . . . . . . . . . . . . . . . . . . . . . . . . . . . . . . . . . . . . . . . . . .. iv
IN1'R.ODUCTION . . . . . . . . . . . . . . . . . . . . . . . . . . . . . . . . . . . . . . . . . . . . . . . . .. 1
OVERVIEW OF mE u.s. FRUIT AND VEGET,ABLE INDUSTRY .......... 2 Production Trends . . . . . . . . . . . . . . . . . . . . . . . . . . . . . . . . . . . . . . . . . . . . . 2 Utilization and Consumption ................................... . 11 Imports and Exports ........................................ .. 16 Marketing and the Marketing System . . . . . . . . . . . . . . . . . . . . . . . . . . ... . 16
QUALITY AND FRUIT AND VEGET,ABLE MARKETING ... . . . . . . . . . . . .. 24 Important Quality Attributes .................................... 24 USDA Grading System ........................................ 25 Fruit and Vegetable Grade Standards and Nomenclature .............. 26 Evolution of Grades and Standards ............................... 27 Assessment and Measurement of Quality Factors .......... . . . . . . . . . .. 30 Consumer Information and Awareness of Quality . . . . . . . . . . . . . . . . . . . .. 31
EMERGING QUALITY ISSUES ..................................... 32 Intrinsic Quality Factors . . . . . . . . . . . . . . . . . . . . . . . . . . . . . . . . . . . . . . .. 32 Communicating Quality Information . . . . . . . . . . . . . . . . . . . . . . . . . . . . . .. 33 Quality and Organic Produce . . . . . . . . . . . . . . . . . . . . . . . . . . . . . . . . . . .. 34 Quality Factors in Trade ....................................... 35
ANTICIPATED INDUSTRY CHANGES INFLUENCING QUALITY. ... ..... 36 Utilization and Consumption .................................... 36 Production and Processing .. . . . . . . . . . . . . . . . . . . . . . . . . . . . . . . . . . . .. 37 Market Structure .. ,. . . . . . . . . . . . . . . . . . . . . . . . . . . . . . . . . . . . . . . . . .. 38 Measurement of Quality ....................................... 38
SUMMARY AND CONCLUSIONS ................................... 39
REFERENCES ................................................... 41
iv

LIST OF TABLES
Table 1: Share of Cash Receipts Represented by Fruits and Vegetables, 1989 ...... 3
Table 2: Acreage Devoted to Production of Vegetables, Pulses, and Fruits, 1989 .... 4
Table 3: Farm Value of Production (Cash Receipts) for all Vegetables, Potatoes, and Pulses and Total Crops, 1975, 1980, 1985-90 . . . . . . . . . . . . . . . . . . . . .. 5
Table 4: Value of Production of Citrus and Non-citrus Fruit, 1975, 1980, 1985-90 . . .. 6
Table 5: Farm Value for Vegetable Crops, Potatoes and Pulses, 1989 ............ 7
Table 6: Value of Production for Major Fruit Crops, 1989 ..................... 8
Table 7: Leading States in Production of Fruit Crops, 1989 .................... 9
Table 8: Leading States in Production of Vegetables, 1989 . . . . . . . . . . . . . . . . . . .. 10
Table 9: Utilization of Major Vegetable Crops for Fresh and Processing, 1970 and 1989 .. . . . . . . . . . . . . . . . . . . . . . . . . . . . . . . . . . . . . . . . . .. 12
Table 10: Per Capita Use of Vegetables, Potatoes and Pulses, for Fresh and Processing, 1971 and 1989 .................................. 13
Table 11: Utilization of Selected Fruit Crops for Fresh and Processing, 1970 and 1989 . . . . . . . . . . . . . . . . . . . . . . . . . . . . . . . . . . . . . . . . . .. 14
Table 12: Per Capita Use of Fresh Fruit and Selected Processed Products, 1970 and 1989 . . . . . . . . . . . . . . . . . . . . . . . . . . . . . . . . . . . . . . . . . .. 15
Table 13: U.S. Trade in Fruits and Vegetables, Volume and Value, 1985 to 1989 ... 17
Table 14: Share of Fruits and Vegetables Produced Under Contract and by Vertically Integrated Firms, 1970 and 1980 ............................. 21
Table 15: Highest U.S. Wholesale Standards and Grades for Fresh Apples, 1990 ... 28
Table 16: Highest U.S. Standards and Grades of "U.S. Grade A" Tomato Juice, 1990 29
LIST OF FIGURES
Figure 1: Primary Marketing Channels for Fresh Fruits and Vegetables and Processed Products ....................................... 19
v
QUALITY IN U.S. FRUIT AND VEGETABLE MARKETING
Of all agricultural commodities, fruits and vegetables are among the most likely to be observed and evaluated by consumers in their primary, unprocessed form. They are also among the most likely to exhibit noticeable variation in important quality attributes such as color, flavor, or texture resulting from growing practices, variety, or post-harvest handling conditions. External appearance provides consumers with their first impression of freshness, ripeness, or flavor. Quality attributes that are reflected in readily apparent visual characteristics are given importance in classification and grading systems at the packing and wholesale level. Consumer interest in fruits and vegetables is increasingly related to concerns about nutrition, diet, and health. Nutritional attributes, however, are intrinsic in nature. They are not easily distinguished by consumers in selecting produce at retail, nor are these attributes currently used in establishing standards or grading systems.
Production of fruits and vegetables is a highly specialized activity with domestic output concentrated in a few states. The fresh fruit and vegetable industries have also become much more global in nature over the last decade, with world exports increasing at the rate of 3% annually since 1979. Quality attributes playa role in determining the evolution of trade relationships among trading partners. Changing production technology, management, and pest control strategies have also influenced public awareness of quality attributes of fruits and vegetables. Consumer expectations, production and marketing techniques, and interaction with the global economy represent a dynamic environment within which the fruit and vegetable industry must compete. Product quality continues to be a key part of this competition.
This report first provides an overview of the U. S. fruit and vegetable industry with emphasis on production and utilization and existing marketing channels. This industry includes a complex set of more than 150 different horticultural commodities. Both citrus and non-citrus fruits are included. Vegetables, as used here, include major and minor vegetable crops, melons, and potatoes. Dry. edible beans, dry peas, and lentils are also included for convenience, although they are obviously not vegetables. The industry overview is followed by a review of quality attributes of fruits and vegetables and the system of grades, standards, and inspection which provides official recognition of quality attributes. Using this current situation as a basis, emerging quality-related issues facing the fruit and vegetable industry are identified and anticipated changes in the industry are discussed in relation to their effect on quality.

OVERVIEW OF mE u.s. FRUIT AND VEGETABLE INDUSTRY
Fruits, vegetables, and pulses are high value crops of growing importance to U.S. farmers, the food industry, and consumers. They accounted for approximately 26% of the cash receipts for all crops in 1989, up substantially from 18% in 1975 (Table 1). Crop land devoted to their production was approximately 8.6 million acres, a modest 2.6% of total U.S. cropland in 1989 (Table 2).
The value of fruit production, particularly citrus, has grown more rapidly than the value of vegetables and pulses over the last fifteen years (Tables 3 and 4). Together they have increased substantially faster than the value of all crops over the same period.
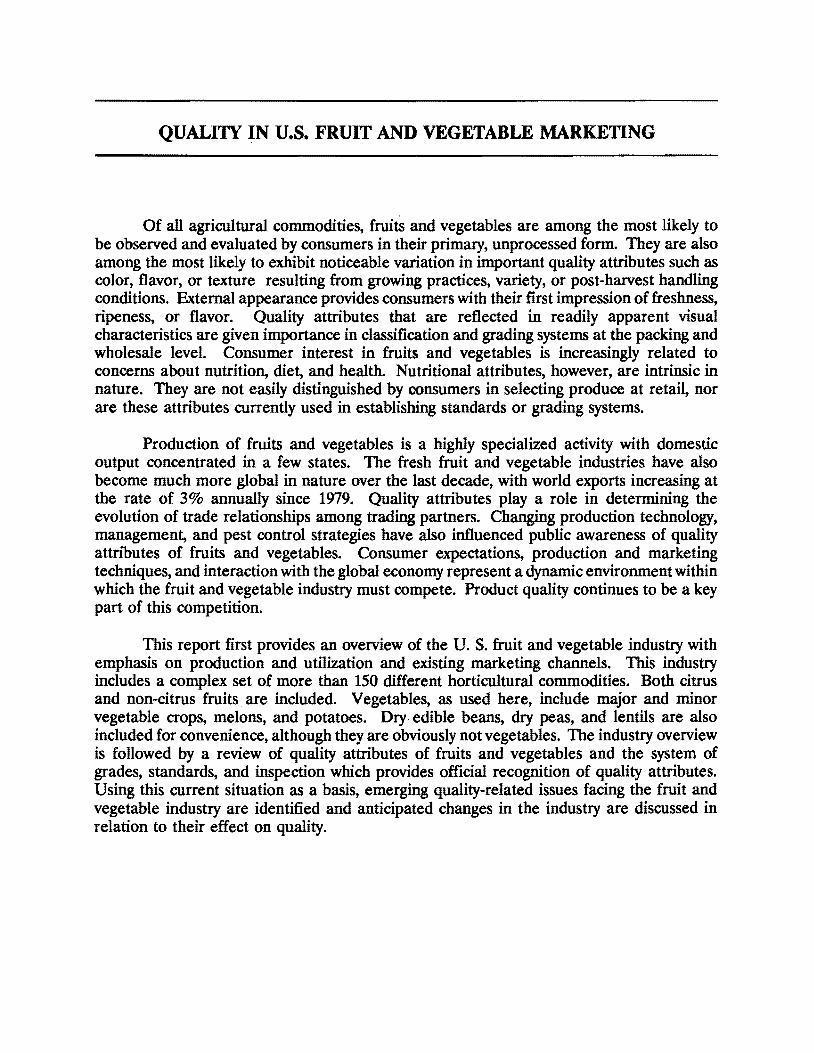
Potatoes accounted for over 20% of the value of the entire vegetable and pulse category in 1989 while dry edible beans contributed 6% to total value (Table 5). After potatoes, tomatoes are the most important vegetable crop, valued at $1.8 billion in 1989. Lettuce, onions, sweet com, carrots, and broccoli follow in descending order of value.
Among the fruit crops, grapes, oranges, and apples each exceed $1.0 billion in farm value and, combined, comprised nearly 60% of the total in 1989 (Table 6). Other important fruits in descending order are strawberries, grapefruit, peaches, pears, avocados, and lemons.
ProductioB Trends
Production of fruits and vegetables are highly dependent on weather, soil, and other environmental conditions. Production is, therefore, quite concentrated in the most favorable geographic areas on the West Coast, Florida, and other regions such as the Northeast and Texas. Fruit production is the most concentrated with nearly 75% originating in California and Florida (Table 7). About 90% of the value of fruit production is generated by only seven states.
Vegetable production is less concentrated. Nevertheless, the top ten states still produced 75% of the value in 1989 (Table 8). California and Florida once again are the leading states with 32.5% and 13.6% respectively.
Fruit and vegetable production, being relatively large-scale, uses substantial amounts of technologically sophisticated inputs in pest management, irrigation, climate control, and field and harvesting operations. Many production activities also depend on access to large pools of labor to complete intensive seasonal activities. This intensive, concentrated production industry is geared to meet the demands of mass-merchandising-oriented retail food chains. The industry responds to the need for a continuous supply of large volumes of relatively homogenous products. In many parts of the country there also exist part-time
2

Table 1. Sbare of Casb Recei2ts Re2resented bl Fruits and Vegetables! 1989
Share of
Crop Cash All Crops & Receipts Cro2s Livestock
million $ ---------- ~, ----------Vegetables 11,4618 15.2 7.2 (including potatoes and pulses)
Fruit 7,941b 10.5 5.0
Total Vegetables and Fruit 19,402 25.7 12.2
All Other Crops 56,047 74.3 35.2
Total Crops 75,44~ 100 47.4
Total Crops and livestock 159,173c 100
a Source: USDA, Veaetable and Specialties Situation and Outlook Yearbook. Economic Research Service, TVS-255, Dec. 1991. Table 2, p. 10.
b Source: USDA, Fruit and Tree Nut Situation and Outlook Re.port Yerbook. Economic Research Service, TFS-258, Aug 1991. Table 2, p. 16.
c Source: USDA, t\iricultural Statistics. U.S. Government. Printing Office, Washington, 1990. Table 575, p. 391.
3

Table 2. Acreage Devoted to Production of Vegetables, Pulses and Fruits, 1989
Crop Acreage Share of Total
1,000 acres %
Vegetablesa
Fresh (Harvested acres, major veg.) 1,146 13.3
Processed (Harvested acres) 1,475 17.1
Subtotal (Vegetables) 2,621 30.4
Potatoes 1,282 14.8
Subtotal (Vegetables 3,903 45.2 and potatoes)
Pulses·
Dry edible beans 1,651 19.1 (Harvested acres)
Dry peas and lentils 271 3.1 (Harvested acres)
Subtotal (Pulses) 1,922 22.3
Fruitb
Citrus Fruit (Bearing acres) 848 9.8
Non-Citrus Fruit (Bearing acres) 1,961 22.7
Subtotal (Fruit) 2,809 32.5
_JrO~_~~g~_~~~~~_~~_~~_~~_~~~______________§l§~~______________________!_~____________
Total U.S. Cropland 330,000
• Source: USDA Ve~table and Specialties Situation and Outlook Yearbook. Economic Research Service, TVS 255, Dec. 1991, Tables 3, 50, 66, 78 and 86.
b Source: USDA Fruit and Tree Nut Situation and Outlook Report Economic Research Service, TFS-258, Aug. 1991. Table i.
Yearbook.
4

Table 3. Farm Value of Production (Cash Receipts) for All Vegetables, Potatoes and Pulses and Total Crops, 1975, 1980, 1985-89
Cash Receipts
Vegetables, Potatoes and Year Pulses· Total CrOpsb
1975 5,346 45,813
1980 7,307 71,746
1985 8,572 74,290
1986 8,865 64,005
1987 9,902 63,751
1988 9,786 72,569
1989 11,461 75,449---------------_._._---------------------------_._---------_.....------_....-------------------
Change 1975-1989 +114% +65%
Change 1985-1989 +34% + 2%
a Source: USDA, Ve~table and Specialties Situation and Outlook Yearbook. Economic Research Service. TVS 255, Dec. 1991, Table 2, p.10.
b Source: USDA, A&Dcultural Statistics. U.S. Government Printing Office, Washington, D.C. 1990. Table 575, p 391.
5

Table 4. Value of Production of Citrus and Non-citrus Fruit, 1975, 1980, 1985-89
Production Value
Year Citrus Non-Citrus
------------------------------ rrUllion $ ---------------------------
1975 980 2,088 3,068
1980 1,905 3,780 5,686
1985 2,080 3,831 5,911
1986 1,768 4,204 5,972
1987 2,053 4,421 6,474
1988 2,619 5,097 7,715 __________!~§2___________________~~~~___________________~~~I~___________________I~~!__________
Change 1975-89 +172% +153% +159%
Change 1985-89 +28% +38% +34%
a May not add due to rounding.
Source: USDA Fruit and Tree Nuts Situation and Outlook Rqrort Yearbook, Economic Research Service. TFS-258. Aug. 1991, Table 2, p.16.
6
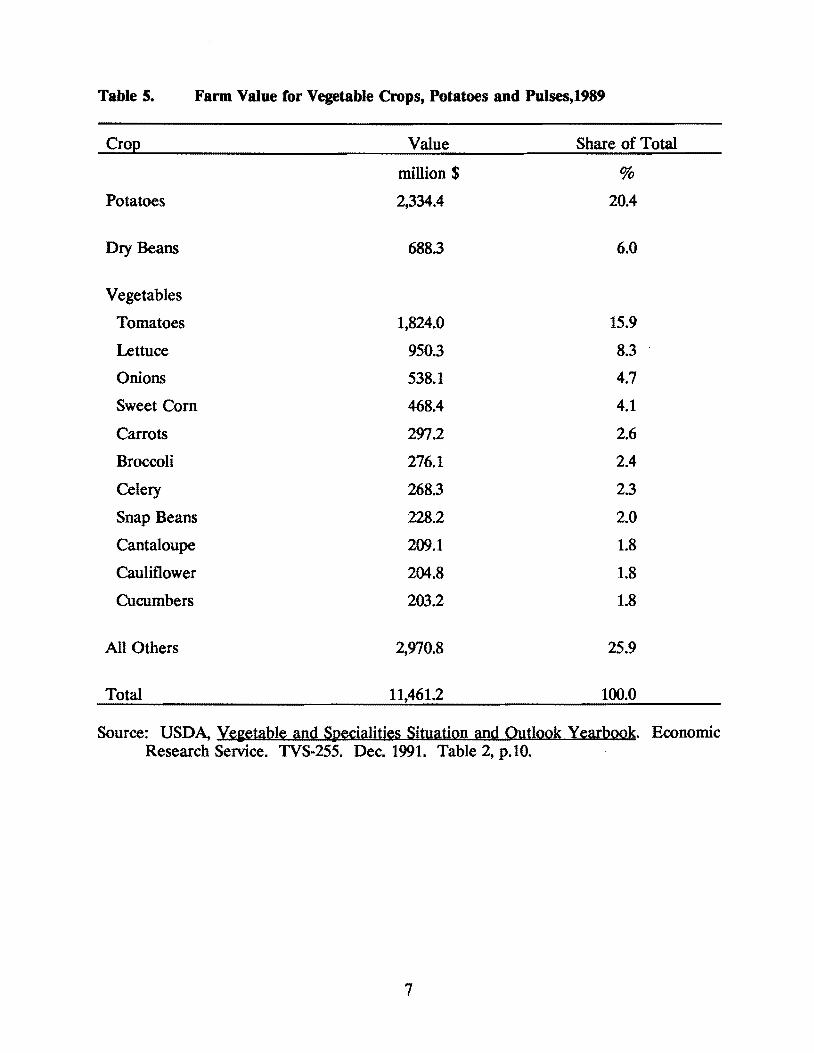
Table S. Farm Value for Vegetable Crops, Potatoes and Pulses,1989
Crop Value Share of Total
million $ %
Potatoes 2,334.4 20.4
Dry Beans 688.3 6.0
Vegetables
Tomatoes 1,824.0 15.9
Lettuce 950.3 8.3
Onions 538.1 4.7
Sweet Com 468.4 4.1
Carrots 297.2 2.6
Broccoli 276.1 2.4
Celery 268.3 2.3
Snap Beans 228.2 2.0
Cantaloupe 209.1 1.8
Cauliflower 204.8 1.8
Cucumbers 203.2 1.8
All Others 2,970.8 25.9
Total 11,461.2 100.0
Source: USDA, Ye~table and Specialities Situation and Outlook Yearbook. Economic Research Service. TVS-255. Dec. 1991. Table 2, p.lO.
7

Table 6. Value of Production for M2\ior Fruit Crops, 1989
Crop Value Share of Total
million $ %
Citrus
Oranges 1,848.6 23.3
Grapefruit 418.1 5.3
Lemons 234.6 3.0
Other Citrus 163.8 2.1 a
Total Citrus 2,665.1 33.6
Non·Citrus
Grapes 1,862.8 23.5
Apples 1,034.4 13.0
Strawberries 537.8 6.8
Peaches 360.8 4.5
Prunes and Plums 281.3 3.5
Pears 253.6 3.2
Cranberries 164.7 2.1
Cherries (sweet) 136.1 1.7
Other Non·Citrus 644.7 8.1 a
Total Non·Citrus 5,276.2 66.4
7,941.3 100.0
a May not add due to rounding.
Source: USDA, Fruit and Tree Nuts Situation and Outlook Report Yearbook. Economic Research Service, TFS - 258, Aug. 1991, Table 132, pp. 96·97.
8

Table 7. Leading States in Production of Fruit Crops, 1989
State Value Share of Total
million $ %
California 3,944.8 49.7
Florida 1,918.8 24.2
Washington 735.3 9.3
New York 165.4 2.1
Michigan 147.1 1.8
Oregon 133.5 1.7
Hawaii 120.5 1.5
Others 775.9 9.8
Total8 7,941.3 100.0
8 Total may not add due to rounding.
Source: USDA. Fruit and Tree Nuts Situation and Outlook R~ort Yearbook. ERS, TFS - 258, August 1991. Table 132, p.97.
9

Table 8. Leading States in Production of Vegetables, 1'8'
State Value· Share of Total
million $ %
California 3,704.8 32.5
Florida 1,545.0 13.6
Idaho 757.9 6.6
Washington 583.4 5.1
Wisconsin 354.2 3.1
Texas 349.9 3.1
Colorado 325.2 2.9
Arizona 320.4 2.8
Michigan 320.2 2.8
New York 310.4 2.7
Others 2,822.1 24.8
Total 11,393.5 100.0
a Farm cash receipts
Source: USDA Ye~etables and Specialties Situation and Outlook Report. ERS, TVS 253, April 1991, Table 20, p. 48.
10

and specialty crop farming which serve the needs of regional and niche markets. This regional production continues to exist because ofunique combinations of available resources and local markets but cannot be expected to serve the primary needs of the U.S. food wholesaling and retailing systems.
Price and revenue for specific fruits and vegetables exhibit substantial variability from season to season. Regional concentration combined with weather variation and perishability of the crop combine to cause wide swings in prices and returns in the industry. Unlike major field crops, fruits and vegetables are not included in traditional government price and income support programs. Most forms of government assistance to the industry are limited to activities which facilitate rather than intervene in the market. This includes crop insurance, grading, market news, and enabling legislation which supports marketing cooperatives, check-off programs, and marketing orders.
Utilization and Consumption
Nearly one-half (48%) of the volume of vegetable production is directed toward the fresh market (Table 9). This share has shown a small increase over the last two decades. As measured by farm value, fresh market vegetables are much more important, accounting for 77.8% of receipts in 1989, up from two-thirds in 1970.
When examined on a per capita use basis, a definite trend toward increased use of fresh vegetables is apparent. (Table 10). In 1989, total per capita use of vegetables (excluding potatoes) was nearly 250 pounds per year measured in farm weight equivalent. More than one-half was consumed in fresh form. For potatoes, however, the trend is in the opposite direction. Total per capita consumption has increased modestly with fresh per capita consumption declining and processed products increasing.
A larger share of fruit production is directed toward the processing market (Table 11). In 1989, two-thirds of the volume moved through those channels with non-citrus products slightly less processing-oriented (64.2%) and citrus slightly more (69.1%). There has been little change in this ratio over the past two decades. Data to illustrate value comparisons are not readily available. However, fruit sold in fresh markets brings a substantially bigher price, thus making fresh production more important in terms of value than is reflected in the volume figures. Substantial growth in volume of output has occurred over the past two decades and is most notable in non-citrus fruits.
On a per capita basis, consumption of fresh fruit has grown by more than 20% since 1970 (Table 12). The trend is entirely associated with non-citrus fruits which have increased per capita use by over 46%. Processed fruit consumption reflects a mixed picture. Canned fruit and fruit juices consumption per capita has declined while consumption of frozen, dried, and other forms of fruit juices has increased.
11
Table ,. Utilization of MJ\jor Vegetable Crops for Fresh and Processing, 1970 and 1'8'
Fresh Processing Total
Crop 1970 1989· 1970 1989 1970 1989
---------------------------------- 1,()(M) toIlS ---------------------------------
Fresh 7,003 12,032 7,003 12,032
Dual Use 711 1,999 606 741 1,317 2,740
Processing 8,596 14,451 8,596 14,451
Total 7,714 14,031 9,202 15,192 16,916 29,223
Share of Total (45.6) (48.0) (54.4) (52.0) (100) (100) {%}
Value (Million $) 902 4,840 446 1,385 1,348 6,225
Share of Total {%)
(66.9) (77.8) (33.1) (22.2) (100) (100)
a Excludes potatoes.
Source: USDA Ve&etables and Specialties Situation and Outlook Yearbook. ERS, TVS - 252, Nov. 1990, Selected tables.
12

Table 10. Per Capita Use ofVegetables, Potatoes and Pulses, for Fresh and Processing, 1971 and 1989
Selected Fresh Processed Total Commodity
1971 1989 1971 1989 1971 1989
--------------------------------- POllll<is (f~ ~.) ---------------------------Selected Vegetables
Tomatoes 11.3 16.8 68.3 69.4 79.6 86.2
Sweet Com 7.5 6.4 20.3 17.9 27.8 24.3
Carrots 6.1 7.9 3.4 3.6 9.5 11.5
Lettuce, fresh 22.4 28.8 22.4 28.8
Onions, fresh 13.1 17.9 13.1 17.9
Total Vegetables 109.1 139.6 111.3 109.0 220.4 248.6
Potatoes 56.1 50.1 61.7 77.4 117.8 127.5
Sweetpotatoes 5.3 4.4
Mushrooms 0.3 2.0 1.1 1.5 1.4 3.5
Dry Peas and Lentils 0.2 0.8
Dry Edible Beans 6.9 5.5
Total 352.0 390.3
Source: USDA. V~i~lilbl~5 and S~'ialn~5 SituilliQIl ilIld Oul1QQk Y~arboQk. ERS, TVS - 252, Dec. 1991, Table 1, p.9.
13

Table 11. Utilization of Selected U.S. Fruit Crops for Fresh and Processing, 1970 and 1989
Fresh Processed Total
Crop 1970 1989 1970 1989 1970 1989
------------------------------ 1,()Q(} toIlS (fr~sh vvt.) ----------------------------
Non-Citrus· 3,378 5,634 6,512 10,111 9,890 15,745
Shar~ (%) (34.2) (35.8) (65.8) (64.2) (100) (100)
Citrus
Orang~s 1,789 1,970 6,223 6,907 8,022 8,877
Grap~fruit 949 1,397 1,236 1,464 2,185 2,861
LemoIlS 351 467 223 293 574 760
Lim~s 16 42 15 13 31 55
Total Citrus 3,105 3,876 7,707 8,677 10,812 12,553
Shar~ (%) (28.7) (31.9) (71.3) (69.1) (100) (100)
Total 6,483 9,510 14,219 18,788 20,702 28,298
Shar~ (%) (31.3) (33.6) (68.7) (66.4) (100) (100)
a Exc1ud~s berri~s.
Sourc~: USDA Fruit and Tr~~ Nut Situlltigl1 lind Outlggk R~IH2It Y~arbggk. ERS, TFS 254, August 1990, ~l~ct~d Tabl~s.
14

8
Table 12. Per Capita Use of Fresh Fruit and Selected Processed Products, 1970 and 1989
Product 1970 1989 Change
-------------------- -11>. -------------------- %
Fresh
Citrus 28.8 25.4 -11.8
Non-Citrus 50.6 74.3 +46.8
Total Fresh 79.4 99.7 +25.6
ProceSsed (product wt.)
Canned 15.6 13.4 -14.1
Frozen 3.3 4.6 +39.4
Dried 2.6 3.1 +19.2
Juice (single strength)
Canned8 7.5 3.4 -54.7
Chilled 4.6 6.5 +41.3
Frozen citrus 21.9 34.3 +56.6
1988 estimates
Source: USDA Fruit and Tree Nuts Situation and Outlook Report Yearbook. ERS, TFS - 258, August 1991, Ta1>les 109-114.
15
Fruits and vegetables, a significant part of consumer food expenditures, accounted for an estimated 17.8% of consumer expenditures for food at home in 1988, an increase from 15.1% in 1980 (Smallwood, Blissard, and Blaylock).
In summary, fruits and vegetables are an important part of agriculture and the current supply of foods available to U.S. consumers. There is an increasing emphasis on fresh product marketing and consumption.
Imports and Exports
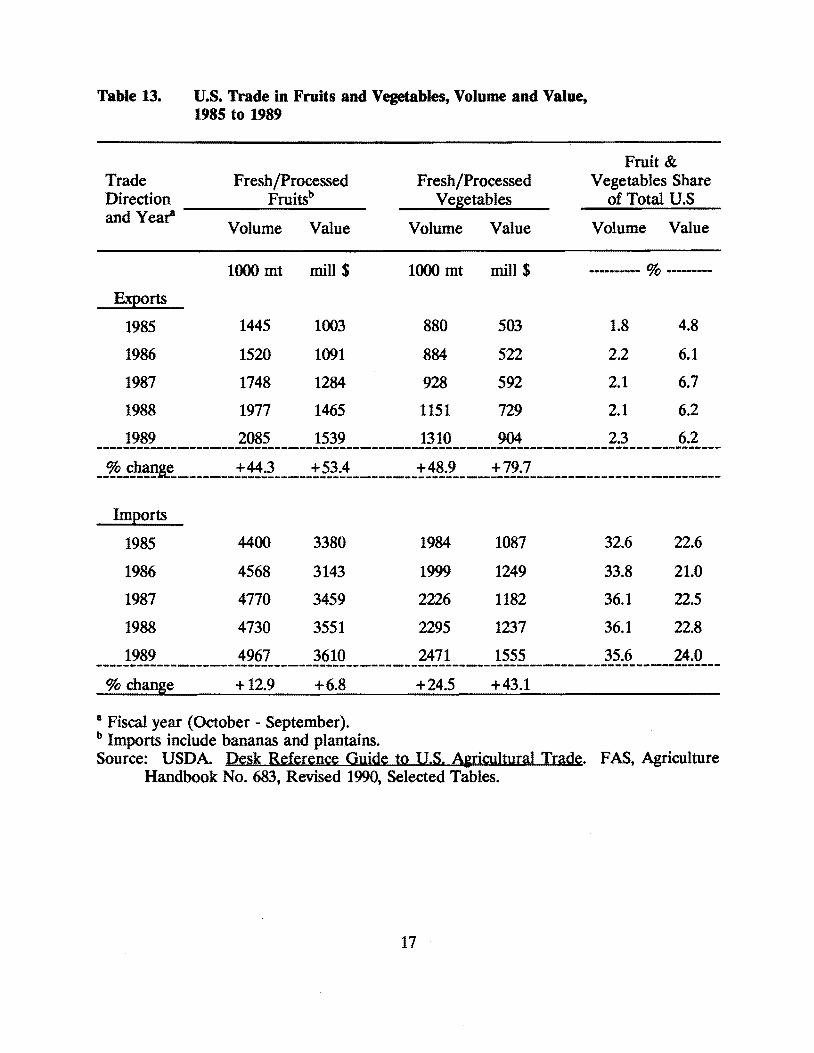
Trade data for all fruits and vegetables are difficult to assemble on a comparable basis. Aggregate estimates by Foreign Agriculture Service of the U. S. Department of Agriculture (USDA) show growth in both imports and exports in recent years (Table 13). Fresh and processed vegetable exports, though smaller than imports, demonstrate the fastest rate of growth which may be due in part to a trend in imported products being re-exported to Canada. The volume of fruit imports is more than twice the level of exports. Even so, export volume is growing at a substantially faster rate. The value of imported fresh and processed fruits, while showing little growth, remains significantly larger than export value.
Taken as a whole, these trends show growth rates larger than the change in size of domestic fruit and vegetable production over a comparable period. Also, imports of these products accounted for 24.0% of the value of all U.S. agricultural imports in 1989, up from 22.6% in 1985. Over the same period, exports of fruits and vegetables, including processed products, increased from 4.8% to 6.2% of all U.S. agricultural export value.
Quality attributes have received increasing attention in relation to this growing internationalization of the U.S. fruit and vegetable industry. Non-tariff trade barriers throughout the world often incorporate quality characteristics as a means of influencing levels of imports. The United States has not escaped this controversy.
Marketing and the Marketing System
Two major channels, fresh and processed, comprise the marketing system for fruits and vegetables and most production is initiated with a specific channel in mind. Varieties, production technology, and growing conditions differ substantially depending on the particular channel for which the final products are destined. For a few dual-use fruit and vegetable marketing situations, grading based on quality characteristics is used to determine the flow to each channel. In this section, the structure and organization of these two market
16
-----------------------------------------------------------------------------------------------
-----------------------------------------------------------------------------------------------
Table 13. u.s. Trade in Fruits and Vegetables, Volume and Value, 1985 to 1989
Fruit & Trade Direction
Fresh/Processed Fruitsb
Fresh/Processed Vegetables
Vegetables Share of Total U.S
and Year-Volume Value Volume Value Volume Value
1000 mt millS 1000 mt millS --------- ~ --------Exports
1985 1445 1003 880 503 1.8 4.8
1986 1520 1091 884 522 2.2 6.1
1987 1748 1284 928 592 2.1 6.7
1988 1977 1465 1151 729 2.1 6.2
1989 2085 1539 1310 904 2.3 6.2
_~_c:.~~1le__________j:~;~______~~~~_________ -~~~~------j:Z2;Z----_________________________
Im,2orts
1985 4400 3380 1984 1087 32.6 22.6
1986 4568 3143 1999 1249 33.8 21.0
1987 4770 3459 2226 1182 36.1 22.5
1988 4730 3551 2295 1237 36.1 22.8
1989 4967 3610 2471 1555 35.6 24.0
~ change + 12.9 +6.8 +24.5 +43.1
a Fiscal year (October - September). b Imports include bananas and plantains. Source: USDA Desk Reference Guide to U.S. Airicultural Trade. F AS, Agriculture
Handbook No. 683, Revised 1990, Selected Tables.
17

channels is described briefly, including primary coordinating mechanisms and pricing practices. Quality attributes and grading systems will be discussed more fully in a subsequent section.
Fresh Market Channels
Primary market channels are illustrated in Figure 1. For fresh fruits and vegetables, major markets exist at three levels: retail, terminal point, and shipping point. Wholesale terminal point markets are changing in scope and function as the needs of retailers and the source of raw commodities have changed over time. Wholesale terminal markets still provide a major link in the distribution network but have a reduced role as direct sales and shipments from the major shipping point markets to chainstore warehouses and distribution centers have increased.
Various types of integrated grower-packer;.shipper firms have evolved at the shipping point. Approximately 50% of fresh fruit and vegetables are marketed at the shipping point under some type of grower-shipper integration (Kohls and Uhl). About 20% of sales were through cooperatives in 1985. Large chainstore firms and cooperative buying groups usually have buying agents located at the major shipping points.
Communication of information among shipping point firms, wholesalers, and retailers is the primary focus and purpose of grading systems and grade standards in the fresh fruit and vegetable industry. Fresh fruits and vegetables are graded at the point of sale from producer to first-handler. These grades are used to establish relative prices and to provide quality information through the system to wholesalers and retailers. For some fruits and vegetables, grading is done at the wholesale level where repacking operations may be carried out.
Price discovery in fresh market channels is usually accomplished through a system of decentralized, individual negotiation. Historically, wholesale markets played a centralizing role which is now declining as more sales are made directly to large retail firms.
Processing Market Channels
Processors provide a key coordination function in the fruit and vegetable marketing channel. There were over 1400 firms which shipped processed products valued at $36.3 billion, representing 11 % of the value of all processed food shipments in 1987 (U.S. Dept. of Commerce). . Canned products account for the largest part of these shipments, with frozen items also of special importance. Specialty products, including prepared foods and sauces, are increasing in value.
Processing firms are located primarily on the West Coast and to a lesser extent in the Northeast, Great Lakes, and Southeast regions. Proximity to traditional production areas is the primary factor in plant location.
18

--
Figure 1. Primary Marketing Channels for Fresh Fruits and Vegetables and Processed Products
[ Consumers
I-" 10
Direct Retail Food Service, ~
Markets Food Stores Hotels. Restaurants. and U-Plck Institutions
t t j j
Retail/Wholesale ~ Distribution Centers ..... ,.
- Chain Store .,.-
- Independent
t j
Wholesale Terminal Markets - Merchant wholesalers - Commission agents - Brokers
r-+ - Receivers - Impor ters
t ProcessorsShipping Point Firms l I. Imports - Canning- Cooperatives . I
Packers - Freezing
- Agents - Dehydrating
- Brokers - Further
- Buying offices III, Exports I ..... processing
t t I Fruit and Vegetable Producers
--_._---

Concentration in fruit and vegetable processing varies by industry. In canning, the largest four firms accounted for 21% of industry output in 1982, showing little change from 1977 (Buckley, et al.). In freezing, the comparable figure was 27%, up 5% from 1977 but down from 1972 levels. The much smatler drying industry shows a higher level of concentration, with 42% of industry output accounted for by the largest four firms in 1982. This reflects a slow increase in concentration over time. Taken together, these levels indicate a relatively unconcentrated or "effectively competitive industry" on a national level, according to normally accepted standards.
Procurement of raw product supplies is most often through production and marketing contracts for processing vegetables, potatoes, and citrus fruit (Table 14). This procurement process allows for greater coordination of production practices, varieties, and scheduling to meet processors' needs. The considerable risk in production of these perishable crops can be managed through the use of such coordination arrangements. Vertical integration, in which production and processing are done by the same firm, is generally less significant and has shown only a slow increase in recent years .. More than one-third of the potatoes and citrus fruits are marketed in this way (Table 14). Much of the vertical integration in fruit and vegetable processing is through farmer-owned cooperatives.
Decentralized, individual negotiation is the typical price discovery method for fruits and vegetables entering processing channels. This applies to both the cash market and negotiation regarding production contracts. Bargaining associations sometimes represent producers in collective negotiations with processors although this practice has declined in recent years.
Purchase specifications for fruits and vegetables moving into the processing channel may include official U.S. grade standards and other attributes agreed upon in contract negotiations. Grades and other quality factors are assessed at the processing plant as the product is received. This information is used in determining prices paid to producers.
Grades also exist for processed products and are used for conveying information on key quality attributes to wholesale and retail buyers. These grades are little known or used by consumers, however. Brands play an important role in conveying quality information for many processed fruit and vegetable products at the retail and consumer level.
Marketing Orders and Agreements
Marketing orders and agreements are one of the unique institutional arrangements in the fruit and vegetable sector. These represent a government-sanctioned mechanism through which producers and marketing firms can collectively address problems which exist in marketing their products. They were first established at the federal level in the 19308 with the rather ephemeral purpose of enhancing the orderly marketing of perishable commodities. Non-recourse loan programs designed to assist producers of storable crops have never been available to producers of most perishables like fruits and vegetables.
20
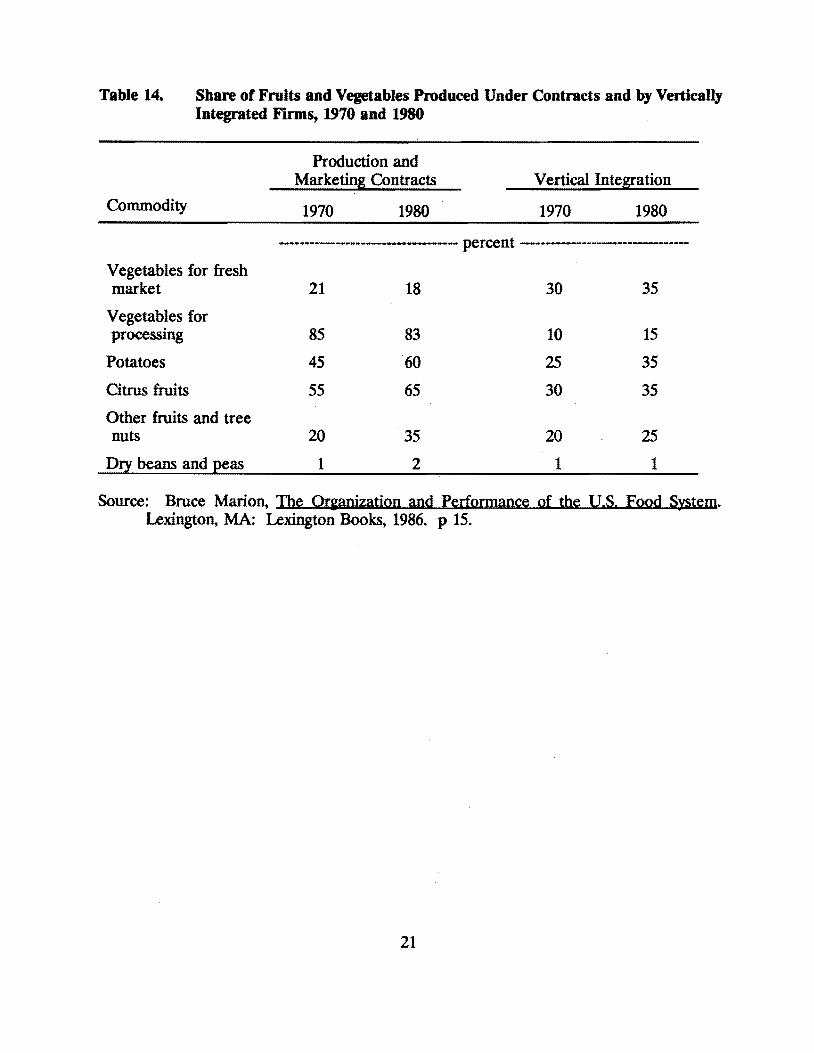
Table 14. Share of Fruits and Vegetables Produced Under Contracts and by Vertically Integrated Firms, 1970 and 1980
Production and Marketing Contracts Vertical Integration
Commodity 1970 1980 1970 1980
••••------------------------------- I'er~nt --------------------------------
Vegetables for fresh market 21 18 30 35
Vegetables for I'rocessing 85 83 10 15
Potatoes 45 60 25 35
Citrus fruits 55 65 30 35
Other fruits and tree nuts 20 35 20 25
Dry beans and peas 1 2 1 1
Source: Bru~ Marion, The Or,pnization and Performan~ of the U.S. Food System. Lexington, MA: Lexington Books, 1986. l' 15.
21
Marketing orders and agreements are particularly important to the management and regulation of quality at the fresh product level of the industry. They serve many purposes for the fruit and vegetable industry, including:
• regulation of quality, maturity and size; • standardization of containers and packages; • collection of funds to support promotion and research; • regulation of quantity of product moving to market; and • collection and dissemination of market information.
Market orders are established through a process of proposal, hearings, and referendum among affected producers and first-handlers. Once approved, they are administered by a committee and are mandatory. For federal orders, USDA is responsible for oversight. Many states also have enabling legislation for marketing orders.
Nearly all marketing orders in the fruit and vegetable industry include provisions for regulating quality. These typically focus on setting permissible grade standards and size requirements in an effort to establish greater uniformity of produce moving into fresh market channels. As with other commodities, the establishment of consistent grade standards supports the reporting of market conditions and dissemination of information on price and volume throughout the industry.
Price Discovery and Dissemination
Concentration of production, weather- or pest-induced supply variation, and perishability combine to cause substantial seasonal fluctuations in fruit and vegetable prices. The primary price discovery mechanism used in the industry is a system of decentralized, individual negotiation.
In fresh market channels, wholesale terminal markets once played a centralizing role in the price discovery process. This function has declined substantially in recent years as most fresh produce moves directly from concentrated producing regions to large warehouses of retailers.
Fruits and vegetables produced for processing markets are also subject primarily to pricing by individual negotiations. This is true both for cash sales at harvest and contracts negotiated prior to, or during, the season. The representation of farmers by collective bargaining associations has declined in recent years.
Marketing cooperatives playa significant role in some fruit and vegetable industries. These organizations may pool the fresh or processed product and negotiate for prices. Producers are then paid an average pool price, with premiums or discounts for quality factors.
22
With the emphasis on individual, decentralized price discovery, price infonnation must be efficiently disseminated. As with most commodity markets of this type, substantial communication of price and related market information occurs through continuous informal telephone, FAX, and face-to-face contact. Prices are reported by quality grades through official USDA daily and weekly market news reports. These reports also convey information on supply and demand conditions for key shipping points and terminal markets during the appropriate season for significant fresh market commodities. Similar market news reports are provided for stored and processed products. These market news reports also provide a useful historical record and benchmark.
Price-Quality Relationships
Prices of fruits and vegetables are highly responsive to quality differentials. USDA Market News Reports from shipping point and terminal market locations consistently reflect variations based on differences in grade. These price differentials may also vary in magnitude depending on seasonal and daily changes in supply and demand factors.
Other qualitative differences are also reflected in price differentials, even where official grades are not a factor. Different types of onions or sizes of apples will bring different prices, even though they may carry the same U.S. grade designation. Fresh produce markets tend to be regional or local for some products, reflecting the effects of different growing conditions and regionally-sensitive varieties or perceptions of quality.
Condition of fresh produce is an ever-present quality factor influencing prices. Produce which becomes over-ripe or otherwise loses condition on its way to market will often be sold at substantially reduced prices. This is seen at the wholesale and retail levels. At the shipping-point such produce is often destroyed or not even harvested effectively reflecting a zero price.
In processed product channels, quality differences are also reflected in pricing premiums and discounts. Results of inspections upon delivery to the processor translate directly into discounts off a base negotiated price for most fruits and vegetables. Contract terms negotiated in advance for processing vegetables are designed to encourage production that will meet specifications without undue price discount at the time of harvest.
For processed consumer products, quality differentials may be reflected in brand differences. There is often a price difference at retail between store brands and nationally advertised brands of the same product. While some of this consumer product differentiation is based on psychological and advertising appeal, there is often a difference in the quality standards of the raw commodity used in the final processed product. Store brands and generically-labeled canned and frozen fruits and vegetables provide a lower-priced alternative to consumers.
23
QUALITY AND FRUIT AND VEGETABLE MARKETING
In the fruit and vegetable industry, quality is a crucial factor influencing everything from consumer satisfaction to producer returns. Knowing which quality attributes are important, how these attributes can be objectively assessed, and how this information can be made available to all market participants is critical to coordinating the entire production and marketing system. Since there is much debate about the nature of quality in fruits and vegetables, this section begins with a discussion of important quality attributes.
Important Quality Attributes
Quality in its broadest context includes attributes of fruits and vegetables which have meaning and value to the user. Sensory characteristics such as taste and visual appeal are the most commonly recognized attnbutes. Nutritional composition and other characteristics, however, are also important. Specifications in processing vegetable contracts may focus on production and harvest conditions thOUght to be correlated with product quality characteristics which are needed in processing, storage, and distribution.
Shewfelt identifies several aspects of fresh fruit and vegetable quality. Appearance is a key factor which includes size, shape, gloss, color, and absence of external defects. Size is often given a premium in the market, though this depends on the specific product. Visual defects may result from pests, mechanical damage, or physiological deterioration. Preference, of-course, is usually given to uniformity and an absence of defects. Color is also important. Expectations of an ideal color are correlated in consumers' minds with good eating quality, ripeness, texture, or nutrition.
Texture and flavor are a function of variety, maturity, and condition and are less observable with noninvasive grading procedures. They are important aspects of quality, however. Nutritive value is particularly important with fruits and vegetables. These products have consistently been included high on the list of most dietary and health recommendations. They are characterized generally as low in fat and protein and high in carbohydrates, vitamins, selected minerals~ and dietary fiber. Nutritive value, however, is highly variable and difficult to assess for use as a measure of quality in establishing grades useful to guide wholesale and retail trade (Shewfelt).
Consumers, food marketers, and producers have become increasingly concerned with pesticide residues on fruits and vegetables or in processed products in recent years. Such concerns are another expression of "quality" but are better categorized as food safety issues. This discussion is concerned with quality attributes and related issues for fruits and vegetables that are already judged to be safe. .
24

USDA Grading System
The United States has a well-established system of grading fresh fruits and vegetables. This system also includes many standard processed products such as fruit juices, applesauce, and canned vegetables. Current grades and standards for fruits and vegetables are administered by USDA under authority of the Agricultural Marketing Act of 1946. Through this system quality attributes are formally designated and standards established to facilitate trade and marketing. Quality specifications also can be agreed upon in contracts or other purchasing arrangements among private parties. Also, standards of identity, quality, and fill of container are established under the Food, Drug, and Cosmetic Act (FDCA) administered by the Federal Food and Drug Administration (FDA). These regulations certainly affect some quality aspects of processed products beyond the USDA grades and standards programs.
Grade standards are developed and maintained by the Agricultural Marketing Service (AMS), of the USDA For fresh fruits and vegetables, approximately 135 grade standards have been developed, the majority of which were designed for products moving through fresh market channels (Ohio State University 1991). Approximately 40 have been developed for fresh products that are destined for processing and 12 have been established as consumer identification for pre-packaged vegetables being sold at retail. Grade standards have also been issued for approximately 158 processed products made from 80 different fruits and vegetables (Buckley, et al. 1988).
U.S. grade standards for fruits and vegetables and their processed products are generally applied on a voluntary basis. If a firm decides to use U.S. grades and includes that grade on the label, then the product must conform to the established USDA standards. Grading of fresh fruits and vegetables may be made mandatory, however, if the packing and shipping is regulated through a marketing order.
Substantial variation exists in the use of USDA grade standards. Nearly 90% of the fresh potatoes and 77% of fresh tomatoes were graded at the shipping point in 1990. By contrast, about one-third of fresh apples and 20% of fresh oranges were graded (Office of Technology Assessment). About 80% of potatoes for processing and only 5% of processing tomatoes were graded. Approximately 86% of oranges and 30% of apples for processing were graded. The level of grading used depends on the nature of the product, market demand, and the existence of other coordinating mechanisms such as contracts or vertical integration.
Official grading is conducted by trained inspectors as part of the Federal-State Inspection program. Federally employed inspectors conduct grading activities at terminal markets. Cooperative agreements exist in most states, making the grading a joint activity with the designated state agency providing the service at the shipping point. USDA staff are responsible for developing and maintaining consistency in standards and their application in the grading process. Unlike the requirement for many other commodities,
25
an official grader of fruits and vegetables need not be present to certify the grade classification. Although producers or shippers of fresh vegetables can sort and ship under grade designation, the product is subject to official grading at the receiving end if the buyer requests it. If the grade is specified, the shipment must meet the appropriate official USDA standards even though no official inspection is involved.
For fruits and vegetables moving into processing channels and for processed products, a continuous inspection service may be provided under contract. Where this system is used, the official USDA inspection shield and certification may be displayed on the product. Fees are charged for all inspection services.
Fruit and Vegetable Grade Standards and Nomenclature
Under the USDA grading system, a specific nomenclature for grades has evolved. For fresh produce, USDA has established a policy to phase in four uniform grade names (U.S. Fancy, U.S. No.1, U.S. No.2, and U.S. No.3) to· represent the available levels of quality. At present, significant variation in nomenclature exists due to changing circumstances and the prevailing interests at the time they were established. For example, Florida oranges and tangelos have 10 different grades ranging from U.S. Fancy to U.S. No. 3. Oranges from Texas and California-Arizona have different grade standards but use similar names. While the number of grades in use may vary by commodity, usually two or three are sufficient to cover the range of marketable produce.
For most processed products, grade names are alphabetical and provide for three quality grades above substandard. The highest grade (U.S. Grade A) represents the quality most desired by the trade and consumers (Buckley, et al.). Other grades represent levels of quality which may be less desirable but are of good value and marketable through normal market channels.
Determination of the appropriate grade· name depends on assessment of several grading factors against an established set of grade standards. Grading factors identified in the official standards for fresh fruits and vegetables can be grouped into four categories: quality, size, condition, and tolerances. Other specific factors may be included for some products such as color requirements for apples or specific gravity measurements for processing potatoes. In the official grading terminology, the word "quality" is reserved for a specific set of factors even though in common usage, factors such as condition and tolerances are reflections of quality to those who purchase and use the product.
Size refers to objective measures of diameter, length, weight, and uniformity. Size is not always an integral part of the grade standard. In some cases, however, size is used in the grade standard to describe permissible count and pack arrangements in standard industry containers (Florida oranges and tangelos). In other cases, such as potatoes, grade names are U.S. Grade A Small (Medium, Large) or U.S. Grade B Small (Medium, Large).
26

Here the grade name includes a size specification and is intended to convey information to consumers.
Quality factors include uniformity ofvariety, cleanliness, shape, and maturity. Defects in quality include evidence of injury or damage from diseases or insects, mechanical damage, and other defects such as cracks, sunburn, poor shape, dirt, or foreign material.
Condition refers to quality factors related to changes in the product in post-harvest storage and handling. These changes may be associated with texture, firmness, ripeness, or freshness. Mechanical, disease, or decay damage occurring after harvest is also included in condition factors.
Tolerances are also set as part of the grade standards, recognizing the fact that some heterogeneity in the product is a natural occurrence and cannot be completely eliminated. Tolerances are generally stated in terms of percentage of defects which are largely permissible. The permitted tolerances are typically more restrictive for fruits and vegetables moving into fresh market channels than for those going to processing. An example of the description for the highest grade of fresh and processing apples is provided in Table 15.
Quality and condition factors are also the basis for processed fruit and vegetable standards. Quality in processed products refers to factors which are invariant once the processing is completed: color, clarity, consistency, uniformity of size, flavor, and aroma. For processed products, the existence of defects and tolerances in grade factors are measured in a numerical score. The score for each relevant factor is combined to yield a total. The higher the score, the higher the grade classification. Minimum standard scores are set for each permitted grade. For example, the standards for U.S. Grade A tomato juice are described in Table 16.
Minimum "standards of quality" for many processed foods are established and administered by FDA These minimum standards typically provide the basic standards for the lowest USDA grade for processed fruit and vegetable products.
Evolution of Grades and Standards
The development of independent, third-party grading in the fruit and vegetable industry parallels that of other agricultural commodities. Grade standards describe the quality requirements for each grade of a specific fruit or vegetable, giving the industry a common language for buying and selling. This reduces transactions costs, encourages marketing efficiency, and provides a means of differentiating commodities so they can move to consumers according to preference for particular quality attributes. The primary use of grades in fruits and vegetables is to facilitate wholesale trade.
27
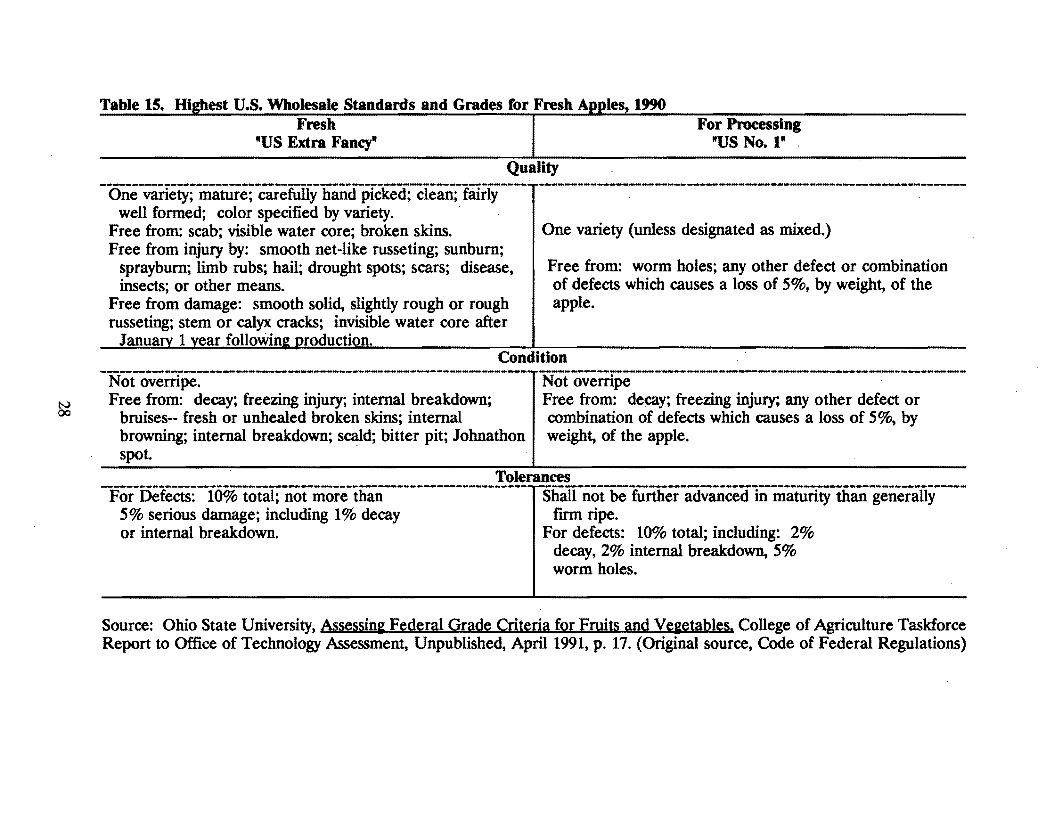
Table 15. Hi2hest U.S. Wholesale Standards and Grades tor Fresh A Fresh For Processing
"US Extra Fancy" "US No.1"
Quality
- One-varietY;mature;-ca;efully hand-pfckecrciean;-iaIiiY---well formed; color specified by variety. .
Free from: scab; visible water core; broken skins. Free from injury by: smooth net-like russeting; sunburn;
sprayburn; limb rubs; hail; drought spots; scars; disease, insects; or other means.
Free from damage: smooth solid, slightly rough or rough russeting; stem or calyx cracks; invisible water core after
Januarv 1 vear folloWim! Droduction.
One variety (unless designated as mixed.)
Free from: worm holes; any other defect or combination of defects which causes a loss of 5%, by weight, of the apple.
Condition
-~~~o~~:fe~:~y; ~:~~:~-~~~-~:te:-~~~~~~:;-----I-~~1eo~~:r~~:y; ~:::g·~jU~;~~-othe~~~;~:-~~------N 00 bruises-- fresh or unhealed broken skins; internal combination of defects which causes a loss of 5%, by
browning; internal breakdown; scald; bitter pit; lohnathon weight, of the apple. spot.
Tolerances --------------------------------------------------------------1-----------------------------------------------------------------For Defects: 10% total; not more than Shall not be further advanced in maturity than generally
5 % serious damage; including 1% decay firm ripe. or internal breakdown. For defects: 10% total; including: 2%
decay, 2% internal breakdown, 5% worm holes.
Source: Ohio State University, Assessini Federal Grade Criteria for Fruits and Ve&etables. College of Agriculture Taskforce Report to Office of Technology Assessment, Unpublished, April 1991, p. 17. (Original source, Code of Federal Regulations)

Table 16. Highest U.S. Standards and Grades of "U.S. Grade A" Tomato Juice, 1990
________!l~_~~!l_~~~t~!!_______. Good Color
Points ---------------------------
26·30
Classification ---------------------------------------------------------------------Bright and characteristic of tomato juice; Made from mature red tomatoes; Not affected by caramelization, oxidation and other means; Contains as uch red as, or more red than, that produced by spminning the specified Munsell color discs in specified combinations.
Good Consistency 13·15 The juice flows readily; Has a normal count of insoluble solids in suspension; And that there is little solids separation.
Practically free from defects
13·15 Any defects present do not more than slightly affect the appearance or drinking Quality of the product.
Good flavor 33-40 Distinct Tomato juice flavor and odor characteristic of good quality tomatoes which is not materially affected by stems, leaves, crushed seeds,. cores, immature tomatoes, or the effects of impro~l' trimming or ,Qrocessing.
~
Minimum Total Score: 85
Source: Ohio State University, Assessine Federal Grade Criteria for Fruits and Veeetables, College of Agriculture Taskforce Report to the Office ofTechnology Assessment, Unpublished, April, 1991, p.24, (original source, Code of Federal Regulations).

The development of refrigeration equipment and improved rail transportation around the turn of the century encouraged the growth of intensive fruit and vegetable production in regions of the West, Midwest, and South. Wholesale trade over these greater distances from urban consuming centers was unpredictable due to extreme fluctuations in quantity, quality, and price.
Commission men at terminal markets provided some sorting or grading for quality. Larger dealers in urban areas sent buying agents to major producing regions to oversee the harvesting and packing of fresh produce meeting their own particular specifications. The use of shipper trademarks and labels provided some assurance of product quality associated with a shipper's reputation. Despite these efforts, there remains substantial opportunity for poor communication, misinformation, and fraud. For highly perishable commodities subject to rapidly changing weather and other production conditions, the market can be extremely volatile. Improved market information was necessary if both producers and buyers were to be able to plan effectively.
USDA was first authorized to begin studies of grade standards as a means of improving the marketing of farm products in 1913. The first USDA grade standards were applied to potatoes in 1917 as a result of a need to certify quality of the product placed in storage during that period. Interestingly, the Federal Reserve Bank encouraged this initial application so that member banks could accept warehouse receipts as collateral for loans in an effort to support prices during the large crop year of 1917.
The need for effective price reporting was also evident during this period. The establishment of grade standards supported the effective reporting of prices. The need for an independent inspection service was quickly recognized. USDA was given the authority both to establish voluntary standards for fruits and vegetables and to operate an inspection service after 1922. Existing independent inspection activities were reorganized into what has since become the Cooperative Federal-State Inspection program.
Assessment and Measurement of Quality Factors
Most official grading of fresh fruits and vegetables is visual. Internal and external quality is typically examined for a sample of the product. Models, color. guides, and photographs are available for graders to check for shape, coloring, and degree of defects or damage.
Similar visual inspection is done for raw products moving into processing channels. In addition, refractometers are commonly used to determine sugar content of some raw commodities. Specific gravity tests are conducted on potatoes to estimate processing yield. Grading of dry beans and peas is primarily visual. However, electric moisture meters are used to determine moisture content.
30

Mechanical aids for sampling raw fruits and vegetables are not as widely developed and used as for grains and oilseeds. Automatic sampling in the bulk handling systems for processing tomatoes has been developed. The sensitivity of most produce to mechanical injury, however, has limited the degree to which such technologies have been applied, particularly in fresh market channels.
The scoring of quality factors in processed products is based both on visual and objective chemical or physical methods. Acidity and sweetness can be objectively measured in many fruit juices and products. Colorimeters are used to evaluate orange juice and tomato products. Specific gravity tests are used to determine maturity of peas. Instruments are also available to measure physical properties such as the flowing quality of catsup and consistency of applesauce. Sizing devices, color guides, and models are also used. Flavor is quality-rated by inspectors.
In processing, the assessment of quality factors using these techniques go beyond the need for grading. Quality control systems to meet the firm's own product standards are based on similar measurements. Continuous sampling and record keeping provides information to guide plant managers in routine process control as well as management at all levels in making strategic decisions.
Consumer Information aDd Awareness of Quality
Freshness or ripeness and taste are the key factors consumers use in selecting fresh produce. In a recent survey of 2000 U.S. households, 96% rated these characteristics as extremely or very important (Zind). Appearance or condition was considered to be just as important by 94% of respondents, followed by nutritional value (65%), and price (63%).
Appearance, however, is the primary attribute consumers have for judging the overall quality of fresh produce. The senses of touch and smell may combine to add information to the overall visual appraisal of fresh produce at the retail level. About 40% of consumers indicate they make decisions on purchasing produce only after seeing it displayed in the store (Zind). An additional 20% use only a general written shopping list to guide them.
Grades used in wholesale trade are not generally displayed at the retail level. A limiied number of produce items may be offered to consumers in more than one size or displayed in prepacks in addition to bulk. The various retail presentations of fresh produce represent an appeal to different market segments and may reflect different prices and value. Grade differences, however, are not usually evident.
Branding has had only limited effectiveness in differentiating fresh produce items. For more integrated production and marketing systems, such as bananas or mushrooms, branding has had some success. Communicating an image of quality and consistency is one
31

of the primary objectives of the branded produce concept. Competitive pressures and the appearance of niche markets has created more interest in this approach in recent years.
Industry-wide efforts to promote specific produce items from a unique producing region is another communication device linked to quality standards. Promotion efforts for Washington apples, Idaho potatoes, Vidalia onions, and Texas Ruby Red grapefruit are examples. Generic promotion efforts of this type are usually supported through check-off programs and are linked to efforts to implement a uniform quality standards in the market. Marketing orders provide a mechanism for implementing quality standards. In some industries, large marketing cooperatives may also provide the mechanism for linking fruit and vegetable quality standards into broader industry market development efforts.
Brands also convey information to consumers on quality of processed fruit and vegetable products. National brands produced by major food manufacturers have set internal quality standards which reflect their corporate marketing strategy. These often reach back to quality standards in contracts for raw product purchasing. USDA grades for fruits and vegetables entering the processing channel are widely used. Processed product grades also appear on canned or other processed products. Contracts for institutional purchasing of processed fruits and vegetables are typically based on USDA grades or a set of closely related specifications.
EMERGING QUALITY ISSUES
Perishability is one of the most recognizable traits of fresh fruits and vegetables. Quality of the product is completely intertwined with the basic biological characteristic of limited shelf life after harvest. Important new technologies have been introduced to increase the post-harvest life of produce. Improved storage environments, modifiedatmosphere packaging, post-harvest treatments to reduce disease potential, faster transportation, and better display conditions at retail have all contributed positively to increased shelf life of fresh produce. While the basic laws of nature cannot be reversed, improving the quality of fresh fruits and vegetables will continue to be a primary concern for producers, shippers, retailers, and consumers.
Given that perishability is a fundamental industry characteristic, there are several dimensions of quality which emerge as issues of significance affecting future industry growth and development. These relate to (1) increased consumer awareness and concern for intrinsic quality attributes such as nutritive content, (2) the best way to communicate product-specific quality factors, (3) the interface between pesticide use and the maintenance of quality, and (4) the relationship of quality to the regulation or encouragement of international trade in fresh and processed fruits and vegetables.
32
Intrinsic Quality Factors
Are all important quality attributes captured in the standards and specifications used in wholesale and retail trade for fruits and. vegetables? With the emergence of consumer concerns relating to diet and health, important attributes of fruit and vegetable quality are primarily nutritional in nature. Consumer preferences appear to be changing. The system for sorting and selecting by quality, however, captures little of the information on nutritive content and provides no price premiums or discounts to encourage producers and shippers to consider this aspect of quality.
A recent study determined that three requirements are needed for an attribute to serve as a grade standard (Ohio State University). First, the attribute must vary across the produce being graded. Second, information on the attribute must exist so that preferences can be assigned to gradations of an attribute. Third, the ability to measure the attribute must exist. The study concluded that there is sufficient variation in nutritive content to satisfy the first requirement. However, serious gaps in information exist and in the ability to efficiently measure nutritive content in fresh produce. Thus, moving away from evaluation of external characteristics available to sensory inspection is not likely to occur soon. For processed fruits and vegetables, significant testing of the raw materials and finished products does take place. Nutrition labeling is used as a way of communicating this aspect of quality to consumers.
The issue of communicating the nutritive content of fresh fruits and vegetables may be partially resolved through recently passed federal legislation. Information on nutritive content will be placed at the retail store level on a voluntary basis. The industry is encouraging widespread participation in this program, in part to avoid the costs of a more burdensome mandatory labeling system. This program will provide important information to those consumers who choose to use it. It will permit comparison among the various fresh produce products available. The new program is not, however, intended to insure that the average nutritive content described is met by any specific unit of fresh produce available on a given day. In this sense, the nutritional information program is an important aid but not a means of discriminating among alternative pieces of fruit or containers of vegetables within a variety on display.
Changing consumer preferences for particular quality attributes of fresh fruits and vegetables apparently cannot be easily incorporated in industry standards and grading systems. Continued efforts are needed by the industry to meet these consumer concerns.
Communicating Quality Information
USDA grade standards were developed primarily to facilitate communication at the wholesale level. The concept of extending grade standards to retail has been periodically
33
debated for various food products. The concept is that such information, if useful to wholesalers and retailers, should be provided to consumers as well. Grading has been a voluntary system in the past. Extending grading to retail may require that it become mandatory, thus changing its nature and increasing costs substantially. When considered in the 1970s, such a change in public policy was not adopted.
A related concern is that of confusing and overlapping nomenclature in grade descriptions. The use of words such as "fancy," "extra fancy," or "bright" in combination with numbers is considered by consumers and other observers to be confusing. Most active traders in the market channel are familiar with the terms and their associated grade standards. However, to the extent these grades appear on bags and cartons at retail they have created confusion for some consumers. USDA has responded to these concerns in recent years by establishing a policy of simplifying, and making uniform, the nomenclature across fruits and vegetables as other grade standards changes are being considered. The introduction of nutrition information in retail produce departments will also address the issue of improved communication of quality information.
Quality and Organic Produce
One of the most complex emerging quality issues is related to the increasing concerns regarding pesticide residues on fruits and vegetables. The primary focus has been to challenge the emphasis on appearance factors in fresh fruit and vegetable grade standards. The charge is that the emphasis on external appearance encourages an overuse of fungicides and insecticides in order to meet the grade standards. The implied criticism is that external factors are not a good indicator of the nutritive content or eating quality which consumers desire. The development of organic production and marketing of fresh produce is evidence of growing awareness and support for these concerns. The role of the USDA grading system has also been brought into question in a fundamental challenge to the basic attributes incorporated in grade standards.
As discussed earlier, intrinsic attributes such as nutritive content or eating quality do not lend themselves to incorporation into grade standards. Appearance factors represent a proxy for other, more subtle attributes, and are more easily evaluated in a grading system context.
Some proposals suggest that tolerances for visible external defects could be increased. P Producers would then be able to meet these revised grade standards with production practices that use less pesticides. Producers, shippers, and retailers express concern that consumers might react negatively to increased levels of external defects in the produce available to thelll;.
One response to these conflicting views is the development of a viable industry based on production and marketing of organic fruits and vegetables. The extent to which effective
34
consumer demand exists for "organic" products will be determined in the marketplace. The Food, Agriculture, Conservation, and Trade Act of 1990 (FACTA 1990) instructs USDA to develop national standards for certification of organic farming systems. Many states have such programs in place. A more fully developed and well-coordinated system will likely evolve over the next decade. Many in the industry believe that organic production can achieve quality levels comparable to those now established in existing grade standards. If a separate market segment exists to support these unique and certified production systems, then a viable industry is possible.
The extent to which pesticide residues are a problem in the fruit and vegetable industry should be evaluated in a total food safety and environmental management context. Residue testing programs initiated by some retailers is one response to this concern. Grade and quality standards should reflect what consumers expect from the system. They also must be efficient in their development and application and must be consistent over time.
Quality Factors in Trade
Quality and grade standards have also played a central role in the international trade of fruits and vegetables. On the positive side, quality standards are important in the longrun development of export markets. As the fruit and vegetable industry expends more resources to promote products in these markets, attention must be given to supplying quality consistent with the level desired in each market.
Controversy, however, surrounds the use of quality restrictions as a non-tariff barrier to trade. As multilateral trade negotiations have resulted in the lowering of protective tariffs, many countries have reportedly substituted various health, sanitation, or quality restrictions to achieve the same protective purposes. These practices have become part of the new trade battleground.
The grade standards established and made mandatory under federal marketing orders have been applied to U.S. imports of the same fruits and vegetables during the designated marketing season. This authority is provided by Section Be of the Agricultural Marketing Agreement Act of 1937.
Substantial controversy surrounds this mandatory application of grade standards. Domestic producers and shippers argue that imports are given an unfair advantage if they do not have to meet the sa-1'lle quality standards as domestic production. Firms exporting fruits and vegetables to the United States argue that they have to meet their own requirements and that the Marketing Order Committees in the United States do not include representation of the interests of importers or foreign suppliers. One charge is that the uniform grade standards in the United States are set in a way that discriminates against the quality attributes of foreign-produced fruits and vegetables.
35

Under the 1990 farm legislation (FACI'A 1990), a 6O-day waiting period and notification of the U.S. Trade Representative are required before any regulations on imports can be imposed under Section 8e. During this period, the U.S. Trade Representative is to determine whether the proposed regulations are consistent with the General Agreement on Tariff and Trade (GATT).
As trade expands, quality concerns will continue to be important. Harmonization and mutual recognition of food quality standards and procedures has been a focal-point of the emerging Single European Market (Europe 1992). The recently concluded negotiations on the North American Free Trade Agreement (NAFTA) involved significant negotiation over phytosanitary and other quality regulations and standards of importance to the U.S. fruit and vegetable industry. Uniform application of quality standards that reflect real differences in market demand will be maintained. But careful scrutiny of significant changes in standards can be expected also.
ANTICIPATED INDUSTRY CHANGES INFLUENCING QUALITY
The nature and definition of quality in the fruit and vegetable industry will likely evolve gradually. Nevertheless, the traditional emphasis on appearance and condition will continue to be key competitive factors. Quality has had an important influence on fruit and vegetable production and marketing decisions in the past. Changing technology and management practices will likely themselves be shaped by the competition to provide improved quality of products. Although the changing production, marketing, and consumption environment will provide some stimulus for revising quality standards, any change will not be revolutionary in nature.
Utilization and Consumption
One significant trend in fresh fruit and vegetable utilization is the increasing diversity of products and varieties being offered at retail. This trend is a reflection of demographic changes· and the merchandising emphasis being given to fresh produce by retailers. In addition to offering greater variety, retail displays highlight aspects of color and fresh appearance. Federal regulation will require that greater nutritional information be provided on fresh fruits and vegetables in the future. Quality standards used in wholesale trade are not likely to change greatly in response to these trends, although the complexity of qualitative differences will increase. Greater care will be needed to communicate these differences to consumers in a clear and informative way.
36

The growing importance of organically produced food products has had some impact on the perception of important qualitative attributes of fresh fruits and vegetables. External appearance, a key factor in established wholesale grade standards, is directly influenced by pest and disease management strategies. Those who advocate the growth and development of demand for produce grown without the benefit of modem agri-chemicals have also attempted to reduce the significance of external appearance factors in grade standards and in the consumer purchase decision process. Although major changes in official grade standards are not likely in the near future, consumers themselves are paying more attention to other qualitative attributes such as flavor and taste. Some packer-shippers have begun to emphasize tree-ripened flavor in an attempt to develop a demand for a differentiated, branded fresh fruit product. This development simply reflects the fact that qualitative differences are important in fresh produce. Such differences cannot likely be captured in the official commodity grading system beyond the current measures of "firmness" as an indicator of condition.
The growing importance of the food service industry may also have an impact on qUality. Pre-cut vegetables and packaged salad products are often needed for distribution through market channels to widely dispersed fast food retail outlets. The emphasis, therefore, is on product characteristics which support minimum loss of condition in such products over extended time periods. The trade-off among quality attributes is likely different· in supplying these markets as compared to traditional home preparation and use. Response to the specifications needed by food service retailers will be through new varieties, improved packaging, and better post-harvest management. New or altered grade standards will only be needed if such prepared fresh products become widely traded goods.
Substantial growth is expected in both imports and exports of fresh and processed fruits and vegetables. Export grade standards do not appear to be a major problem for U.S. firms in developing foreign markets. However, private and packer brands also convey quality information important in opening new export markets. Consistency is important in establishing a good export market reputation.
On tbe import side, quality management will be a function of negotiating mutually agreed standards, particularly for products that compete directly with those produced within the United States. Although sourcing of counter-seasonal fresh fruit supplies in the southern hemisphere will grow, imports will have to meet established U.S. grade standards. The NAFfA includes provisions that require fresh fruit and vegetable imports from Mexico to meet the standards traditionally used in the U. S. wholesale markets.
Production and Processing
Production of fruits and vegetables will continue to be dictated by key environmental factors. The growing importance of imports reflects one change in geographic patterns of production. Varietal development in fruits, such as peaches, has resulted in the shift of
37

some production to new growing areas. Much of this shift is dictated by an effort to extend market windows for fresh produce or to extend the season for utilizing existing processing facilities. Even as some of these fruit or vegetable crops are produced in more diverse latitudes, they often move to areas traditionally suited to the production of horticultural crops. Except for border negotiations over relevant quality characteristics, the evolving geographic patterns of production within the United States will have only marginal impacts on the standards of quality. Reconsidering grade standards in light of newly developed varieties, will be accommodated through normal USDA procedures.
Production, post-harvest, and processing management systems will continue to become more complex. Rapidly developing computer and information-sensing technology will allow for more sophisticated and precise management of pesticide applications, irrigation scheduling, harvesting, and post-harvest storage. Improvements in all of these areas have the potential for reducing losses and providing higher average quality of products to consumers and processors. Since the quality of most fruits and vegetables is environmentally sensitive, better control or mitigation of environmental factors will likely yield a beneficial result in terms of quality.
The introduction of irradiation of fresh produce in post-harvest handling is just beginning. If successfully comercialized, it has the potential of significantly extending shelflife and improving the condition of fresh products reaching the consumer.
Market Structure
Concentration in food retailing over the past forty years has resulted in greater direct buying and shipment to distribution centers. Although quality standards have not been substantially affected by this trend, the role of terminal wholesale markets has declined. Grading and sorting by quality attributes occurs at the shipping point. Pricing, including grade and quality discounts and premiums, is largely based on the supply and demand conditions at that level. Terminal wholesale markets still play a role in pricing and allocating products based on quality attributes but at a much reduced level of importance.
These trends are likely to continue. The emergence of wholesale clubs in food retailing, including produce, reflects continued emphasis on large-scale distribution and the economies that can be achieved in that way. Packer-shippers who can supply the demands of these large volume distribution firms will also need to be large. Trading and negotiations, including the role of quality and grade standards, are not likely to change radically, however.
Some efforts have been made to introduce brands into the retailing of fresh produce. Except for unique, fully-integrated production and marketing systems, such as those for bananas and mushrooms, the efforts at brand development have had only limited success. Where they do succeed, however, the possibility exists that qualitative attributes that include
38

flavor or nutritional characteristics might receive greater emphasis. The public grading system is needed most where established brands do not exist or do not effectively convey qualitative information to wholesalers and retailers. If branded produce products become more prevalent at retail, then grading may become less important because the firms with established brands that are integrated back to the production level will internalize the quality specifications.
Measurement of Quality
tittle is new in the technology of quality measurement in the fruit and vegetable industry. Existing technology for sorting by size or color has evolved slowly. Measurement of key factors in processing is more advanced and will likely evolve at an increasing pace, particularly within the processing line. Improved control over processing management may result in increased emphasis on the quality of the raw materials flowing into the processing plant. This emphasis will be reflected as needed in contract specifications. No major new directions for grading or grade standards are suggested as a result of changes in quality measurement technology in the fruit and vegetable industry.
SUMMARY AND CONCLUSIONS
Quality plays a central role in the fruit and vegetable industry. Among the most perishable of agricultural commodities, fresh produce is subject to significant variability in quality and rapid loss of condition in post-harvest handling and distribution.
Fruits, vegetables, and pulses account for approximately 26% of the value of all crops produced in the United States but only 2.6% of cropland. Production is concentrated in a few specialized regions with California and Florida in the lead. Other important areas include the Great Lakes states, the Pacific Northwest, and Texas. Separate production and marketing channels have developed for fresh and processed products. Significant contracting and vertical integration exists in processing channels to facilitate coordination, including quality considerations. Fresh market channels depend on market forces and a system of grades and standards to deliver the quality characteristics desired by consumers.
Quality of fresh produce may be specified in contracts or purchasing arrangements. Official grading is carried out by the USDA Agricultural Marketing Service and the Cooperative Federal-State Inspection system. USDA grade standards have been developed for approximately 135 fresh produce items and 150 processed products. USDA grading is voluntary except where marketing orders have been approved by producers and handlers.
39
Quality attributes used in USDA grade standards emphasize external appearance factors including size, shape, color, and defects. Tolerances for defects are more restrictive for products moving into fresh market channels. Much of the inspection of fresh fruit and vegetable quality is done by visual examination. Chemical and physical evaluation is more common for products moving into processing or final processed products. Quality factors for processed products· may include sugar content, acidity or consistency which lend themselves to mechanical or chemical evaluation techniques.
Consumers indicate that freshness or ripeness is their primary criteria for selecting fresh fruits and vegetables. Taste and appearance or condition were equally important. Nutrition and price were listed less frequently. Sensory inspection of externally apparent factors is the primary way in which consumers evaluate fresh produce quality. Grade factors have evolved to assist the wholesale trade in sorting and selecting fresh fruits and vegetables to match the consumer's selection process and preferences.
Of increasing importance is the concern for nutritive content and other intrinsic dimensions of fruit and vegetable qUality. Methods of incorporating nutritive content into grade standards available to consumers have not been, and are not likely to be, developed.
Additional issues in communication of quality relate to the nomenclature used in describing grades and the availability of consumer grades. Grade nomenclature is evolving toward a more simplified system. Consumer grades, though available for processed products and some pre-packaged fresh produce items, remain relatively undeveloped for the bulk of fresh fruits and vegetables. The current approach is to provide consumers with more information regarding nutritive content and the selection, purchase, and use fresh fruits and vegetables more consistently.
Grades and standards are also being reconsidered in light of the emergence of viable market channels for organically produced fruits and vegetables. The emphasis of external appearance factors in USDA grade standards may lead to an over-use of pesticides to meet the standards, according to some critics. Separate certification of organic production is now being developed as a means of identifying produce destined to serve this market segment.
Imports have become an increasingly important source of supply. Controversy has developed over the use of grade standards, in conjunction with marketing orders, to regulate the quality of imported produce. Such concerns are evaluated in light of GATT rules. The recently negotiated North American Free Trade Agreement will keep quality issues in the foreground as phytosanitary provisions of the agreement are implemented, enforced, and monitored.
Production patterns for fruits and vegetables are changing in response to new technology, environmental factors, and consumer demand. Marketing channels are becoming increasingly dominated by large-scale distribution and food retailing firms. The effects of theses changes will be substantial in terms of increased product availability. The average quality offered to consumers may improve as a result. However, the relative
40
balance among important quality attributes, the methods of measuring and quality, the U.S. grading system itself are not likely to be changed greatly.
Fruits and vegetables are an increasingly important component of the consumer's diet. Taste and health or dietary preferences are reinforcing each other. Consistent high levels of quality, as always, will be difficult to achieve for such a diverse and perishable set of products. Consumers have been evolving their concepts of important quality attributes. Challenges to an existing fIXed system of grades and standards will continue to come from botb consumers and new suppliers seeking a larger share of the market.
41

REFERENCES
Buckley, Katharine C., S.R. Hamm, B. Huang, and G. Zepp. 1988. "U.S. Fruit and Vegetable Processing Industries", Economic Research Service, USDA, Staff Report No. AGES 880216, August, pp. 217.
Kohls, Richard L. and J.N. UhI. 1990. Marketing of Agricultural Products, Seventh Ed., Macmillan Publishing Co., New York, NY, pp. 545.
Marion, Bruce. 1986. The Organization and Performance of the U.S. Food System, Lexington BOoks, Lexington, MA, pp. 532.
Nichols, John P., LD. Hill, and K.E. Nelson. 1983. "Food and Agricultural Commodity Grading," in Federal Marketing Programs in Agriculture: Issues and Options, W. J. Armbruster, D.R. Henderson, R.D. Knutson, (Eds.). The Interstate Publishers, Inc., Danville, II..., pp. 59-90.
Office of Technology Assessment. 1977. Perspectives on Federal Retail Food Grading, U.S. Congress, Washington, DC, June, pp. 87.
Ohio State University. 1991. "Assessing Federal Grade Criteria for Fruits and Vegetables", College of Agriculture Taskforce Report to the Office of Technology Assessment, U.S. Congress, Unpublished, April, pp. 126.
Shewfelt, Robert L.. 1990. "Quality of Fruits and Vegetables," Food Technology, June, pp. 99-106.
Smallwood, David M., N. Blissard, and J.R. Blaylock. 1991. "Food Spending in American Households", 1980-88, Economic Research Service, USDA, Statistical Bulletin No. 824, May, pp. 98.
U.S. Dept. of Agriculture. 1957. "United States Standards for Grades of Oranges (California and Arizona)", Agricultural Marketing Service, Washington, DC, pp. 6.
U.S. Dept. of Agriculture. 1969. "United States Standards for Grades of Oranges (Texas and States other than Florida, California and Arizona)", Agricultural Marketing Service, Washington, DC pp. 13.
U.S. Dept. of Agriculture. 1976. "United States Standards for Grades of Apples", (as amended), Agricultural Marketing Service, Washington, DC, pp. 8.
U.S. Dept. of Agriculture. 1980. "United States Standards for Grades of Florida Oranges and Tangelos", (as amended), Agricultural Marketing Service, Washington, DC, pp. 15.
42

U.S. Dept. of Agriculture. 1990. Agricultural Statistics, U.S. Government Printing Office, Washington, DC.
U.S. Department of Agriculture. 1990 & 1991. "Vegetable and Specialties Situation and Outlook", Economic Research Service, Various Issues.
U.S. Dept. of Agriculture. 1991. "Fruit and Tree Nuts Situation and Outlook Report Yearbook", Economic Research Service, TFS-258, August, pp. 102.
U.S. Dept. of Agriculture. 1990. "Desk Reference Guide to U.S. Agricultural Trade", Foreign Agriculture Service, Revised, Agriculture Handbook No. 683.
U.S. Dept. of Commerce. 1990. 1987 Census of Manufactures, Bureau of the Census, Industry Statistics.
Zind, Tom. 1990. "1be Year of Challenge". The Packer Focus: Fresh Trends '90, The Vance Publishing Co., Overland Park, KS, pp. 37-68.
43