
Quality Improvement (QI )
22
Quality Improvement (QI) Understanding the Cause and Effect Diagram Gregg M. Reed, MPH QI Council
-
Upload
brianna-hassett -
Category
Documents
-
view
60 -
download
3
description
Quality Improvement (QI ). Understanding the Cause and Effect Diagram. Gregg M. Reed, MPH QI Council. Quality Improvement in Accreditation. “ Quality improvement is the foundation of [Public Health Accreditation Board] PHAB’s accreditation program, to the extent that a - PowerPoint PPT Presentation
Transcript of Quality Improvement (QI )
Quality Improvement (QI)
Understanding the Cause and Effect Diagram
Gregg M. Reed, MPHQI Council
5/27/2014 2
Quality Improvement in Accreditation
“Quality improvement is the foundationof [Public Health Accreditation Board] PHAB’s accreditation program, to the extent that a health department attains accreditation status only if it embodies a culture of quality improvement.”
American Public Health AssociationQuality Improvement in Public Health: It Works! (2012)
5/27/2014 3
Summary Definition of Quality Improvement
• Continuous/ongoing process• Measureable change • Monitor factors/disproportions impacting quality• Achieve equity/uniform processes within a
system to improve health
5/27/2014 4
Agenda• Review Quality Improvement Tools– 10 minutes
• Group Work on Cause and Effect Diagram and 5 Whys– 30 minutes
• Review Group Work– 10 minutes
• Discussion and Next Steps– 10 minutes
5/27/2014 5
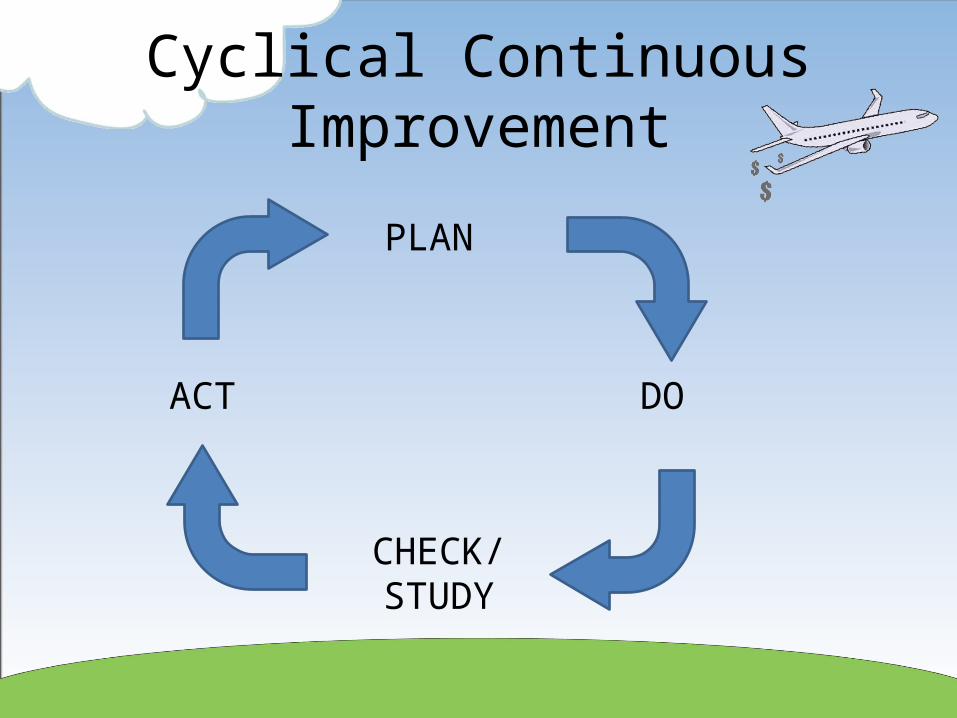
Cyclical Continuous Improvement
PLAN
DO
CHECK/STUDY
ACT
5/27/2014 6
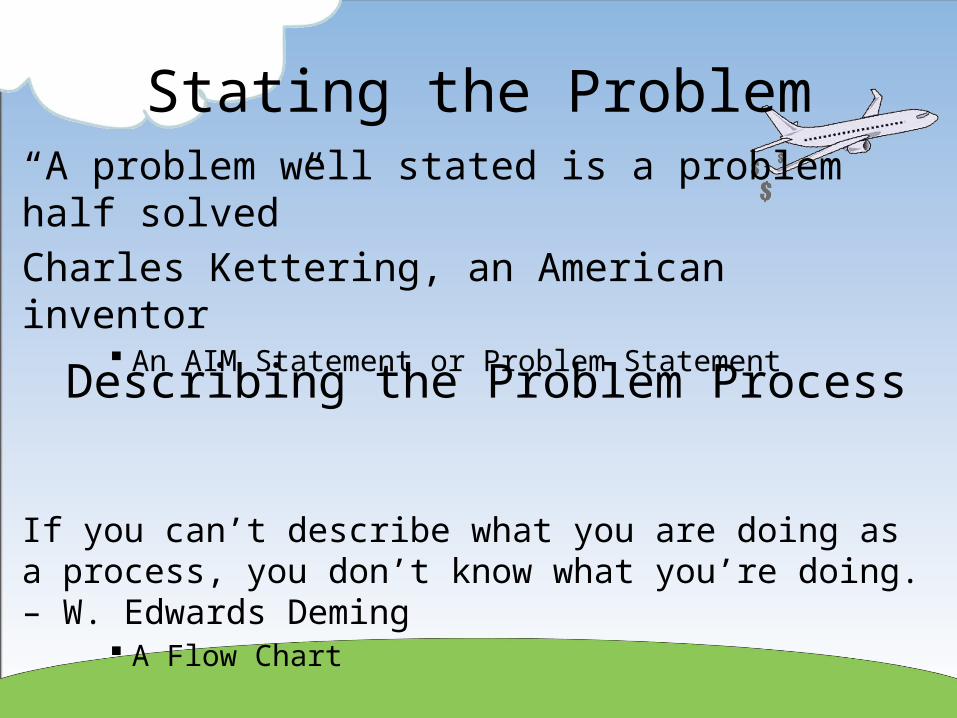
Stating the Problem“A problem well stated is a problem half solved”Charles Kettering, an American inventor
An AIM Statement or Problem Statement
If you can’t describe what you are doing as a process, you don’t know what you’re doing. – W. Edwards Deming
A Flow Chart
Describing the Problem Process
5/27/2014 7
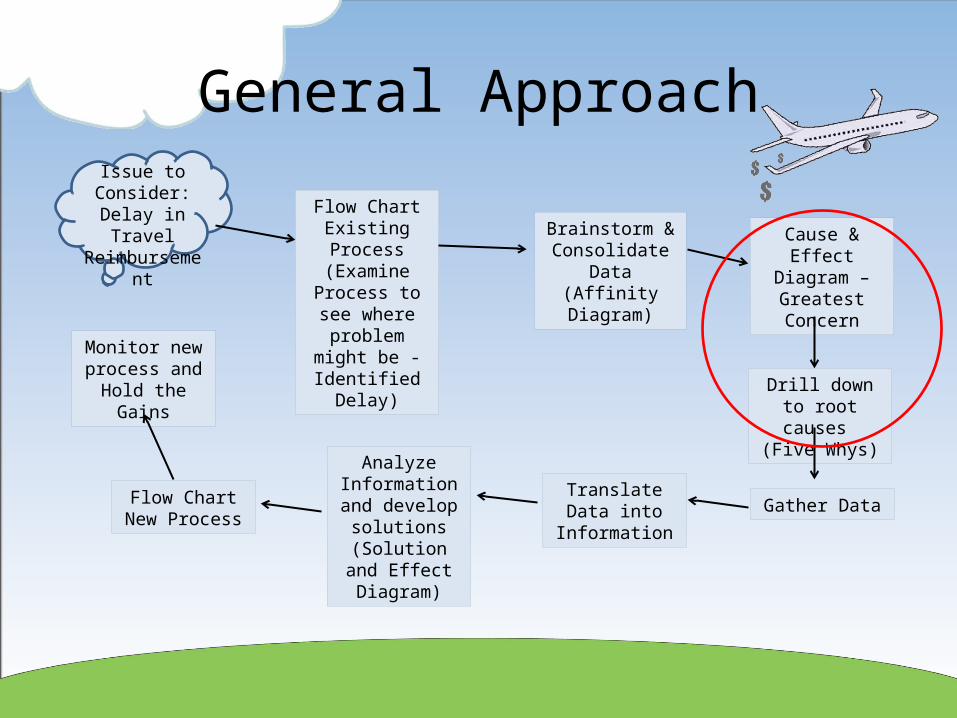
General ApproachIssue to
Consider:Delay in Travel
Reimbursement Brainstorm & Consolidate Data (Affinity Diagram)
Flow Chart Existing Process
(Examine Process to see
where problem might be -
Identified Delay)
Cause & Effect Diagram – Greatest Concern
Drill down to root causes (Five Whys)
Gather DataTranslate Data
into Information
Analyze Information and
develop solutions
(Solution and Effect Diagram)
Flow Chart New Process
Monitor new process and Hold
the Gains
5/27/2014 8
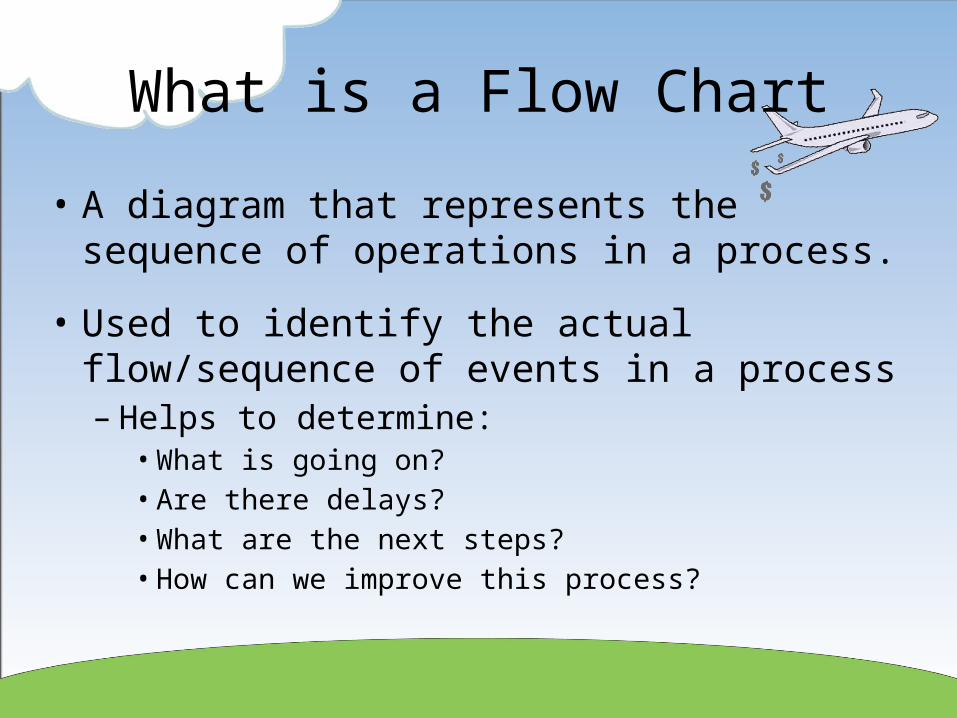
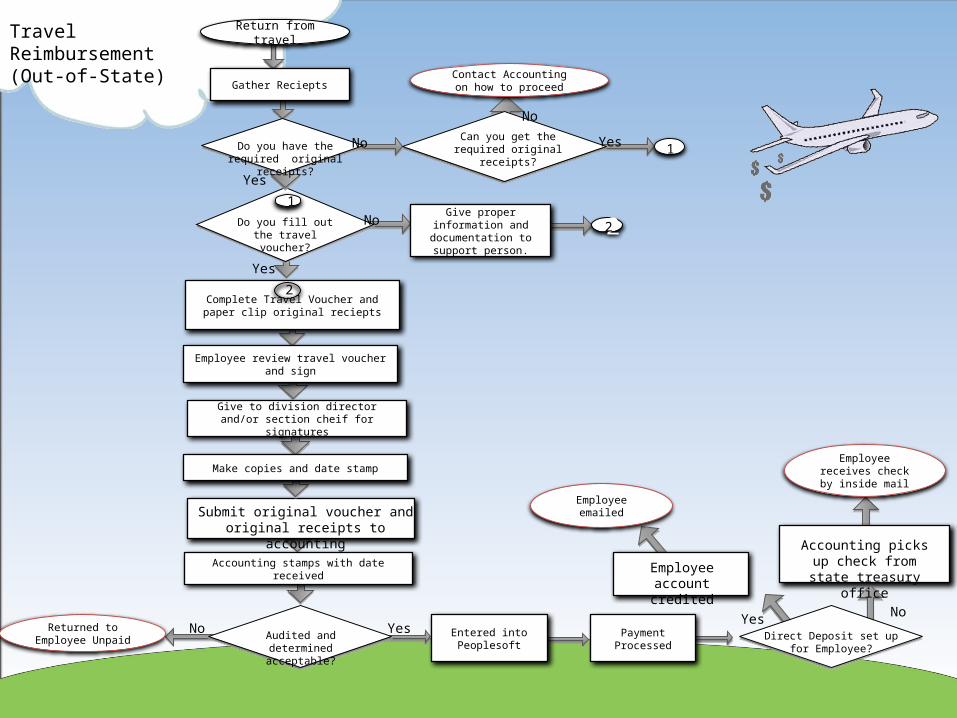
What is a Flow Chart
• A diagram that represents the sequence of operations in a process.
• Used to identify the actual flow/sequence of events in a process– Helps to determine:• What is going on?• Are there delays?• What are the next steps?• How can we improve this process?
5/27/2014 9
Gather Reciepts
No
Travel Reimbursement(Out-of-State)
Do you have the required original receipts?
Return from travel
Yes
1Do you fill out the travel
voucher?
Yes
No
Yes
No
1
Contact Accounting on how to proceed
Employee review travel voucher and sign
Employee receives check by inside mail
Submit original voucher and original receipts to accounting
Give to division director and/or section cheif for signatures
Audited and determined acceptable?
Employee emailed
No
Accounting stamps with date received
Entered into Peoplesoft
Returned to Employee Unpaid
Can you get the required original receipts?
Give proper information and documentation to
support person.22
Make copies and date stamp
Complete Travel Voucher and paper clip original reciepts
2
Payment ProcessedNo Yes
Direct Deposit set up for Employee?
Yes
Accounting picks up check from state treasury office
Employee account credited
5/27/2014 10
March Flow Chart Findings
• Bottlenecks• Hand-offs• Redundancy• Rework loops• Wait or delays
5/27/2014 11
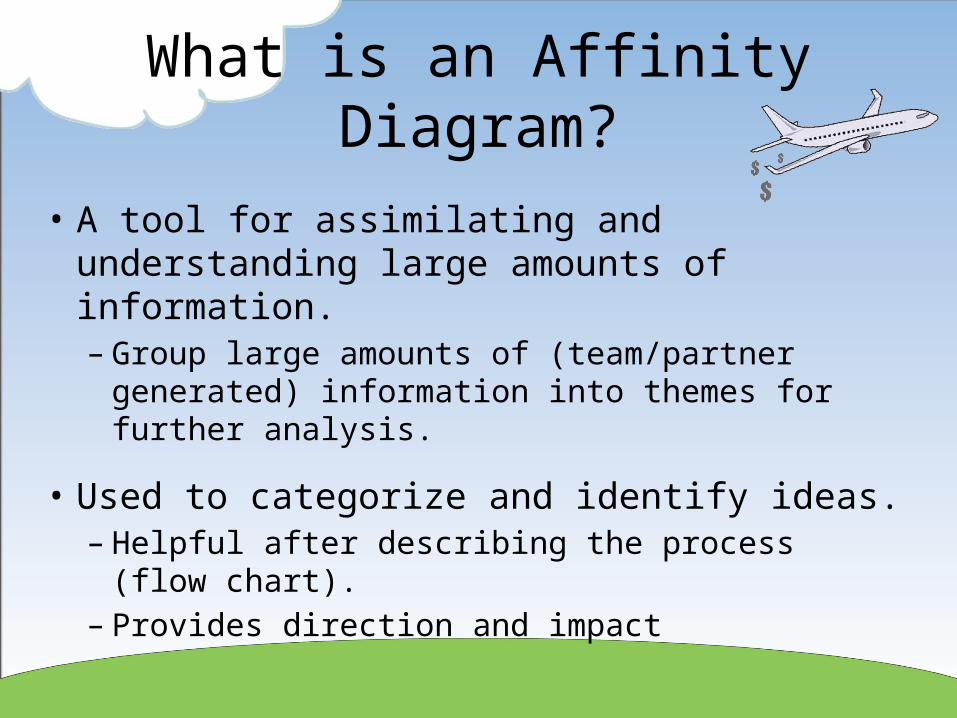
What is an Affinity Diagram?
• A tool for assimilating and understanding large amounts of information.– Group large amounts of (team/partner generated)
information into themes for further analysis.
• Used to categorize and identify ideas.– Helpful after describing the process (flow chart).– Provides direction and impact
5/27/2014 12
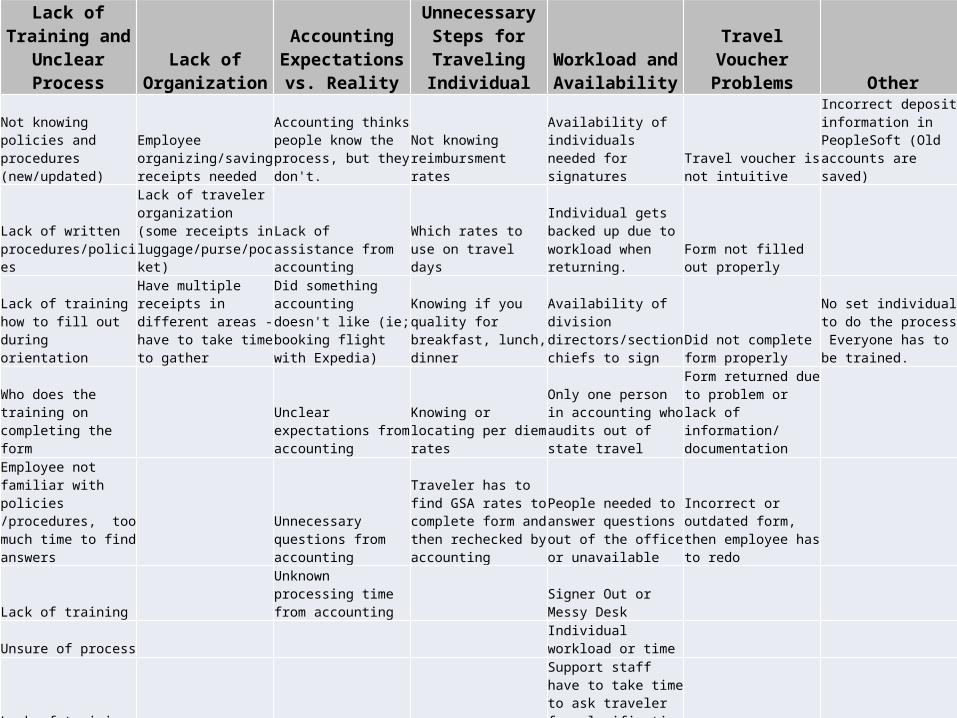
Lack of Training and Unclear
ProcessLack of
Organization
Accounting Expectations vs.
Reality
Unnecessary Steps for Traveling
IndividualWorkload and
AvailabilityTravel Voucher
Problems OtherNot knowing policies and procedures (new/updated)
Employee organizing/saving receipts needed
Accounting thinks people know the process, but they don't.
Not knowing reimbursment rates
Availability of individuals needed for signatures
Travel voucher is not intuitive
Incorrect deposit information in PeopleSoft (Old accounts are saved)
Lack of written procedures/policies
Lack of traveler organization (some receipts in luggage/purse/pocket)
Lack of assistance from accounting
Which rates to use on travel days
Individual gets backed up due to workload when returning.
Form not filled out properly
Lack of training how to fill out during orientation
Have multiple receipts in different areas - have to take time to gather
Did something accounting doesn't like (ie; booking flight with Expedia)
Knowing if you quality for breakfast, lunch, dinner
Availability of division directors/section chiefs to sign
Did not complete form properly
No set individual to do the process. Everyone has to be trained.
Who does the training on completing the form
Unclear expectations from accounting
Knowing or locating per diem rates
Only one person in accounting who audits out of state travel
Form returned due to problem or lack of information/ documentation
Employee not familiar with policies/procedures, too much time to find answers
Unnecessary questions from accounting
Traveler has to find GSA rates to complete form and then rechecked by accounting
People needed to answer questions out of the office or unavailable
Incorrect or outdated form, then employee has to redo
Lack of trainingUnknown processing time from accounting
Signer Out or Messy Desk
Unsure of processIndividual workload or time
Lack of training
Support staff have to take time to ask traveler for clarification
Forget due to lack of out-of-state travel
Time available to complete the process
Not knowing which receipts neededWhat receipts are neededOffsite people have to mail original receipts
Lack of knowledge on which receipts are requiredWrong type of receipt (hotel must have amount charged and zero balance)
5/27/2014 13
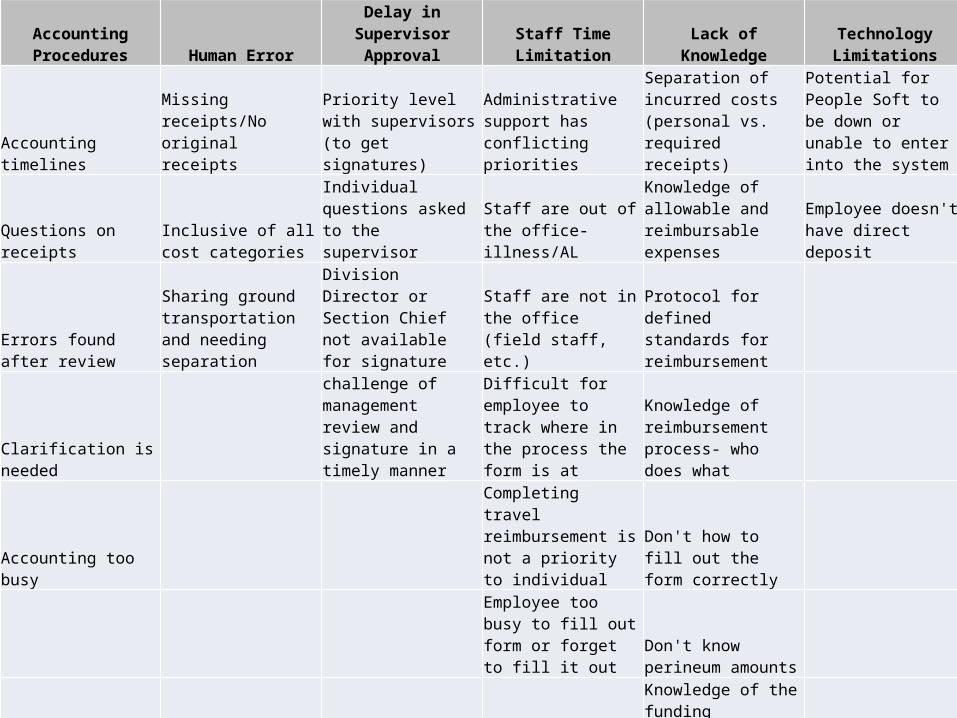
Accounting Procedures Human ErrorDelay in Supervisor
Approval Staff Time Limitation Lack of Knowledge Technology Limitations
Accounting timelinesMissing receipts/No original receipts
Priority level with supervisors (to get signatures)
Administrative support has conflicting priorities
Separation of incurred costs (personal vs. required receipts)
Potential for People Soft to be down or unable to enter into the system
Questions on receiptsInclusive of all cost categories
Individual questions asked to the supervisor
Staff are out of the office- illness/AL
Knowledge of allowable and reimbursable expenses
Employee doesn't have direct deposit
Errors found after review
Sharing ground transportation and needing separation
Division Director or Section Chief not available for signature
Staff are not in the office (field staff, etc.)
Protocol for defined standards for reimbursement
Clarification is needed
challenge of management review and signature in a timely manner
Difficult for employee to track where in the process the form is at
Knowledge of reimbursement process- who does what
Accounting too busy
Completing travel reimbursement is not a priority to individual
Don't how to fill out the form correctly
Employee too busy to fill out form or forget to fill it out
Don't know perineum amounts
Knowledge of the funding source/categories
Lack of standardization of how the form is completed
Not familiar with the travel policy
5/27/2014 14
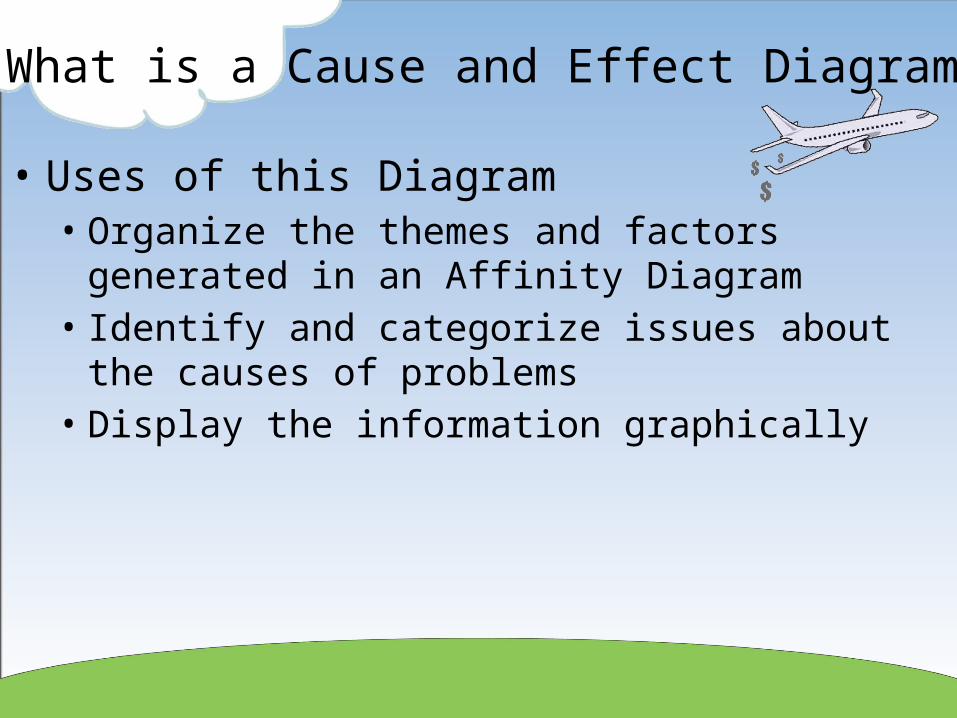
What is a Cause and Effect Diagram
• Uses of this Diagram• Organize the themes and factors generated in an Affinity
Diagram• Identify and categorize issues about the causes of
problems • Display the information graphically
5/27/2014 15
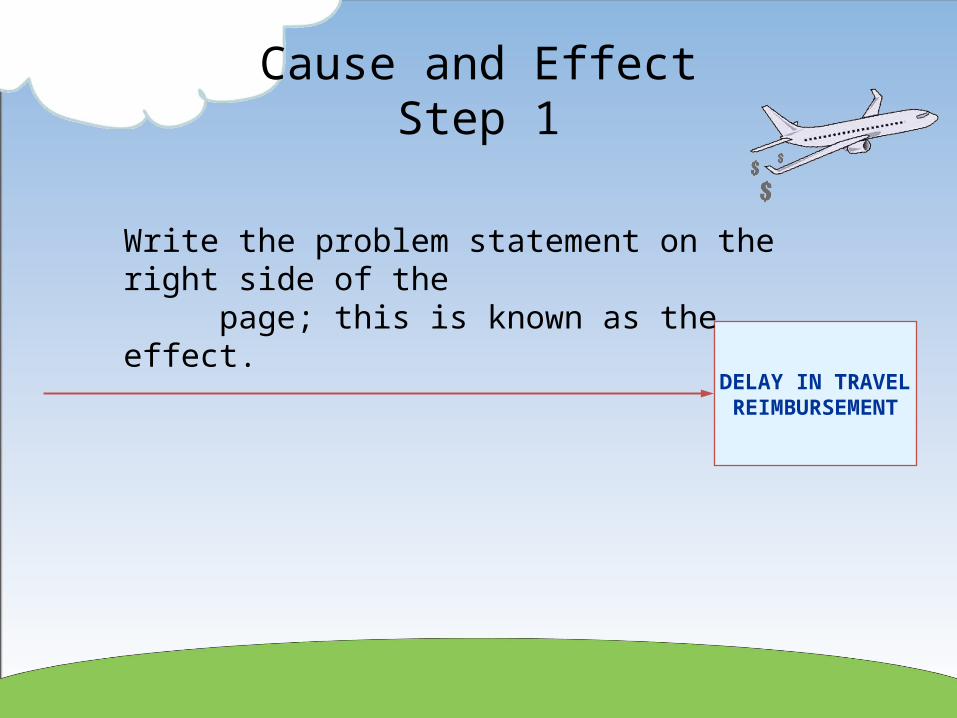
Cause and EffectStep 1
DELAY IN TRAVELREIMBURSEMENT
Write the problem statement on the right side of the page; this is known as the effect.
5/27/2014 16
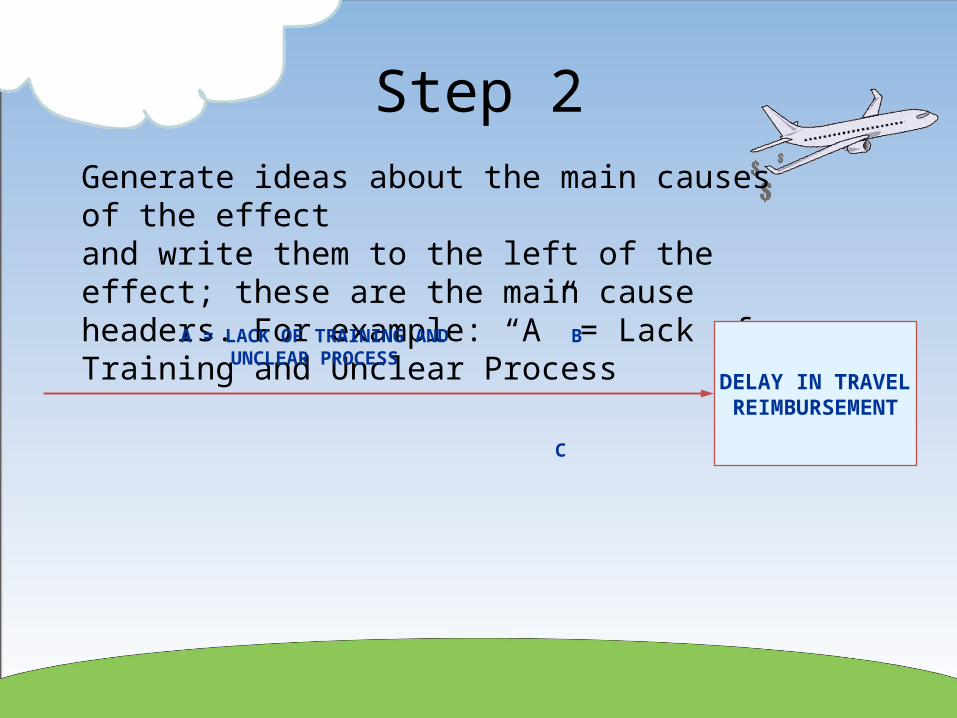
Step 2Generate ideas about the main causes of the effectand write them to the left of the effect; these are the main cause headers. For example: “A” = Lack of Training and Unclear Process
DELAY IN TRAVELREIMBURSEMENT
C
BA = LACK OF TRAINING AND UNCLEAR PROCESS
5/27/2014 17
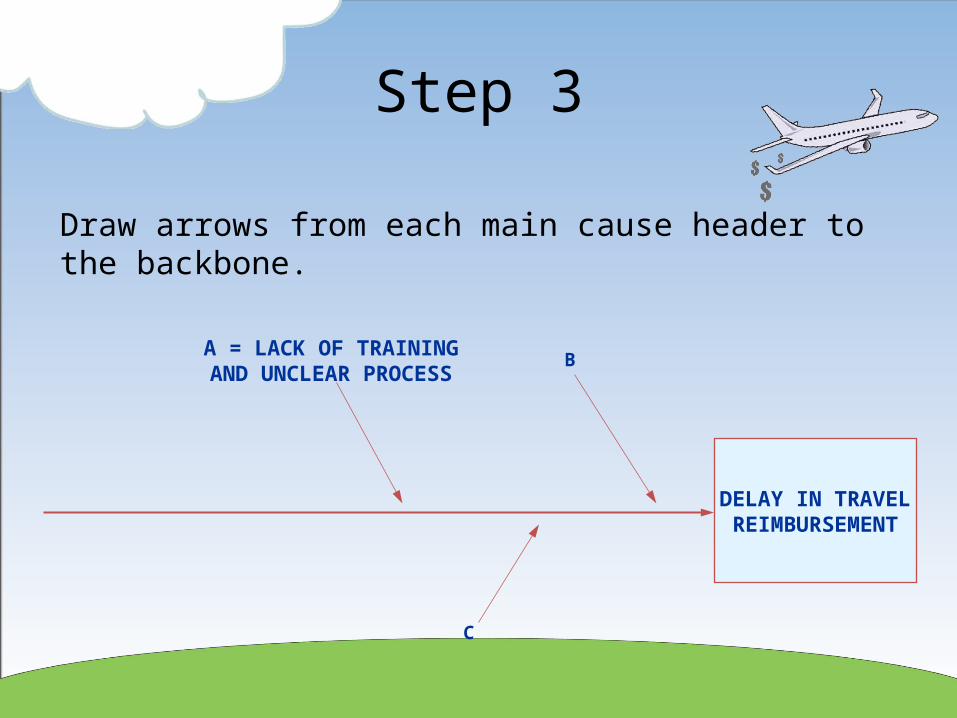
Step 3
DELAY IN TRAVELREIMBURSEMENT
C
BA = LACK OF TRAINING AND UNCLEAR PROCESS
Draw arrows from each main cause header to the backbone.
5/27/2014 18
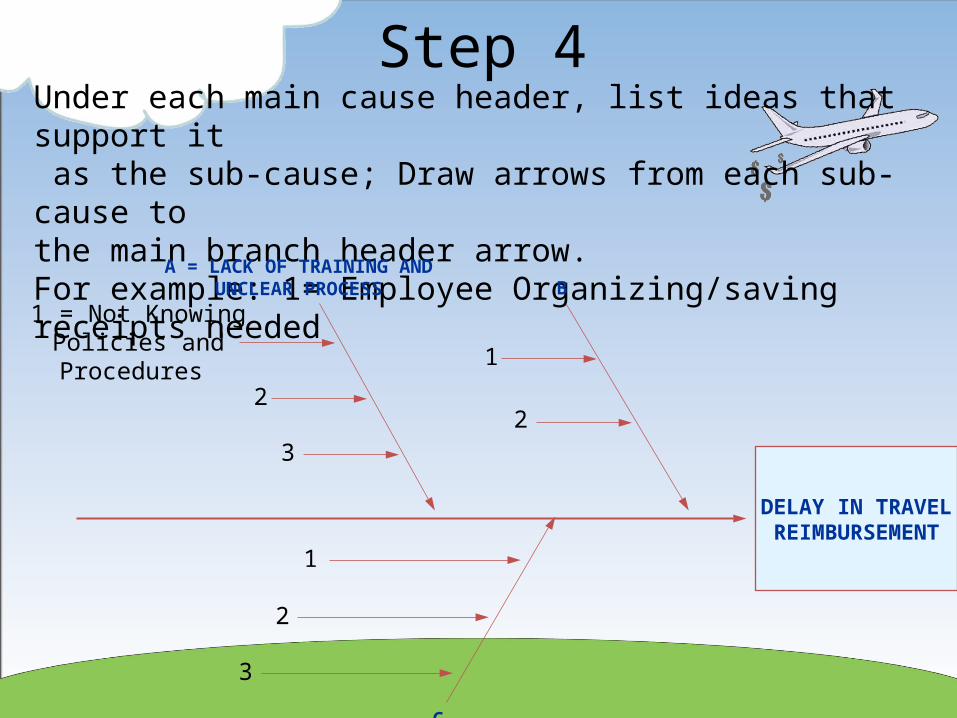
Step 4Under each main cause header, list ideas that support it as the sub-cause; Draw arrows from each sub-cause tothe main branch header arrow. For example: 1= Employee Organizing/saving receipts needed
DELAY IN TRAVELREIMBURSEMENT
C
B
2
1
3
2
1
2
3
A = LACK OF TRAINING AND UNCLEAR PROCESS
1 = Not Knowing Policies and Procedures
5/27/2014 19
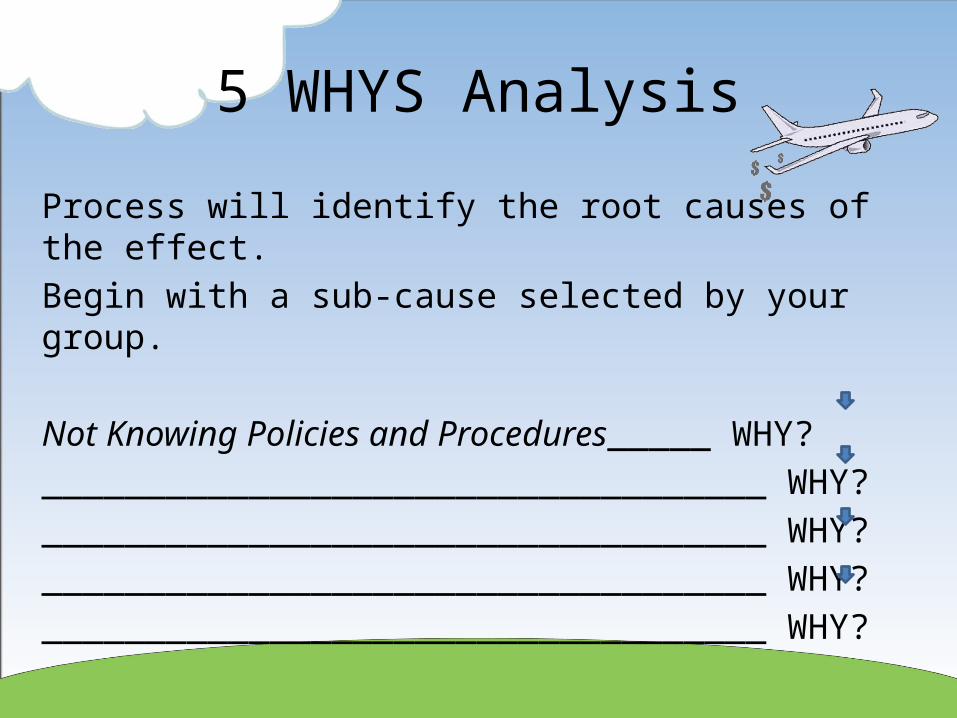
5 WHYS Analysis
Process will identify the root causes of the effect.Begin with a sub-cause selected by your group.
Not Knowing Policies and Procedures_____ WHY?___________________________________ WHY?___________________________________ WHY?___________________________________ WHY?___________________________________ WHY?
5/27/2014 20
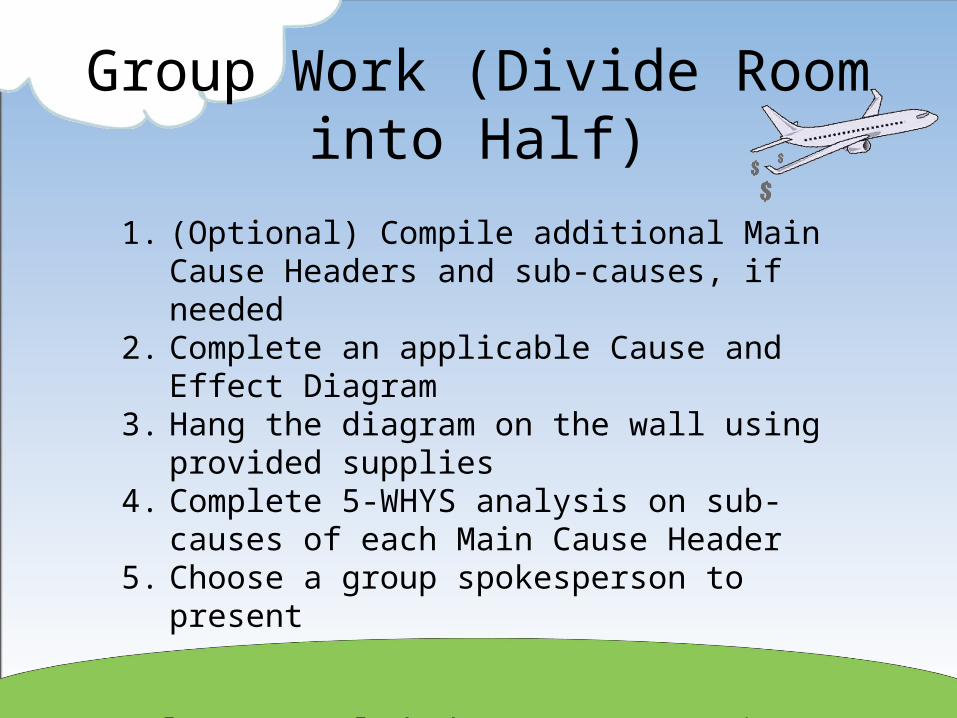
Group Work (Divide Room into Half)
1. (Optional) Compile additional Main Cause Headers and sub-causes, if needed
2. Complete an applicable Cause and Effect Diagram3. Hang the diagram on the wall using provided supplies4. Complete 5-WHYS analysis on sub-causes of each Main
Cause Header5. Choose a group spokesperson to present
Please conclude by 1:40pm (30 minutes)

5/27/2014 21
Discussion

5/27/2014 22
Next QI Tool Learning Session
• Solution and Effect Diagrams–June 17th•11 am to 12 pm•Capital: AV Rooms 210 & 212
• Contact Susan Mormann or Kelly Nagel with questions