Quality improvement efforts in Nigerian public health ...sqhn.org/web/attachments/1/Quality...
21
Quality improvement efforts in Quality improvement efforts in Nigerian public health facilities Nigerian public health facilities A presentation of FHI Nigeria at the maiden conference of the Society for Quality Healthcare in Nigeria 7 July, 2009 Dr Christoph Hamelmann Country Director
Transcript of Quality improvement efforts in Nigerian public health ...sqhn.org/web/attachments/1/Quality...

Quality improvement efforts in Quality improvement efforts in Nigerian public health facilitiesNigerian public health facilities
A presentation of FHI Nigeria at the maiden conference of the Society for Quality Healthcare in Nigeria
7 July, 2009
Dr Christoph HamelmannCountry Director

FHI Nigeria program developmentFHI Nigeria program development
Sexual and reproductive health programs (SRH)
HIV/AIDS and SRH
Health systems strengthening and integration of global health initiatives
1988 – 1997 1998 – 2004 2005 – 2007 2008 - 2009
Global Health Initiatives:• HIV/AIDS• TB• SRH• Malaria
Multiple disease programs
Global Health Initiatives (GHI)s
Single disease program
Health systems and integrated GHIs

What Quality Improvement isWhat Quality Improvement is
• Concerted efforts to improve the quality of medical care
• ‘‘… the degree to which health services for individuals and population increases the likelihood of desired health outcomes and are consistent with current professional knowledge’’
— The Institute of Medicine

FHI Quality Assurance Quality FHI Quality Assurance Quality Improvement guiding principlesImprovement guiding principles
Develop standards
Implement standards
Measureperformance
againststandards
Identify quality gaps and performance
issues
Address issues
QA
Identify the improvement
goal/objectives
QIDevelop the
improvement measurement
system
Develop ideas for changes
Test system changes
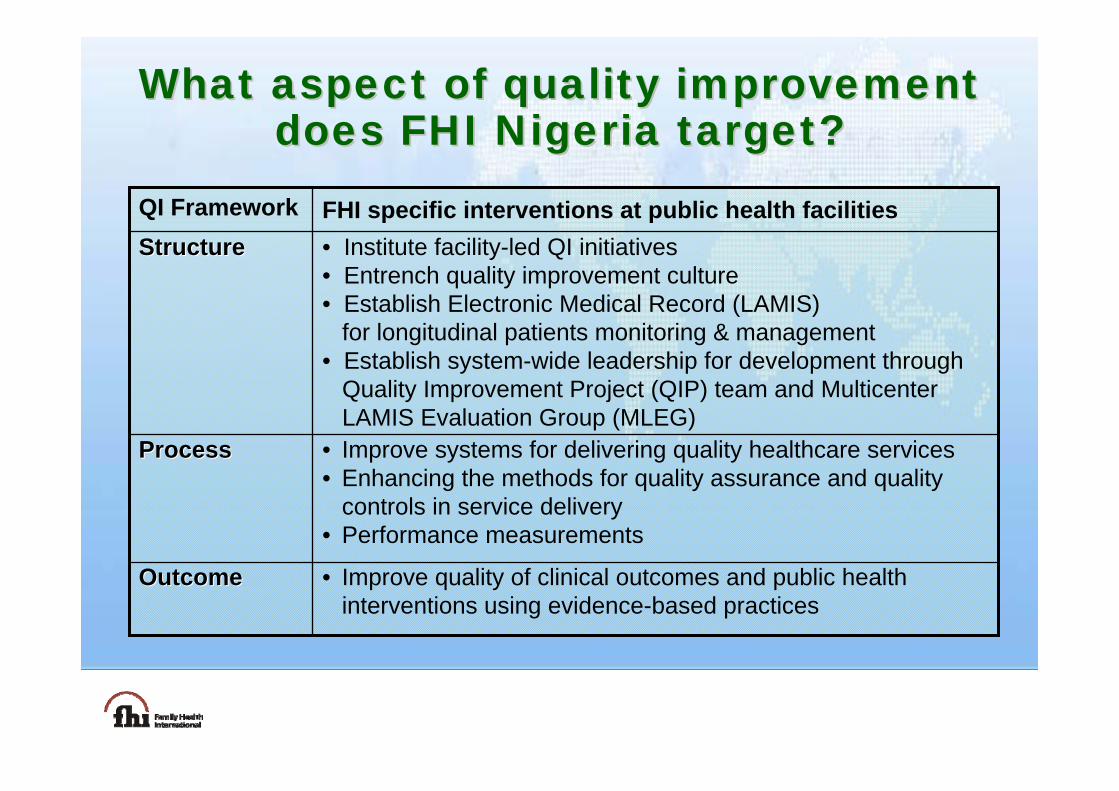
What aspect of quality improvement What aspect of quality improvement does FHI Nigeria target?does FHI Nigeria target?
FHI specific interventions at public health facilitiesQI Framework • Institute facility-led QI initiatives • Entrench quality improvement culture• Establish Electronic Medical Record (LAMIS)
for longitudinal patients monitoring & management • Establish system-wide leadership for development through
Quality Improvement Project (QIP) team and Multicenter LAMIS Evaluation Group (MLEG)
StructureStructure
• Improve quality of clinical outcomes and public health interventions using evidence-based practices
Outcome Outcome
• Improve systems for delivering quality healthcare services • Enhancing the methods for quality assurance and quality
controls in service delivery • Performance measurements
ProcessProcess

Generic service blueprintGeneric service blueprint

Three good QI examplesThree good QI examples
PMTCTPMTCT
TB/HIVTB/HIV
ARTART
Improvement of case detection of TB/HIV co-infection
Improvement of switching to 2nd line ARVs
Improvement of ARV prophylaxis uptake

Fishbone diagram: rootFishbone diagram: root--causes causes for low ARV prophylaxis uptakefor low ARV prophylaxis uptake
PMTCTPMTCT
Providers
Low ARV prophylaxis uptake
Policy
Resources
Patients
New tool - diariesInadequate staffing
False address
Inadequate information to track patients
Policy issues HW resistance to change
Timing of ARV administration
POS with same day result
Posting, resignationNational Guidelines for commencement of ARV
prophylaxis
Late ordering of drugs
Lack of CD4 machines in stand-alone sites
Cultural beliefs Expensive
High staff turn over
Low hospital delivery rate Transport costs
Domestic violence
Distance
Low rate of return visits to facility
Partner disclosure issues
Stigma

Impact on HIV testing Impact on HIV testing and ARV uptakeand ARV uptake
0
200
400
600
800
1000
1200
Jul-07 Aug-07 Sep-07 Oct-07 Nov-07 Dec-07 Jan-08 Feb-08 Mar-08 Apr-08 May-08 Jun-08 Jul-08 Aug-08 Sep-08
Pregnant women tested HIV positive Pregnant HIV positive woman completed ARV prophylaxis - total
Pre-QI Post-QI
Total number of public health facilities involved in PMTCT QI intervention = 62
PMTCTPMTCT

TB/HIVTB/HIV RootRoot--cause analysis for low case cause analysis for low case detection of TB/HIV codetection of TB/HIV co--infection infection
Personnel
Low detection of TB/HIV co-infection
Policy
Resources
Patients
Inconsistency in the content of counseling provided at
different CT units
Lack of training for lab scientist on use of TB tools
Poor documentation of HCT services at blood bank
Inadequate number of trained staff at blood bank
Wrong referral from blood bank
Lack of HCT providers in the CT unit of Chest Clinic
Poor documentation in TB lab register (patients’ HIV status not documented)
Poor understanding of the National guidelines on TB/HIV collaboration
Poor infrastructure (non-conducive waiting room)
Incessant stock-outs of anti-TB drugs, lab reagents and RTKs
Occasional clients opt out of TB and
HCT services
Inappropriate information to clients referred to TB
lab from main HCT center
Difficulty in locating TB lab
Unavailability of National guidelines and policy documents at sites
Broken-down/non-functional microscopes

TB/HIVTB/HIV Clinical TB screening profile at Clinical TB screening profile at HIV service delivery pointsHIV service delivery points
0%
20%
40%
60%
80%
100%
Jan-08 Feb-08 Mar-08 Apr-08 May-08 Jun-08 Jul-08 Aug-08 Sep-08 Oct-08 Nov-08 Dec-08 Jan-09 Feb-09 Mar-09
Proportion of HIV negative clinically screened for TB Proportion of HIV positive clinically screened for TB
QI Intervention begins
Mid Cycle Review & Correction

Impact on TB diagnosis amongst Impact on TB diagnosis amongst HIV positive individualsHIV positive individuals
0%
20%
40%
60%
80%
100%
Jan-08 Feb-08 Mar-08 Apr-08 May-08 Jun-08 Jul-08 Aug-08 Sep-08 Oct-08 Nov-08 Dec-08 Jan-09 Feb-09 Mar-09
Proportion of new HIV positive individuals with TB clincal screening score 1+ with 3 AFB sputum smear examinatio
QI Intervention begins Mid Cycle Review & Correction
2 ptmoving
average
TB/HIVTB/HIV
• This chart presents results of TB/HIV QI intervention in 1 pilot site in Nigeria• The key system changes/intervention that led to significant quality improvement is being tested in 42 sites in Nigeria

RootRoot--cause analysis for failure cause analysis for failure to switch to 2nd line ARVsto switch to 2nd line ARVs
ARTART
Providers
Failure to switch to 2nd line drugs
Lab. factors
Resources
Patients
Inadequate information and training of HW on how/when to switch
High staff attrition
Request for investigation not made
Failure to review clients investigation
Recurring CD4 machine breakdown
Late ordering of 2nd line drugs Transport costs
Poor patient monitoring
Low rate of return visits
Restricting sample collection due to manpower shortage
Stock-out of 2nd line drugs
Envisaged 2nd line
drugs toxicityWork overload for physician
Distance from the public health
facilities
Patients not submitting samples for
follow-up investigation
Missed appointments
LTFU

Antiretroviral treatment QI Antiretroviral treatment QI ARTART
Enhanced QA/QI using FHI’s EMR, LAMIS
Automatically generated performance indicators
Multicentre LAMIS Evaluation Group acts as the QA/QI team

ARTART

LAMIS: Performance indicator data LAMIS: Performance indicator data dictionarydictionary

0%
10%
20%
30%
40%
50%
60%
70%
80%
90%
100%
May June July Aug Sept Oct Nov Dec Jan Feb Mar Apr
Perc
enta
ges
Proportion of current ART patients who had a Proportion of current ART patients who had a clinical staging done at last clinical visit prior clinical staging done at last clinical visit prior to the reporting date in Massey Street Children to the reporting date in Massey Street Children
hospital, Lagos (N= 663)hospital, Lagos (N= 663)

LAMIS: Scoring system LAMIS: Scoring system

Comparative rankings for facility improvements Comparative rankings for facility improvements on percentage of current ART patients who had a on percentage of current ART patients who had a clinical staging done prior to the reporting date clinical staging done prior to the reporting date
1
0
10
20
30
40
50
60
70
80
90
100
Jan Feb Mar Apr May Jun Jul Aug Sep Oct Nov Dec
Perc
enta
ges
Massey Maitama Mainland
123
Facility 1 Facility 2 Facility 3

Conclusions Conclusions
Facility-led QI efforts for public health services supported by TA organization are feasible and
successful in lifting quality of services at public health facilities in Nigeria

Thanks for listening! Thanks for listening!