Quality Decision Control, Marketing Applied Strategic ... · Quality Decision Control, Marketing...
13
Quality Decision Control, Marketing Applied Strategic Agility and Energy Projects Performance Walter Amedzro St-Hilaire University of Ottawa The objective of this study is to investigate the connectedness between quality decision control and marketing strategic agility on public energy projects performance. The intra-country integration of these sectors in the short and long-run are estimated using monthly data covering. The findings based on impulse response functions and variance decomposition demonstrates that most of the variations in each market variable can be explained by its own lag. Thus, the public energy projects offer less opportunities of intra-country diversification of financial portfolio. INTRODUCTION One of the most important decisions for energy projects managers is portfolio allocation. Important thing in this decision is to know how different markets are integrated. If, for instance, stock and money markets are not highly integrated, it is possible to lower the portfolio risk by diversification. One of the key interests of an investor is to minimize the risks of an investment portfolio and maximize the expected returns. Generally, portfolio diversification is attained by employing two major strategies: investing in various categories of assets thought to have no or negative correlations or investing in identical categories of assets in various markets through global diversification. The admittance towards capital markets has raised the prospects of portfolio diversification for the investors and also provides them with more potential opportunities to obtain a higher risk-adjusted rate of return, (Obstfeld 1994). In economies where the financial system is integrated, it may happen that instability and distress in any one financial market may cause for running away of the capital to other’ investment; this process of capital flight from one to another disturb the company’s asset value which in turn decreases the organization’s creditworthiness. An open and well-integrated financial market helps to maximize the benefits of an increasing globalized economy. A well integrated financial market with rest of the nations in the world can help country to level its consumption pattern and to enhance their productivity by attracting large number of investors. Public energy projects can attain high level economies of scale, growth and better improved living standard for people. Integration of Energy projects has significantly increased during the period of 1980s and 1990s. A wave of recent reform and internationalization in public markets has enhanced linkage within various sectors of national and international markets. Some of the key factors behind this change are increased globalization of investment in order to get higher rates of return and diversification of risk internationally. Energy projects also implemented policies similar to various economies of Energy projects reforms and liberalization in the early 1990s. Transformation and reforms have a positive effect on the economy, which improved credit rating by appreciation of the currency. As a result of these reforms and 102 American Journal of Management Vol. 15(4) 2015
Transcript of Quality Decision Control, Marketing Applied Strategic ... · Quality Decision Control, Marketing...

Quality Decision Control, Marketing Applied Strategic Agility and Energy Projects Performance
Walter Amedzro St-Hilaire
University of Ottawa
The objective of this study is to investigate the connectedness between quality decision control and marketing strategic agility on public energy projects performance. The intra-country integration of these sectors in the short and long-run are estimated using monthly data covering. The findings based on impulse response functions and variance decomposition demonstrates that most of the variations in each market variable can be explained by its own lag. Thus, the public energy projects offer less opportunities of intra-country diversification of financial portfolio. INTRODUCTION
One of the most important decisions for energy projects managers is portfolio allocation. Important thing in this decision is to know how different markets are integrated. If, for instance, stock and money markets are not highly integrated, it is possible to lower the portfolio risk by diversification. One of the key interests of an investor is to minimize the risks of an investment portfolio and maximize the expected returns. Generally, portfolio diversification is attained by employing two major strategies: investing in various categories of assets thought to have no or negative correlations or investing in identical categories of assets in various markets through global diversification. The admittance towards capital markets has raised the prospects of portfolio diversification for the investors and also provides them with more potential opportunities to obtain a higher risk-adjusted rate of return, (Obstfeld 1994). In economies where the financial system is integrated, it may happen that instability and distress in any one financial market may cause for running away of the capital to other’ investment; this process of capital flight from one to another disturb the company’s asset value which in turn decreases the organization’s creditworthiness. An open and well-integrated financial market helps to maximize the benefits of an increasing globalized economy. A well integrated financial market with rest of the nations in the world can help country to level its consumption pattern and to enhance their productivity by attracting large number of investors. Public energy projects can attain high level economies of scale, growth and better improved living standard for people.
Integration of Energy projects has significantly increased during the period of 1980s and 1990s. A wave of recent reform and internationalization in public markets has enhanced linkage within various sectors of national and international markets. Some of the key factors behind this change are increased globalization of investment in order to get higher rates of return and diversification of risk internationally. Energy projects also implemented policies similar to various economies of Energy projects reforms and liberalization in the early 1990s. Transformation and reforms have a positive effect on the economy, which improved credit rating by appreciation of the currency. As a result of these reforms and
102 American Journal of Management Vol. 15(4) 2015

deregulation of many sectors of the economy, the movements of important financial market indicators such as exchange rates, stock prices and interest rates became a reflection of market forces. Two main results of implementing Energy projects reforms are opening of three stock markets and implementing of flexible exchange rate system. As a result of various stock markets, portfolio investment inflows increased quickly. On one hand, such portfolio investment assists investors for increasing investable finances and at the other hand, such portfolio investment have created feral dangles in the stock market.
Despite the importance of this topic, limited number of studies, with regards to Energy projects, is available. For instance, dynamic linkage among foreign exchange, stock and money markets studied by Khalid & Rajaguru (2006). They employed three empirical testing techniques to investigate the linkage among Energy projects. The observed indication of Johansen and Juselius cointegration process advocates that there is no long run relationship between stock, money and foreign exchange markets. The results of Granger causality technique support a causal relation from the foreign exchange market to the stock market and from the stock market to the money market, consequently signifying a relationship between the factors. The results of variance decomposition and impulse response analysis are consistent with the Granger causality technique’s results. In order to investigate the linkage between the stock market and foreign exchange market, Qayyum and Kemal (2006) employed the Engle and Granger two-step process and volatility spillover is measured through the Bivariate EGARCH technique. The observed indication from Engle Granger two-step process advocates that there is no long run relationship between the stock market and foreign exchange market. The observed indication of volatility spillover using a Bivariate EGARCH technique reveals that the behavior of both stock market and foreign exchange market are interrelated. The returns of one market are influenced by the volatility of the other market. Especially, stock market returns are very sensitive to the volatility and returns of the forex market. In contrast, forex market returns are mean reverting, and forex market returns are influenced by stock market return’s volatility. There is a strong relationship between the volatility of forex and stock markets returns. They concluded that the volatility spillover takes place from the stock market to the foreign exchange market but not vice-versa. Although a limited number of studies investigated integration of markets. Empirical results of these two studies did not provide integrated relationship between Energy projects. The findings are sometimes doubtful for various markets. Specifically, observed indication of the co-movement of the money market is skeptical with other markets. Normally, we found that these studies use commonly the cointegration technique in a bivariate framework analysis. With these identifiable gaps in these studies our main objective is to investigate the interrelationship among the money market, stock market, and foreign exchange market within the multivariate framework of Johansen and Juselius. Our study also has an important consideration that it covers the period in which Energy projects faced various internal and external syndromes that affected the economic situation of the word.
The primary objective of the study is to investigate whether the public energy projects markets are integrated in Energy projects. To analyze this, co-movement has been estimated among the Public stock prices, exchange rate, and interest rate for the period May 1994 to October 2012. The specific objectives of the study are: To estimate the short run and long run relationship among exchange rate, stock prices and interest rate in Energy projects and moreover to estimate the response of one variable to shock in the other two variables. LITERATURE REVIEW
Numerous causes can be given in the favor of attention given by decision makers and economists on financial integration. Firstly, it is obvious that the macroeconomic guiding principle mix based significantly on the openness of the economic system (Fleming, 1962; Mundell, 1963). Secondly, the higher is the capital mobility, the higher will be the portfolio moves, and the exchange rate will be more volatile, it thus become very difficult to set interest rates independently without taking into account the rest of the world’s interest rates. Lastly, the extent of financial openness is an experimental issue which desires to be determined if decision makers are to be familiar with the constitution of their economies and execute course of actions that will be helpful in attaining their objectives.
American Journal of Management Vol. 15(4) 2015 103

One proposition of financial integration is that the market forces settle on the price of the good or the asset in a well-organized and unbiased way. The level of financial integration would point out whether there are competence returns in the liberalization procedure. Financial integration furthermore provokes amendments in the fundamental economic constitution as well as guiding principle for both commerce and households. These amendments can however frequently formulate financial integration perplexing and complicated, thus it become difficult for a firm to decide especially its behavior in transition, which become more complicated when liberalization of the capital account is being considered. Liberalization of the capital account has been deferred for the reason that global financial integration will motivate capital inflows, persuade appreciation in the real exchange rate, and in this manner lessen global competitiveness (Dornbusch and Park, 1994).
An additional guiding principle that takes place through the examination of markets is the growing significance of overseas interest rates in the structure of domestic interest rates and overseas control of the domestic financial system in general. This sequentially can modify the harmonization of financial cycles. Financial instrument’s prices carry out a significant task in the financial system as they influence marginal evaluations and course of actions thus include future prospects. Since financial security prices across the congregate various shocks that were formerly distinctive should turn out to be general and the impulses they produce should be frequent to the domestic and overseas financial system. The financial system can counter to the identical impulses but the growing instrument of the impulses would revolutionize with internationalization. Financial market integration, consequently, may involve the larger integration of real economies (Brouwer, 1999).
The level of global financial market integration to the highest degree has an effect on the behavior of exchange rate and interest rate, which sequentially has critical implication for the extent to which the local financial powers can put into practice autonomous monetary policies (Agenor, 2001). There is minute disagreement on the suggestion that the higher integrated the global markets for foreign exchange, goods and capital is; the narrower is the extent of chase autonomous local financial policies. For instance, if goods and capital shift around to eradicate the discrepancy between interest rates and stock prices across the word then the local financial system will have no power in their interest. Thus real exchange rates compared to those of other countries will restrict the effect of their stabilization policies. Hence, it is compulsory to take complete account of the probable consequences of global market integration.
It is imperative to decide whether there has been strong financial market integration. It has to be borne in mind that the alike hi-tech novelties that have cemented the method for overseas financial dealings have furthermore augmented the international dispersion of information in real time. For that reason, it might be the situation that the central motivating power at the back of the clear boost in financial market relationships is the globalization of the news that have an effect on the prices of financial assets instead of an elevated level of integration of Energy projects.
Financial market integration at both domestic and worldwide might be examine with reference to equalization of profits on identical financial instruments or it may be observed as identical financial securities moving together. Anderson et al. (2005) discover that financial market integration channel has a strong relationship between various financial securities prices (particularly high-turnover bond and equity prices) in markets of the developed and developing countries. Feldstein and Horioka (1980) and Feldstein (1983) (also see Haque 1990) theory states that if funds have perfect mobility, it may smash the connection among national investment and savings, depending on the situation that the sector can have a loan of adequate finances from abroad in order to cover up decline in its savings. They concluded that portfolio inclination and the factors related to institutional stringencies restrain the transfer of funds at international levels and any increase in local saving are revealed principally in supplementing local investment. Further they also suggested that in a market which is financially integrated at global level, short term transfer of funds plays a crucial role to eliminate interest rate differentials in a short span of time. Later, Taylor (1994) censured this verdict and presented their arguments in support of capital mobility at international levels. Qayyum et al. (2005) made use of similar techniques as discussed in previous studies, tried to explore the integration of the markets of global Energy projects, and reported that capital markets under the analysis were not integrated at global levels. Lane et al. (2006) revealed the
104 American Journal of Management Vol. 15(4) 2015

evidence of gross capital stream as an indicator of the speed of integration in Energy projects. Their focus was on to measure the integration of Energy projects within the context of share in the holding of external assets and liabilities at international levels. They specifically considered and found the evidence in support of asymmetric composition of gross assets and liabilities. The researcher investigated the fact that portfolio investment is a comparatively most important element for markets whereas FDI was considered the most important element for some area. Moosa et al. (1997) scrutinized the level of integration among financial and commodity markets around the world. They found strong evidence in support of high degree of cointegration between financial and goods markets by applying uncovered interest rate parity and ex-ante purchasing power parity for the period of 1980-1994. Gerard et al (2003) studied stock indices include, the US, Japan and Hong Kong while Thailand, Malaysia and Korea. They used inter-temporal capital asset pricing model (ICAPM) for monthly profits of stock markets in terms of dollar and provide some evidence of market segmentation for the period of 1985-1998. DATA AND ECONOMETRIC METHODOLOGY Data
To estimate inter linkages, we use monthly stock prices, exchange rate and interest rate over the period May 1994 to October 2012; a total of 222 observations. The data on stock price index (i.e. KSE-100 index) is obtained from the official website. The data on exchange rate that is Rupees per US dollar and interest rate that is 6-Month T-Bill rate is obtained from the statistical bulletin of State Bank of Energy projects. Index consists of companies chosen based on sector representation and highest market capitalization, which holds more than 80% of the whole market capitalization of the companies listed on those Stock Exchange. The indices are particularly imperative to investigate for the reason that they are broadly used for determining sector performance and financial market agents make use of these indices greater than any others to pursue movements of stock prices. Econometric Methodology
First of all we have analyzed the stationarity properties of the selected variables, for which we have used Augmented Dickey-Fuller unit root test on both level and first difference. To estimates long-run relationship between variables, Johansen and Juselius cointegration test is used in which Trace test and Maximum Eigen-value test are used to find out number of co-integrating vectors. Furthermore, Vector Error-Correction Model is used to estimate the short run relationship among stock prices, exchange rate and interest rate in Energy projects. EMPIRICAL RESULTS & DISCUSSION Preliminary Statistics
Table 3.1 reports the preliminary statistics of the monthly stock prices, exchange rate, and interest rate series. These statistics include mean, median, maximum, minimum, standard deviation, skewness, kurtosis, and Jarque-Bera statistics. (Tableau-3.1 Preliminary Statistics of Variables). As we can see from the above preliminary statistics, the data is not normally distributed. Furthermore, all three variables illustrate skewness. Stock price series with a standard deviation of 0.904187 shows a positive skewness, which means that data is skewed in the right direction. Interest rate series with a standard deviation of 3.995497 shows a negative skewness, which means that data is skewed in the left direction. Exchange rate series with a standard deviation of 0.284970 shows a negative skewness, which means that data is skewed in the left direction. Kurtosis values of all series also prove that the data is not normally distributed for the reason that values of excess kurtosis are not zero. The Jarque-Bera statistic is applied to test the null hypothesis that the data is from a normal distribution. This null hypothesis refers to a combined hypothesis of both the skewness and excess kurtosis that is to say skewness=excess kurtosis=0.
American Journal of Management Vol. 15(4) 2015 105

As skewness and excess kurtosis for stock prices, exchange rate and interest rate volatility are far from zero; Jarque-Bera statistics for stock prices, exchange rate, and the interest rate are respectively 22.19780, 7.966447, and 10.9532 which evidently illustrates the non-normality of distribution. Correlation Analysis
Correlation matrix gives an idea of linear association among the variables. For a preliminary analysis of integration among markets, we initiate through investigation of correlation coefficients between stock prices, exchange rate, and interest rate. Results in Table 3.2 show that the correlation between indicators of different energy projects is statistically significant, which is an indicator of financial integration among these markets. (Table 3.2 Correlation of the Tested Variables). As we can see from the above table, exchange rate has a positive and significant relationship with stock prices while negative and significant relationship with interest rate. The interest rate has a negative but statistically insignificant relationship with stock prices. Correlation analysis, however, is not appropriate technique as it captures only linear association and gives spurious picture when variables under consideration follow Random Walk. We therefore estimated the integration using more sophisticated cointegration techniques namely the Engle and Granger and Johansen and Juselius. Econometric Estimation and Empirical Results
In this portion, we execute econometric tests to find out whether or not the three Energy projects are interconnected. Unit Root Test
We start our analysis by testing for the presence of unit root among the Energy projects using Augmented Dickey-Fuller (ADF) test. The ADF test results in table 4.3 illustrate that all these series are non-stationary at conventional levels of significance. However, the null hypothesis of non-stationary is rejected at the 1% level of significance when the variables are differentiated once. From Table 3.3, ADF test demonstrate that all series are integrated of order one, I(1) point out ADF test consistence. (Table 3.3 ADF Unit Root Test at Level and First Difference).
These results necessitate the use of cointegration techniques to test for the market integration among the variables in the long run and for short run dynamics the variables can be modeled as Vector Error Correction Model. Co Integration Analysis Engle-Granger Test
The long run relationship among the stock prices, exchange rate, and the interest rate is examined by employing Engle and Granger two-step method. In the first step the stock prices are regressed on the foreign exchange rate and interest rate and the results are presented below (t-statistics are in parentheses).
LSPt = 21.45 + 0.032 T – 4.13 LERt – 0.006 Irt (3.1) (45.12) (48.80) (–30.84) (–1.63) R-squared= 0.96, F-statistic=1431.82, ADF= –5.16 (–2.28)
Outcomes of the above equation (3.1) demonstrate that both intercept and trend are significantly
different from zero. The effect of exchange rate on stock prices is negative and statistically significant at 1% level. The effect of interest rate is negative but significant only at 10% level. However, our main focus here is not on the first step results; rather we go for second step as the prime objective here is to test market integration in which direction of causality is not important. Moreover if the residuals from this
106 American Journal of Management Vol. 15(4) 2015

equation are found non-stationary then results of 3.1 are spurious. As a second step we tested the existence of cointegrating relationship among the three variables by employing the ADF unit root test on the residual series obtained from the equation (3.1). The results are presented in table 3.4, which show that, there is no unit root in the residual series. This entails that the three variables under consideration are cointegrated. (Table-4.4 Engle and Granger Cointegration Test) Johansen and Juselius Test
Subsequently, we investigate cointegration among the Energy projects using the framework of Johansen and Juselius. We discover that there is at most one cointegrating vector among the three variables. The results presented in Table 3.5 based on both the Trace test and the Maximum Eigenvalue test, support long-run relationships between the three variables, which is an indication of market integration. (Table-4.5 Johansen and Juselius Cointegration Test). Vector Error Correction Model Results in Table 4.6 show, ECMt-1 is significant indicating log-run equilibrium relationship among three variables. If there is an error in the equilibrium in the short run then 16% of the errors are corrected by stock prices series, 1% by exchange rate, and almost 51% by interest rate, in one period. Results also show that there is inertia in the stock prices, exchange rate, and interest rate. Moreover, it is found that, in the short run, exchange rate and interest rate do not affect stock prices and similarly stock prices and interest rate do not affect exchange rate. However, exchange rate significantly affects interest rate in the short run. (Table-3.6 Results of Vector Error Correction Model). Impulse Response Functions
The impulse response functions are presented in Figure 3.2. Impulse response function is an analysis which exhibits the dynamics of the variables representing the response of each variable to a particular shock. Summarizing it, the impulse response function traces the effect of one-standard-deviation shock in a variable on current and future values of the endogenous variables in the system. The detailed results in table form are given in Table-A1 in the appendix. (Figure-3.2 Impulse Response to One S.D. Innovations). It is shown in the figure that stock prices respond negatively to shocks in interest rate and exchange rate. The effect starts after one period of the shock and die out to zero in third period. The effect of exchange rate is however more long lasting. The effect of stock prices on exchange rate is also negative; it starts immediately and becomes insignificant after third period. The exchange rate series does not respond to shocks in interest rate. Interest rate responds negatively to changes in stock prices and positively to exchange rate; the effect becomes insignificant in the fourth period. Variance Decomposition
The Variance Decomposition demonstrates the percentage of forecast error variance for each variable that is attributable to its own innovation/shocks and to innovations in the other endogenous variables. Forecast error variance decomposition, presents complementary information on the dynamic behavior of the variables in the system. It is possible to decompose the forecast error variance into the contributions by each of the different shocks. The results in table 3.7 indicate that almost 97% of the variation in stock prices is caused by its own lags, even after 12 months and remaining 3% is evenly distributed between exchange rate and interest rate. Same magnitude of inertia is found in exchange rate series and stock prices contribute more variation in exchange rate than the interest rate do. Interest rate explains 87% variation in itself, 11% variation in interest rate is explained by exchange rate, and remaining 2% variation in interest rate is explained by Stock prices. (Table-3.7 Variance Decomposition).
American Journal of Management Vol. 15(4) 2015 107

CONCLUSION AND RECOMMENDATIONS
This study investigates the integration of Public stock, foreign exchange, and money markets over the period May 1994 to October 2012. Both Engle and Granger, and Johansen and Juselius cointegration techniques are used to estimate long run relationship while short run dynamics are modeled in Vector Error Correction Model. The empirical results from both Engle and Granger and Johansen and Juselius cointegration analysis demonstrate that the three bank markets sector are cointegrated for the time under consideration. The empirical results from Error Correction Model indicate log-run equilibrium relationship among three variables. If there is an error in the equilibrium in the short run then 16% of the errors are corrected by stock prices series, 1% by exchange rate, and almost 51% by interest rate, in one period. Results also show that there is inertia in the stock prices, exchange rate, and interest rate. Moreover, it is found that, in the short run, exchange rate and interest rate do not affect stock prices and similarly stock prices and interest rate do not affect exchange rate. However, exchange rate significantly affects interest rate in the short run.
Empirical findings from impulse response functions show that stock prices respond negatively to shocks in interest rate and exchange rate. The effect starts after one period of the shock and die out to zero in third period. The effect of exchange rate is however more long lasting. The effect of stock prices on exchange rate is also negative; it starts immediately and becomes insignificant after third period. The exchange rate series does not respond to shocks in interest rate. Interest rate responds negatively to changes in stock prices and positively to exchange rate; the effect becomes insignificant in the fourth period.
The variance decomposition results indicate that almost 97% of the variation in stock prices is caused by its own lags, even after 12 months and remaining 3% is evenly distributed among exchange rate and interest rate. Same magnitude of inertia is found in exchange rate series and stock prices contribute more variation in exchange rate than the interest rate do. Interest rate explains 87% variation in itself and 11% variation in interest rate is explained by exchange rate. Stock prices do not contribute in the variation of interest rate.
Thus, the public energy projects offer lower diversification possibilities for inter-sector diversification. The empirical findings based on impulse response functions and forecast error variance decomposition analysis shows that variation in each market is mostly explained by its own lag. POLICY IMPLICATIONS AND FUTURE DIRECTIONS
This is a significant outcome and could have imperative policy implications. Such as, policy makers, whilst making a decision on internal policy should be vigilant of the implications of their decision. On the backside, policy makers could take a priori measure in one of the markets (e.g. exchange rate) if an external shock is forthcoming and expected to hit a market (e.g. stock prices).This study highlighted some key issues for future research taking into consideration the Public Investment market integration. One can test the integration of public energy projects with that of its trading partners and neighboring sector. One can also work further on this study using other techniques like Principle-Component Analysis and ARDL methodology. A clear extension to our study would be to use a non-linear model like GARCH to capture spillover from one market to others. One can also investigate for structural breaks in this relationship dividing the whole sample period in various sub-periods. REFERENCES Agenor, P.R., (2001). Benefits and costs of international financial integration: theory and facts. World
Bank Working Paper.
108 American Journal of Management Vol. 15(4) 2015

Andersen, Palle and Ramon Moreno (2005).Financial Integration: An Overview. Bank of International Settlement, 23.
Brouwer, G. (1999). Financial Integration in East Asia. Cambridge: Cambridge University Press. Dornbusch, R. and T.C. Park, (1994). Financial integration in a Second Best World: Are we still sure
about our classical prejudices? Policy issue series, 94-1, February (Korea Institute of Finance). Feldstein, M. and Horoika, C., (1980). Domestic saving and international capital flows. Economic
Journal, 314-329. Feldstein, M., (1983). Domestic savings and international capital movements in the long-run and the
short-run. European Economic Review, 139-151. Fleming, J.M., (1962). Domestic financial policies under fixed and floating exchange rates. IMF staff
papers, Vol 9(3), 369-379. Gerard, B., K. Thanyalakpark, J. A. Batten (2003), “Are the Global Markets Integrated? Evidence from
the ICAPM”, Journal of Economics and Business, 55, 585–607. Haque, N. U. and Peter Montiel (1990). Capital Mobility in Developing Countries: Some Empirical Tests.
IMF Working Paper, No. WP/90/117. Khalid, Ahmed M. and Gulasekaran Rajaguru (2006). Financial Market Contagion: Evidence from Global
Crisis Using a Multivariate GARCH Model. Paper presented at the Global Finance Association Conference, Auckland, New Zealand, July.
Lane, Philip R. and Sergio L. Schmukler (2006). The International Financial Integration of China and India. World Bank, Paper was part of a broader project at the IMF-World Bank Annual Meeting in Singapore.
Moosa, I and R. Bhatti, (1997).Are Global markets integrated? Evidence for six countries vis-à-vis Japan. International Economic Journal, Vol 11(1), 51-67.
Mundell, R.A., (1963). Capital Mobility and Stabilization Policy under Fixed and Flexible Exchange Rates. Canadian Journal of Economics, 29, 475-485.
Obstfeld, M. (1994). Risk-taking, Global Diversification and Growth. American Economic Review, 84, 1310-1329.
Qayyum, Abdul and A. R. Kemal (2006). Volatility Spillover between Stock Market and Forex Market in Energy projects. PIDE Seminar, October.
Qayyum, Abdul and Mohsin, H (2005). The Integration of Energy projects: Empirical Evidence from South Global Countries. MPRA Paper No. 2364, posted 2007, available at http://mpra.ub.unimuenchen.de/2364/
Taylor, Alan M. (1994). Domestic Saving and International Capital Flows Reconsidered. National Bureau of Economic Research, Working Paper, No. 4892.
American Journal of Management Vol. 15(4) 2015 109

APPENDIX
TABLE A1 IMPULSE RESPONSE TO CHOLESKY (D.F. ADJUSTED) ONE S.D. INNOVATIONS
110 American Journal of Management Vol. 15(4) 2015

TABLE 1 PRELIMINARY STATISTICS OF VARIABLES
LER LSP IR
Mean 3.9915 8.1378 9.9555
Median 4.0712 7.732896 10.94000
Maximum 4.454386 9.624163 17.42000
Minimum 3.420673 6.735424 1.210000
Std. Dev. 0.284970 0.904187 3.995497
Skewness -0.436428
0.22441 -0.554652
Kurtosis 2.570312 1.439257 2.688391
Jarque-Bera 7.966447* 22.19780* 10.9532*
*indicates significance at 5% level.
As we can see from the above preliminary statistics, the data is not normally distributed. Furthermore, all three variables illustrate skewness. Stock price series with a standard deviation of 0.904187 shows a positive skewness, which means that data is skewed in the right direction. Interest rate series with a standard deviation of 3.995497 shows a negative skewness, which means that data is skewed in the left direction. Exchange rate series with a standard deviation of 0.284970 shows a negative skewness, which means that data is skewed in the left direction. Kurtosis values of all series also prove that the data is not normally distributed for the reason that values of excess kurtosis are not zero. The Jarque-Bera statistic is applied to test the null hypothesis that the data is from a normal distribution. This null hypothesis refers to a combined hypothesis of both the skewness and excess kurtosis that is to say skewness=excess kurtosis=0. As skewness and excess kurtosis for stock prices, exchange rate and interest rate volatility are far from zero; Jarque-Bera statistics for stock prices, exchange rate, and the interest rate are respectively 22.19780, 7.966447, and 10.9532 which evidently illustrates the non-normality of distribution.
TABLE 3.2 CORRELATION COEFFICIENTS OF THE TESTED VARIABLES
LSP LER IR
LSP 1
LER 0.636** 1
IR -0.095 -0.147* 1
*Indicate Significant at the 1% level **Indicate Significant at the 5% level
American Journal of Management Vol. 15(4) 2015 111
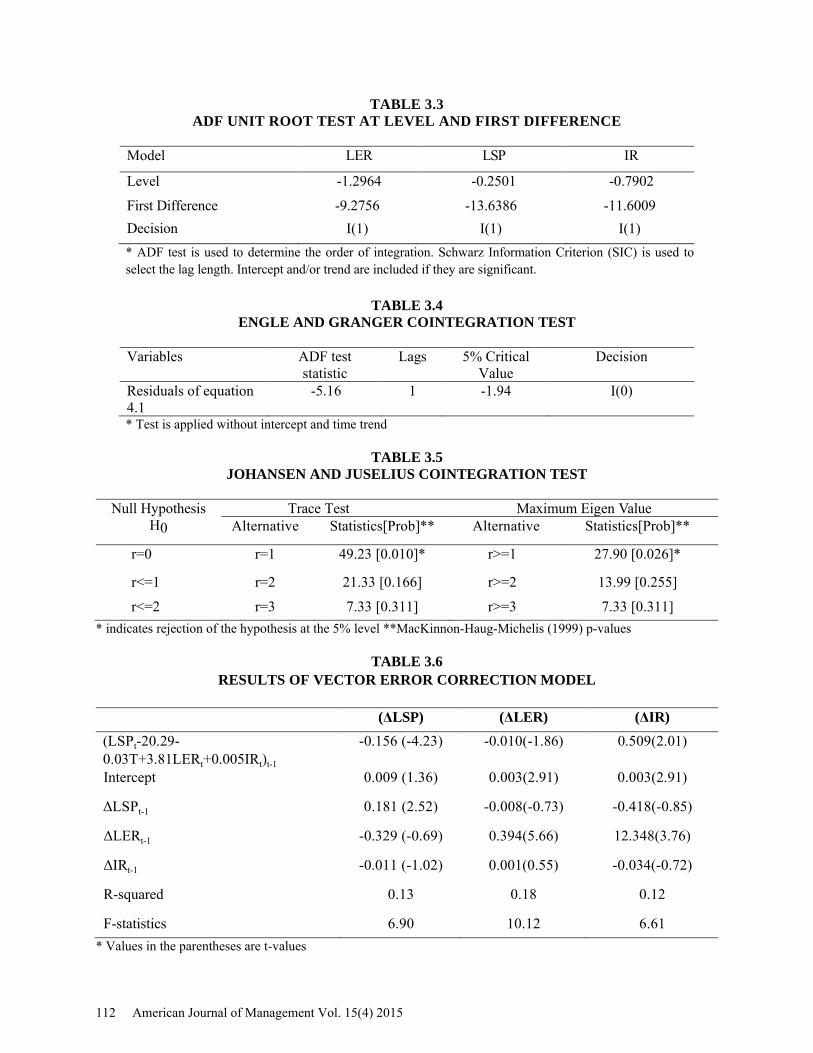
TABLE 3.3 ADF UNIT ROOT TEST AT LEVEL AND FIRST DIFFERENCE
Model LER LSP IR Level -1.2964 -0.2501 -0.7902 First Difference -9.2756 -13.6386 -11.6009 Decision I(1) I(1) I(1) * ADF test is used to determine the order of integration. Schwarz Information Criterion (SIC) is used to select the lag length. Intercept and/or trend are included if they are significant.
TABLE 3.4
ENGLE AND GRANGER COINTEGRATION TEST
Variables ADF test statistic
Lags 5% Critical Value
Decision
Residuals of equation 4.1
-5.16 1 -1.94 I(0)
* Test is applied without intercept and time trend
TABLE 3.5 JOHANSEN AND JUSELIUS COINTEGRATION TEST
Null Hypothesis
H0 Trace Test Maximum Eigen Value
Alternative Statistics[Prob]** Alternative Statistics[Prob]**
r=0 r=1 49.23 [0.010]* r>=1 27.90 [0.026]*
r<=1 r=2 21.33 [0.166] r>=2 13.99 [0.255] r<=2 r=3 7.33 [0.311] r>=3 7.33 [0.311]
* indicates rejection of the hypothesis at the 5% level **MacKinnon-Haug-Michelis (1999) p-values
TABLE 3.6 RESULTS OF VECTOR ERROR CORRECTION MODEL
(ΔLSP) (ΔLER) (ΔIR) (LSPt-20.29-0.03T+3.81LERt+0.005IRt)t-1
-0.156 (-4.23) -0.010(-1.86) 0.509(2.01)
Intercept 0.009 (1.36) 0.003(2.91) 0.003(2.91)
ΔLSPt-1 0.181 (2.52) -0.008(-0.73) -0.418(-0.85)
ΔLERt-1 -0.329 (-0.69) 0.394(5.66) 12.348(3.76)
ΔIRt-1 -0.011 (-1.02) 0.001(0.55) -0.034(-0.72)
R-squared 0.13 0.18 0.12
F-statistics 6.90 10.12 6.61 * Values in the parentheses are t-values
112 American Journal of Management Vol. 15(4) 2015

FIGURE 3.2 IMPULSE RESPONSE TO ONE S.D. INNOVATIONS
-.02
.00
.02
.04
.06
.08
.10
1 2 3 4 5 6 7 8 9 10 11 12
D(LSP) D(LER) D(IR)
Response of D(LSP) to CholeskyOne S.D. Innovations
-.004
.000
.004
.008
.012
.016
1 2 3 4 5 6 7 8 9 10 11 12
D(LSP) D(LER) D(IR)
Response of D(LER) to CholeskyOne S.D. Innovations
-.1
.0
.1
.2
.3
.4
.5
.6
.7
1 2 3 4 5 6 7 8 9 10 11 12
D(LSP) D(LER) D(IR)
Response of D(IR) to CholeskyOne S.D. Innovations
American Journal of Management Vol. 15(4) 2015 113

TABLE 3.7 VARIANCE DECOMPOSITION
(a) Variance Decomposition of D(LSP):
Period S.E. D(LSP) D(LER) D(IR) 1 2 3 4 5 6 7 8 9
10 11 12
0.092183 0.093947 0.094275 0.094345 0.094358 0.094361 0.094361 0.094361 0.094361 0.094361 0.094361 0.094361
100.0000 97.61009 97.01846 96.89167 96.86717 96.86247 96.86157 96.86140 96.86136 96.86136 96.86136 96.86136
0.000000 0.876876 1.424085 1.549959 1.574431 1.579117 1.580017 1.580190 1.580223 1.580230 1.580231 1.580231
0.000000 1.513038 1.557459 1.558370 1.558403 1.558410 1.558412 1.558412 1.558412 1.558412 1.558412 1.558412
(b) Variance Decomposition of D(LER): Period S.E. D(LSP) D(LER) D(IR) 1 2 3 4 5 6 7 8 9
10 11 12
0.012976 0.013966 0.014133 0.014165 0.014171 0.014172 0.014172 0.014172 0.014172 0.014172 0.014172 0.014172
1.003093 2.240139 2.479758 2.523608 2.531888 2.533475 2.533780 2.533839 2.533850 2.533853 2.533853 2.533853
98.99691 97.73334 97.46417 97.41302 97.40331 97.40145 97.40109 97.40103 97.40101 97.40101 97.40101 97.40101
0.000000 0.026518 0.056077 0.063372 0.064800 0.065073 0.065126 0.065136 0.065138 0.065138 0.065138 0.065138
(c) Variance Decomposition of D(IR): Period S.E. D(LSP) D(LER) D(IR) 1 2 3 4 5 6 7 8 9
10 11 12
0.611628 0.640396 0.646218 0.647310 0.647517 0.647557 0.647565 0.647566 0.647567 0.647567 0.647567 0.647567
0.843859 1.176285 1.334425 1.370148 1.377104 1.378437 1.378693 1.378742 1.378752 1.378754 1.378754 1.378754
1.857372 9.471497 10.89471 11.14993 11.19802 11.20725 11.20902 11.20936 11.20943 11.20944 11.20944 11.20944
97.29877 89.35222 87.77087 87.47993 87.42487 87.41432 87.41229 87.41189 87.41182 87.41180 87.41180 87.41180
Cholesky Ordering: D(LSP) D(LER) D(IR)
114 American Journal of Management Vol. 15(4) 2015