Quality control ppt BIOCHEMISTRY
44
QUALITY CONTROL Dr. Vijay Marakala MD OL.
-
Upload
vijaya-marakala -
Category
Health & Medicine
-
view
5.760 -
download
45
description
Transcript of Quality control ppt BIOCHEMISTRY
QUALITY CONTROL Dr. Vijay Marakala MD
QUALITY CONTROL. QUALITY CONTROL.
Quality management
Quality assurance
Quality control
Three principles of clinical lab

What is Quality?
Quality defined as conformance to the
requirements of users or customers
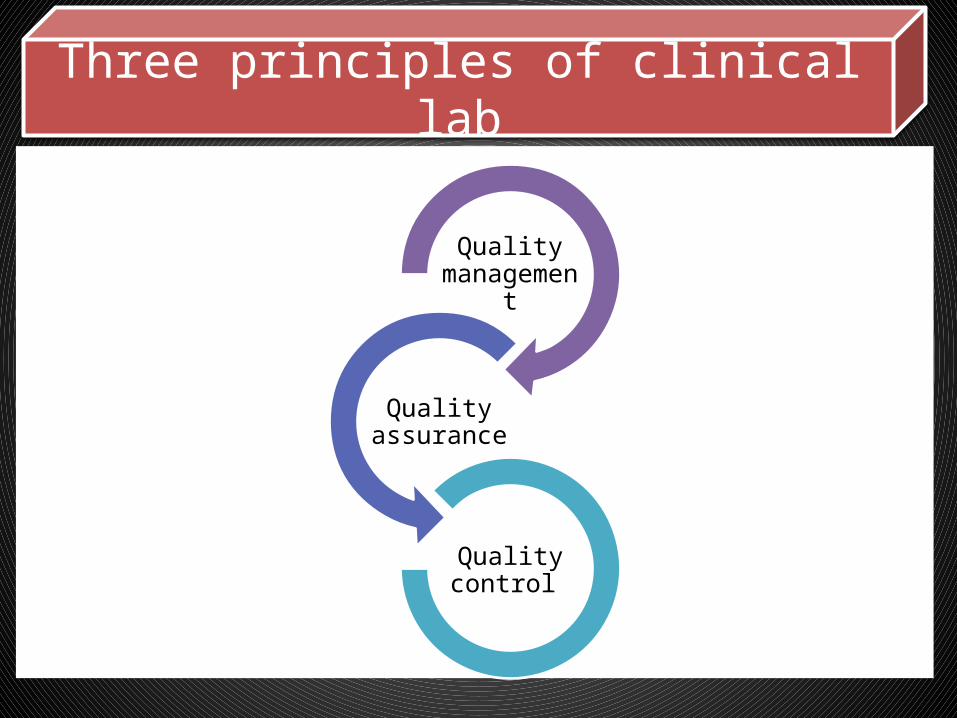
Total quality management of the clinical lab
Quality planning
Quality lab process
Quality control
Quality assessment
Quality improvemen
t
Quality Control
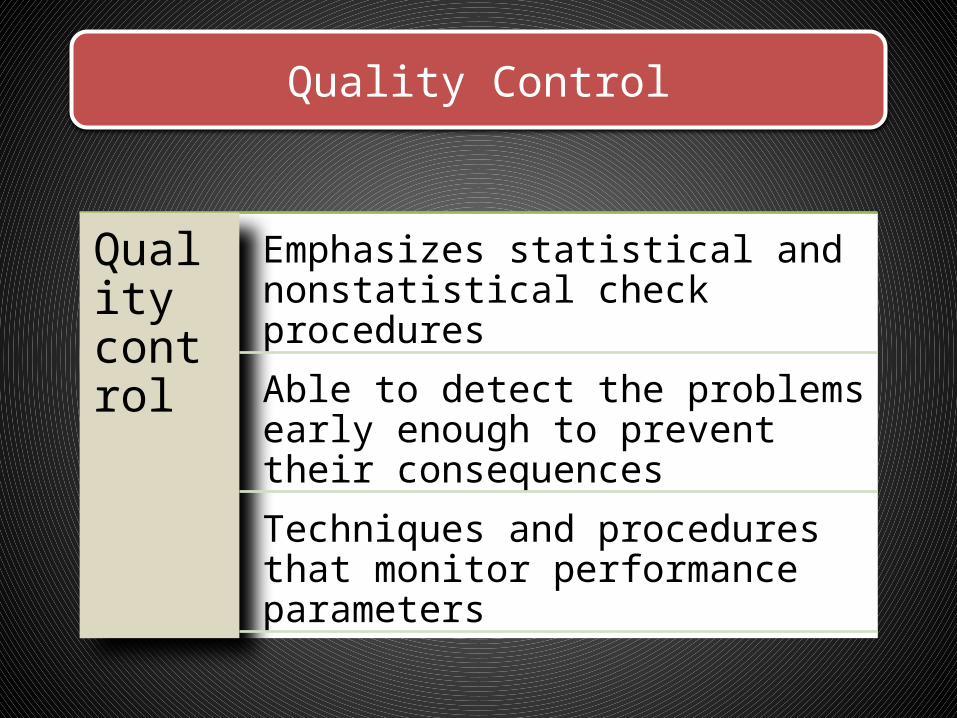
Quality control
Emphasizes statistical and nonstatistical check procedures
Able to detect the problems early enough to prevent their consequences
Techniques and procedures that monitor performance parameters
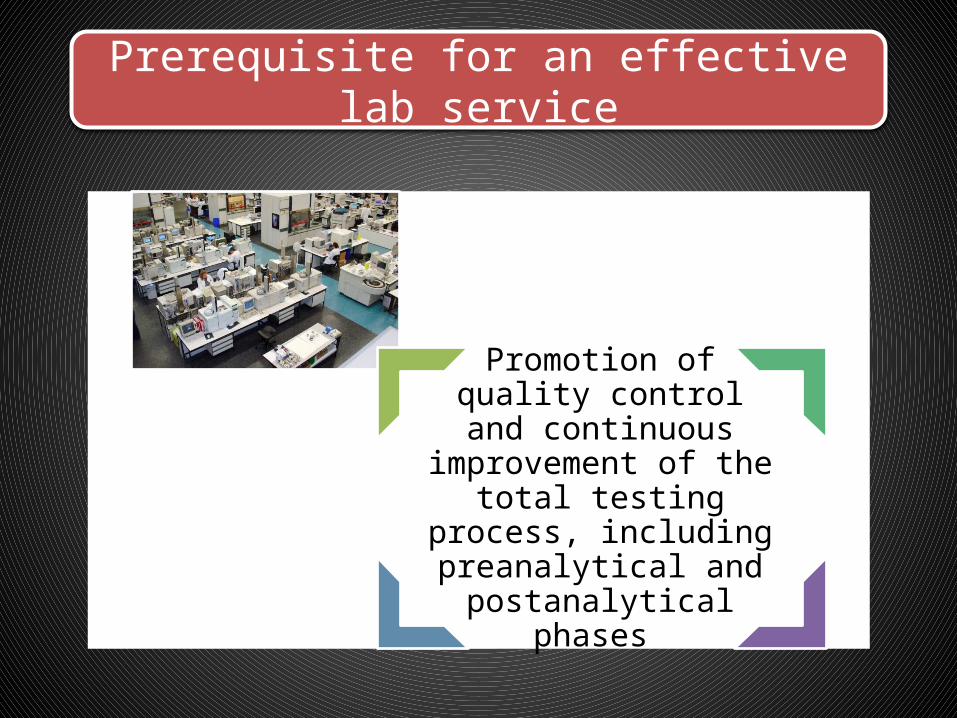
Prerequisite for an effective lab service
Promotion of quality control and continuous
improvement of the total testing process, including
preanalytical and postanalytical phases
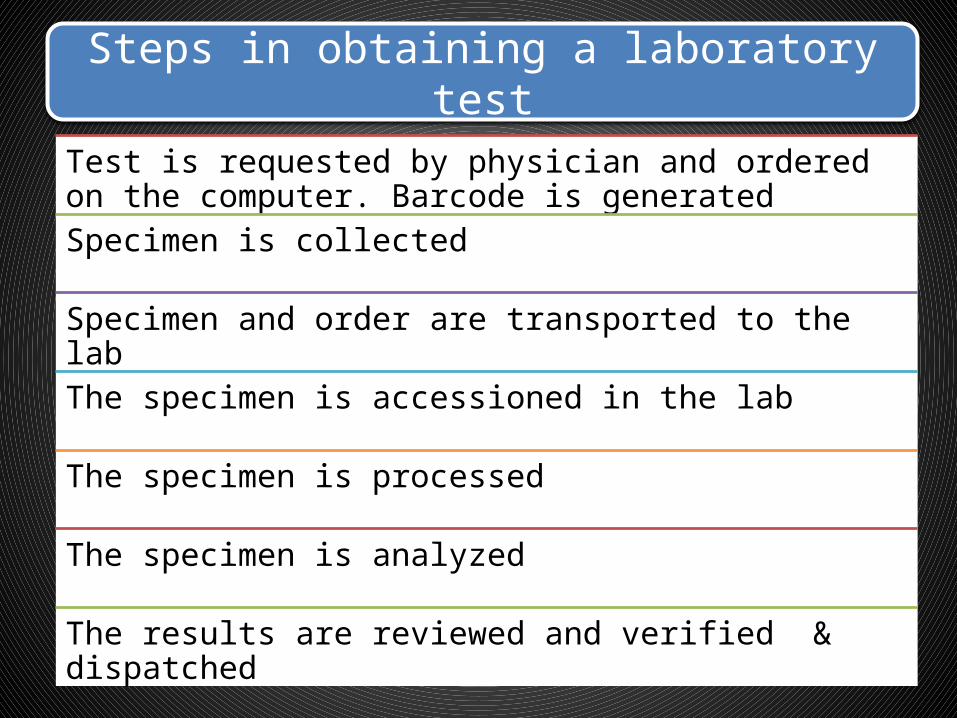
Test is requested by physician and ordered on the computer. Barcode is generated Specimen is collected
Specimen and order are transported to the lab
The specimen is accessioned in the lab
The specimen is processed
The specimen is analyzed
The results are reviewed and verified & dispatched
Steps in obtaining a laboratory test
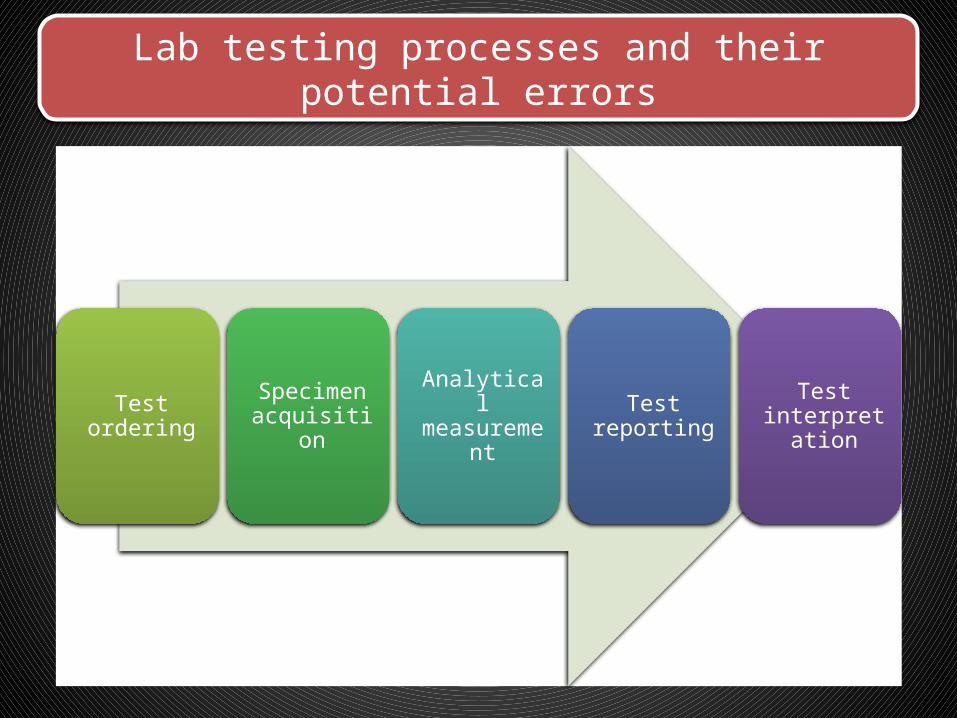
Lab testing processes and their potential errors
Test ordering Specimen acquisition
Analytical measuremen
t
Test reporting
Test interpretatio
n
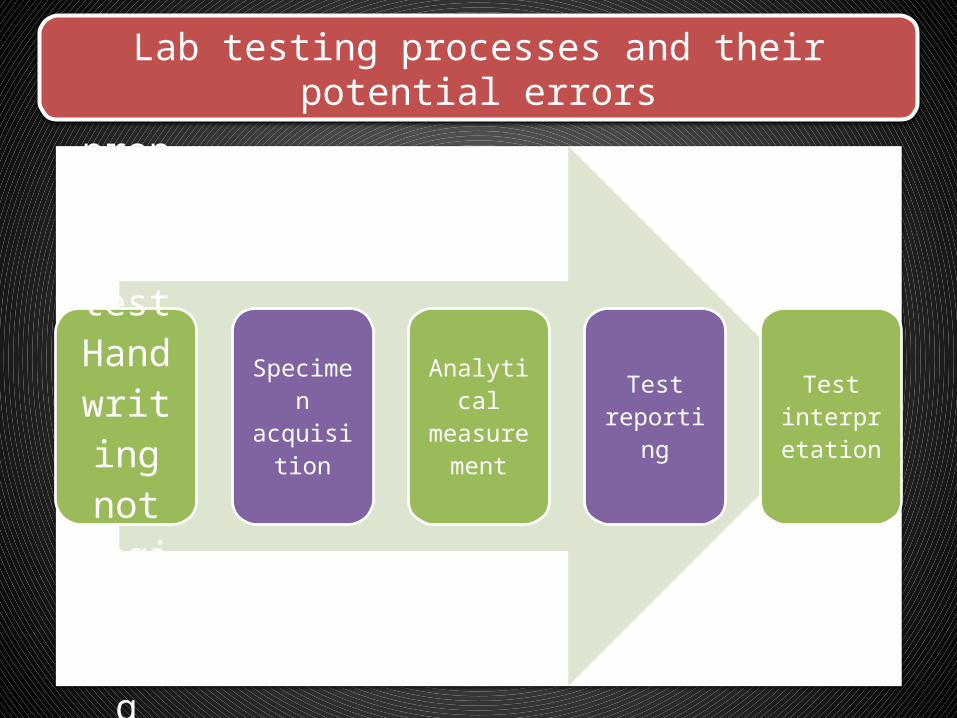
Test ordering
Inappropriate testHandwriting not
legibleWrong patien
t identificatio
n
Specimen acquisition
Analytical measurem
entTest
reportingTest
interpretation
Lab testing processes and their potential errors
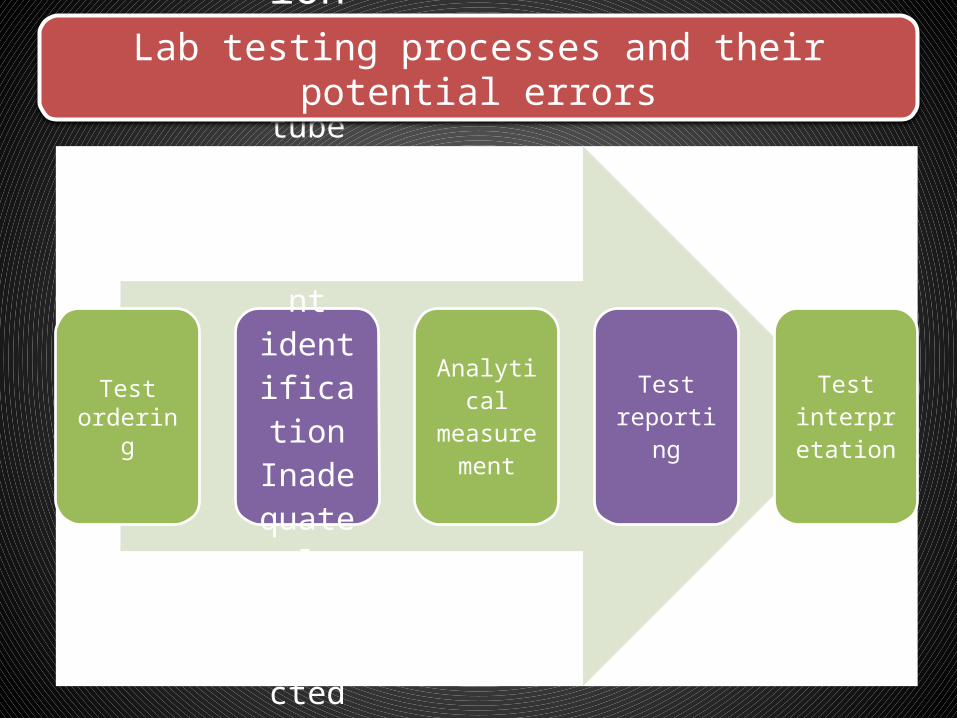
Test ordering
Specimen acquisitionIncorrect tube
Incorrect
patient identific
ationInadequ
ate volumeCollecte
d at wrong time
Improper
transport
conditions
Analytical measurem
entTest
reportingTest
interpretation
Lab testing processes and their potential errors

Test ordering
Specimen acquisition
Analytical
measurement
Instrument not calibrat
ed correctl
ySpecimen mix-
upIncorre
ct volume
of specim
enInterferi
ng substan
ce presentInstrum
ent precisio
n proble
m
Test reporting
Test interpreta
tion
Lab testing processes and their potential errors
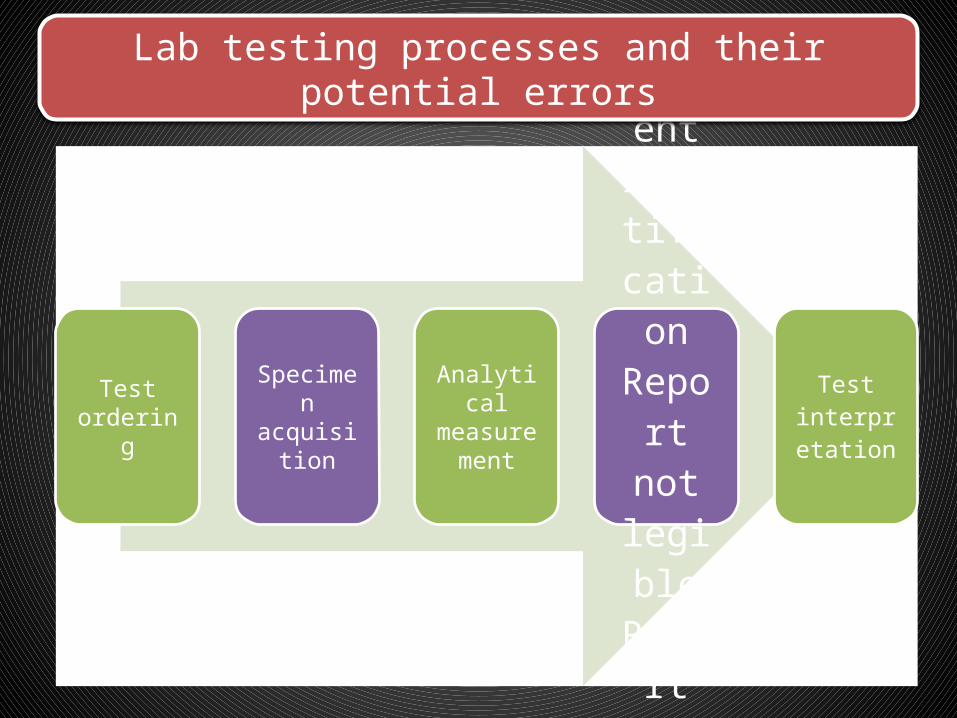
Test ordering
Specimen acquisition
Analytical measurem
ent
Test reporting
Wrong patient identificationReport
not legibleReport delaye
dTranscription error
Test interpreta
tion
Lab testing processes and their potential errors
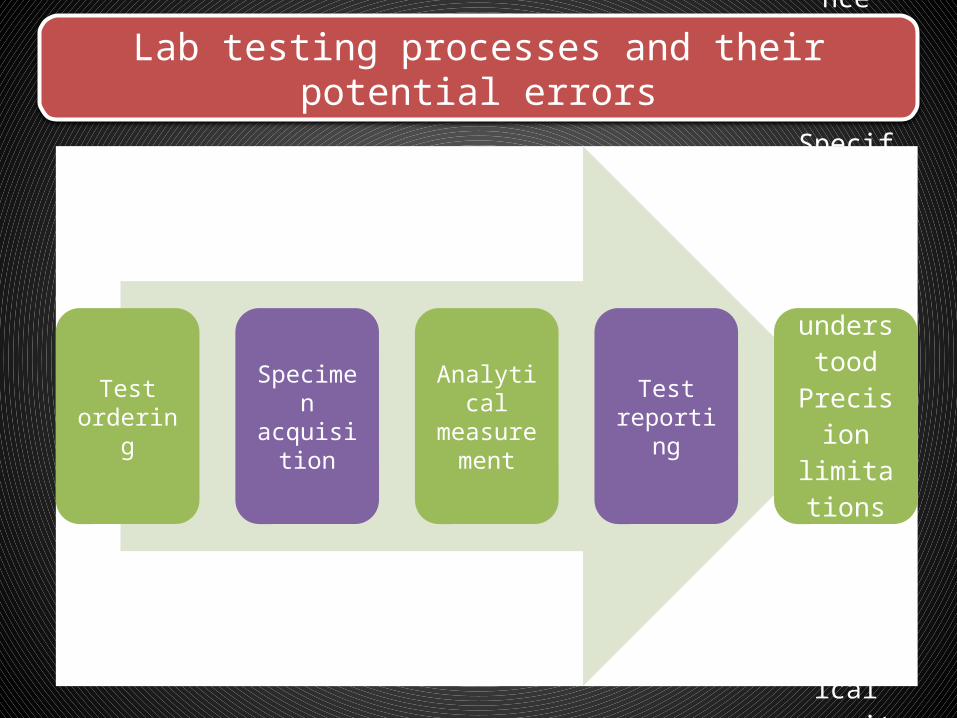
Test ordering
Specimen acquisition
Analytical measurem
ent
Test reporting
Test interpretationInterferin
g substance
not recognize
dSpecificity
of the test not
understood
Precision limitation
s not recognize
dAnalytical sensitivity
not appropria
tePrevious
values not
available for
comparison
Lab testing processes and their potential errors
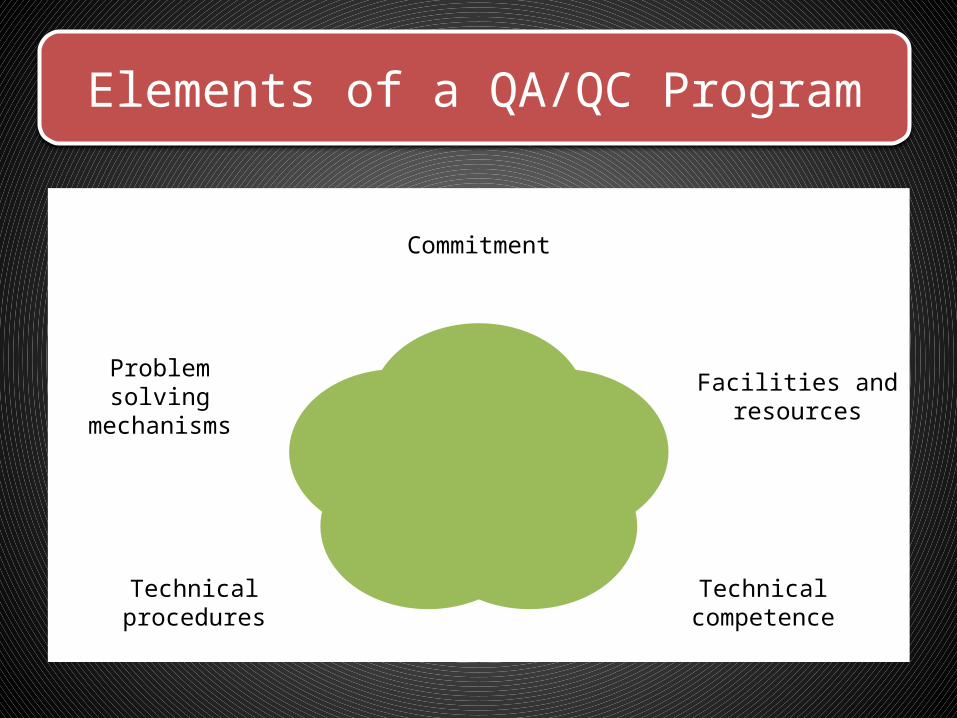
Elements of a QA/QC Program
Commitment
Facilities and resources
Technical competenceTechnical procedures
Problem solving mechanisms
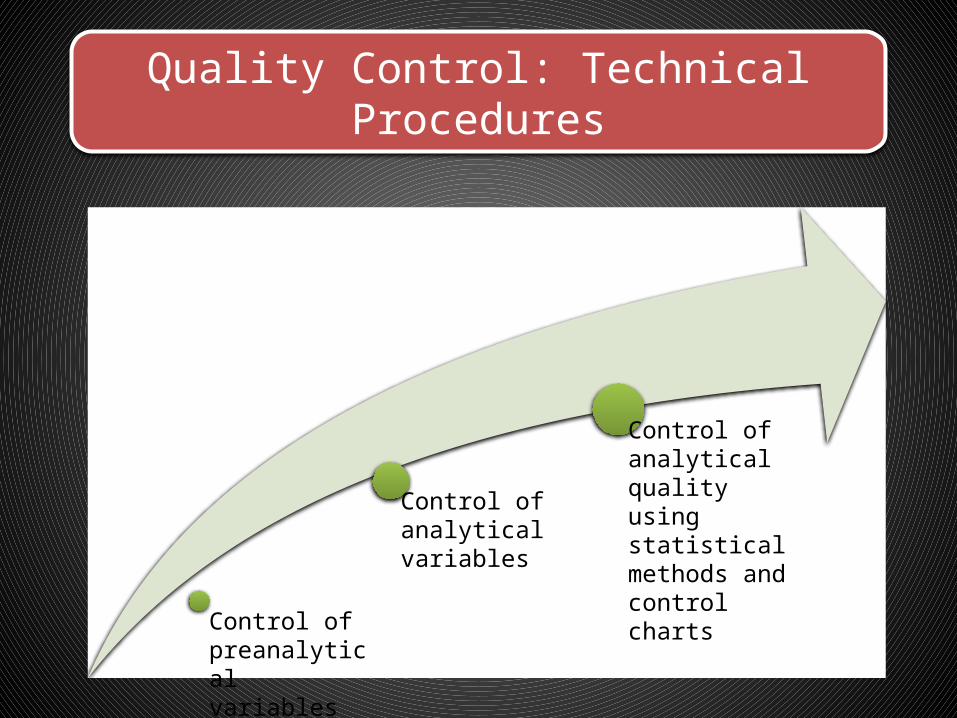
Quality Control: Technical Procedures
Control of preanalytical variables
Control of analytical variables
Control of analytical quality using statistical methods and control charts

Test requests
Patient preparation
Patient identification
Specimen acquisition
Control of preanalytical variables
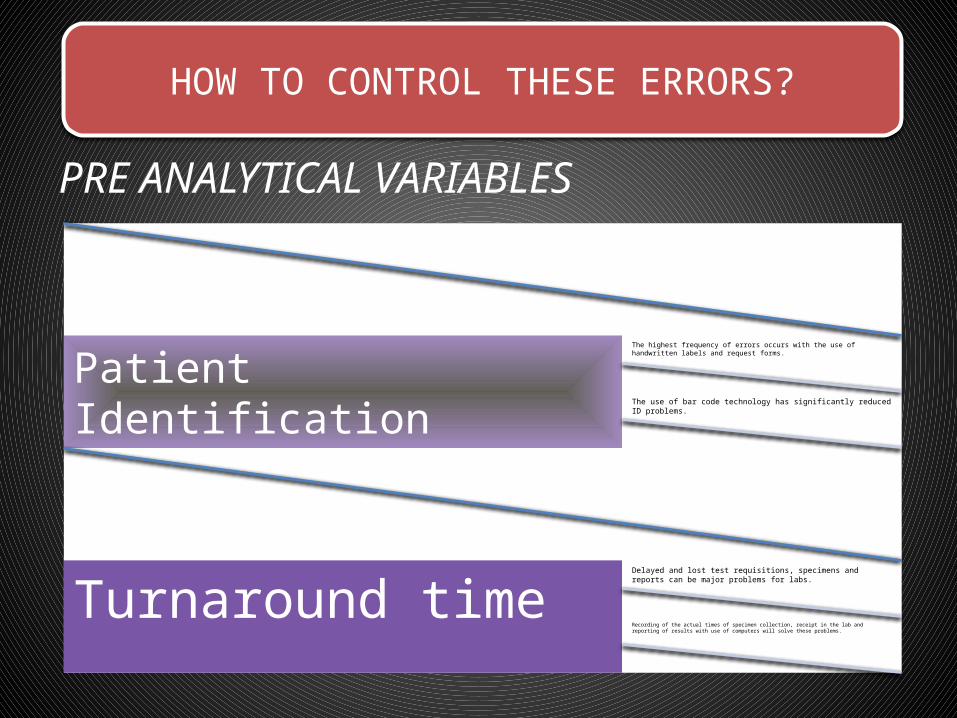
HOW TO CONTROL THESE ERRORS?
Patient Identification The highest frequency of errors occurs with the use of handwritten labels and request forms.
The use of bar code technology has significantly reduced ID problems.
Turnaround timeDelayed and lost test requisitions, specimens and reports can be major problems for labs.
Recording of the actual times of specimen collection, receipt in the lab and reporting of results with use of computers will solve these problems.
PRE ANALYTICAL VARIABLES

HOW TO CONTROL THESE ERRORS?
PRE ANALYTICAL VARIABLES
Transcription error Manual entry of data even with the double checking of results
Computerization will reduce this type of transcription error.
Patient preparation Lab tests are affected by many factors, such as, recent intake of food, alcohol, or drugs; smoking, exercise, stress, sleep, posture during specimen collection
The lab must define the instructions and procedures compliance with these instructions can be monitored directly efforts should be made to correct non compliance
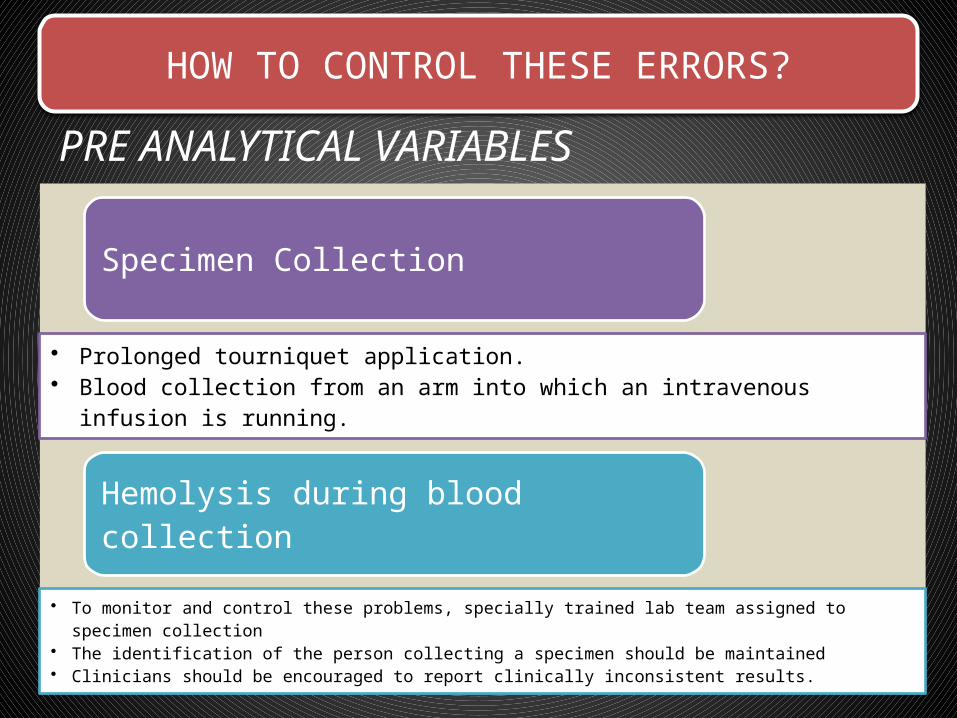
HOW TO CONTROL THESE ERRORS?
PRE ANALYTICAL VARIABLES
Specimen Collection
• Prolonged tourniquet application. • Blood collection from an arm into which an intravenous infusion is running.
Hemolysis during blood collection
• To monitor and control these problems, specially trained lab team assigned to specimen collection
• The identification of the person collecting a specimen should be maintained • Clinicians should be encouraged to report clinically inconsistent results.
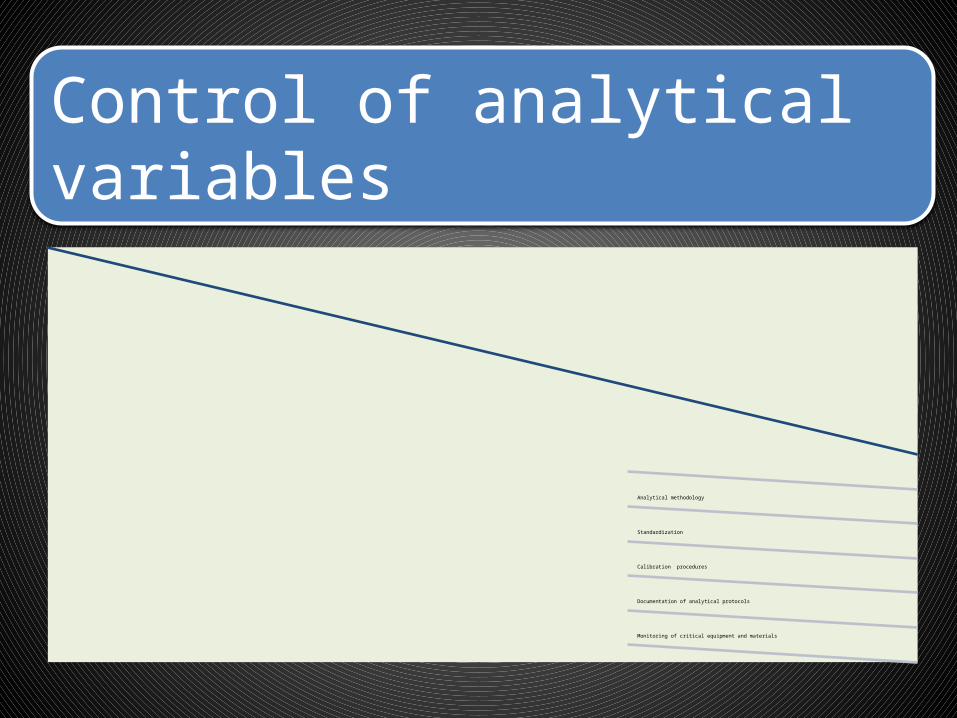
Analytical methodology
Standardization
Calibration procedures
Documentation of analytical protocols
Monitoring of critical equipment and materials
Control of analytical variables
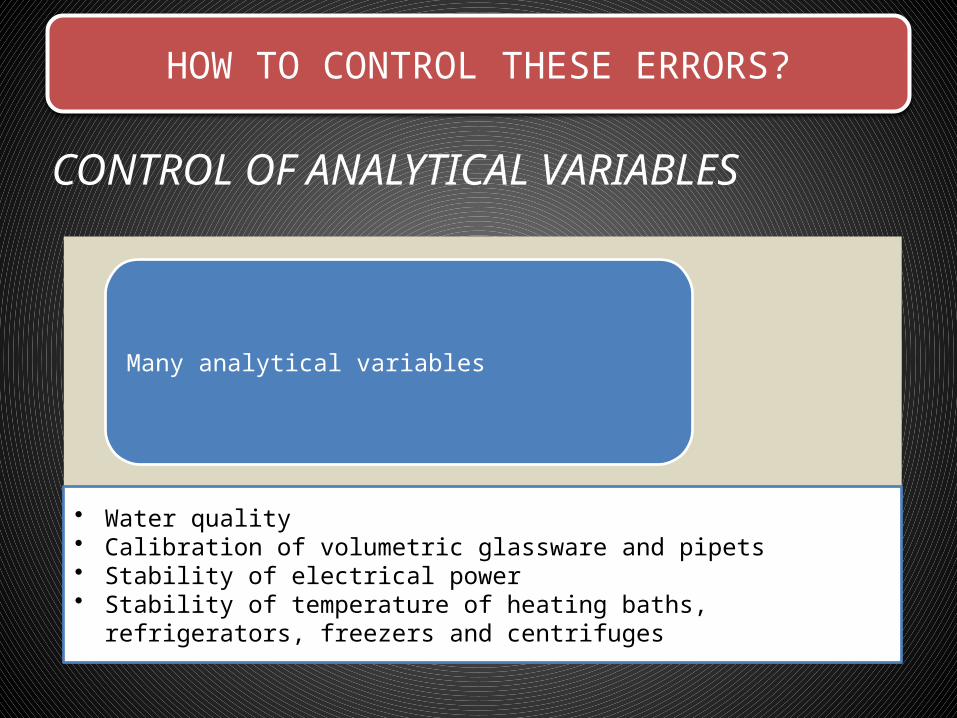
HOW TO CONTROL THESE ERRORS?
CONTROL OF ANALYTICAL VARIABLES
Many analytical variables
• Water quality• Calibration of volumetric glassware and pipets• Stability of electrical power• Stability of temperature of heating baths, refrigerators, freezers and centrifuges
HOW TO CONTROL THESE ERRORS?
CONTROL OF ANALYTICAL VARIABLES
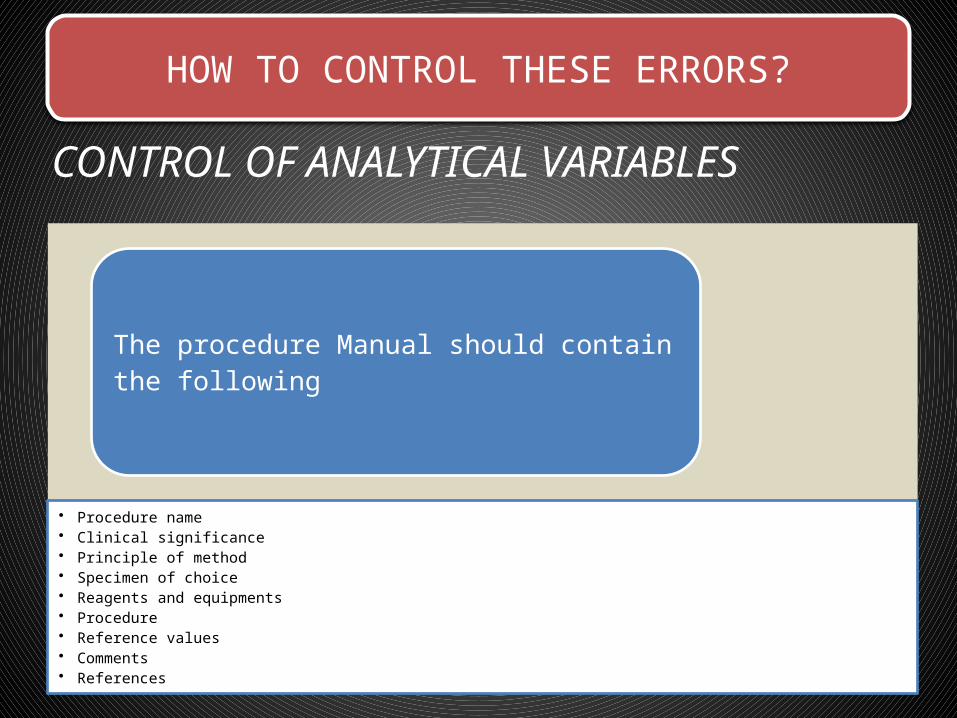
The procedure Manual should contain the following
• Procedure name• Clinical significance• Principle of method• Specimen of choice• Reagents and equipments• Procedure• Reference values• Comments• References
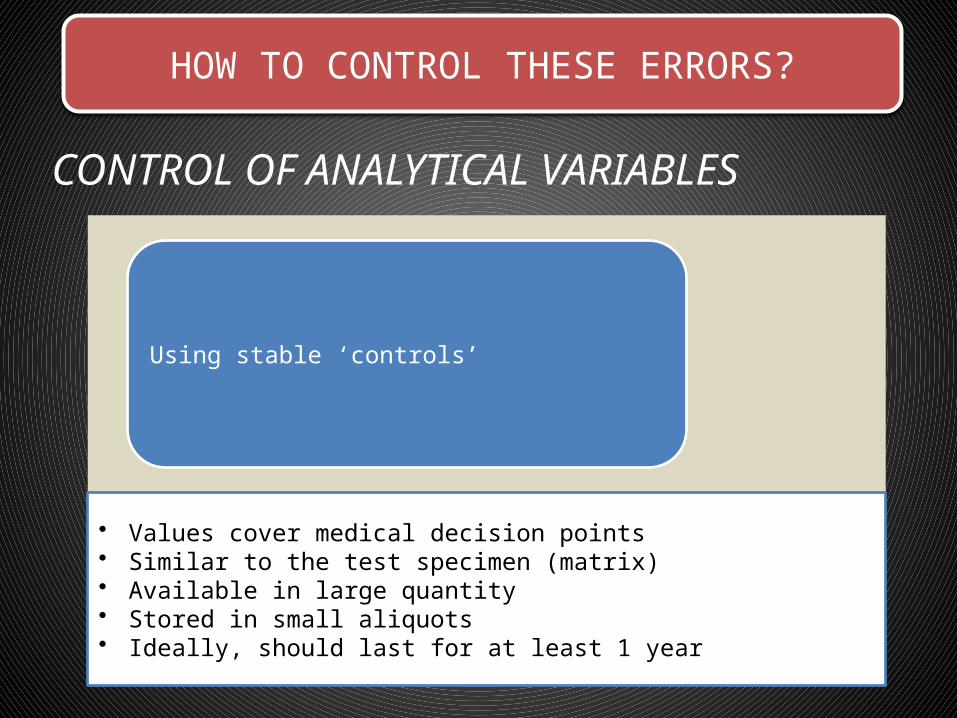
HOW TO CONTROL THESE ERRORS?
CONTROL OF ANALYTICAL VARIABLES
Using stable ‘controls’
• Values cover medical decision points • Similar to the test specimen (matrix)• Available in large quantity• Stored in small aliquots• Ideally, should last for at least 1 year
QC material- Preparation & Storage
Precautions to be followed
• Reconstitute lyophilized material carefully & strictly as per label direction• Frozen sample to be thawed properly. After attaining room temp., mix slowly
by inversion and then use.• Storage temperature to be strictly followed
QC material Availability
Assayed
Unassayed
Level 1 , 2 and 3
HOW TO CONTROL THESE ERRORS?
CONTROL OF ANALYTICAL VARIABLES
Using ‘Calibrators’
• Have a known concentration of the substance (analyte) being measured • Used to adjust instrument, kit, test system in order to standardize the assay• Sometimes called a standard, although usually not a true standard • This is not a control
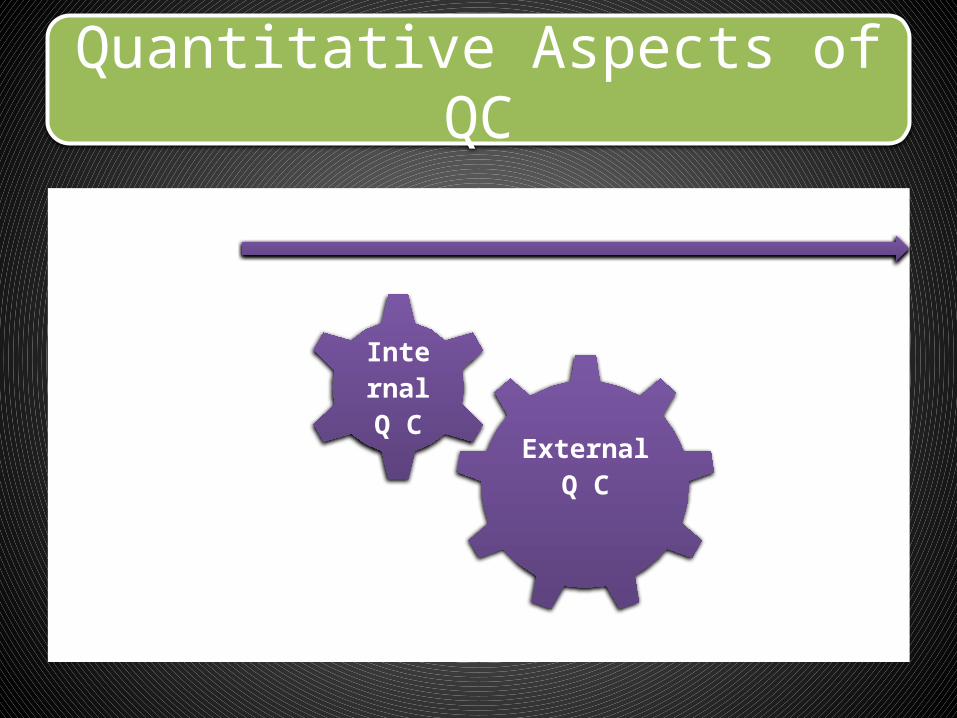
Quantitative Aspects of QC
External Q C
Internal Q C
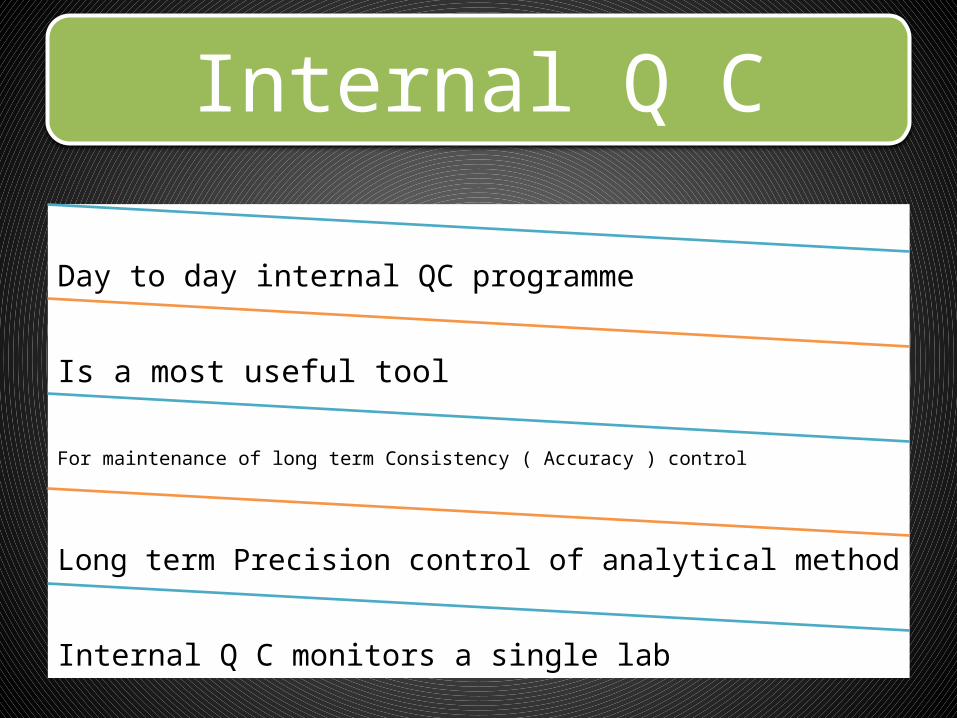
Internal Q C
Day to day internal QC programme
Is a most useful tool
For maintenance of long term Consistency ( Accuracy ) control
Long term Precision control of analytical method
Internal Q C monitors a single lab
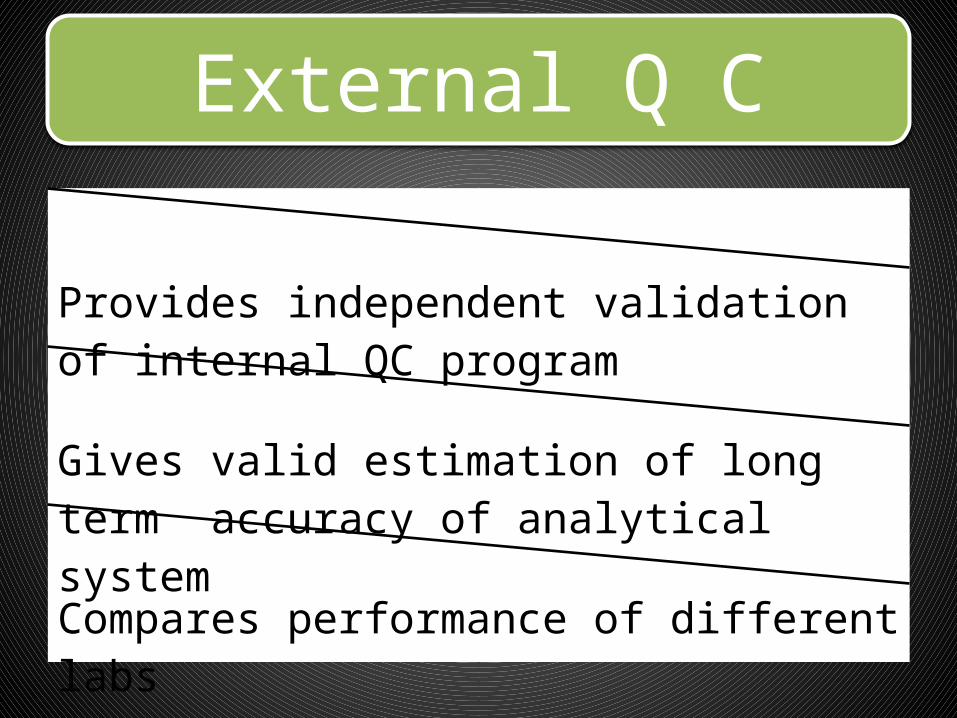
External Q C
Provides independent validation of internal QC program
Gives valid estimation of long term accuracy of analytical system
Compares performance of different labs
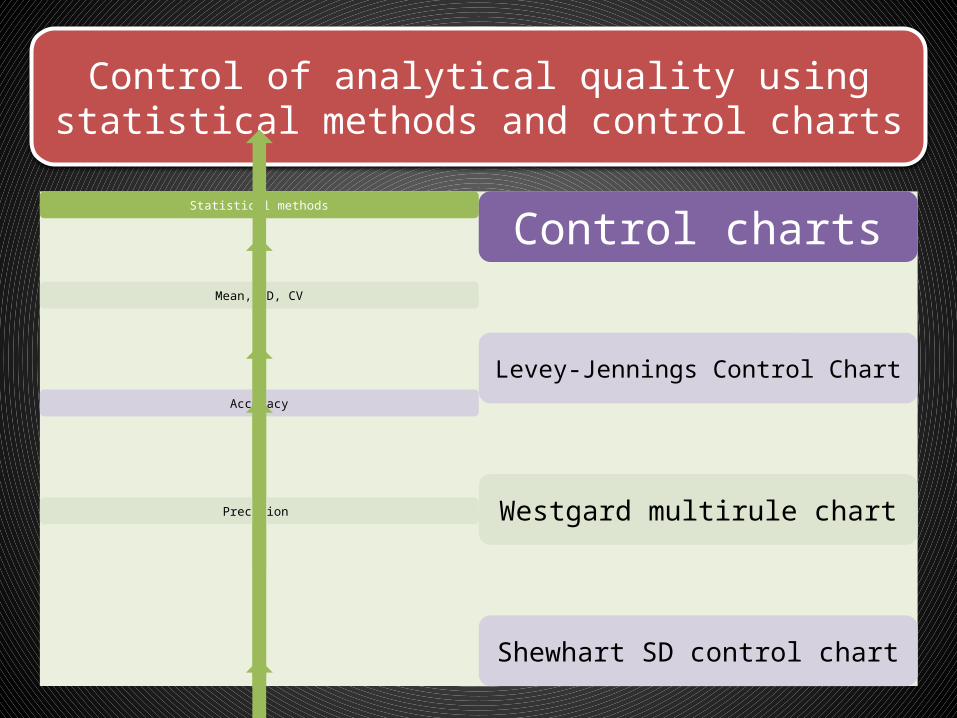
Control of analytical quality using statistical methods and control charts
Statistical methods
Mean, SD, CV
Accuracy
Precision
Control charts
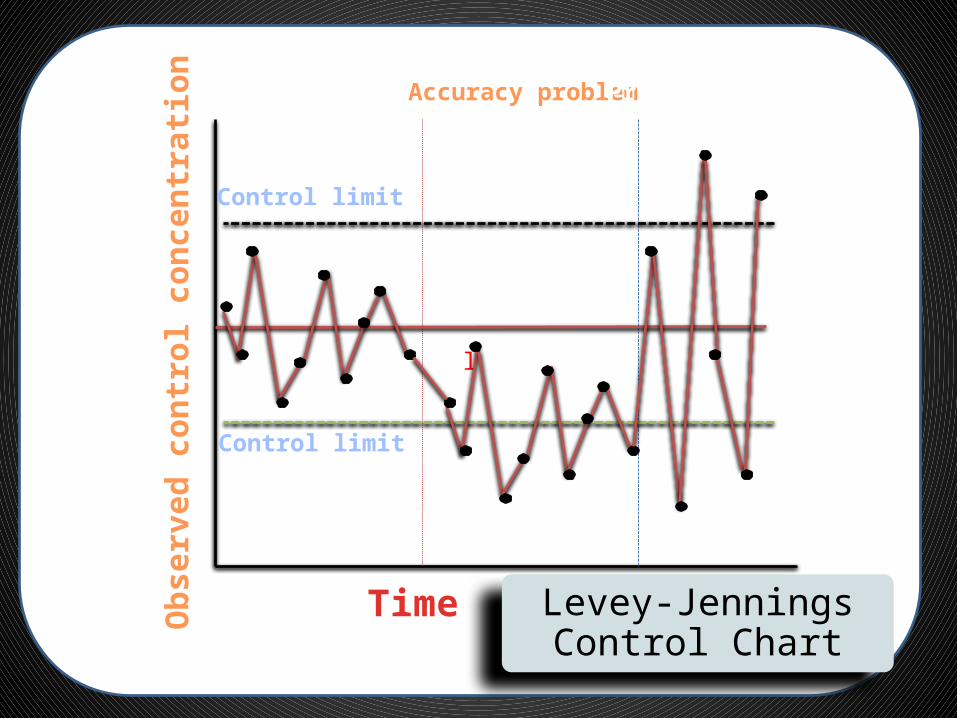
Levey-Jennings Control Chart
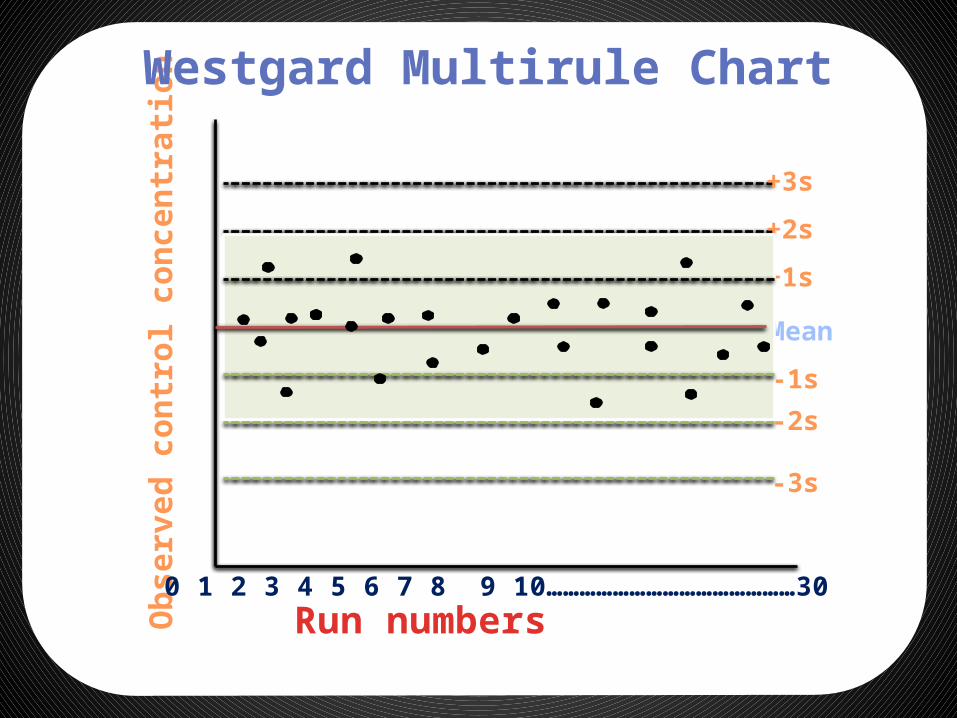
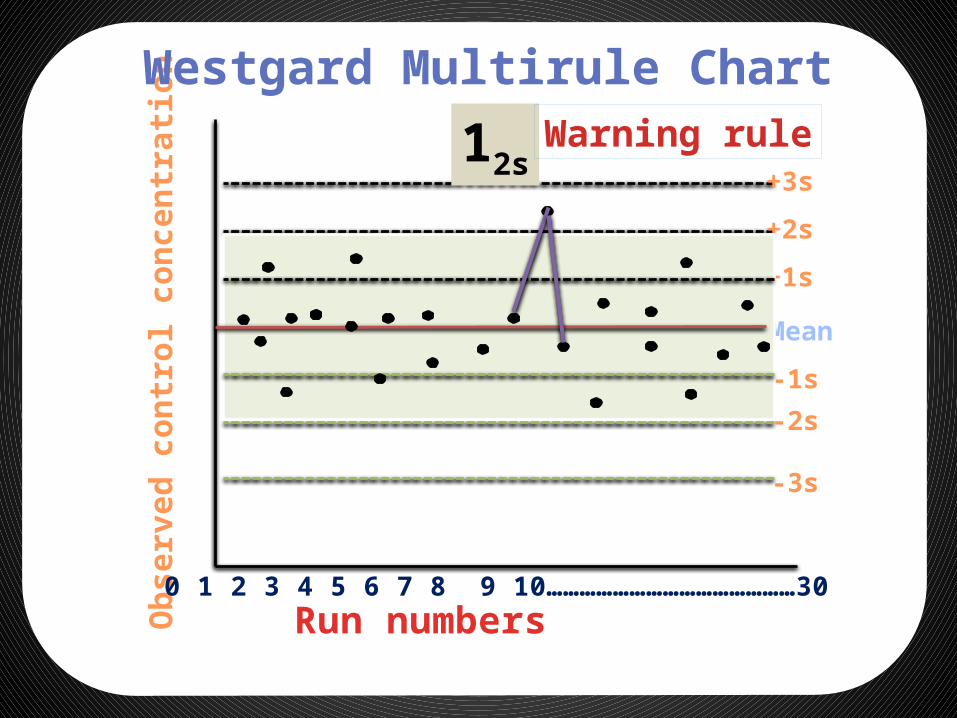
Westgard multirule chart
Shewhart SD control chart

Good Accuracy Good Precision
Good Precision Only
Neither Good precision Nor Accurate
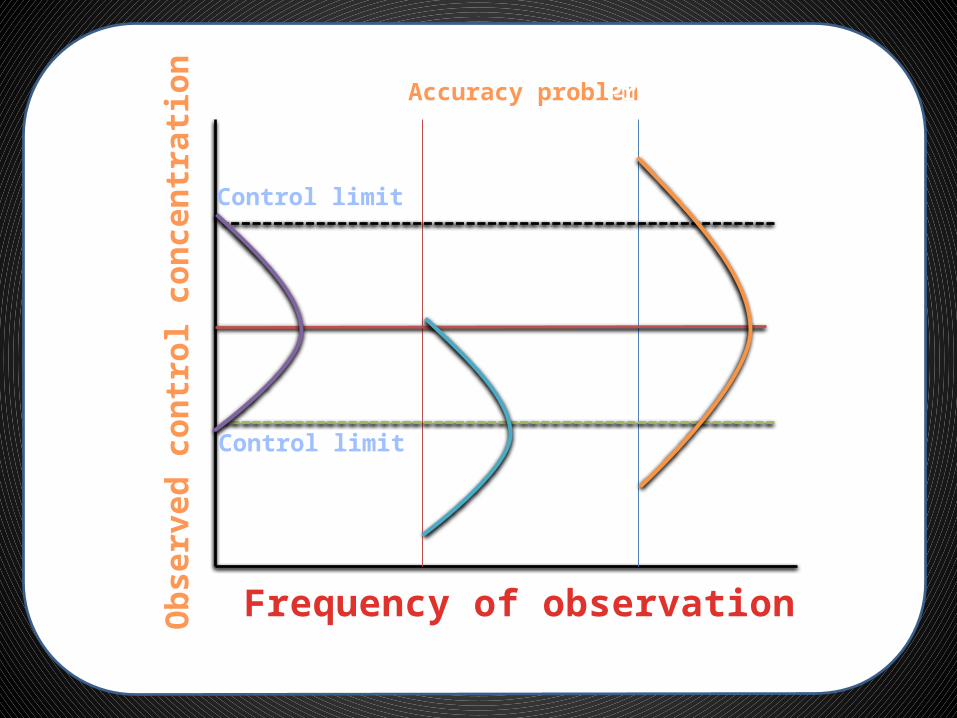
Frequency of observation
Control limit
Control limit
Stable performance Accuracy problem Precision problem
Obs
erve
d co
ntro
l con
cent
ratio
n
l
Time
Control limit
Control limit
Stable performance Accuracy problem Precision problem
Obs
erve
d co
ntro
l con
cent
ratio
n
Levey-Jennings Control Chart
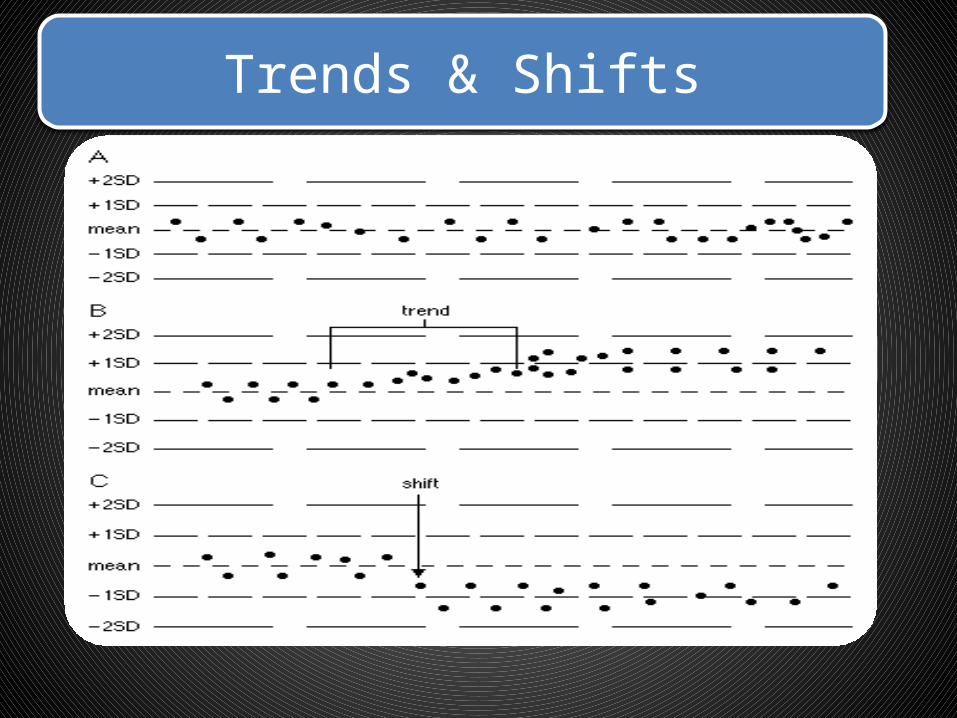
Trends & Shifts
Run numbers
Obs
erve
d co
ntro
l con
cent
ratio
n
Mean
+1s
+3s
+2s
-2s -1s
-3s
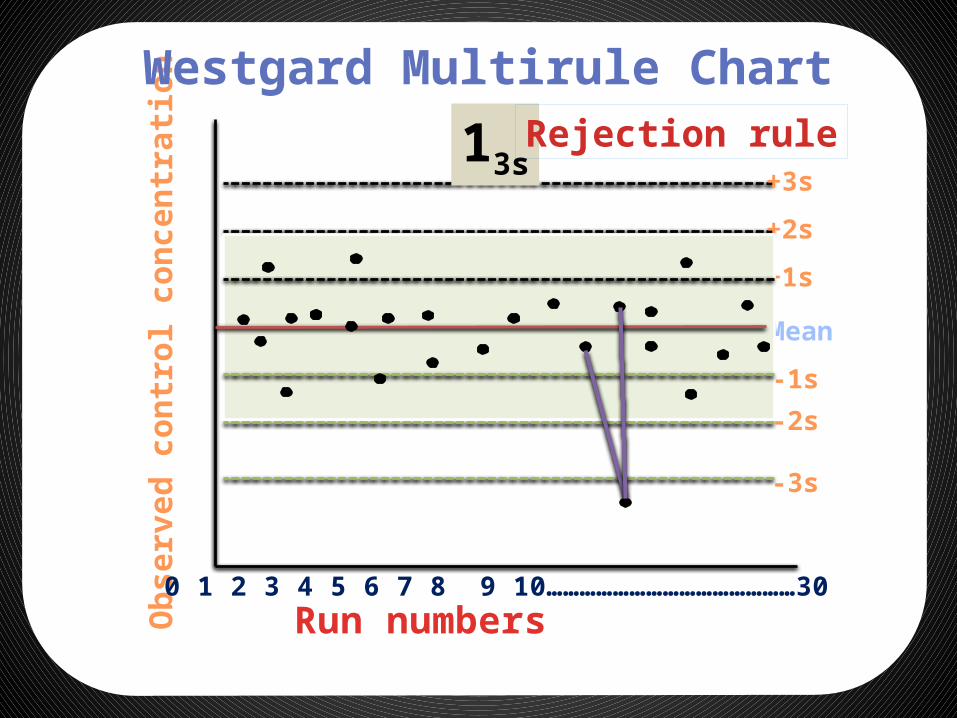
Westgard Multirule Chart
0 1 2 3 4 5 6 7 8 9 10………………………………………30
Run numbers
Obs
erve
d co
ntro
l con
cent
ratio
n
Mean
+1s
+3s
+2s
-2s -1s
-3s
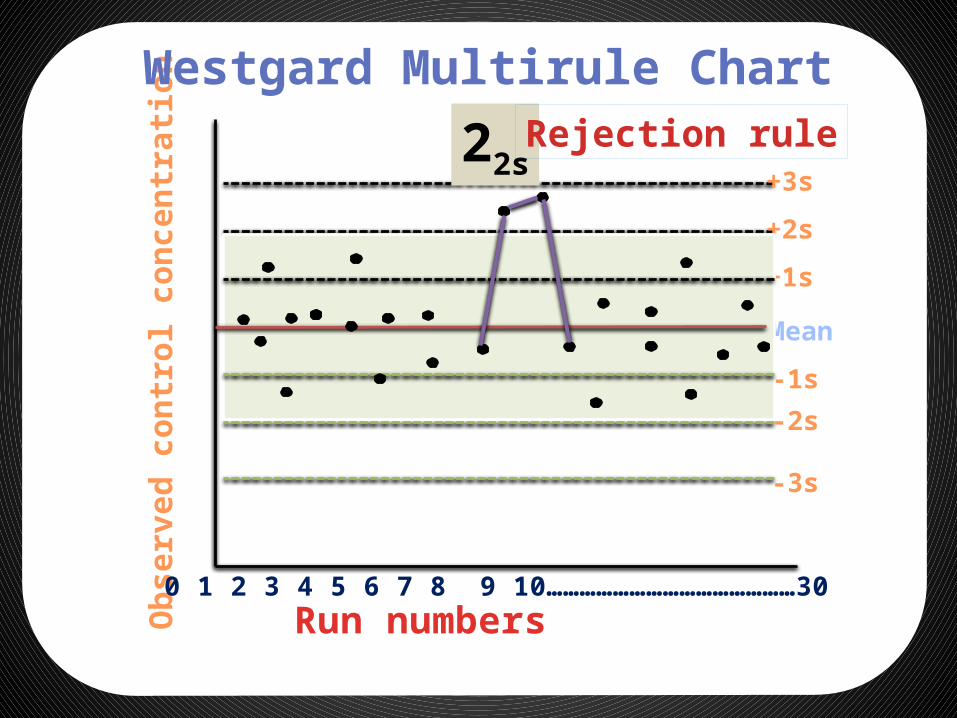
Westgard Multirule Chart
0 1 2 3 4 5 6 7 8 9 10………………………………………30
12sWarning rule
Run numbers
Obs
erve
d co
ntro
l con
cent
ratio
n
Mean
+1s
+3s
+2s
-2s -1s
-3s
Westgard Multirule Chart
0 1 2 3 4 5 6 7 8 9 10………………………………………30
13sRejection rule
Run numbers
Obs
erve
d co
ntro
l con
cent
ratio
n
Mean
+1s
+3s
+2s
-2s -1s
-3s
Westgard Multirule Chart
0 1 2 3 4 5 6 7 8 9 10………………………………………30
22sRejection rule
Run numbers
Obs
erve
d co
ntro
l con
cent
ratio
n
Mean
+1s
+3s
+2s
-2s -1s
-3s
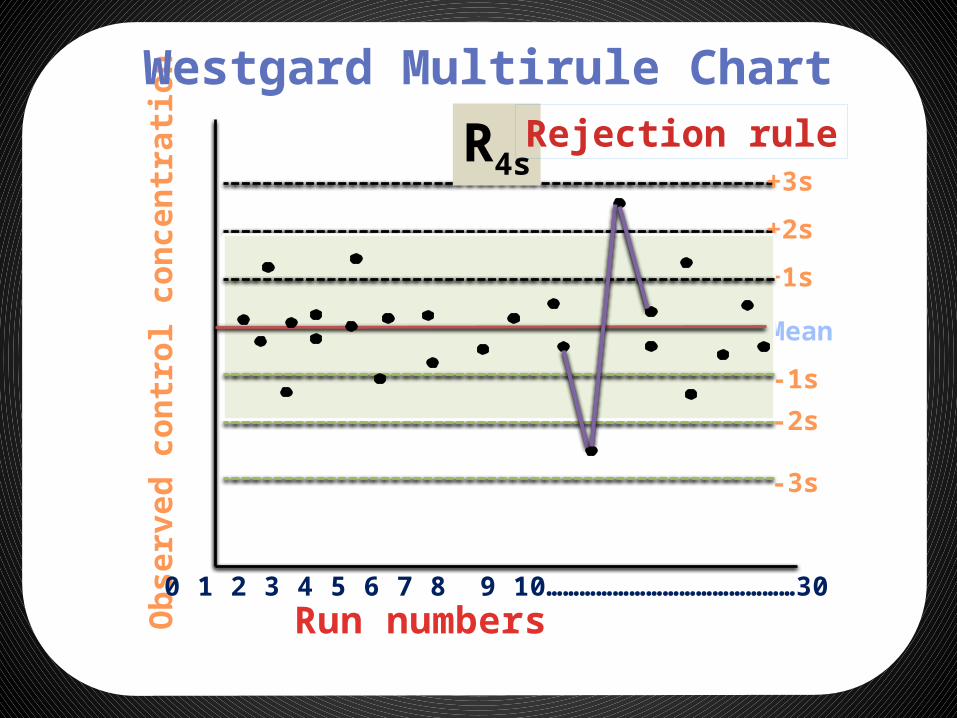
Westgard Multirule Chart
0 1 2 3 4 5 6 7 8 9 10………………………………………30
R4sRejection rule
Run numbers
Obs
erve
d co
ntro
l con
cent
ratio
n
Mean
+1s
+3s
+2s
-2s -1s
-3s
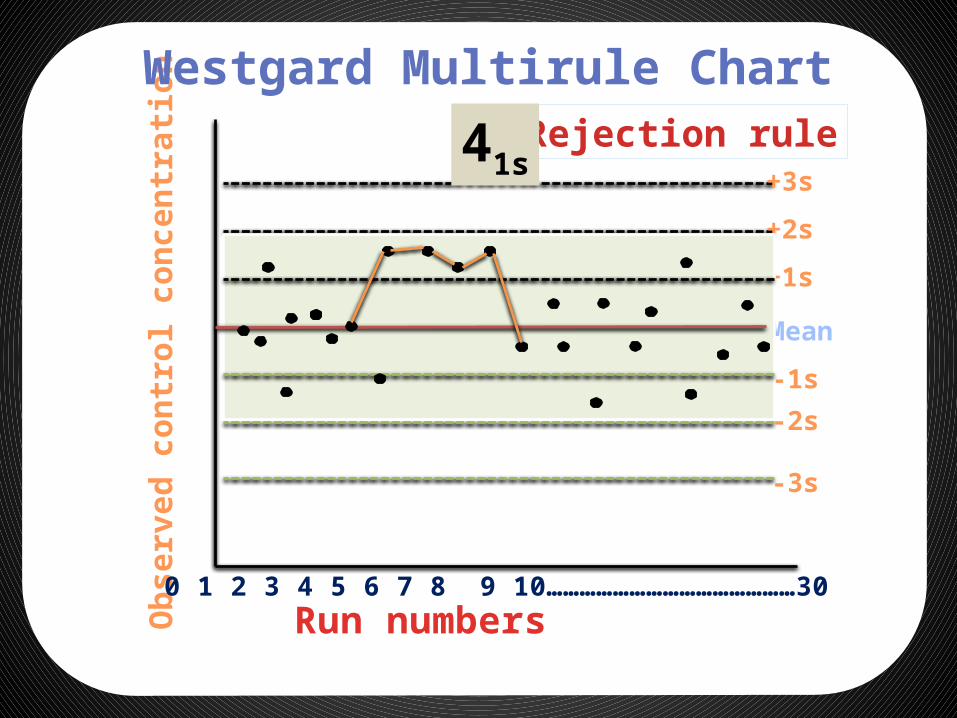
Westgard Multirule Chart
0 1 2 3 4 5 6 7 8 9 10………………………………………30
Rejection rule41s
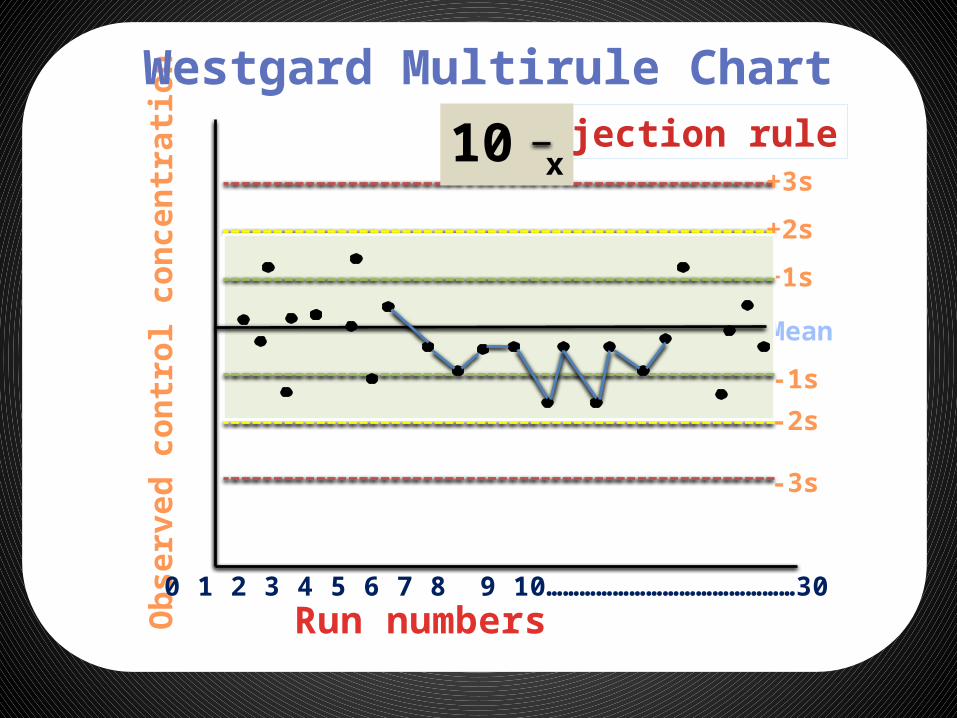
Run numbers
Obs
erve
d co
ntro
l con
cent
ratio
n
Mean
+1s
+3s
+2s
-2s -1s
-3s
Westgard Multirule Chart
0 1 2 3 4 5 6 7 8 9 10………………………………………30
Rejection rule10 x
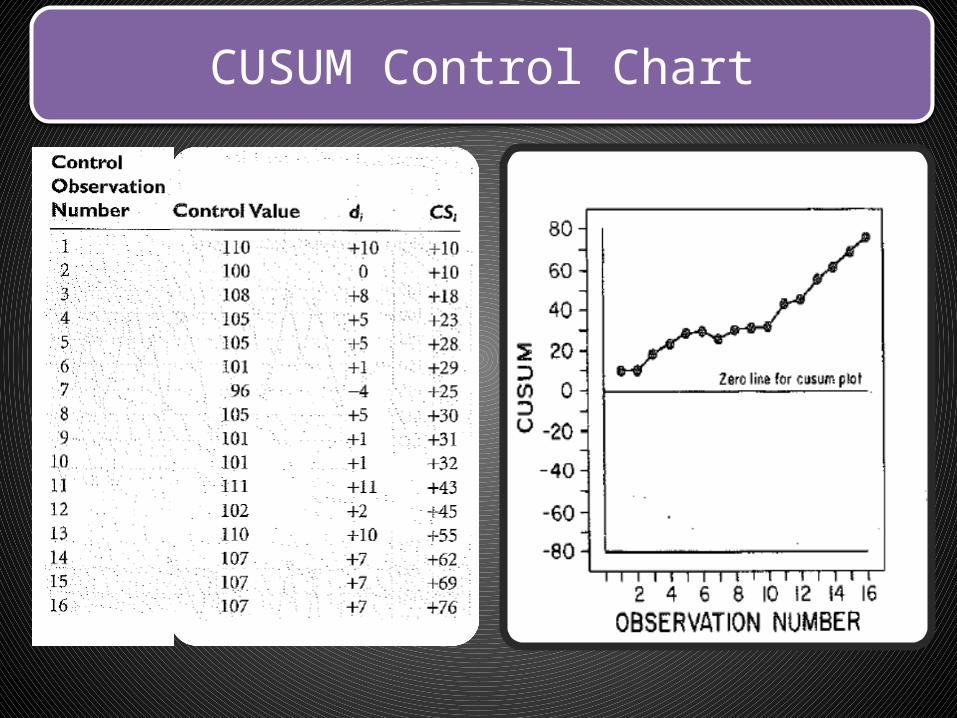
CUSUM Control Chart
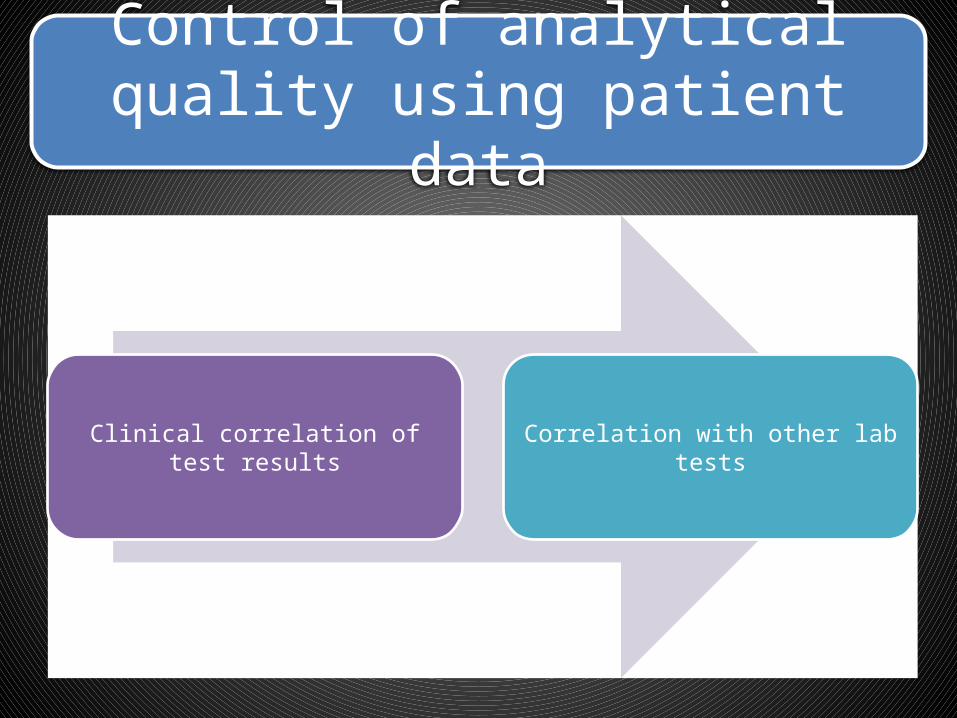
Control of analytical quality using patient data
Clinical correlation of test results Correlation with other lab tests
References
• Tietz test book of clinical Biochemistry• Varley• Kaplan• Internet