Quality Control Importance and Tools use for QC by Nitin Shekapure
77
Qualit y Contro l By Nitin G Shekapur
-
Upload
nitin-shekapure -
Category
Education
-
view
144 -
download
0
Transcript of Quality Control Importance and Tools use for QC by Nitin Shekapure

Quality
Control By
Nitin G Shekapure
Your definition of quality?
• High price?
• Reliable?
• Attractive?
• Durable?
• Other?

Quality - a Definition
• “Fitness for use” – Joseph Juran• “Conformance to requirements” – Philip
Crosby• Based on various factors: reliability,
durability, performance, usefulness, aesthetics, price, etc. - Various
• “Meets customer requirements” – Various• “Consistently meets or exceeds customer
expectations” – William Stevenson

Quality - a Definition
• “Consistently meets or exceeds customer requirements” – David Bentley Emphasis on requirements Includes understanding of expectations Implies an agreement
• explicit or Implicit
• Concept: “Do it right the first time and every time”

The Characteristics of Quality
Durability
Serviceability
Aesthetics
Perceived Quality
Performance
Features
Reliability
Conformance

Performance• Performance refers to a product's primary operating characteristics.• This dimension of quality involves measurable
attributes, so brands can usually be ranked objectively on individual aspects of performance.
• Overall performance rankings, however, are more difficult to develop, especially when they involve benefits that not every consumer needs. Performance is often a source of conflict between customers and suppliers, particularly when deliverables are not adequately defined within specifications.

Features
• Features are additional characteristics that enhance the appeal of the product or service to the user.
• Similar thinking can be applied to features, a second dimensions of quality that is often a secondary aspects of performance. Features are the "bells and whistles" of products and services, those characteristics that supplement their basic functioning.
• Examples include free drinks on a plane.• The line separating primary performance
characteristics from secondary features is often difficult to draw
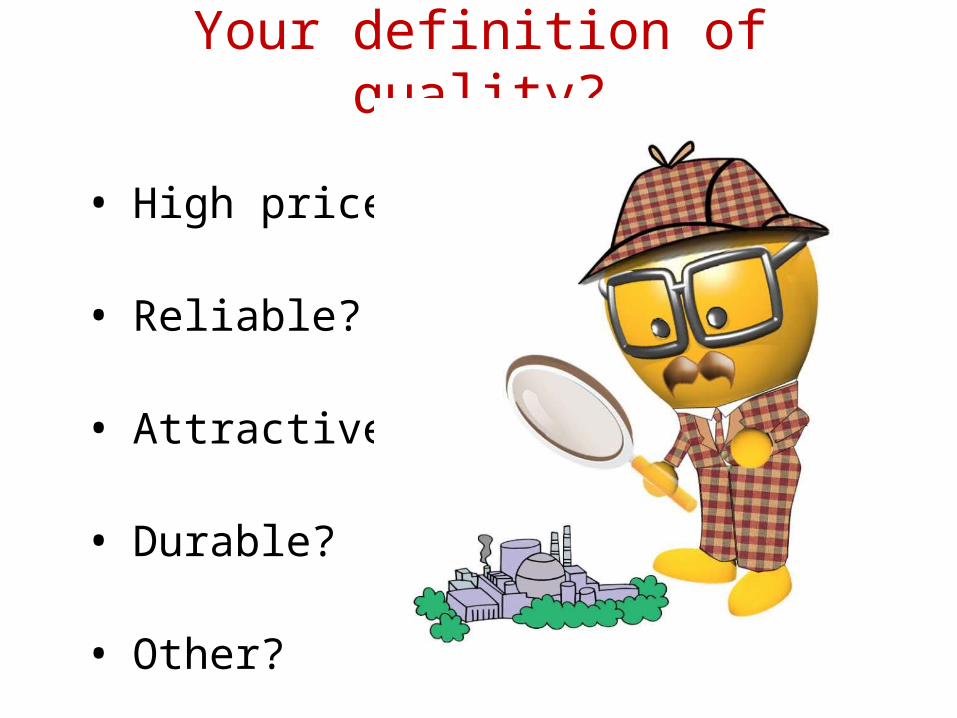
Reliability• Reliability is the likelihood that a product will not fail within a
specific time period. This is a key element for users who need the product to work without fail.
• This dimension reflects the probability of a product malfunctioning or failing within a specified time period.
• Reliability normally becomes more important to consumers as downtime and maintenance become more expensive.
• Reliability may be closely related to performance. For instance, a product specification may define parameters for up-time, or acceptable failure rates. Reliability is a major contributor to brand or company image, and is considered a fundamental dimension of quality by most end-users.

Conformance• The dimension of conformance depicts to what extent a
product’s design and operating characteristics meet established standards. This dimension owes the most to the traditional approaches to quality pioneered by experts like Juran.
• All products and services involve specifications of some sort. When products are developed, these specifications are set and a target is set, for instance the materials used or the dimension of the product. Not only the target but also the tolerance (the range of permitted deviation from the target) is defined.
• In service businesses, measures of conformance normally focus on accuracy and timeliness and include counts of processing errors, unanticipated delays and other frequent mistakes

Durability• Durability measures the length of a product’s life. When
the product can be repaired, estimating durability is more complicated. The item will be used until it is no longer economical to operate it. This happens when the repair rate and the associated costs increase significantly.
• Technically, durability can be defined as the amount of use one gets from a product before it deteriorates. After so many hours of use, the filament of a light bulb burns up and the bulb must be replaced. Repair is impossible.
• In other cases, consumers must weigh the expected cost, in both cost and personal inconvenience, of future repairs against the investment and operating expenses of a newer, more reliable model.
• Durability, then, may be defined as the amount of use one gets from a product before it breaks down and replacement is preferable to continued repair.
• The durability and reliability are closely linked.
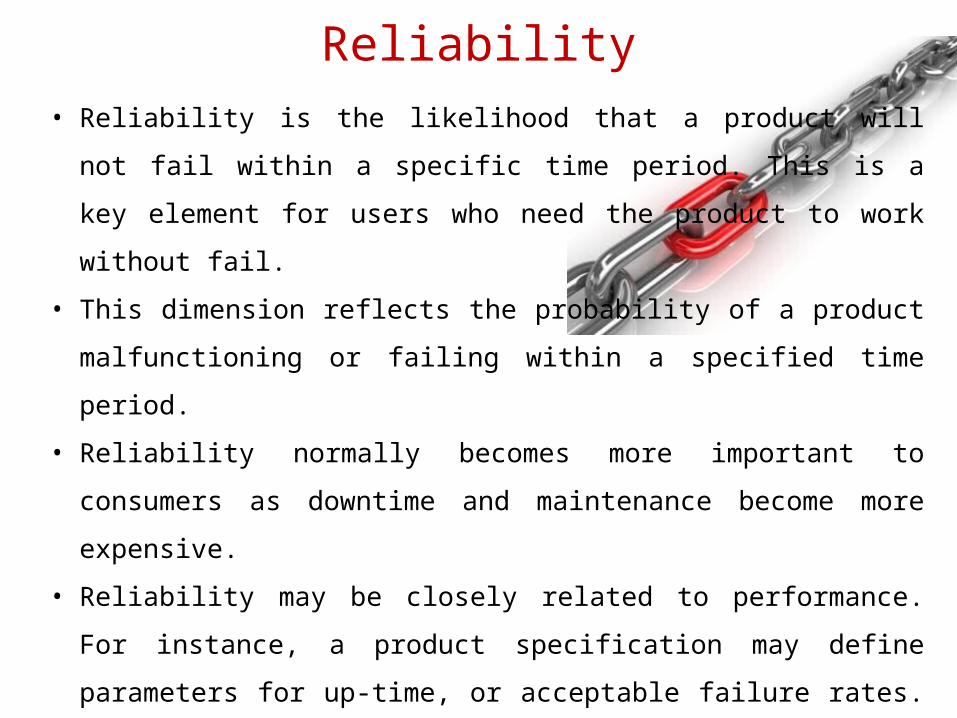
Serviceability• Serviceability involves the consumer's ease of obtaining
repair service.• The responsiveness of service personnel and the reliability
of service. • Important attributes for serviceability dimension are:
service warranty, parts warranty, parts availability, number of reasonable distance to dealer service centers, distance to service parts center-dealer, distance to service parts center individual, length of wait for service appointment, schedule of preventive maintenance, employees listen to customers, information regarding repairs, courteous service centers, repaired correctly first time, service time relative to other dealers, warranty claims handled without argument, average repair cost/year, extended warranty etc.
Aesthetics• The aesthetic properties of a product contribute to a
company's or brand's identity.• Faults or defects in a product that diminish its aesthetic
properties, even those that do not reduce or alter other dimensions of quality, are often cause for rejection.
• Aesthetics refers to how the product looks, feels, sounds, tastes or smells. It is clearly a matter of personal judgment and a reflection of individual preference.
• Aesthetics also refers to the "outside" feel of the product. • Not all people prefer "rich and full" flavor or even agree
on what that means. Companies therefore have to search for a niche. On this dimension of quality, it is impossible to please everyone.

Perceived Quality• Perception is not always reality. Consumers do not always
have complete information about a product's or service's attributes; indirect measures may be their only basis for comparing brands.
• A product's durability for example, can seldom be observed directly; it usually must be inferred from various tangible and intangible aspects of the product. In such circumstances, images, advertising and brand names-inferences about quality rather than the reality itself-can be critical.
• Reputation is the primary stuff of perceived quality. Its power comes from an unstated analogy: the quality of goods in a new product line is similar to the quality of a company's established products.

Quality ControlQuality control, or QC for short, is a process by which entities review the quality of all factors involved in production. This approach places an emphasis on three aspects:1. Elements such as controls, job management, defined
and well managed processes, performance and integrity criteria, and identification of records
2. Competence, such as knowledge, skills, experience, and qualifications
3. Soft elements, such as personnel, integrity, confidence, organizational culture, motivation, team spirit, and quality relationships.
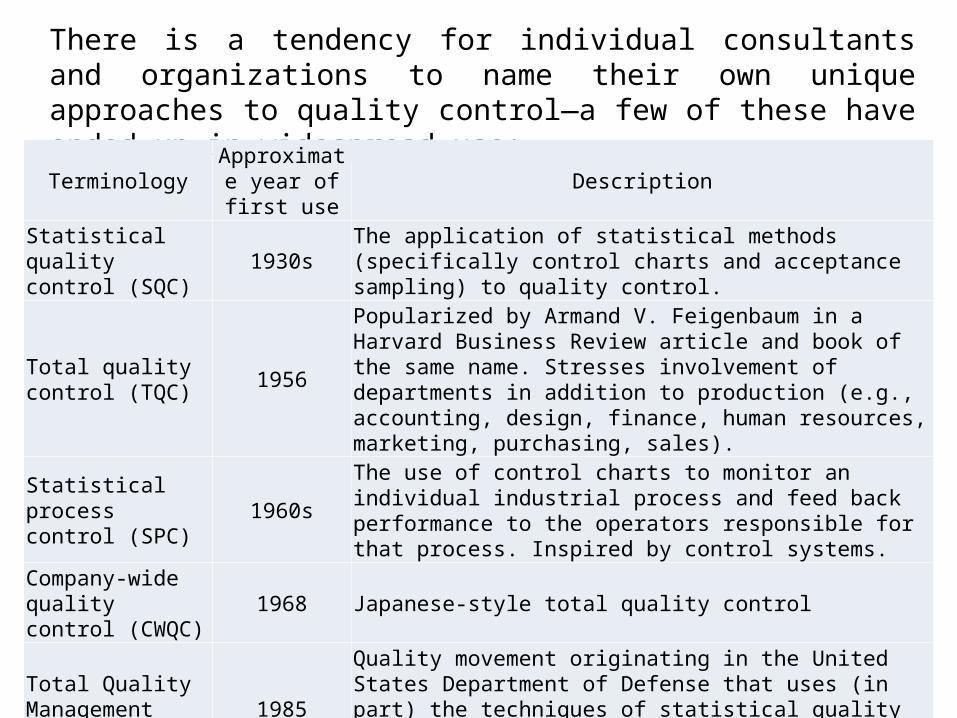
There is a tendency for individual consultants and organizations to name their own unique approaches to quality control—a few of these have ended up in widespread use:
Terminology Approximate year of first use Description
Statistical quality control (SQC) 1930s The application of statistical methods (specifically control charts
and acceptance sampling) to quality control.
Total quality control (TQC) 1956
Popularized by Armand V. Feigenbaum in a Harvard Business Review article and book of the same name. Stresses involvement of departments in addition to production (e.g., accounting, design, finance, human resources, marketing, purchasing, sales).
Statistical process control (SPC) 1960s
The use of control charts to monitor an individual industrial process and feed back performance to the operators responsible for that process. Inspired by control systems.
Company-wide quality control (CWQC)
1968 Japanese-style total quality control
Total Quality Management (TQM) 1985
Quality movement originating in the United States Department of Defense that uses (in part) the techniques of statistical quality control to drive continuous organizational improvement.
Six Sigma (6σ) 1986 Statistical quality control applied to business strategy.Originated by Motorola.
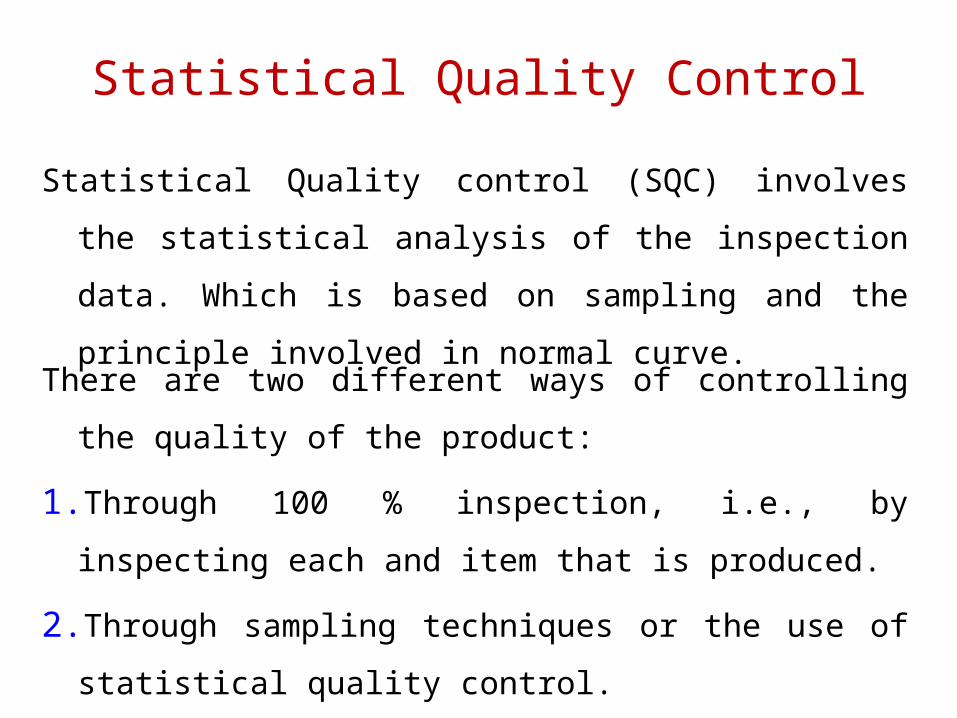
Statistical Quality Control
Statistical Quality control (SQC) involves the statistical analysis of the inspection data. Which is based on sampling and the principle involved in normal curve.
There are two different ways of controlling the quality of the product:
1.Through 100 % inspection, i.e., by inspecting each and item that is produced.
2.Through sampling techniques or the use of statistical quality control.

Control Charts
Control charts are used for process monitoring and variability reduction.

Quality Control Measurements
Two types of data• Attributes Data - discrete data, often in the
form of counts.• Variables Data - continuous measurements
such as length, weight.

Attributes – A performance characteristics that is either present or absent in the product or service under consideration.
• Examples: Order is either complete or incomplete; an invoice can have one, two, or more errors.
• Attributes data are discrete and tell whether the characteristics conforms to specifications.
• Attributes measurements typically represented as proportions or rates. e.g. rate of errors per opportunity.
• Typically measured by “Go-No Go” gauges.
Quality Control Measurements
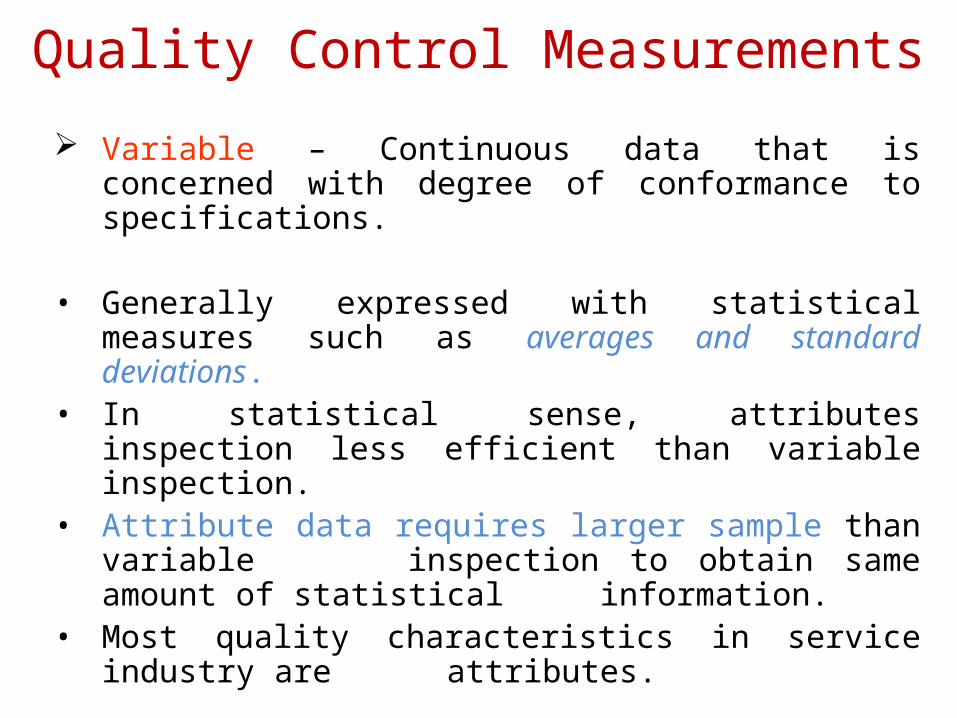
Variable – Continuous data that is concerned with degree of conformance to specifications.
• Generally expressed with statistical measures such as averages and standard deviations.
• In statistical sense, attributes inspection less efficient than variable inspection.
• Attribute data requires larger sample than variable inspection to obtain same amount of statistical information.
• Most quality characteristics in service industry are attributes.
Quality Control Measurements

Specifications Quality characteristics being measured are
often compared to standards or specifications.
• Nominal or target value• Upper Control Limit (UCL)• Lower Control Limit (LCL)• When a component or product does not meet
specifications, they are considered to be nonconforming.
• A nonconforming product is considered defective if it has one or more defects.
• Defects are nonconformities that may seriously affect the safe or effective use of the product.
Quality Control Measurements

Control charts help us learn more about processes
• Separate common and special causes of variation
• Determine whether a process is in a state of statistical control or out-of-control
• Estimate the process parameters (mean, variation) and assess the performance of a process or its capability

Control charts to monitor processes
• To monitor output, we use a control chart we check things like the mean, range,
standard deviation
• To monitor a process, we typically use two control charts mean (or some other central tendency
measure) variation (typically using range or
standard deviation)

Types of Data
• Variable data Product characteristic that can be measured Length, size, weight, height, time, velocity
• Attribute data Product characteristic evaluated with a discrete
choice Good/bad, yes/no

Control charts for variables • X-bar chart
In this chart the sample means are plotted in order to control the mean value of a variable (e.g., size of
piston rings, strength of materials, etc.). • R chart
In this chart, the sample ranges are plotted in order to control the variability of a variable.
• S chart In this chart, the sample standard deviations are
plotted in order to control the variability of a variable.
• S2 chart In this chart, the sample variances are plotted in
order to control the variability of a variable.
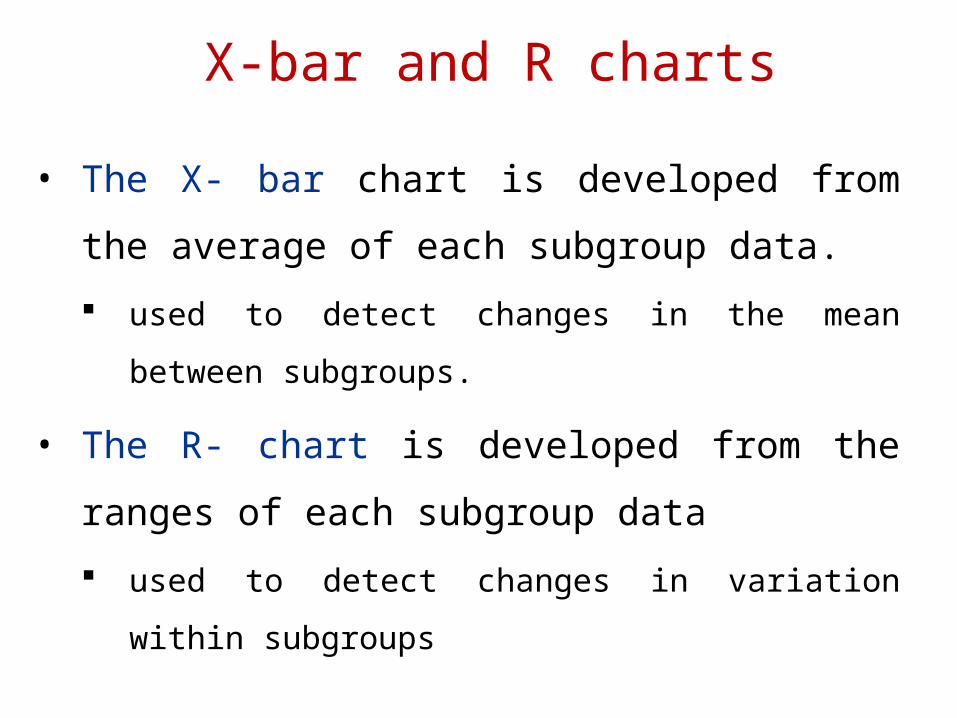
X-bar and R charts
• The X- bar chart is developed from the average of each subgroup data. used to detect changes in the mean between
subgroups.
• The R- chart is developed from the ranges of each subgroup data used to detect changes in variation within
subgroups
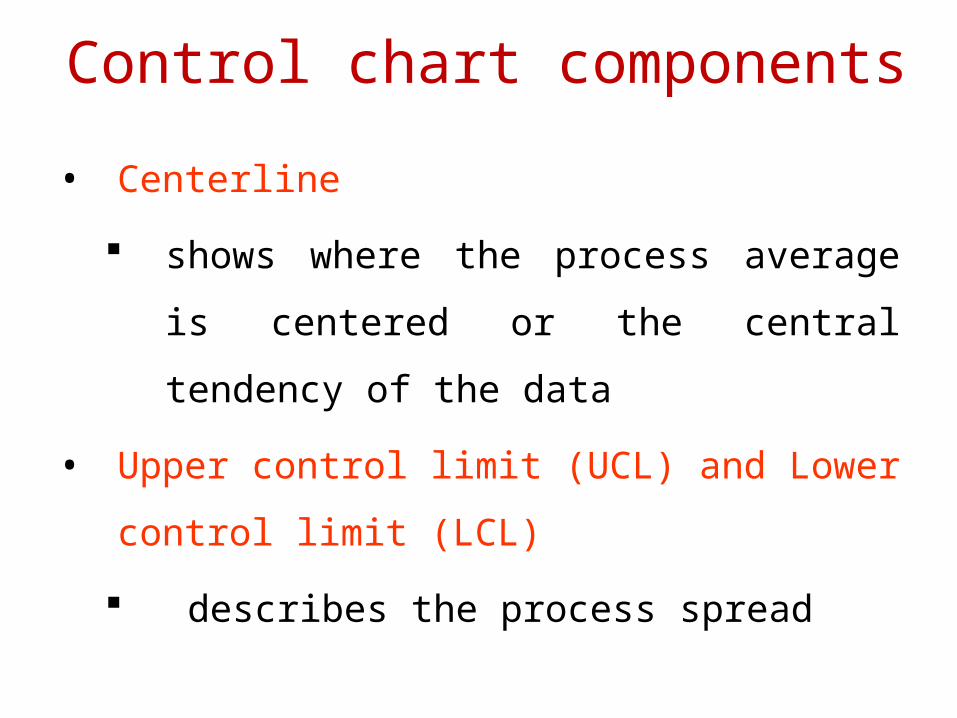
Control chart components
• Centerline shows where the process average is
centered or the central tendency of the data
• Upper control limit (UCL) and Lower control limit (LCL) describes the process spread

The Control Chart Method
R Control Chart: UCL = D4 x Rbar LCL = D3 x Rbar CL = Rbar
X bar Control Chart: UCL = Xdouble bar + A2 x Rbar LCL = Xdouble bar – A2 x Rbar CL = Xdouble bar
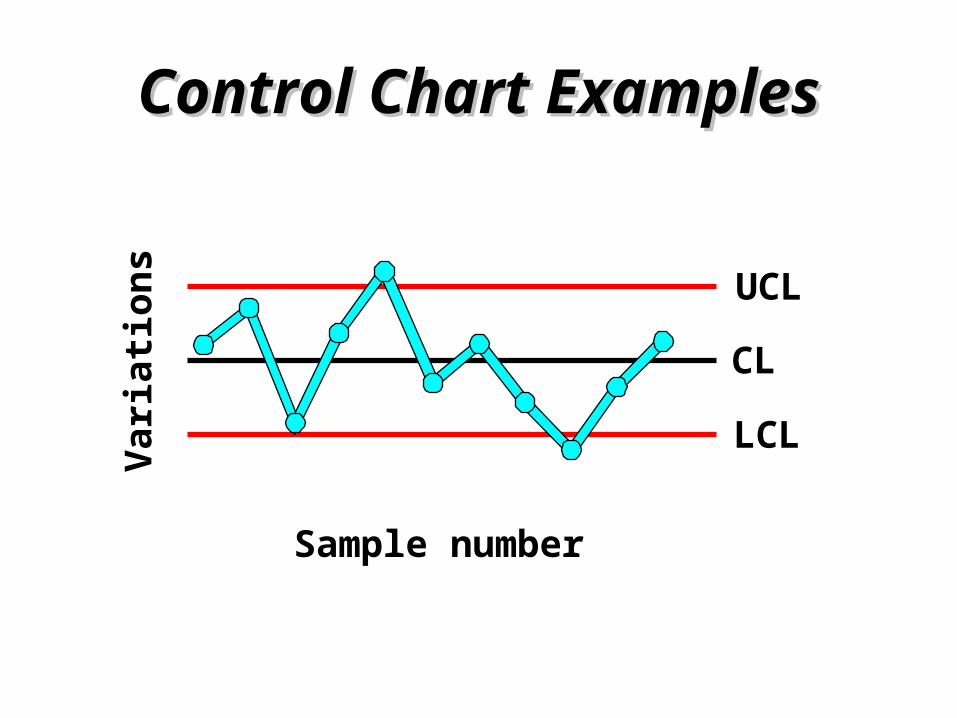
Control Chart ExamplesControl Chart Examples
CL
UCL
LCL
Sample number
Varia
tions

By: N.G. Shekapure
How to develop a control chart?
Define the problemUse other quality tools to help determine the general problem that’s occurring and the process that’s suspected of causing it.
Select a quality characteristic to be measuredIdentify a characteristic to study - for example, part length or any other variable affecting performance.

By: N.G. Shekapure
Choose a subgroup size to be Sampled
Choose homogeneous subgroups Homogeneous subgroups are produced
under the same conditions, by the same machine, the same operator, the same mold, at approximately the same time.
Try to maximize chance to detect differences between subgroups, while minimizing chance for difference with a group.

By: N.G. Shekapure
Collect the data
Generally, collect 20-25 subgroups (100 total samples) before calculating the control limits.
Each time a subgroup of sample size n is taken, an average is calculated for the subgroup and plotted on the control chart.

By: N.G. Shekapure
Determine trial centerline
The centerline should be the population mean, Since it is unknown, we use X Double bar, or the grand average of the subgroup averages.
m
m
ii
1
XX

By: N.G. Shekapure
Determine trial control limits - Xbar chart
The normal curve displays the distribution of the sample averages.A control chart is a time-dependent pictorial representation of a normal curve.Processes that are considered under control will have 99.73% of their graphed averages fall within 6.

By: N.G. Shekapure
UCL & LCL calculation
deviation standard3XLCL
3XUCL
By: N.G. Shekapure
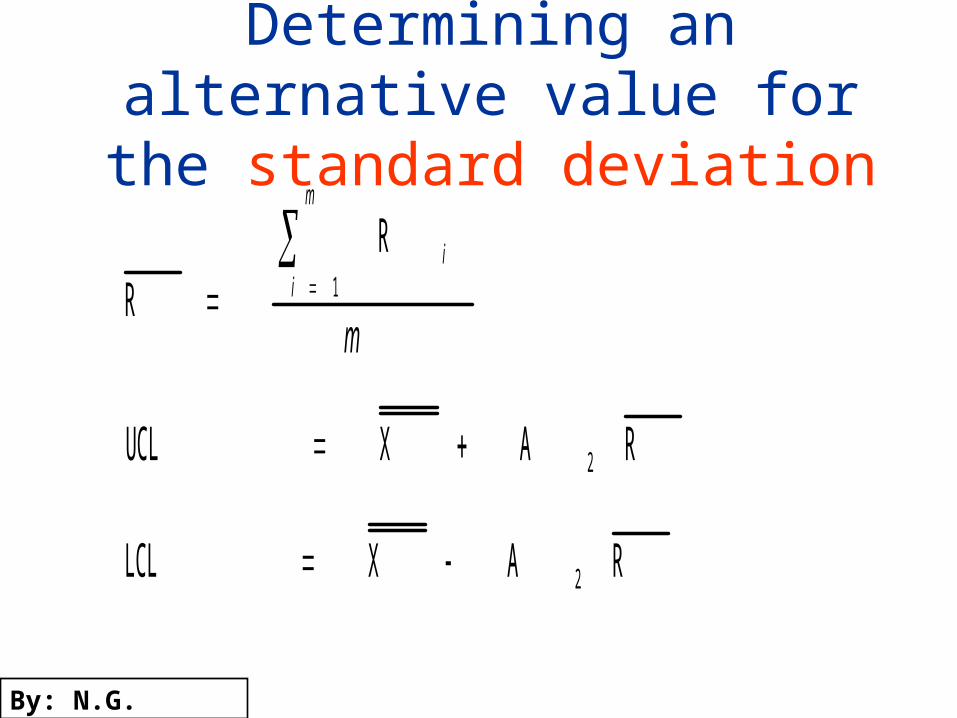
Determining an alternative value for the standard
deviation
m
m
ii
1
RR
RAXUCL 2
RAXLCL 2
By: N.G. Shekapure
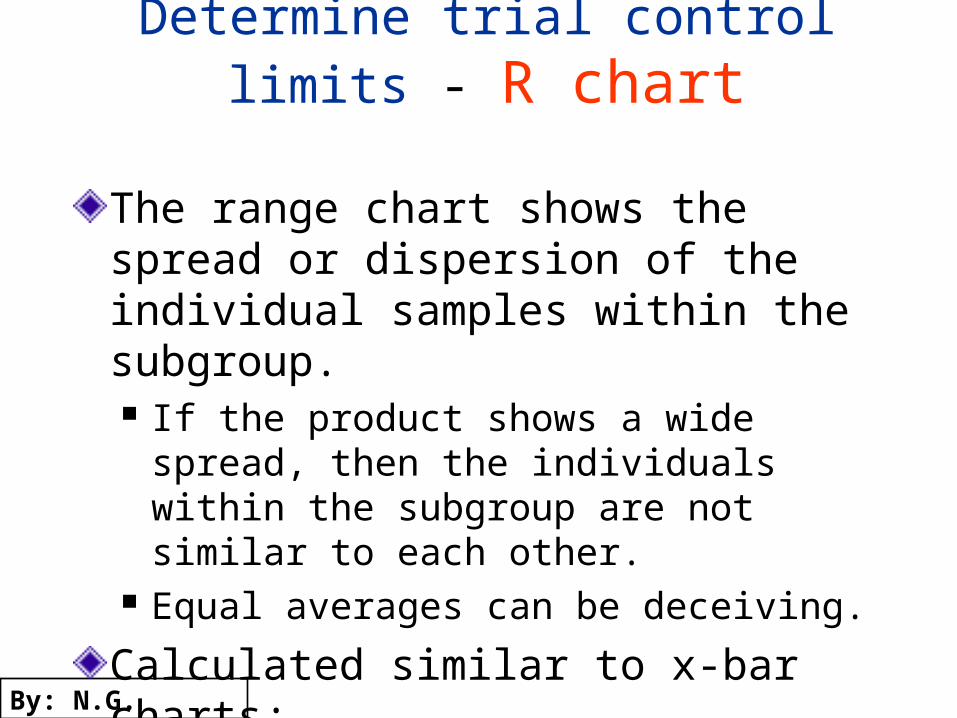
Determine trial control limits - R chart
The range chart shows the spread or dispersion of the individual samples within the subgroup. If the product shows a wide spread, then
the individuals within the subgroup are not similar to each other.
Equal averages can be deceiving.Calculated similar to x-bar charts; Use D3 and D4

By: N.G. Shekapure
Example: Control Charts for Variable Data
Slip Ring Diameter (cm)Sample 1 2 3 4 5 X R
1 5.02 5.01 4.94 4.99 4.96 4.98 0.082 5.01 5.03 5.07 4.95 4.96 5.00 0.123 4.99 5.00 4.93 4.92 4.99 4.97 0.084 5.03 4.91 5.01 4.98 4.89 4.96 0.145 4.95 4.92 5.03 5.05 5.01 4.99 0.136 4.97 5.06 5.06 4.96 5.03 5.01 0.10
7 5.05 5.01 5.10 4.96 4.99 5.02 0.148 5.09 5.10 5.00 4.99 5.08 5.05 0.119 5.14 5.10 4.99 5.08 5.09 5.08 0.15
10 5.01 4.98 5.08 5.07 4.99 5.03 0.10
50.09 1.15

By: N.G. Shekapure
CalculationFrom Table above:
Sigma X-bar = 50.09Sigma R = 1.15m = 10
Thus;X-Double bar = 50.09/10 = 5.009 cmR-bar = 1.15/10 = 0.115 cmNote: The control limits are only preliminary with 10 samples.
It is desirable to have at least 25 samples.

By: N.G. Shekapure
Trial control limitTrial control limitUCLx-bar = X-D bar + A2 R-bar = 5.009 + (0.577)(0.115) = 5.075 cmLCLx-bar = X-D bar - A2 R-bar = 5.009 - (0.577)(0.115) = 4.943 cm
UCLR = D4R-bar = (2.114)(0.115) = 0.243 cmLCLR = D3R-bar = (0)(0.115) = 0 cm
For A2, D3, D4: see Table
n = 5

By: N.G. Shekapure
3-Sigma Control Chart FactorsSample size X-chart R-chart
n A2 D3 D4
2 1.88 0 3.273 1.02 0 2.574 0.73 0 2.285 0.58 0 2.116 0.48 0 2.007 0.42 0.08 1.928 0.37 0.14 1.86

By: N.G. Shekapure
X-bar Chart
4.94
4.96
4.98
5.00
5.02
5.04
5.06
5.08
5.10
0 1 2 3 4 5 6 7 8 9 10 11
Subgroup
X ba
r
LCL
CL
UCL

By: N.G. Shekapure
R Chart
0.00
0.05
0.10
0.15
0.20
0.25
0 1 2 3 4 5 6 7 8 9 10 11
Subgroup
Ran
ge
LCL
CL
UCL

By: N.G. Shekapure
Process Out of Control
The term out of control is a change in the process due to an assignable cause.When a point (subgroup value) falls outside its control limits, the process is out of control.

By: N.G. Shekapure
X-bar ChartX-bar Chart

Subgroup X1 X2 X3 X4 X-bar UCL-X-bar X-Dbar LCL-X-bar R UCL-R R-bar LCL-R
1 6.35 6.4 6.32 6.37 6.36 6.47 6.41 6.35 0.08 0.20 0.0876 0
2 6.46 6.37 6.36 6.41 6.4 6.47 6.41 6.35 0.1 0.20 0.0876 0
3 6.34 6.4 6.34 6.36 6.36 6.47 6.41 6.35 0.06 0.20 0.0876 0
4 6.69 6.64 6.68 6.59 6.65 6.47 6.41 6.35 0.1 0.20 0.0876 0
5 6.38 6.34 6.44 6.4 6.39 6.47 6.41 6.35 0.1 0.20 0.0876 0
6 6.42 6.41 6.43 6.34 6.4 6.47 6.41 6.35 0.09 0.20 0.0876 0
7 6.44 6.41 6.41 6.46 6.43 6.47 6.41 6.35 0.05 0.20 0.0876 0
8 6.33 6.41 6.38 6.36 6.37 6.47 6.41 6.35 0.08 0.20 0.0876 0
9 6.48 6.44 6.47 6.45 6.46 6.47 6.41 6.35 0.04 0.20 0.0876 0
10 6.47 6.43 6.36 6.42 6.42 6.47 6.41 6.35 0.11 0.20 0.0876 0
11 6.38 6.41 6.39 6.38 6.39 6.47 6.41 6.35 0.03 0.20 0.0876 0
12 6.37 6.37 6.41 6.37 6.38 6.47 6.41 6.35 0.04 0.20 0.0876 0
13 6.4 6.38 6.47 6.35 6.4 6.47 6.41 6.35 0.12 0.20 0.0876 0
14 6.38 6.39 6.45 6.42 6.41 6.47 6.41 6.35 0.07 0.20 0.0876 0
15 6.5 6.42 6.43 6.45 6.45 6.47 6.41 6.35 0.08 0.20 0.0876 0
16 6.33 6.35 6.29 6.39 6.34 6.47 6.41 6.35 0.1 0.20 0.0876 0
17 6.41 6.4 6.29 6.34 6.36 6.47 6.41 6.35 0.12 0.20 0.0876 0
18 6.38 6.44 6.28 6.58 6.42 6.47 6.41 6.35 0.3 0.20 0.0876 0
19 6.35 6.41 6.37 6.38 6.38 6.47 6.41 6.35 0.06 0.20 0.0876 0
20 6.56 6.55 6.45 6.48 6.51 6.47 6.41 6.35 0.11 0.20 0.0876 0
21 6.38 6.4 6.45 6.37 6.4 6.47 6.41 6.35 0.08 0.20 0.0876 0
22 6.39 6.42 6.35 6.4 6.39 6.47 6.41 6.35 0.07 0.20 0.0876 0
23 6.42 6.39 6.39 6.36 6.39 6.47 6.41 6.35 0.06 0.20 0.0876 0
24 6.43 6.36 6.35 6.38 6.38 6.47 6.41 6.35 0.08 0.20 0.0876 0
25 6.39 6.38 6.43 6.44 6.41 6.47 6.41 6.35 0.06 0.20 0.0876 0
Given Data (Table 5.2)

Calculation
From Table 5.2:• Sigma X-bar = 160.25• Sigma R = 2.19• m = 25Thus;• X-double bar = 160.25/29 = 6.41 mm• R-bar = 2.19/25 = 0.0876 mm

Trial control limitTrial control limit• UCLx-bar = X-double bar + A2R-bar =
6.41 + (0.729)(0.0876) = 6.47 mm• LCLx-bar = X-double bar - A2R-bar = 6.41
– (0.729)(0.0876) = 6.35 mm• UCLR = D4R-bar = (2.282)(0.0876) =
0.20 mm• LCLR = D3R-bar = (0)(0.0876) = 0 mm
For A2, D3, D4: see Table B Appendix, n = 4.

X-bar ChartX-bar Chart

R ChartR Chart

Revised CL & Control LimitsRevised CL & Control Limits
• Calculation based on discarding subgroup 4 & 20 (X-bar chart) and subgroup 18 for R chart:
• = (160.25 - 6.65 - 6.51)/(25-2) = 6.40 mm
• = (2.19 - 0.30)/25 - 1 = 0.079 = 0.08 mmd
dnew mm
RRR
d
dnew mm
XXX

New Control LimitsNew Control Limits
New value:
• Using standard value, CL & 3 control limit obtained using formula:
2
,,dRRRXX O
onewonewo
oRoR
ooXooX
DLCLDUCLAXLCLAXUCL
12 ,,

From Table B:• A = 1.500 for a subgroup size of 4,• d2 = 2.059, D1 = 0, and D2 = 4.698Calculation results:
mmXX newo 40.6 mmdR
RR oonewo 038.0
059.2079.0,079.0
2
mmAXUCL ooX 46.6)038.0)(500.1(40.6
mmAXLCL ooX 34.6)038.0)(500.1(40.6
mmDUCL oR 18.0)038.0)(698.4(2 mmDLCL oR 0)038.0)(0(1

Trial Control Limits & Revised Control Limit
6.30
6.35
6.40
6.45
6.50
6.55
6.60
6.65
0 2 4 6 8
Subgroup
Mea
n, X
-bar
0.00
0.05
0.10
0.15
0.20
0 2 4 6 8
Subgroup
Ran
ge, R
UCL = 6.46
CL = 6.40
LCL = 6.34
LCL = 0
CL = 0.08
UCL = 0.18
Revised control limits

Revise the charts• In certain cases, control limits are
revised because:–out-of-control points were included
in the calculation of the control limits.
– the process is in-control but the within subgroup variation significantly improves.

Revising the charts• Interpret the original charts• Isolate the causes• Take corrective action• Revise the chart
– Only remove points for which you can determine an assignable cause

Process in Control• When a process is in control, there occurs
a natural pattern of variation.• Natural pattern has:
– About 34% of the plotted point in an imaginary band between 1s on both side CL.
– About 13.5% in an imaginary band between 1s and 2s on both side CL.
– About 2.5% of the plotted point in an imaginary band between 2s and 3s on both side CL.

Control Charts

Control Charts

Control Charts

Control Charts

Control Charts

Control Charts

Control Charts

Control Charts

Control Charts

Control Charts

What is acceptance sampling?
Statistical quality control technique, where a random sample is taken from a lot, and upon the results of the sample taken the lot will either be rejected or accepted.
• Accept Lot Ready for customers• Reject Lot Not suitable for customers• Statistical Process Control(SPC) Sample and determine if in acceptable limits

Acceptance Sampling methodA C C E P T A N C E S A M P L IN G
A C C E P T L O T
R E T U R N L O T T O S U P P L IE R 1 0 0 % IN S P E C T IO N
D E C IS IO N
R E JE C T L O T S A M P LE A G A IN
D E C IS IO N
IN S P E C T S A M P LET yp e t it le h e re
T A K E S A M P LE

100 % inspection Vs Sampling inspection
• Can be either 100% inspection, or a few items of a lot.
• Complete inspection Inspecting each item produced to see if each item
meets the level desired Used when defective items would be very
detrimental in some way

Problems with 100% inspection
• Very expensive
• When product must be destroyed to test
• Inspection must be very tedious so defective
items do not slip through inspection

How/When would you use it?Acceptance sampling advantages Less handling damages Fewer inspectors to put on payroll 100% inspection costs are to high 100% testing would take to long
Acceptance sampling disadvantages Risk included in chance of bad lot “acceptance”
and good lot “rejection” Sample taken provides less information than
100% inspection

Acceptance sampling explained
• Determine how many units, n, to sample from
an lot
• Determine maximum number of defective
items, c, that can be found before the lot is
rejected

Acceptance sampling explained
• Acceptable Quality levels (AQL)
- Number of defect percentage allowed in a lot
which can still be considered accepted (Type I
error)
• Lot Tolerance Percent Defective (LTPD)
- Amount of defects that will come with a lot of
goods(Type II error)

Acceptance sampling explained

Acceptance sampling explained

Acceptance sampling explained