Quality-by-design of nanopharmaceuticals. A state of … 3: Cause-and-effect (fishbone) diagram...
29
HAL Id: hal-01670000 https://hal.archives-ouvertes.fr/hal-01670000 Submitted on 21 Dec 2017 HAL is a multi-disciplinary open access archive for the deposit and dissemination of sci- entific research documents, whether they are pub- lished or not. The documents may come from teaching and research institutions in France or abroad, or from public or private research centers. L’archive ouverte pluridisciplinaire HAL, est destinée au dépôt et à la diffusion de documents scientifiques de niveau recherche, publiés ou non, émanant des établissements d’enseignement et de recherche français ou étrangers, des laboratoires publics ou privés. Quality-by-design of nanopharmaceuticals. A state of the art Thierry Bastogne To cite this version: Thierry Bastogne. Quality-by-design of nanopharmaceuticals. A state of the art. European Com- mission JRC Workshop: Bridging communitie in the field of nanomedicine, Sep 2017, Ispra, Italy. <hal-01670000>
Transcript of Quality-by-design of nanopharmaceuticals. A state of … 3: Cause-and-effect (fishbone) diagram...
HAL Id: hal-01670000https://hal.archives-ouvertes.fr/hal-01670000
Submitted on 21 Dec 2017
HAL is a multi-disciplinary open accessarchive for the deposit and dissemination of sci-entific research documents, whether they are pub-lished or not. The documents may come fromteaching and research institutions in France orabroad, or from public or private research centers.
L’archive ouverte pluridisciplinaire HAL, estdestinée au dépôt et à la diffusion de documentsscientifiques de niveau recherche, publiés ou non,émanant des établissements d’enseignement et derecherche français ou étrangers, des laboratoirespublics ou privés.
Quality-by-design of nanopharmaceuticals. A state ofthe art
Thierry Bastogne
To cite this version:Thierry Bastogne. Quality-by-design of nanopharmaceuticals. A state of the art. European Com-mission JRC Workshop: Bridging communitie in the field of nanomedicine, Sep 2017, Ispra, Italy.<hal-01670000>

Quality-by-DesignofNanopharmaceuticals.AStateoftheArt
T.Bastogne|CRANCNRS-Univ.Lorraine|INRIABIGS|CYBERNANOJRC,Ispra,Italy,27-28Sep
BridgingcommunitiesinthefieldofnanomedicineEuropeanCommission,JointResearchCentre(JRC)27-28Sep.2017,Ispra,Italy

Contents
1. QbDinTheory
2. QbDinPractice(2007-2017)
3. Oneperspective…
TBastogne,JRC-Ispra27-28Sep2017

Biomarker CompoundBiomarker Concentration
Shell MaterialShell ThicknessShell Diameter
Shell Ingredient ConcentrationActive Substance Concentration
Active Substance MoleculeCore Material
Core SizeTargeting Molecule Type
Targeting Molecule ConcentrationCoating Ingredient
Coating Ingredient Concentration
Unit1Emulsifica/on
Unit2Polymerisa/on
Unit3Coa/ng
Unit4Evapora/on
Unit5Heat
Unit6Packaging
Sonica/onTimeSonica/onAmplitudeSonica/onPowerPolymeriza/onTimePolymeriza/onTemperaturePolymeriza/onRPMCoa/ngConcentra/onCoa/ngTimeCoa/ngTemperatureEvapora/onTimeEvapora/onTemperatureEvapora/onRPMHeatTimeHeatTemperaturePackagingSupportPackagingVolume
7compounds2parameters3testedvalues
3(7x2)>4.106formulations
6productionunits3parameters3testedvalues
3(6x3)>3.109nano-products
TBastogne,JRC-Ispra27-28Sep2017 1

AlargepopulationofpossibledifferentNano-objects
H0:NanoisnotEfficientH1:NanoisEfficient
H0:NanoisnotToxicH1:NanoisToxic
SAFETY:EFFICACY:
Prob[Efficacy|Data]? Prob[Safety|Data]?
Howtominimizetherisksofbaddecisions?
Quality-by-Design:anapproachtoestimateandcontrolthoserisksICHQ8,Q9,Q10
RiskManagement
TBastogne,JRC-Ispra27-28Sep2017 2

SystemsEngineering
QibDGenesis GMP cGMP
QbD
(ICHQ8)Extensions
>1980 >1990 2002 2004 >2005
Historicalbackground
• Aeronautics&AutomativeIndustries:TotalQualityManagement,DesignforSix-Sigma• FDAofficialsrealizedthatbiologicsanddrugscouldalsostandtobenefitfromQbD.• Conceptpaperon21stCenturyGoodManufacturingPractices.• FDAproducedaguidancedocument:«PharmaceuticalcGMPsforthe21stCentury»• ICHpublishedtheGuidelinedocument:Q8(R2):PharmaceuticalDevelopment.• NowadaptationforBiomedicalDevices&AnalyticalMethods*
*S.Chatterjee,QbDConsiderationsforAnalyticalMethods-FDAPerspective,IFPACAnnualMeeting,Baltimore,Jan20133

QbDLifeCycle
Arisk-basedprojectmanagement:• 6maintasks• 6maindeliverables• 4go/nogotests
ProjectStart
Profile your Drug
IdentifyQuality
Attributes
Criticity Analysis
IdentifyRisk
Factors
Criticity Analysis
Determine Region of
Quality/Safety
EstablishControl Strategy
ModelQuality ?
ManageProduct Lifecycle
CQACritical Quality
Attributes
CPPCritical Process
Parameters
CMACritical Material
Attributes
DSDesign Space
PATProcess
Analytical Technology
ProjectEnd
Requirement Assessment
Product Formulation&
Process Management
QTPPQualitative
Target Product Profile
TBastogne,JRC-Ispra27-28Sep2017 4
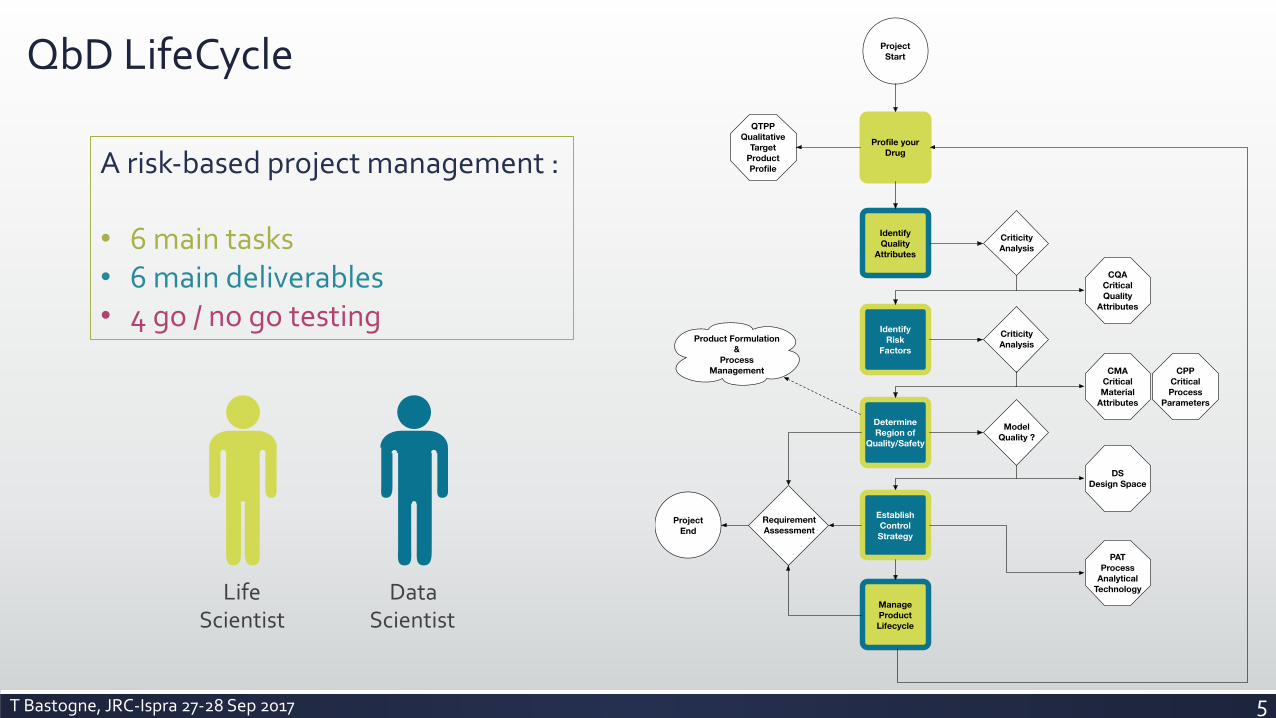
QbDLifeCycle
Arisk-basedprojectmanagement:• 6maintasks• 6maindeliverables• 4go/nogotesting
ProjectStart
Profile your Drug
IdentifyQuality
Attributes
Criticity Analysis
IdentifyRisk
Factors
Criticity Analysis
Determine Region of
Quality/Safety
EstablishControl Strategy
ModelQuality ?
ManageProduct Lifecycle
CQACritical Quality
Attributes
CPPCritical Process
Parameters
CMACritical Material
Attributes
DSDesign Space
PATProcess
Analytical Technology
ProjectEnd
Requirement Assessment
Product Formulation&
Process Management
QTPPQualitative
Target Product Profile
LifeScientist
DataScientist
TBastogne,JRC-Ispra27-28Sep2017 5
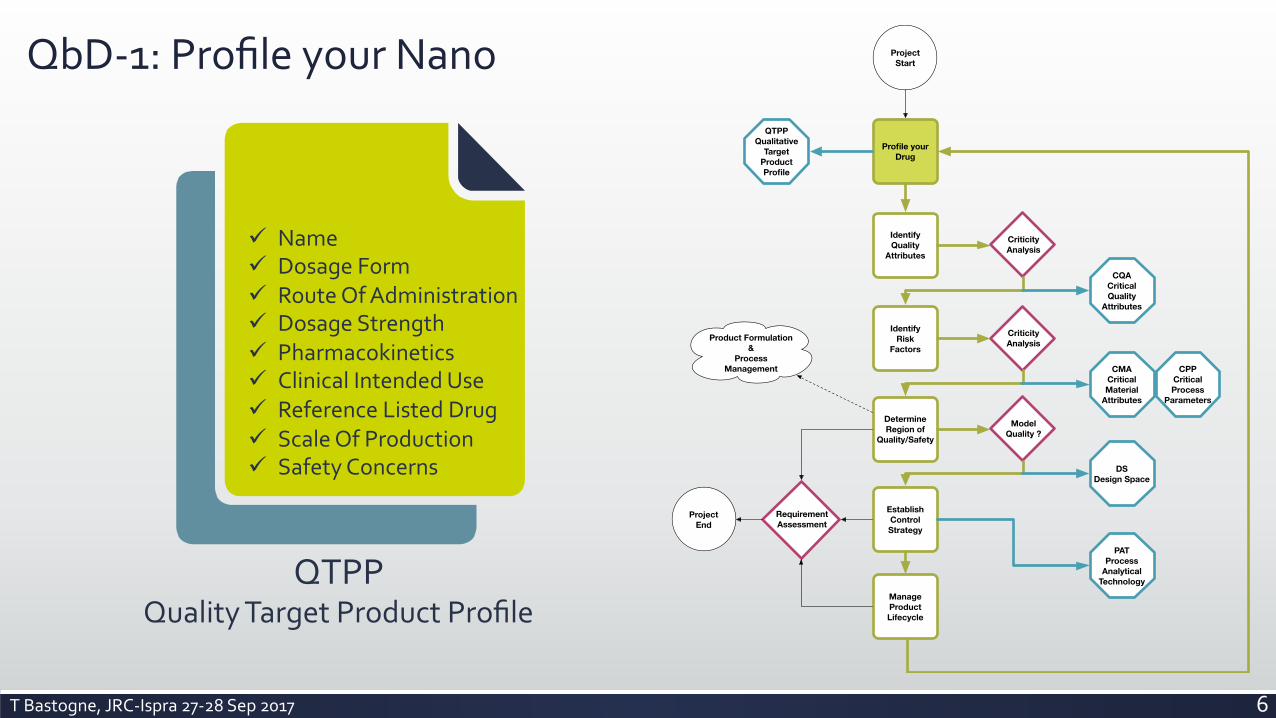
QbD-1:ProfileyourNano
QTPPQualityTargetProductProfile
ü Nameü DosageFormü RouteOfAdministrationü DosageStrengthü Pharmacokineticsü ClinicalIntendedUseü ReferenceListedDrugü ScaleOfProductionü SafetyConcerns
ProjectStart
Profile your Drug
IdentifyQuality
Attributes
Criticity Analysis
IdentifyRisk
Factors
Criticity Analysis
Determine Region of
Quality/Safety
EstablishControl Strategy
ModelQuality ?
ManageProduct Lifecycle
CQACritical Quality
Attributes
CPPCritical Process
Parameters
CMACritical Material
Attributes
DSDesign Space
PATProcess
Analytical Technology
ProjectEnd
Requirement Assessment
Product Formulation&
Process Management
QTPPQualitative
Target Product Profile
TBastogne,JRC-Ispra27-28Sep2017 6

QbD-2:QualityAttributes?
CriticalQualityAttributes?
TomeasurepotentialconsequencesweneedtodefinerelevantQAQA=physico-chemicalorbiologicalpropertytobecontrolledtoensuretogettheexpectedquality/safety/efficacyrequirement.
QA QA/CQA? CQA
LowRisk HighRisk
ProjectStart
Profile your Drug
IdentifyQuality
Attributes
Criticity Analysis
IdentifyRisk
Factors
Criticity Analysis
Determine Region of
Quality/Safety
EstablishControl Strategy
ModelQuality ?
ManageProduct Lifecycle
CQACritical Quality
Attributes
CPPCritical Process
Parameters
CMACritical Material
Attributes
DSDesign Space
PATProcess
Analytical Technology
ProjectEnd
Requirement Assessment
Product Formulation&
Process Management
QTPPQualitative
Target Product Profile
How?PriorRiskAnalysis(FailureMode&EffectAnalysis)
TBastogne,JRC-Ispra27-28Sep2017 7

QbD-3:Formulation&ProductionFactors?
24 BioProcess International JUNE 2010
a minimum number of experiments
varying all operating parameters simultaneously
experiments, operators, raw materials, or processes themselves
process parameters, unlike with one-factor-at-a-time experiments
key and critical process parameters contributing to identification of a design space, which helps to provide an “assurance of quality.”
Proper execution of DoE within a design space is safe under QbD in bioprocess industries because work within a design space is not considered a change (1). However, some pitfalls can lead to a poorly defined design space. They can come from unexpected results, failure to take account of variability (due to assay, operator, or raw material) within a process, and the choice of parameters and their ranges considered in an experimental study, as well as errors in statistical analysis (e.g., model selection, residual analysis, transformation of response). We present here some good industrial practices based on our experience, on literature for the application of a DoE approach in bioprocess industries, and on nonbiotechnological industrial approaches (e.g., the oil and chemical industries, in which DoE and similar statistical techniques have been applied for many years).
Setting “SMART” Objectives: It is always important before beginning experimentation to determine the objective of an experiment, and this is no different with DoE. Identifying objectives helps focus a team on its specific aims (scientific understanding of the task/problem in hand) over a period of time. It also helps indicate what resources are and assists in managing expectations from a study’s outcome (4). DoE studies in support of QbD are often a delicate balance between delivering defined, high-quality products and meeting predetermined time, labor, and financial constraints (5). Consequently,
Figure 1: Typical bioprocess with a complicated nest of parameters influencing the final drug product
Operator
Raw Materials
Inoculum
Fermentation
Separation
Extraction
Refolding
Purification
Diafiltration
FiltrationDrug
StirRate
GlucoseConcentration
CO2 Evolution
O2 Flow Rate
ActivityFlow Rate
Conductivity
Additives
pH
BufferConcentration
Residence Time
PostloadWash
pH
Flow Rate
Host CellProteins
Time TemperatureFermentation
MediaShaker
PositionInductionOD Volume
Pressure
Flow RateTemperature
Flow Rate Load Concentration
Column Height
Bed Height Resin LoadConcentration
pH ProteinCharacteristics
BufferConcentration
Stability
Quality
Cost
Purity
Figure 2: Failure mode and effect analysis (FMEA) output
Process Stage
Risk
Prio
rity
Num
ber (
RPN
)
Parameterswith high RPN scores (highrisk parameters)need furtherinvestigation
Parameters withlow RPN scores(low riskparameters)
Inoculum
Seed Fermento
r
Productio
n
Fermento
r
Separation Refold
Column #1
Column #2
Diafiltratio
n
Filtratio
n
Figure 3: Cause-and-effect (fishbone) diagram
Gradient Elution
Column #1PurityConcentrationYield
WashLoad
Equilibration
pHConcentration
ConductivitypH
Temperature
Temperature
Bed HeightVolume
pH
pH
Conductivity
Conductivity
Flow Rate
Flow Rate
CV
Start BufferEnd Buffer
Gradient Slope
Figure 4: Pareto analysis plot
Risk
Sco
re
300
200
100
0
Perc
ent
100
80
60
40
20
0
Parameters with>90% impact
Parameters with<10% impact (low risk)
Load
Concentra
tion
Conductivity
pH
Flow Rate
Bed Height
Column
Volume Others
CMACriticalMaterialAttributes
CPPCriticalProcessParameters
WhicharethemostinfluentfactorsthatcouldcausevariabilityofCQA?
ProjectStart
Profile your Drug
IdentifyQuality
Attributes
Criticity Analysis
IdentifyRisk
Factors
Criticity Analysis
Determine Region of
Quality/Safety
EstablishControl Strategy
ModelQuality ?
ManageProduct Lifecycle
CQACritical Quality
Attributes
CPPCritical Process
Parameters
CMACritical Material
Attributes
DSDesign Space
PATProcess
Analytical Technology
ProjectEnd
Requirement Assessment
Product Formulation&
Process Management
QTPPQualitative
Target Product Profile
How?DesignofExperimentsforFactorScreening
TBastogne,JRC-Ispra27-28Sep2017 8

QbD-4:DesignSpace?
CQA=f(CMA,CPP)
CMA
CPP
DesignSpace
ProjectStart
Profile your Drug
IdentifyQuality
Attributes
Criticity Analysis
IdentifyRisk
Factors
Criticity Analysis
Determine Region of
Quality/Safety
EstablishControl Strategy
ModelQuality ?
ManageProduct Lifecycle
CQACritical Quality
Attributes
CPPCritical Process
Parameters
CMACritical Material
Attributes
DSDesign Space
PATProcess
Analytical Technology
ProjectEnd
Requirement Assessment
Product Formulation&
Process Management
QTPPQualitative
Target Product Profile
How?DesignofExperimentsforResponseSurfaceModeling
TBastogne,JRC-Ispra27-28Sep2017 9

QbD-5:ControlStrategy?CM
A
CPP
Control?
Process
ProjectStart
Profile your Drug
IdentifyQuality
Attributes
Criticity Analysis
IdentifyRisk
Factors
Criticity Analysis
Determine Region of
Quality/Safety
EstablishControl Strategy
ModelQuality ?
ManageProduct Lifecycle
CQACritical Quality
Attributes
CPPCritical Process
Parameters
CMACritical Material
Attributes
DSDesign Space
PATProcess
Analytical Technology
ProjectEnd
Requirement Assessment
Product Formulation&
Process Management
QTPPQualitative
Target Product Profile
How?StatisticalProcessControl
TBastogne,JRC-Ispra27-28Sep2017 10

QbD-6:ProductLifeCycleManagement ProjectStart
Profile your Drug
IdentifyQuality
Attributes
Criticity Analysis
IdentifyRisk
Factors
Criticity Analysis
Determine Region of
Quality/Safety
EstablishControl Strategy
ModelQuality ?
ManageProduct Lifecycle
CQACritical Quality
Attributes
CPPCritical Process
Parameters
CMACritical Material
Attributes
DSDesign Space
PATProcess
Analytical Technology
ProjectEnd
Requirement Assessment
Product Formulation&
Process Management
QTPPQualitative
Target Product Profile
CMA
CPP
Control?
Process
How?PLMMethods(ProductLifeCycleManagement)
TBastogne,JRC-Ispra27-28Sep2017 11

InPractice?
12

Inpractice?
T.Bastogne,“Quality-by-designofnano-pharmaceuticals-Astateoftheart,”Nanomedicine:Nanotechnology,Biology,andMedicine.June2017.
• Bibliographicengine:WebofScience• Keywords:nano,quality-by-design&drugdelivery• Replication:every6months• 30identifiedarticlesbetween2007and2017
0
1
2
3
4
5
6
7
8
9
2007 2008 2009 2010 2011 2012 2013 2014 2015 2016
QdDArticlesinNanomedicine
ThisworkwassupportedbytheEuropeanUnionandtheERA-NETframeworkundertheEuroNanoMedIIprojectNanoBiT.
TBastogne,JRC-Ispra27-28Sep2017 13

Whereinpractice?
1. Asia(44%)2. USA(28%)3. Europ(15%)4. Africa&MiddleEast(13%)
AsiaUSA
EUMiddleEast
Africa
TBastogne,JRC-Ispra27-28Sep2017 14

1)QTPP
• Frequency:5/30(16.7%)• Since2015
Shirsat and Chitlange: Optimization of rizatriptan loaded chitosan nanoparticles: QbD approach
89Journal of Advanced Pharmaceutical Technology & Research | Jul-Sep 2015 | Vol 6 | Issue 3
Chitosan is nontoxic, biodegradable, biocompatible, hydrophilic, and it has antibacterial activity, protein affinity, positive polyanions and also approved as GRAS by the USFDA. Furthermore, it has been reported that the bioavailability of drug, proteins, and vaccines was raised by opening the tight junctions of epithelial cell layers and increasing the retention time of drug delivery locally using CS as polymer.[7,10-12] Ionic gelation method involves ionic cross-linking of amino groups of CS and phosphate groups of tripolyphosphate (TPP), to form spontaneous gelation in aqueous solution.[13,14] Many properties of CS nanoparticles such as surface morphology, entrapment, and release characteristics are highly related to formulation and process parameters, such as concentration and molecular weight of CS, pH and concentration of cross-linker agent, curing time, stirring time, and speed.[7,15] Quality by design (QbD) approach can be applied for better understanding of the process and formulation variables, which can lead to better and robust quality into the product assuring the target quality product profile. Based on risk assessment of process and formulation variables, design of experimentation (DoE) study need to conduct on critical parameters to establish certain ranges for critical parameters within certain range to obtain design space (DS).[16-20]
In present study, we aimed to develop RZT CS nanoparticles formulation using QbD approach to understand the effect of process and formulation variables on critical quality attributes (CQAs) of RZT CS nanoparticles and to establish DS with accepted Quality Target Product Profile (QTPP).
MATERIALS AND METHODS
Rizatriptan, CS was supplied as gift sample from Cipla Ltd. (Mumbai, India) and Central Institute of Fisheries Technology, Cochin, India (medium molecular weight, 95% deacetylated) respectively. All other excipients, solvents were of pharmaceutical and analytical grade.
Formulation of rizatriptan chitosan nanoparticlesNanoparticles were prepared using modified ionic gelation method,[21,22] where CS was dissolved in 1% acetic acid solution to a various concentration and TPP was dissolved in distilled water with various concentrations, based on the results of preliminary study. RZT was uniformly dispersed in TPP solution and this solution was added drop-wise to CS solution under continuous stirring at room temperature. RZT CS nanoparticles formed based on the principle of electrostatic attraction between positively charged primary amino groups on CS chains and charged polyanions (TPP). RZT CS nanoparticles were centrifuged at 6000 rpm for 30 min (Remi R-88). The supernatant liquid was separated and nanoparticles were redispersed in PBS at pH 6.8 and ultrasonicated for 5 min to disaggregate the CS nanoparticles. Three nanoparticles optimized batches,
were redispersed in deionized water containing 1% w/v mannitol as cryoprotectant, and lyophilized primarily for 12 h at −20°C and secondary for 36 h at − 54°C with vacuum pressure of 0.001 mbar using Christ freeze-dryer (Christ Alpha 1-2 LD). Nanoparticles were collected, kept in glass vials and stored in dessicator.
Optimization of rizatriptan chitosan nanoparticlesThe QTPP is an essential element of a QbD approach and forms the basis of design of the product. QTPP for RZT CS nanoparticles were presented in Table 1 considering the formulation and process to develop nanoparticles.
Risk assessmentInitial risk assessment of process parameters and formulation components of RZT CS nanoparticles was performed to identify critical parameters and components having a high-risk of impacting the drug product CQAs. High-risk parameters to the CQAs of RZT CS nanoparticles were further evaluated by performing experiments as per the DoE to reduce the risk.
Optimization using central composite designBased on risk assessment and preliminary studies, optimization of three high-risk parameters at more than 3 levels needed to identify main and interaction effect of selected parameters on responses with minimum number of runs. Central composite design (CCD) was selected for RZT CS nanoparticles with % CS (X1), % TPP (X2), and stirring speed (X3) at 3 levels and 2 more levels as star points (−α, +α) was selected as shown in Table 2. The obtained RZT CS nanoparticles suspensions were further evaluated for particle size, entrapment efficiency.
Optimization of design space and validation of modelDesign space was generated by setting acceptance criteria to CQAs. The 3 optimization formulations were prepared within DS and compared with predicted results of the responses and percentage error was calculated to validate the selected model.
Table 1: QTPP for RZT CS nanoparticlesProfile component Target JustificationDosage form Nanoparticles Novel dosage form for
targeted drug deliveryDosage design Sustained release
nanoparticlesFor long-term treatment of RZT
Particle size (nm) 350-650 Narrow distributionEntrapment efficiency (%)
>50 Higher entrapment is better for the nanoparticulate dosage form
Drug release (h) >48 To achieve sustained drug release for long period of time
RZT: Rizatriptan, QTPP: Quality target product profile, CS: Chitosan
[Downloaded free from http://www.japtr.org on Monday, September 05, 2016, IP: 80.215.3.68]
A.E.Shirsat&S.S.Chitlange,2015
International Journal of Nanomedicine 2016:11submit your manuscript | www.dovepress.com
Dovepress
Dovepress
1506
Zidan et al
Table 2 QTPP and CQA of target drug product, gel with polymeric nanoemulsified particles, for injection
QTPP of a gel with polymeric nanoemulsified particles
QTPP elements Target Justification
Dosage form Hydrogel Pharmaceutical equivalence requirement: same dosage form
Route of administration Injection Pharmaceutical equivalence requirement: same route of administration
Dosage strength % of drug substance (% w/w) Pharmaceutical equivalence requirement: same dosage strength
Dosage form design Polymeric nanoemulsified carriers incorporated
into hydrogelMatch reference-listed drug product
Pharmacokinetics Bioequivalent to reference-listed drug Match reference-listed drug productStability Shelf life not 24 months at room temperature Equivalent or longer shelf life compared to
reference-listed drug productDrug product quality attributes Physical attributes, identification, assay,
uniformity of content, degradation products, residual solvents, dissolution, microbiological quality, pH, and rheological behavior
Pharmaceutical equivalence requirement: fulfill the
same quality standards as reference-listed drug product
Container closure system Suitable container closure system that will support estimated shelf life and drug product integrity during the transport, Identical primary packaging as reference-listed drug product
Vials or prefilled syringes, similar with reference-
listed drug product, acceptable for the patient
Alternative methods of administration No None are listed on reference drug product labeling
CQAs of gel with polymeric nanoemulsified particles
Drug product quality attributes Target Is it a CQA? Justification
Physical attributesAppearance Color and shape acceptable
for the patientNo Color and shape are not directly related to the safety and
efficacy. Required for patient acceptability
Particle size and particle size distribution
Similar to reference-listed drug
Yes It might influence drug entrapment efficacy and capacity, as well
as drug release. It is critical for drug product efficacy and safety
Rheological behavior Conform to Ph. Eur. 7.0–2.2.10
Yes Required to demonstrate Q3 (same components in same concentrations with same microstructure)
pH Conform to Ph. Eur. 7.0–2.2.3
Yes Might influence drug product stability and hence its efficacy
and safety. This CQA can be effectively controlled by quality management system
Identification Positive for drug substance Yes Identification is critical for safety and efficacy, but this CQA can
be efficiently controlled by quality management system and will
be followed during dissolution studies. Formulation and process variables cannot influence identity
Assay 90%–110% of label claim Yes Assay variability will have influence upon safety and efficacy
Content uniformity Conform to USP 3 Yes Variability in content homogeneity and uniformity of content will affect safety and efficacy
Residual solvents Conform to ICH Q3C (R5) Yes Polymeric nanoemulsified particles manufacturing procedure
includes use of methanol. Its residual quantity is critical for safetyDegradation products Conform to ICH Q3B (R2) Yes Degradation products limit is critical for safety. Limit of individual
unknown degradation products must comply with ICH Q3B (R2). Limit of total degradation products is based on reference-listed drug product analysis near the expiry date
In vitro dissolution profile Match reference-listed drug product
Yes As the in vitro drug release is surrogate for in vivo performance, the target is to ensure similar dissolution profile compared to
reference-listed drug product (f2 50)Microbiological quality Conform to Ph. Eur.
7.0–5.1.4Yes Noncompliance of microbiological quality will have impact upon
safetyPreservative content 80%–110% from label claim Yes Required to ensure antimicrobial effectivenessEfficacy of antimicrobial preservation Conform to Ph. Eur.
7.0–5.1.3Yes Inefficiency of the preservative at declared storage conditions
might result in microbiological contamination and affect safetyContainer closure system Similar to reference-listed
drugNo Match reference-listed drug product. Required for patient
acceptabilityPackaging integrity No failure No Required for stability, efficacy, and safety
Note: Q3, the US Food and Drug Administration similarity definition of the generic drug had the same components in the same concentration with the same arrangement
of matter (microstructure) as the reference-listed drug. Abbreviations: QTPP, quality target product profile; CQAs, critical quality attributes; Ph. Eur., European Pharmacopoeia; USP, United States Pharmacopeia; ICH,
International Conference on Harmonization guidelines.
A.S.Zidan,2016
TBastogne,JRC-Ispra27-28Sep2017 15

2)CQASpecification
Size
Enca
psul
atio
n Ef
ficPo
lydi
sper
sity
Inde
xZe
ta P
oten
tial
Amou
nt o
f Rel
ease
Dis
solu
tion
Rat
eSt
abilit
yPr
oces
s Yi
eld
Emul
sific
atio
n R
ate
Form
PK e
ffici
ency
Turb
idity
Lag
time
Cyt
otox
icity pH
Moi
stur
eC
ryst
allin
ityEn
thal
pyPe
rmea
tion
Milli
ng T
ime
Aggr
egat
ion
Freq
uenc
y
020
4060
80
0%25
%50
%75
%10
0%
Cum
ulat
ive P
erce
ntag
e5mainCriticalQualityAttributes(70%)1. NPSize2. EncapsulationEfficiency3. PolydispersityIndex4. ZetaPotential5. AmountofRelease
TBastogne,JRC-Ispra27-28Sep2017 16
T.Bastogne,2017.

3)CMASpecification
Ingr
edie
nt C
onc.
2−In
gred
ient
s R
atio
Dru
g Lo
ad
Surfa
ctan
t Con
c.
Ingr
edie
nt T
ype
Surfa
ctan
t Typ
e
pH o
f Aq.
Pha
se
Size
Loa
d. P
artic
les
Freq
uenc
y
010
2030
0%25
%50
%75
%10
0%
Cum
ulat
ive P
erce
ntag
e
6CriticialMaterialAttributes>90%1. IngredientConcentration2. IngredientsRatio3. DrugLoad4. SurfactantConcentration5. IngredientType6. SurfactantType
TBastogne,JRC-Ispra27-28Sep2017 17
Bead
Size
Milli
ng R
ot. S
peed
Proc
essi
ng T
emp.
Soni
catio
n Ti
me
Stirr
ing
Rat
e
Aspi
ratio
n R
ate
Barre
l Tem
pera
ture
Flow
Hom
ogen
izat
ion
Pres
.
Inje
ctio
n R
ate
Pum
p Sp
eed
Scre
w S
peed
Freq
uenc
y
05
1015
0%25
%50
%75
%10
0%
Cum
ulat
ive P
erce
ntag
e
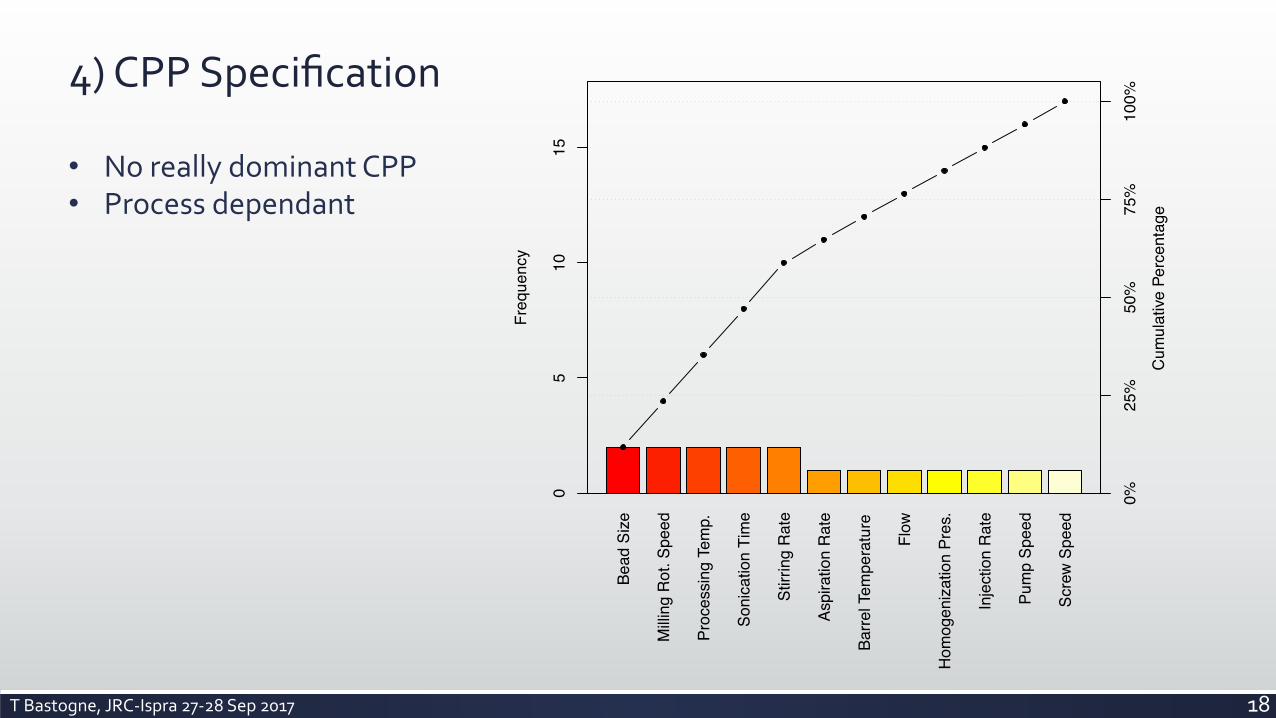
4)CPPSpecification
• NoreallydominantCPP• Processdependant
TBastogne,JRC-Ispra27-28Sep2017 18
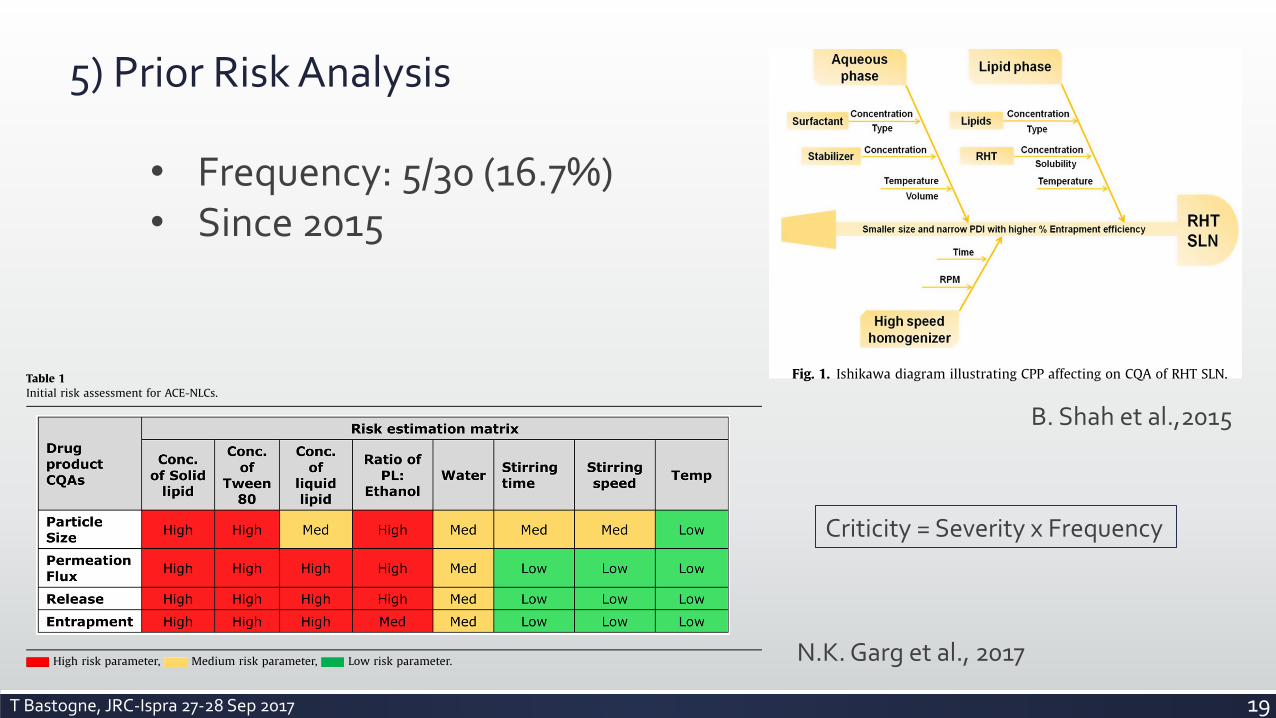
5)PriorRiskAnalysis
• Frequency:5/30(16.7%)• Since2015
2.5. Quality target product profile (QTPP) and risk analysis of RHT SLN
The QTPP is described as the quality properties that a drug pro-duct need to possess so as to fulfill the objectives set in target pro-duct profile as quantitative attributes. QTPP should furnish aquantitative surrogate to describe the aspects of clinical safetyand efficacy by determining the CQA, CPP and control strategy(ICH, 2009).
In case of RHT SLN, QTPP is a lower size and PDI with lipidic coreis expected to facilitate transport of drug across the nasal mucosalbarriers both into the cerebral tissues and systemic circulation.Lower PDI is to reduce aggregation of particle during long term sta-bility. Higher entrapment efficiency is to achieve higher drug load-ing in lipid matrix (Vora et al., 2013). The crucial step in riskassessment is to gather the entire responsible factor systematicallythat could influence the desired product quality. These factorswere categorized hierarchically using an Ishikawa diagram(Fig.1). The parameters summarized in Ishikawa diagram assistedin the identification of failure modes of SLN formulation.
2.6. Preliminary screening of lipid, stabilizer and HSH rpm
In DOE, preliminary screening is a crucial step for the selectionof CPP which affects CQA like size, PDI and % entrapment efficiency(%EE) of developed SLN. Preliminary screening of lipid, stabilizerand HSH rpm was carried out so as to obtain SLN of smaller size,narrow PDI and higher %EE. Based on solubility study, D: L andlipids were screened for optimization of final lipid. Further theselipids were taken and different batches of RHT SLN as shown inTable 2 were prepared by method described in Section 2.4 usingtween 80 (2% w/w) as surfactant and HSH at 10000 rpm forhomogenization time (HT) 10 min without probe sonication. Toscreen out lipid Batch nos. 1–3 (Table 2) were characterized forsize, PDI and %EE. After selection of final lipid, D: L, HSH rpm andtime were kept constant and the effect of stabilizer on CQA wasverified by formulating RHT SLN using surfactant alone (2% w/wtween 80, Batch no. 3, Table 2) and combination of surfactant withstabilizer (Batch no. 4 and 5, Table 2). Subsequently the effect ofhigher HSH rpm (Batch no. 6) on CQA was determined as shownin Table 2.
2.7. 33 factorial design
Based on preliminary experimental data, 33 factorial design wasselected for the optimization of RHT SLN where the effect of threeindependent variables or CPP viz., D: L (X1), surfactant concentra-tion (X2) and HSH time (X3) on CQA (Y1 = size, Y2 = PDI andY3 = %EE) was determined at three different levels (Table 3 and4). Compritol, tween 80 and Pol-188 were selected as lipid, surfac-tant and stabilizer respectively. HSH rpm (10000) and Pol-188 con-centration (1% w/w) were set as fix levels.
33 Factorial design was analyzed using Design expert software(Version 8, Stat-ease. Inc, USA) and the polynomial equation wasderived. The magnitude of coefficients in polynomial equation
have either positive sign, indicating synergistic effect or negativesign, indicating antagonistic effect. Best fitting experimental model(linear, two factor interaction, quadratic and cubic model) wastaken statistically on the basis of comparison of several statisticalparameters like coefficient of variation (CV), multiple correlationcoefficient (R2), adjusted multiple correlation coefficient (adjustedR2), predicted residual sum of square and graphically by 3Dresponse surface plot provided by Design Expert software. Thelevel of significance was considered at p-value < 0.05. The regres-sion analysis, linear regression plots (observed versus predictedvalue) and Pareto chart of the dependent variables were plottedusing MS-Excel.
2.8. Data optimization and model validation
The effect of each independent CPP on CQA was analyzed forestablishment of design space with the target of ensuring desiredproduct quality. Hence, 33 factorial design was applied for estab-lishment of design space to investigate the responses of processparameters on quality attributes of RHT SLN. The optimizationwas done on the basis of attaining lower particle size, PDI andhigher %EE using overlay plot (graphical) and desirability (numer-ical) criteria. In order to establish the reliability of developedmodel, check-point analysis was performed by taking two valida-tion batches viz., V1 and V2 (Table 4) whereby magnitude of errorbetween observed and predicted values was evaluated.
2.9. Effect of probe sonication on optimized RHT SLN
It is often sonication which brings about further reduction insize with narrow PDI. Sonication breaks coarse drops into nanodroplets and hence, it is responsible in obtaining smaller particlesize of SLN (Das et al., 2011). To evaluate the effect of probe soni-cation on size, PDI and %EE of RHT SLN, different trials were takenby varying amplitude and sonication time as shown in Table 5. Thefinal optimized formula with composition of RHT SLN is shown inFig.2.
2.10. Characterization of RHT SLN
For characterization, three batches of optimized RHT SLN wereformulated and they were characterized for physicochemical, mor-phological, diffusion and histopathological parameters as shownbelow.
2.10.1. Particle size, PDI and Zeta PotentialParticle size, PDI and zeta potential measurements were per-
formed by photon correlation spectroscopy using Zetasizer(Nano-ZS90, Malvern, Worcestershire, UK). Before measuring size,
Table 1Solubility study (n = 3).
Lipids Melting point (!C) Drug: lipid ratio(D: L)
1:2 1:3
Apifil 62–65 + ++Compritol 65–77 ++ +++GMS 55–60 ++ +++PA 52–55 ++ +++Stearic acid 69–70 + ++
+ Not clear, ++ Turbid, +++ Clear.
Fig. 1. Ishikawa diagram illustrating CPP affecting on CQA of RHT SLN.
56 B. Shah, D. Khunt, H. Bhatt et al. / European Journal of Pharmaceutical Sciences 78 (2015) 54–66
B.Shahetal.,2015
2.2.4. Pseudoternary phase diagramPseudoternary phase diagram was used to determine the
concentration of lipid, surfactant, water, on the border line of MEregion for the preparation of microemulsion (ME) (Fadda et al.,2013; Garg et al., 2016a). The lipid phase was heated to melt thesolid lipid, which is mixed with heated phospholipid ethanolicsolution mainly at the temperature of 55–60 !C. The lipid phaseand the surfactant phase (Smix) were heated simultaneously at thesimilar temperature i.e., 60 !C. At this temperature, a series ofcontinuous known amount of Smix and lipid were taken andsimultaneously titrated with aqueous phase and vice-versa withthe help of micro-syringe. After each addition, mixture was gentlystirred and then placed in a temperature controlled water bath.Titration was continued until the turbidity appears in the sample,weight percent of each (individual) components used in thetitration was calculated, and plotted in Gibbs phase triangle asboundary points. The entire phase diagram was mapped in thismanner by oil titration too (i.e., where oil acts as titrant).
2.2.5. Preparation of ACE-loaded NLCsNLCs were prepared by ME method, by selecting the net
composition of ME region obtained by the Pseudoternary phasediagram (Garg et al., 2016a). Lipid phase consisted of cetyl alcoholas solid lipid, Transcutol1P as liquid lipid (oil) and aqueous phaseconsists of water containing tween 80. Phospholipid (PL) wasdissolved in ethanol and ACE was dissolved in Transcutol1P. In theprocedure, CA was mixed with ethanolic solution of PL and heatedto 55–60 !C followed by addition of heated lipid oil (Transcutol1P).After proper mixing of hot lipid phase, hot water (heated at thesame temperature) was added into lipid mixture. At this stage,primary ME was formed. After stirring for 5 min, the above mixturewas added to 0.5% w/w poloxamer solution under continuoushomogenization. Homogenization was carried out at 8000 rpm for15 min using high shear homogenizer (Heidolph, Germany), andthe mixing was done by magnetic stirring (Remi, Mumbai, India)for 2–3 h at 500 rpm.
2.2.6. Systematic FbD optimization of ACE-NLCs as per theexperimental design
Diverse response variables were optimized using a 33 Box-Behnken Design (BBD). In this, the amount of CFAs i.e., Solid lipid(x1), Smix (X2) and liquid lipid (Lipid oil) (X3) were studied at the 3different levels i.e., "1 (low), 0 (intermediate) and +1 (high), whichare equidistant from each other. The center points (i.e., 0, 0, 0) werestudied in quintuplicate. All other formulation and processvariables were fixed during the study. All the studied 17experimental runs along their factor combinations are summa-rized in Supporting information (Supplementary data Table 1)
(Singh et al., 2011). As per the design all the prepared formulationswere investigated for particle size (nm), entrapment efficiency (EE)(%), release (%) and permeation flux (mg/cm2/h) as the responsevariables.
2.2.6.1. QbD-based optimization data analysis and validation ofQbD. The prepared NLCs were evaluated for response variableslike particle size, % EE, % release and permeation flux, andthereafter optimization data analysis was also carried out. Later,second-order quadratic polynomial model was selected formathematical modeling to carried out in search of possibility ofsignificant interaction(s) in the studied responses (Bhatia et al.,2013). The generated model from design was evaluated for variousparameters like coefficient of variation (CV), correlation coefficient(R2), adjusted correlation coefficient (adjusted R2), and predictedresidual sum of square were compared. The significance level wasfound to be highly significant (p < 0.05). The regression analysis,linear regression plots (observed versus predicted value) andPareto chart of the dependent variables were plotted. The 3D-response surface plots & 2D-contour plots were generated to carryout the response surface analysis (RSA), which were obtained byapplying Design Expert1 version 10.0.
Finally, the numerical optimization method using desirabilityfunction by “trading-off” of response variables (Garg et al., 2015a;Negi et al., 2014) was carried out for projection of optimumformulation. The location of the optimized formulation in thedesign space was marked with flag containing all the parameters ofthe formulation. Along with the optimized formulation thevalidation was also carried out by choosing 7 confirmatorycheck-points from the defined design space region and wereassessed for various CQAs, by constructing linear residual andcorrelation plots between the predicted as well as observedresponses and the% prediction error was also calculated.
2.2.7. Characterization of NLCs
2.2.7.1. Size, polydispersity index (PDI) and zeta potential. Theprepared NLCs formulations were studied with respect to theirparticle size, PDI and zeta potential by using Zetasizer Nano ZS90(Malvern Instruments, UK). An aliquot of NLCs suspension wasdiluted 10 times with distilled water. Samples were kept inpolystyrene cuvette and observed at a fixed angle of 90! at25 # 0.1 !C. The zeta potential of NLCs was determined by laserDoppler anemometry at 25 # 0.1 !C. The undiluted samples werekept in the electrophoretic cell with an electric field of 15.24 V/cm.
2.2.7.2. Evaluation of surface morphology. The surface morphologyof the prepared NLCs was evaluated with the help of Scanning
Table 1Initial risk assessment for ACE-NLCs.
High risk parameter, Medium risk parameter, Low risk parameter.
N.K. Garg et al. / International Journal of Pharmaceutics 517 (2017) 413–431 415
N.K.Gargetal.,2017
Criticity=SeverityxFrequency
TBastogne,JRC-Ispra27-28Sep2017 19
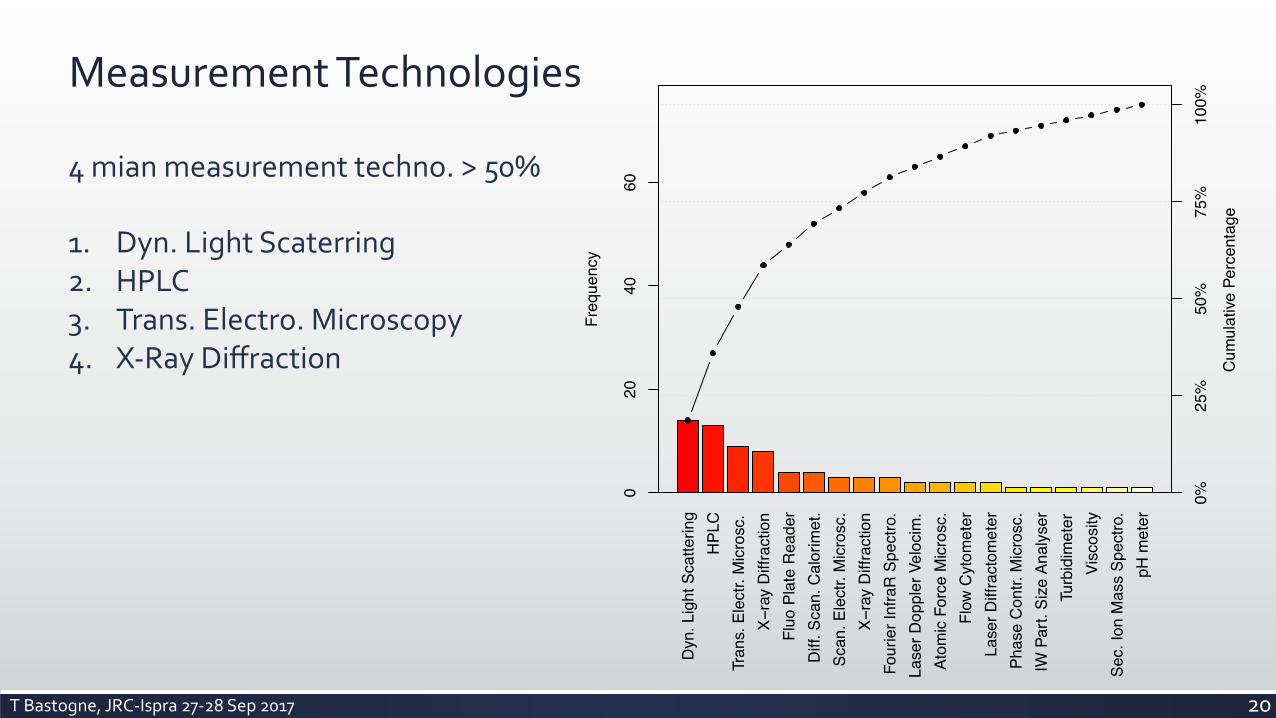
MeasurementTechnologies
Dyn
. Lig
ht S
catte
ring
HPL
CTr
ans.
Ele
ctr.
Mic
rosc
.X−
ray
Diff
ract
ion
Fluo
Pla
te R
eade
rD
iff. S
can.
Cal
orim
et.
Scan
. Ele
ctr.
Mic
rosc
.X−
ray
Diff
ract
ion
Four
ier I
nfra
R S
pect
ro.
Lase
r Dop
pler
Vel
ocim
.At
omic
For
ce M
icro
sc.
Flow
Cyt
omet
erLa
ser D
iffra
ctom
eter
Phas
e C
ontr.
Mic
rosc
.IW
Par
t. Si
ze A
naly
ser
Turb
idim
eter
Visc
osity
Sec.
Ion
Mas
s Sp
ectro
.pH
met
er
Freq
uenc
y
020
4060
0%25
%50
%75
%10
0%
Cum
ulat
ive P
erce
ntag
e
4mianmeasurementtechno.>50%1. Dyn.LightScaterring2. HPLC3. Trans.Electro.Microscopy4. X-RayDiffraction
TBastogne,JRC-Ispra27-28Sep2017 20

DesignofExperiments
• ManyinconsistenciesbetweenDoEmethodsandobjectives
• Agoodsoftwareisnecessarybutnotenough!Expertiseisneeded
• Confidenceoftheresultsrequirestoapplystrictlyvalidationprocedures.
• Only5/30papershavereallyimplementedacross-validationstep
Shirsat and Chitlange: Optimization of rizatriptan loaded chitosan nanoparticles: QbD approach
94 Journal of Advanced Pharmaceutical Technology & Research | Jul-Sep 2015 | Vol 6 | Issue 3
at its melting point at 178–180°C revealing the crystalline nature. CS thermogram reveals the amorphous nature with a peak around 75–80°C. Physical mixture of RZT, CS, and TPP showed less intense peak at the melting point of drug,
Table 6: Validation of design space of RZT CS nanoparticlesFormulation code
Composition (% w/v) Response Predicted value
Experimental value
SEX1 CS X2 TPP
21 2.74 3.68 Y1 - Particle size 565.58 570.24 1.33Y2 - Entrapment efficiency 62.08 63.14 1.03
22 3.30 2.83 Y1 - Particle size 422.42 437.21 2.62Y2 - Entrapment efficiency 64.28 63.78 −0.75
23 2.96 3.17 Y1 - Particle size 479.16 491.24 3.29Y2 - Entrapment efficiency 64.21 65.8 0.70
RZT: Rizatriptan, CS: Chitosan, TPP: Tripolyphosphate, SE: Standard error
Table 7: Accelerated stability results for RZT CS nanoparticlesBatch number
Entrapment efficiency* (% w/w) Particle size (nm) Zeta potential (mV) PDIInitial 3 months Initial 3 months Initial 3 months Initial 3 months
21 99.57±2.4 96.54±1.59 570.24 584.14 +33.56 +32.68 0.247 0.22622 101.52±2.3 98.14±2.45 437.21 448.75 +35.6 +34.81 0.256 0.21623 99.75±2.61 96.57±2.74 491.24 496.97 +32.43 +31.98 0.128 0.142*For entrapment efficiency of RZT loaded CS nanoparticles were weighed equivalent to RZT 25 mg. RZT: Rizatriptan, CS: Chitosan, PDI: Polydispersity index
Design-Expert® SoftwareFactor Coding: ActualOverlay Plot
Particle Size CI Low CI HighEntrapment Efficiency CI Low CI High
Design Points
X1 = A: ChitosanX2 = B: TPP
Actual FactorC: Stirring Speed = 900.00 1.32 2.16 3 3.84 4.68
0.32
1.16
2.00
2.84
3.68Overlay Plot
A: Chitosan (%)
B: T
PP (%
)
Particle Size: 350
Particle Size: 350
Particle Size CI: 350
Particle Size CI: 650
Entrapment Efficiency: 50Entrapment Efficiency CI: 50
Entrapment Efficiency CI: 67.15
6
Figure 8: Design space for rizatriptan loaded chitosan nanoparticles
intensity as compared to pure drug might be due to matrix formation with polymer. This indicates that there was no any interaction of drug and polymer in RZT CS nanoparticles.
Scanning electron microscopyFreeze – dried nanoparticles with mannitol as a cryoprotectant in powder formulation appears to be slightly spherical and rough [Figure 6] which could be due to CS as a natural polymer with less elasticity compared to synthetic polymer. SEM photographs showed CS nanoparticles adhered to mannitol particles, further optimization of freeze drying process may lead to free flowing nanoparticles.
Differential scanning calorimetryDifferential scanning calorimetric thermogram of pure drug RZT [Figure 7] showed a sharp endothermic peak
Figure 7: Differential scanning calorimetric thermograms for (a) rizatriptan (RZT), (b) chitosan (CS), (c) RZT + CS physical mixture, and (d) RZT CS nanoparticles
d
c
b
a
[Downloaded free from http://www.japtr.org on Monday, September 05, 2016, IP: 80.215.3.68]
2015-Shirsat
International Journal of Nanomedicine 2016:11 submit your manuscript | www.dovepress.com
Dovepress
Dovepress
1509
QbD study for nicotinamide polymeric nanoemulsified systems
Table 4 Results of multiple regression and ANOVA for prediction of the investigated responses
Factorsa Entrapment capacity (%)
Entrapment efficiency (%)
Particle size (nm)
PDI Zeta potential (mV)
% of drug released in 24 hours
Intercept 54.71 59.92 184.68 0.159 31.550 13.725X1
Estimate 3.65 2.05 54.10 0.019 8.417 0.025P-value 0.1161 0.0129 0.0196 0.4332 0.0092 0.9650
X2Estimate 11.89 0.04 18.97 0.003 1.333 0.825P-value 0.0057 0.9331 0.2068 0.9137 0.4107 0.2142
X3Estimate 0.87 1.00 43.13 0.033 6.733 0.258P-value 0.6376 0.0801 0.0355 0.2233 0.0171 0.6565
X4Estimate 2.21 1.23 13.20 0.023 4.683 2.042P-value 0.2771 0.0489 0.3454 0.3670 0.0441 0.0302
X5Estimate 0.60 2.27 7.97 0.001 3.217 1.508P-value 0.7439 0.0096 0.5485 0.9712 0.1050 0.0639
X6Estimate 6.55 0.50 35.87 0.014 2.883 2.175P-value 0.0294 0.2813 0.0561 0.5523 0.1313 0.0256
X7Estimate 2.70 1.96 41.08 0.011 1.100 3.908P-value 0.2040 0.0147 0.0402 0.6450 0.4889 0.0050
X8Estimate 2.56 0.10 14.92 0.016 1.517 1.325P-value 0.2222 0.8084 0.2961 0.5099 0.3575 0.0860
Analysis of varianceDF 8 8 8 8 8 8SS 2,608.02 191.50 102,978.02 0.030 1,944.723 347.433MS 326.00 23.94 12,872.30 0.004 243.090 43.429F-ratio 9.77 13.52 7.68 0.695 10.358 13.122Prob F 0.0436 0.0277 0.0406 0.6982 0.0402 0.0289R2 0.9630 0.9777 0.9534 0.6495 0.9650 0.9722
Notes: Bold values reflect significant factors that affect the corresponding response. aX1–X8 are Eudragit S100, HP- -CD, and drug loadings (mg), volumes of organic and aqueous phases (mL), ultrasonication time (s) and amplitude (%), and level of MgCl2 as a stabilizer (%), respectively. Abbreviations: ANOVA, analysis of variance; PDI, polydispersity index; DF, degree of freedom; SS, sum of squares; MS, mean of squares; F-ratio, model mean square divided by error mean square; Prob F value, probability of obtaining an F-ratio as large as what is observed; R2, coefficient of multiple determination for predicted versus
measured values.
Figure 3 Pareto charts of the main effects of variables on the investigated responses.Notes: X1–X8 are Eudragit S100, HP- -CD and drug loadings (mg), volumes of organic and aqueous phases (mL), ultrasonication time (s) and amplitude (%), and level of MgCl2 as a stabilizer (%), respectively.Abbreviations: HP- -CD, 2-hydroxypropyl- -cyclodextrin; PDI, polydispersity index.
3RVLWLYH�HIIHFW%OXH 1HJDWLYH�HIIHFW5HG
=HWD�SRWHQWLDO��P9�
����
±����
����
±����
±����
±����
±����
����
����
±����
±����
±����
±���
����
����
±����
'UXJ�UHOHDVHG�LQ���KRXUV����
(QWUDSPHQW�FDSDFLW\���� (QWUDSPHQW�HIILFLHQF\����
;�
;�
;�
;�
;�
;�
;�
;�
±����
����
±����
±����
±����
±����
±����
±����
����
����
±���
±����
±����
±����
±����
����
����
±���
����
±����
±����
±����
±����
±����
���
±����
����
±����
±����
±����
����
����
3DUWLFOH�VL]H��QP� 3',
2016-Zidan
TBastogne,JRC-Ispra27-28Sep2017 21

Andafter?
• TheDesignSpaceisnottheultimategoal.ThelastpartoftheQbDlifecyleistotallyforgotten.
• Nocontrolstrategy• Nocontinuousquality
management
• Difficultytoimplementon-linemeasurementtechnologies
• Anothercommunity:production&controlengineering
ProjectStart
Profile your Drug
IdentifyQuality
Attributes
Criticity Analysis
IdentifyRisk
Factors
Criticity Analysis
Determine Region of
Quality/Safety
EstablishControl Strategy
ModelQuality ?
ManageProduct Lifecycle
CQACritical Quality
Attributes
CPPCritical Process
Parameters
CMACritical Material
Attributes
DSDesign Space
PATProcess
Analytical Technology
ProjectEnd
Requirement Assessment
Product Formulation&
Process Management
?TBastogne,JRC-Ispra27-28Sep2017 22

Conclusion
• TheQuality-by-Designapproachismoreandmoreadoptedinthenano-communitymainlyinIndiaandUSA.
• Nevertheless,someimportantparts,e.g.controlstrategy&qualitymanagement,arestillignored.
• Statisticaltoolsexistbuttheyarenotalwaysusedcorrectlyàeducationaleffortisneeded.
• QbDsuccessreliesonthesynergisticrelationshipsbetweenchemists,physicists,biologists,statisticiansandengineers.
TBastogne,JRC-Ispra27-28Sep2017 23
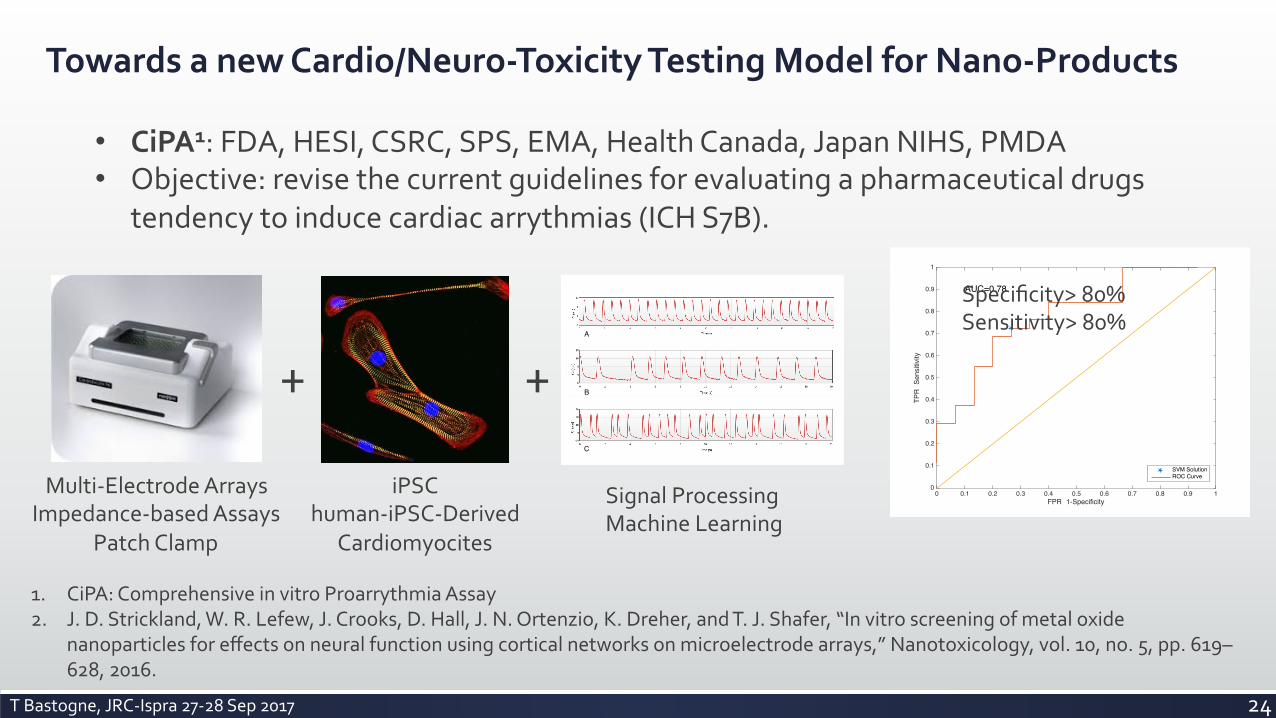
1. CiPA:ComprehensiveinvitroProarrythmiaAssay2. J.D.Strickland,W.R.Lefew,J.Crooks,D.Hall,J.N.Ortenzio,K.Dreher,andT.J.Shafer,“Invitroscreeningofmetaloxide
nanoparticlesforeffectsonneuralfunctionusingcorticalnetworksonmicroelectrodearrays,”Nanotoxicology,vol.10,no.5,pp.619–628,2016.
TowardsanewCardio/Neuro-ToxicityTestingModelforNano-Products
• CiPA1:FDA,HESI,CSRC,SPS,EMA,HealthCanada,JapanNIHS,PMDA• Objective:revisethecurrentguidelinesforevaluatingapharmaceuticaldrugs
tendencytoinducecardiacarrythmias(ICHS7B).
Multi-ElectrodeArraysImpedance-basedAssays
PatchClamp
iPSChuman-iPSC-Derived
Cardiomyocites
SignalProcessingMachineLearning
A
B
C
+ +
0 0.1 0.2 0.3 0.4 0.5 0.6 0.7 0.8 0.9 1FPR 1-Specificity
0
0.1
0.2
0.3
0.4
0.5
0.6
0.7
0.8
0.9
1
TPR
Sens
itivi
ty
AUC=0.78
SVM SolutionROC Curve
Specificity>80%Sensitivity>80%
TBastogne,JRC-Ispra27-28Sep2017 24
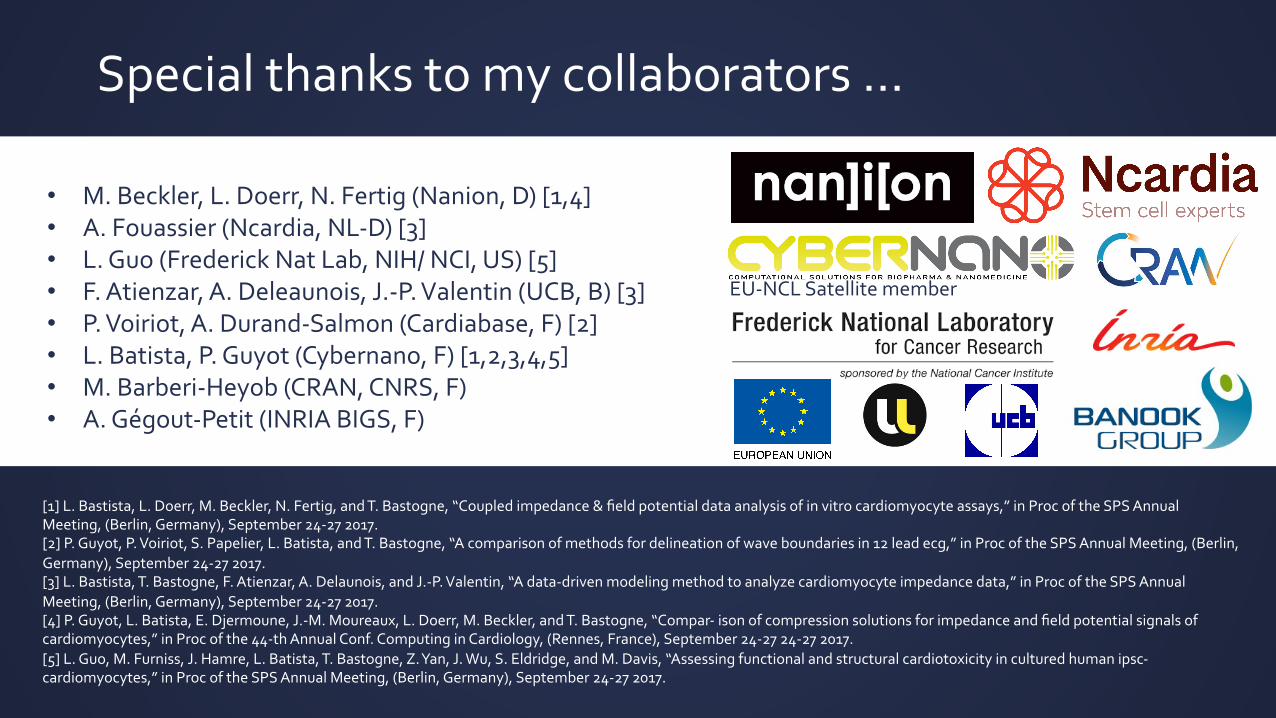
Specialthankstomycollaborators…
[1]L.Bastista,L.Doerr,M.Beckler,N.Fertig,andT.Bastogne,“Coupledimpedance&fieldpotentialdataanalysisofinvitrocardiomyocyteassays,”inProcoftheSPSAnnualMeeting,(Berlin,Germany),September24-272017.[2]P.Guyot,P.Voiriot,S.Papelier,L.Batista,andT.Bastogne,“Acomparisonofmethodsfordelineationofwaveboundariesin12leadecg,”inProcoftheSPSAnnualMeeting,(Berlin,Germany),September24-272017.[3]L.Bastista,T.Bastogne,F.Atienzar,A.Delaunois,andJ.-P.Valentin,“Adata-drivenmodelingmethodtoanalyzecardiomyocyteimpedancedata,”inProcoftheSPSAnnualMeeting,(Berlin,Germany),September24-272017.[4]P.Guyot,L.Batista,E.Djermoune,J.-M.Moureaux,L.Doerr,M.Beckler,andT.Bastogne,“Compar-isonofcompressionsolutionsforimpedanceandfieldpotentialsignalsofcardiomyocytes,”inProcofthe44-thAnnualConf.ComputinginCardiology,(Rennes,France),September24-2724-272017.[5]L.Guo,M.Furniss,J.Hamre,L.Batista,T.Bastogne,Z.Yan,J.Wu,S.Eldridge,andM.Davis,“Assessingfunctionalandstructuralcardiotoxicityinculturedhumanipsc-cardiomyocytes,”inProcoftheSPSAnnualMeeting,(Berlin,Germany),September24-272017.
• M.Beckler,L.Doerr,N.Fertig(Nanion,D)[1,4]• A.Fouassier(Ncardia,NL-D)[3]• L.Guo(FrederickNatLab,NIH/NCI,US)[5]• F.Atienzar,A.Deleaunois,J.-P.Valentin(UCB,B)[3]• P.Voiriot,A.Durand-Salmon(Cardiabase,F)[2]• L.Batista,P.Guyot(Cybernano,F)[1,2,3,4,5]• M.Barberi-Heyob(CRAN,CNRS,F)• A.Gégout-Petit(INRIABIGS,F)
EU-NCLSatellitemember
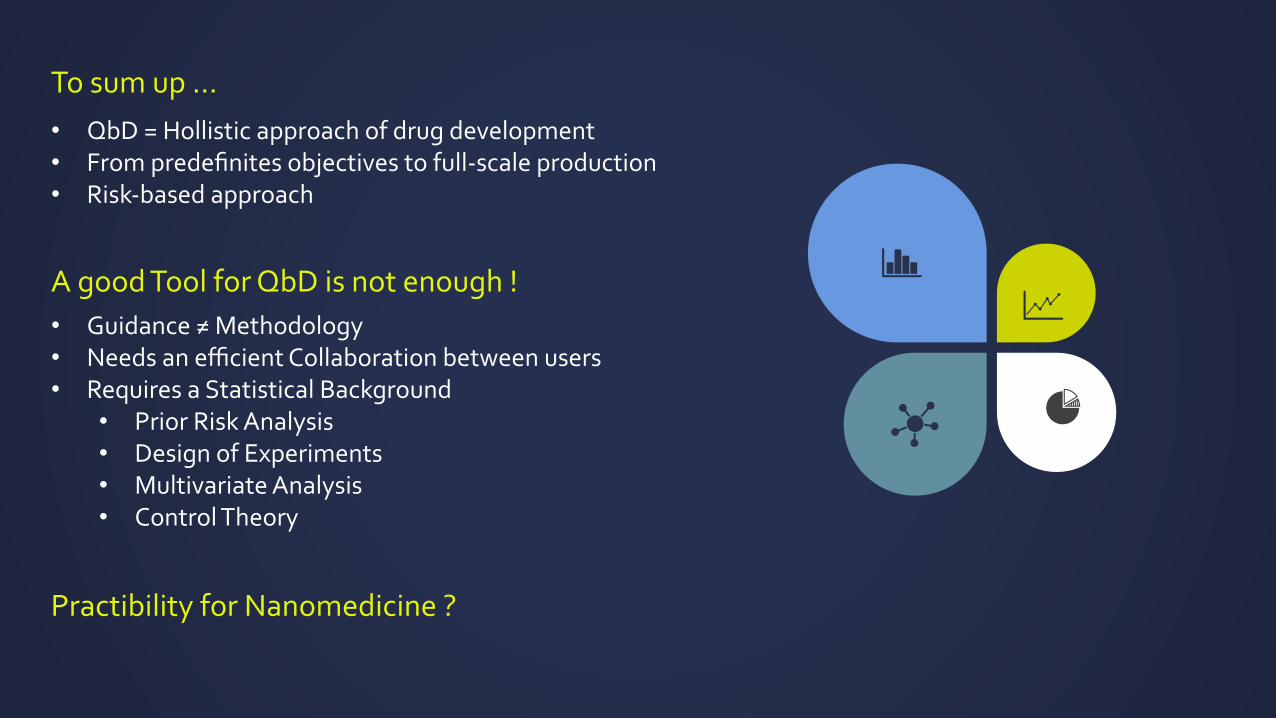
Tosumup…
• QbD=Hollisticapproachofdrugdevelopment• Frompredefinitesobjectivestofull-scaleproduction• Risk-basedapproach
AgoodToolforQbDisnotenough!
• Guidance≠Methodology• NeedsanefficientCollaborationbetweenusers• RequiresaStatisticalBackground
• PriorRiskAnalysis• DesignofExperiments• MultivariateAnalysis• ControlTheory
PractibilityforNanomedicine?