Beef Checkoff Program: Veal Issues Management & Veal Quality Assurance Fiscal Year 2011.
Upload
hoangduongCategory
view
219download
2
i
Commonwealth of Massachusetts Executive Office of Health & Human Services
Department of Mental Retardation
QUALITY ASSURANCE REPORT For
Fiscal Years 2006 and 2007
July 1, 2005 – June 30, 2007
Judy-Ann Bigby, M.D., Secretary
Elin M. Howe, Commissioner
Prepared by the Department of Mental Retardation
Commonwealth Medicine, E.K. Shriver Center
April 2008
Period Covering
Deval L.Patrick, Governor Commonwealth of Massachusetts Executive Office of Health and Human Services
Department of Mental Retardation
Office of Quality Management
In Partnership with the
University of Massachusetts Medical School
Center for Developmental Disabilities Evaluation and Research


1
Governor Deval L. Patrick
Timothy P. Murray Lieutenant Governor
The Commonwealth of MassachusettsExecutive Office of Health & Human Services
Department of Mental Retardation500 Harrison Avenue Boston, MA 02118 JudyAnn Bigby, M.D.
Secretary Elin M. Howe
April, 2008 Commissioner
Area Code (617) 727-5608 TTY: (617) 624-7590
Dear colleagues and interested citizens:
Enclosed is the Quality Assurance Report for FY 2006 and FY 2007 for the Department of Mental Retardation compiled in collaboration with the Center for Developmental Disabilities Evaluation and Research (CDDER) of the University of Massachusetts Medical School. Each year, the Department reports on outcomes important to the health, safety and quality of lives of the individuals we support. Information is gathered from the numerous quality assurance systems the Department has in place and is reported in an easy to understand format.
The Quality Assurance Report is a critical component of the Department’s quality management and improvement system. It allows us to look critically at areas where we can take pride as well as areas where we can direct our service improvement efforts. The Department’s four regional quality councils and one statewide quality council review and analyze the quality assurance reports and make recommendations regarding service improvement targets. As a result of reviewing the last Quality Assurance Report members of the councils developed two key service improvement targets upon which to focus particular attention and energy: improving employment outcomes for individuals and improving community membership and relationships.
It takes a great deal of commitment, both from our own staff and outside stakeholders, to review this information, ask critical questions and share recommendations for improvement. The Department and its stakeholders can be proud of the quality of supports provided each day to thousands of individuals. We must, however, always strive to improve services and supports. This report, the work of the quality councils, DMR staff, external stakeholders and our combined dedication to quality will serve us well in our dedication to improving the quality of life of individuals we support.
I remain committed to sharing information regarding how well we are doing in supporting the health, safety and quality of life of the individuals we serve. I trust that this report will be used to further our shared goals and continue an open, honest dialogue on behalf of individuals we serve.
Thank you


Executive Office of Health & Human Services Massachusetts Department of Mental Retardation
QUALITY ASSURANCE REPORT For Fiscal Years 2006 and 2007
April 2008
EXECUTIVE SUMMARY The Massachusetts Department of Mental Retardation (DMR) has published Annual Quality Assurance Reports since 2001. Since the FY2002/03 report, annual reports have been prepared in partnership with the University of Massachusetts Medical School’s Center for Developmental Disabilities Evaluation and Research (CDDER), an arm of the E.K. Shriver Center. These quality assurance and improvement reports are designed to share information regarding the quality of the services and supports provided by DMR with a broad audience, including persons receiving supports and their families, the service provider community, DMR personnel and the public at large. Information contained in the reports is extensive in nature and is derived from a wide variety of sources. It is intended to serve as a starting point for the collective review and analysis of service quality. The reports provide a very comprehensive look at the overall service/support system in Massachusetts and are used to help identify agency performance, progress in meeting goals and areas in need of improvement.
The current report, like reports covering fiscal years 2002-2005, is structured around outcomes that have been established as important indicators of system quality and performance:
1. People are supported to have the best possible health. 2. People are protected from harm. 3. People live and work in safe environments. 4. People understand and practice their human and civil rights. 5. People’s rights are protected. 6. People are supported to make their own decisions. 7. People use integrated community resources and participate in everyday community
activities. 8. People are connected to and are valued members of their community. 9. People gain and maintain friendships and relationships. 10. People are supported to develop and achieve goals. 11. People are supported to obtain work. 12. People receive services from qualified providers.
Each of these 12 outcomes has a variety of measures that are based on information and data that is routinely collected and analyzed by the department. The report uses easy-to-read charts and graphs to facilitate the review of findings. It also incorporates color-coded arrows to identify trends.
Findings for fiscal year 2006 were generally positive. Comparison of performance with FY 2005 shows that 37 measures experienced little or no change from 2005, suggesting relative stability in the service/support system. Seven (7) measures showed improvement (+10%) and three (3)
i

2006/2007 Quality Assurance Report
were suggestive of possible improvement (slightly less than the 10% criterion) from levels achieved in the prior year. In contrast, only four (4) measures suggested a decline in performance/quality. A comparison of FY 2007 with FY 2006 suggests slightly lower levels of performance with 32 measures showing no or little change, nine showing negative change and three (3) suggestive of possible negative change (slightly less than the 10% criterion). Compared to the prior year, fiscal year 2007 experienced only three measures showing improvement
No.
Mea
sure
s (+10%). These differences in type of change are illustrated below.
Type of Change in Quality Measures FY 2006 and FY 2007
40 37
35 32
30
25
20
15
910 7
45 3 3 3 32
0
No Positive Possible Negative Possible Change Change Positive Change Negative
2006 2007
Some selected HIGHLIGHTS for fiscal years 2006 and 2007 include the following findings:
• Individuals served by DMR continue to receive physical and dental examinations at a higher rate than the average for their peers in other state DD systems. Women served by DMR appear to have gynecological exams at about the same rate as their peers in other states.
• There was a slight increase in the number and rate of reported medication occurrences in FY 2007. The increases noted for 2007 reverse a trend toward fewer medication related incidents found in prior years. FY 2007 also experienced an increase in the need for medical intervention related to medication occurrences, including 7 cases that required hospitalization.
� Trends in the actual number of abuse/neglect (A/N) investigations, the number of substantiated complaints and the A/N rate continues to suggest that individuals served by DMR may be experiencing less abuse and neglect. Substantial relative (percentage)
ii

2006/2007 Quality Assurance Report
reductions are present between FY05 and FY06 for most of the top 10 types of substantiated findings.
� A high percentage of providers are following hiring procedures to prevent individuals with criminal records from working with persons served by DMR. Provider compliance with CORI requirements improved in FY06 but did experience a slight decrease in FY07 compared to the prior three years. Lack of records and issues related to 5- and 10- year disqualification requirements appear to be the major causes of CORI violations.
� When concerns are raised regarding past or potential abuse/neglect, providers take acceptable corrective and preventive action more than 95% of the time. These rates have increased slightly from FY03.
� The introduction of a new and more robust incident reporting system is allowing DMR to analyze incident patterns and trends in a much more sophisticated manner. Because of the major differences between the new HCSIS and older systems for collecting incident data direct comparisons with prior years are not possible. Preliminary analysis of 2007 incident data suggests that a majority of all reported incidents are associated with unexpected hospitalization and ER visits and physical altercations.
• The vast majority of individuals reviewed by the DMR Survey and Certification process for both 2006 and 2007 live and work in safe and secure environments. Almost all individuals who were reviewed during this time period are able to safely evacuate (98%) and possess knowledge on how to properly respond to an emergency situation (94%).
• Most individuals appear to be provided with less intrusive interventions prior to the use of more restrictive procedures. A somewhat lower percentage of individuals have been provided with all the necessary steps for informed consent prior to the use of a restrictive procedure.
• The amount of emergency restraint across the DMR system was reduced during 2006 and 2007. This decrease was related to less restraint being used in community settings; within DMR facilities restraint use increased. The percentage of persons restrained in facilities dropped in FY 2006 but increased again in FY 2007.
• National Core Indicator survey results suggest substantial improvement for Massachusetts on almost all measures of choice and control. In 2006 Massachusetts exceeded the national state average for 8 of the 9 measures associated with choice and control.
• About 90% of all individuals in programs reviewed by the DMR Survey and Certification process use basic community resources whereas only 70% appear to engage in community activities that allow them to connect with members of their communities. NCI data suggest slight improvement in the use of community resources and involvement in community activities.
• There is a large difference in how much people earn based upon the type of employment support they receive. The highest wages and number of hours worked are associated with individual employment. The lowest wages are present for sheltered employment. Over the past few years there has been very little growth in the average monthly wages earned by people in DMR funded employment programs. Over 90% of individuals who work in an
iii

2006/2007 Quality Assurance Report
individual supported employment setting earn at least the minimum wage compared to only about 3% who work in sheltered or facility-based employment settings.
• Half of the people receiving work/day supports participate in facility-based employment at least some of the time. Over time the number of people served in sheltered employment has increased.
• A very high percentage of providers in the community services system are achieving high levels of licensure. In FY07, 96% of providers attained a full 2-year license, and only 4% were assigned a 1-year license with conditions. About 75% of those providers reviewed each year between 2005 and 2007 achieved certification in all six quality of life areas.
• However, a higher percentage of providers surveyed received citations during FY06 and FY07 compared to prior years. In fact, since 2003 there has been a steady increase in the percentage of providers who receive survey citations. The average number of citations per provider (for those cited) increased in FY07, reversing a positive trend present since 2003.
The publication of Annual Quality Assurance Reports, including this one for fiscal years 2006 and 2007, represents a commitment to open government and to sharing information about agency performance with the public. This commitment will enhance the ability of stakeholders to better guide efforts to improve services and supports provided by the Commonwealth to individuals with developmental disabilities. Overall the findings contained in this report suggest that the DMR system is stable, strong and showing improvement in a number of important areas. Findings also suggest that there are areas where improvement initiatives may be needed to enhance the quality of services and the quality of life for Commonwealth citizens served by DMR.
iv

2006/2007 Quality Assurance Report
DMR Quality Assurance Report for FY06 and FY07
TABLE OF CONTENTS
Topic Page
INTRODUCTION 1
OUTCOMES & INDICATORS 2
DATA SOURCES 3
HOW TO REVIEW THE DATA 4
HEALTH 7
PROTECTION FROM HARM 23
SAFE ENVIRONMENTS 41
PRACTICE HUMAN AND CIVIL RIGHTS 47
RIGHTS ARE PROTECTED 51
CHOICE AND DECISION-MAKING 61
COMMUNITY INTEGRATION 69
RELATIONSHIPS/FAMILY CONNECTIONS 76
ACHIEVEMENT OF GOALS 82
WORK 86
QUALIFIED PROVIDERS 94
APPENDIX A: Summary of Outcomes and Indicators 102
APPENDIX B: Summary of Data Sources 105
APPENDIX C: Summary of Findings: Statewide Quality 108Outcomes
v

2006/2007 Quality Assurance Report
Listing of Tables and Figures
TABLES Table Title PageNo.
1 Support for Healthy Lifestyle: FY 2003-2007 8
2 Wellness and Healthy Lifestyle Indicators for the DMR Compared to 9the General Population: 2006
3 Prevalence of Weight Issues 9
4 Percentage of Persons Receiving Annual Physical Exams: FY 2003- 11 2007
5 Percentage of Persons Receiving Routine Dental Care: FY 2003 – 2007 12
6 Comparison of DMR and General Population for Dental Visits within 12Past Year: 2006
7 Medication Occurrence Reports: FY 2003 – 2007 14
8 Percentage of MORs by Cause: FY 2003 – 2007 15
9 No. and Percentage of MOR Hotlines: FY 2003 – 2007 16
10 4 Year Trend in Hotlines Resulting in Hospitalization: FY 2004 to 17FY 2007
11 Action Required Reports: FY 2003-2007 18
12 Medication Investigations: FY 2003 – 2006 19
13 Investigations for Denial of Medical Treatment/Medical Neglect: 20 FY 2003 – 2006
14 Findings re: Substantiation of Denial of Medical Treatment and Medical 21Neglect: FY 2003 – 2006
15 No. of Abuse/Neglect Investigations, Percent and Rate Substantiated: 24FY 2003 – 2006
16 Changes in the No. of Substantiated Complaints for the Top 10 Leading 26Types of Substantiated Abuse/Neglect: FY 2003 – 2006
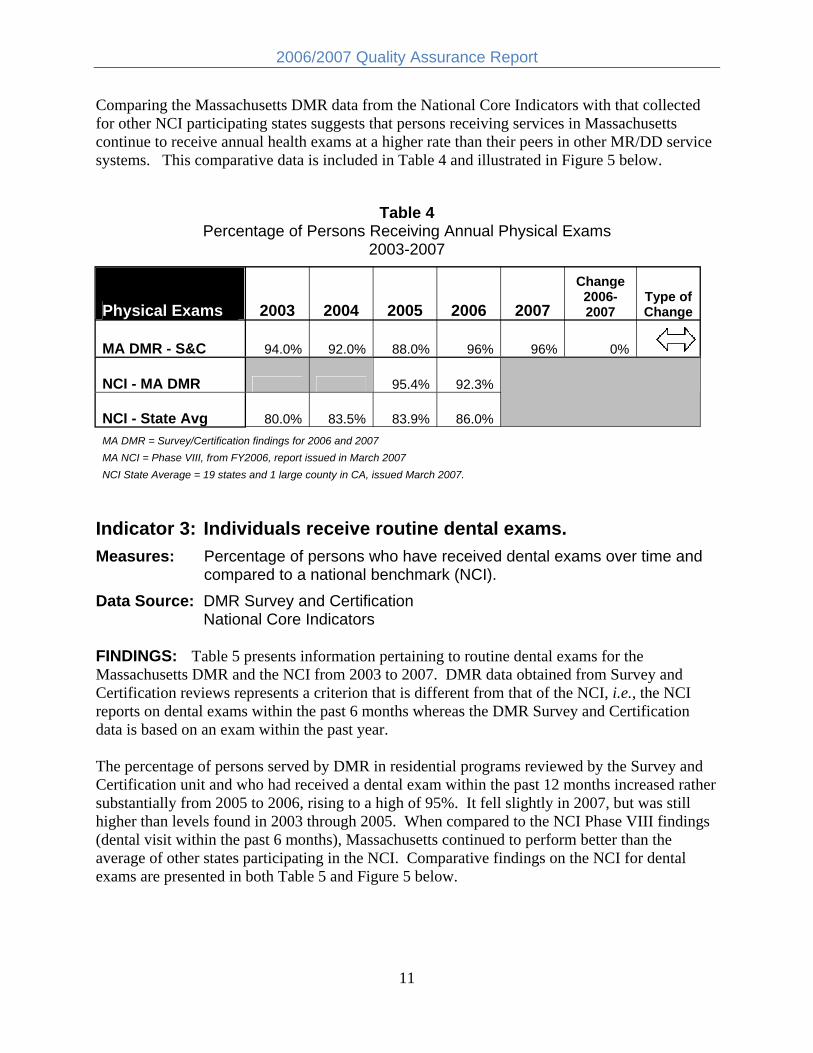
17 Summary of 5-Year Trends in CORI Audits: FY 2003 – 2007 30
vi

2006/2007 Quality Assurance Report
Table Title PageNo. 18 Summary of Causes of CORI Violations: FY 2003 – 2007 32
19 Listing of all Causes for CORI Violations: FY 2006 – 2007 32
20 Corrective Actions Taken for Concerns about Mistreatment: 33FY 2003 – 2007
21 Preventive Actions Taken for Concerns about Mistreatment: 34FY 2003 – 2007
22 No., Percent and Rate of Critical Incidents: FY 2003 – 2006 36
23 No. Critical Incident Reports by Type: FY 2003 – 2006 38
24 No. of Reported Incidents for FY 2007 based on the New HCSIS 39System
25 Top 5 Incident Categories in FY 2007 40
26 No. and Percent of Persons Who Live and Work in Safe Environments: 42FY 2003 - 2007
27 NCI Safety Indicators: 2006 43
28 Action Required Reports for Environmental Issues: FY 2003 - 2007 44
29 Percentage of Persons Able to Safely Evacuate: FY 2003 - 2007 44
30 Action Required Reports for Evacuation Issues: FY 2003 - 2007 45
31 No. and Percentage of Persons Who Know What to do in an 46Emergency: FY 2003 - 2007
32 No. and Percentage of Persons Who Exercise Their Rights: FY 2003 - 48 2007
33 No. and Percentage of Persons Who Receive the Same Treatment as 49Other Employees (Employment Programs Only): FY 2003 - 2007
Percentage of Persons Experiencing Respectful Interactions 34 Comparison of Massachusetts DMR with National Core Indicators: 49
2003 – 2007
35 No. and Percentage of Persons with Less Intrusive Interventions Used 52First: FY 2003 - 2007
vii

2006/2007 Quality Assurance Report
Table No. Title Page
36 No. and Percentage of Persons with Restrictive Interventions who Provided Informed Consent: FY 2003 - 2007 53
37 No. and Percentage of Persons Able to File Complaints: FY 2003 - 53 2007
38 Restraint Utilization for Persons in Facilities and Community Settings: FY 2003 - 2007 54
39 Average No. Restraints per Person: FY 2003 - 2007 57
40 Percent Who Choose Daily Schedule - Survey and Certification Reviews and NCI: 2003 – 2007 62
41 Percent Who Control Important Decisions - Survey and Certification Reviews and NCI: 2003 – 2007 63
42 Percent Who Choose Where They Work - Survey and Certification Reviews and NCI: 2003 – 2007 64
43 Percent Who Choose Support Staff - Survey and Certification Reviews and NCI: 2003 – 2007 65
44 Changes in NCI Findings re: Choice and Control - Massachusetts DMR: 2005 and 2006
65
45 Comparison of MA DMR and National State Average on Phase VIII NCI Measures re: Choice and Control: 2006 66
46 Use of Community Resources - 5 Year Trends in Survey and Certification Findings: FY 2003 – 2007 70
47 Comparison of 2005 and 2006 NCI for Massachusetts: Community Resource Use 71
48 Comparison of Phase VIII NCI Findings for Massachusetts and the National State Average for Measures of Community Resource Use 71
49 Community Involvement - 5 Year Trends in Survey and Certification Findings: FY 2003 – 2007 73
50 Comparison of 2005 and 2006 NCI for Massachusetts: Community Resource Use
74
Comparison of Phase VIII NCI Findings for Massachusetts and the 51 National State Average for Measures of Community Involvement and 74
Activity
viii

2006/2007 Quality Assurance Report
Table No. Title Page
52 Percentage of Persons Supported to Maintain Relationships: FY 2003 - 2007 77
53 Percentage of Persons Supported to Gain New Relationships: FY 2003 - 2007 78
54 Percentage of Persons Educated about Intimacy and Sexuality: FY 2003 - 2007 78
55 Comparison of 2005 to 2006 Responses for Massachusetts and NCI Questions re: Relationships 80
56 Comparison of Massachusetts with the National State Average - Phase VIII NCI Questions re: Relationships: 2006 80
57 Percentage of Persons Who Develop Goals: FY 2003 - 2007 83
58 Percentage of Persons with Access to Resources to Accomplish Goals: FY 2003 - 2007 83
59 Comparison of 2005 and 2006 Massachusetts NCI for Questions Related to Achievement and Access 84
60 Comparison of Massachusetts with the National State Average Phase VIII NCI Questions re: Achievement and Access: 2006 84
61 Average Hourly Wages by Type of Employment: FY 2003 - 2007 87
62 Average Hours of Work per Month by Type of Job Support: FY 2003 - 2007 89
63 No. and Percentage of People Earning at least the Minimum Wage By Type of Employment Support: FY 2004 - 2007 90
64 No. People Working by Employment Setting in Employment Supports Contracts: FY 2003-2007 91
65 Structure of DMR Licensure and Certification Process Beginning in April 2004 95
66 No. and Percentage of Providers by Level of Licensure: FY 2005 - 96 2007
67 Percentage of Providers by Level of Certification: FY 2005 - 2007 97
68 Summary of Citations: FY 2003 - 2007 98
69 Percentage of Citations by Type: FY 2003 - 2007 101
ix

2006/2007 Quality Assurance Report
FIGURES Figure Title Page
No. 1 Relationship between Outcomes, Indicators and Data 3
2 Symbols Used to Illustrate Type of Change 4
3 Summary of Trends for Health Indicators and Measures: FY 2006- 7 2007
4 NCI Healthy Lifestyle Measures 10
5 NCI Measures Related to Health Access: MA DMR Compared to the 13 National Average and Range for Phase VIII NCI (2006-2007)
6 MOR Rates for FY 2003 – 2007 14
7 Percentage of MORs by Cause: FY 2006 and 2007 15
8 5 Year Trend in MOR Hotlines: FY 2003 – 2007 16
9 No. of Health/Medication Action Required Reports: FY 2003 – 2007 18
10 No. of Substantiated Medication Investigations: FY 2003 – FY 2007 19
11 No. Substantiated Investigations for Denial of Medical 20Treatment/Medical Neglect: FY 2003 – 2006
12 Leading Causes for Substantiated Denial of Medical 22Treatment/Medical Neglect : FY 2003 – 2006
13 Summary of Trends for Protection from Harm Indicators and 23Measures: FY 2006 – 2007
14 Four Year Trend in the Rate (n/1000) of Substantiated Abuse/Neglect 25Investigations: FY 2003 – 2006
15 Trends in the 5 Most Common Types of Substantiated Abuse/Neglect: 27FY 2003 – 2006
16 Percent Change for the Top 10 Types of Substantiated Findings for 28 Abuse/Neglect between 2005 and 2006
17 Percentage of Providers with No CORI Violations: FY 2003 – 2007 29
18 Average No. CORI Violations per Provider Audited: FY 2003 – 2007 30
x

2006/2007 Quality Assurance Report
Figure No.
Title Page
19 Average No. Violations per Provider - Only for those Providers with Violations: FY 2003 -2007 31
20 5 Year Trends for Corrective Action re: Concerns about Mistreatment: FY 2003 – 2007 34
21 5 Year Trend for Preventive Action re: Concerns about Mistreatment: FY 2003 – 2007 35
22 Comparison of Incident Rates: FY 2005 – FY 2006 37
23 Summary of Trends for Safe Environments Indicators and Measures: FY 2006 – 2007 41
24 Comparison of Massachusetts with the National State Average and Range (High and Low) on NCI Measures of Safety: 2006 43
25 Distribution of Action Required Reports for FY 2006 45
26 Distribution of Action Required Reports for FY 2007 45
27 Summary of Trends for Human and Civil Rights Indicators and 47 Measures: FY 2006 – 2007
28 Percent of Persons Experiencing Respectful Interactions: Comparison of DMR Survey and Certification Findings with Phase 50 VIII NCI Results for Massachusetts and the National State Average
29 Summary of Trends for Rights Are Protected Indicators and Measures: FY 2006 – 2007 51
30 Percent Population Restrained - Combined Facilities and Community: FY 2003 - 2007 55
31 Trends in Percent of Population Restrained in Facilities vs Community Programs: FY 2003 - 2007 56
32 Total No. of Emergency Restraints Utilized in DMR: FY 2003 – 2007 58
33 Trends in Total No. of Restraints Used in DMR Facilities: FY 2003 – 2007 58
34 Trends in Total No. of Restraints Used in Community Programs: FY 2003 – 2007 59
xi

2006/2007 Quality Assurance Report
Figure Title Page No.
35 Average Annual No. of Restraints per Person Restrained - Facility vs 60Community: FY 2003 – 2007
36 Summary of Trends for Choice & Decision-making Indicators and 61Measures: FY 2006 – 2007
37 Comparison of Massachusetts to the State Average and Range 67Phase VIII NCI Measures of Choice re: Routine and Money
38 Comparison of Massachusetts to the State Average and Range 67Phase VIII NCI Measures of Choice re: Residence and Work
39 Comparison of Massachusetts to the State Average and Range 68Phase VIII NCI Measures of Choice re: Staff
40 Summary of Trends for Community Integration Indicators and 69Measures: FY 2004 – 2005
41 5 Year Trends in Use of Community Resources: FY 2003 – 2007 70
Comparison of Massachusetts to the State Average and Range: 42 72 Phase VIII NCI Measures of Community Resource Use
43 5 Year Trends in Community Involvement: FY 2003 – 2007 73
Comparison of Massachusetts to the State Average and Range: 44 75 Phase VIII NCI Measures of Community Involvement
Summary of Trends for Relationships and Family Connections: 7645 2006 – 2007
46 Comparison of Indicators for Relationships: FY 2003 - 2007 79
Comparison of Massachusetts Performance to the State Average and 47 Range on the Phase VIII National Core Indicators Questions re: 81
Relationships: 2006
Summary of Trends for Achievement of Goals Indicators and 8248 Measures: FY 2006 – 2007
Comparison of Massachusetts with the National State Average and 49 Range on the Phase VIII National Core Indicators Questions re: 85
Achievement and Access: 2006
50 Summary of Trends for Work Indicators and Measures: FY 2006 – 86 2007
xii

2006/2007 Quality Assurance Report
Figure No.
Title Page
51 Changes in Average Hourly Wages by Type of Job Support: FY 2003 88 - 2007
52 Changes in Monthly Hours Worked by Type of Job Support: FY 2003 89 - 2007
53 Percentage of Persons Earning at Least Minimum Wage by Type of Employment Support: FY 2004-2007 90
54 Four Year Trend in the Number of People Served by Type of Employment Support: FY2003-2007 92
55 Summary of Trends for Qualified Providers - Indicators and Measures: FY 2006 - 2007 94
56 Percentage of Providers by Level of Licensure: FY 2007 96
57 Percent of Providers with No Citations: FY 2003 - 2007 99
58 Average No. Citations per Provider - Providers with Citations: 100 FY 2003 – 2007
59 Average No. Citations per Provider - All Providers Surveyed: 100 FY 2003 – 2007
xiii


Executive Office of Health & Human Services Massachusetts Department of Mental Retardation QUALITY ASSURANCE REPORT
2006 and 2007 April 2008
INTRODUCTION The 2006/2007 Quality Assurance Report combines new data for two fiscal years that can be used to evaluate the quality of services and supports provided by the Massachusetts Department of Mental Retardation (DMR) and help guide the development of quality improvement targets and goals. The data and information contained in this report include the most recently completed fiscal years (FY 2006: July 2005 through June 2006 and FY 2007: July 2006 through June 2007).
As in previous reports, the basic structure and format for the presentation of information uses the same set of quality outcomes originally developed by DMR in March of 2001. These outcomes reflect what a broad base of stakeholders identified as critically important for the people who are supported by the department and that form a foundation for evaluating agency performance and progress toward meeting established strategic objectives.
A description of these outcomes and their associated indicators and data sources is contained in Appendix A and a summary listing is presented to the right.
The first Quality Assurance Report was published in December of 2001. It focused primarily on health, safety and human rights issues. The reports for FY 2002, 2003, and 2004 added information related to choice and control, community integration, relationships and work.
All of the Quality Assurance Annual Reports since 2003 derive
QUALITY OUTCOMES
.
� Health � Protection from Harm � Safe Environments �
Rights � Protection of Rights � Decision-making & Choice �
Membership � Relationships � Achievement of Goals
� Work � Qualified Providers
reflect what is important for people and form the foundation for evaluating progress toward meeting DMR’s strategic objectives
Practice Human & Civil
Community Integration &
1

2006/2007 Quality Assurance Report
information from a variety of quality assurance systems and databases (see Appendix B for a description of the databases utilized for this report). As noted in the past, these reports are only intended to be a starting point in the collective review and analysis of service quality. It is extremely important to recognize that the data provided in this report represents an opportunity to point out areas where the department is doing well as well as areas where improvements are needed. It is also important to keep in mind that data is but one source of information about quality and should not be taken out of context. Premature conclusions about what the information conveys should be avoided. Data should only be used as one component of an analytical and probative process, not as a singular basis for decision making.
As noted in all previous reports, quality assurance and improvement is a shared and ongoing responsibility – both for those within DMR as well as all of our external partners. Because of this the department has established regional and statewide Quality Councils that include a broad representation of stakeholders (self-advocates, family members, providers and DMR staff). These councils are designed to assist the department to identify strategic quality improvement targets and help monitor performance over time. Use of the data and information contained in this – and earlier – reports serves as an essential ingredient in helping make the review and feedback from the Quality Councils focused, meaningful and useful. In addition, in March 2007 DMR expanded its Central Office Risk Management Committee to provide an ongoing mechanism for the review of data generated from DMR’s web-based incident management system. Reports developed by this committee are integrated into the work of the Quality Councils.
OUTCOMES & INDICATORS The data that forms the basis for this report is drawn from a wide variety of quality assurance processes in which the department is routinely engaged. These quality assurance processes allow for continuous review, intervention and follow-up on issues of concern in a timely manner. Additionally, the aggregation of information in this report facilitates the identification and analysis of important patterns and trends and allows for a more objective evaluation of performance over time. Such integration of information represents an important strength of the quality assurance system in that no one process or data set is used in isolation to draw any firm conclusions, but rather, conclusions flow from convergence of information obtained from many different perspectives.
In the pages that follow, report chapters are based on each of the following major outcomes:
1. Health: People are supported to have the best possible health. 2. Protection from Harm: People are protected from harm. 3. Safe Environments: People live and work in safe environments. 4. Practice Rights: People understand and practice their human and civil rights. 5. Rights Protected: People’s rights are protected. 6. Choice and Decision Making: People are supported to make their own decisions. 7. Community Integration: People use integrated community resources and participate in
everyday community activities, and, people are connected to and are valued members of their community.
8. Relationships/Family Connections: People gain/maintain friendships and relationships.
2

OUTCOME
Indicator Measure/Data
Measure/Data
Indicator Measure/Data
Measure/Data
2006/2007 Quality Assurance Report
9. Achievement of Goals: People are supported to develop and achieve goals. 10. Work: People are supported to obtain work. 11. Qualified Providers: People receive services from qualified providers.
Information regarding each of the identified outcomes is presented in the form of indicators and their associated measures or data. The relationship between outcomes, indicators and measures is illustrated below in Figure 1. As can be seen, each of the outcomes will have one or more indicators or statements regarding how that outcome is evaluated. Each of the indicators, in turn, will have one or more specific objective sets of data that help determine whether or not the criteria contained in the indicator are being met. A description of the data sources is contained in Appendix B.
Figure 1 Relationship between Outcomes, Indicators & Data
Each Outcome has one or more Indicators.
OUTCOME
Indicator Measure/ Data
Measure/ Data
Indicator Measure/ Data
Measure/ Data
Each Outcome has oneor more Indicators.
Each Indicator has one orEach Indicator has one or more measures based onmore measures based on objective data.objective data.
DATA SOURCES As noted above, the Quality Assurance Report derives its information from a wide variety of different sources, including:
Survey and Certification
National Core Indicators Medication Occurrence Reporting System Investigations
Incident Management System Restraint Reporting
Data based on the number of individual surveys conducted during each fiscal year for persons 18-yrs of age and older served in settings that are licensed and/or certified by DMR. The number of individual surveys will vary depending upon whether the indicator is measured for all supports or for residential or day/employment supports only.
Data reported by the NCI initiative that includes over half of all the U.S. state MR/DD systems. Data is derived from face to face interviews with consumers.
Data based on the number and distribution of Medication Occurrence reports provided by over 173 service/support providers and 2,447 Medication Administration Program registered sites (as of FY 2007).
Data regarding complaints filed and substantiated by the Disabled Persons Protection Commission or DMR for persons served by DMR who 18-yrs of age and older.
Data based on the number and type of critical incident reports filed in each of the fiscal years. In FY 2007 the Home and Community Services Information System (HCSIS) replaced the existing system as the primary incident reporting database.
Data based on the number of restraints used during each of the fiscal years.
3

2006/2007 Quality Assurance Report
Employment Report Data based on a point in time study conducted annually byproviders offering employment supports.
Data from a variety of external sources is included where benchmarks to the general Various External Reports population provide a helpful context for better understanding information specific to DMR.
External benchmarks are included primarily in the sections of the report that address health.
HOW TO REVIEW THE DATA As noted above, information is presented in sections based on the major outcomes. The first page of each section states the associated indicators (important predictors of the outcome) and presents a brief summary of findings including arrows in the last column that illustrate the trends present between 2005 and 2006 and between 2006 and 2007. Arrows pointing upward indicate an increase in the measure. Arrows pointing down indicate a decrease, and arrows pointing left-right indicate a stable trend (no meaningful change). Colors and “+” or “-“ signs are used to illustrate whether or not the trend is positive or negative: green indicates the change is positive, red indicates it is negative. White represents a neutral trend (no change) or relatively minor change. Green (+) or Red (-) arrows indicate that the change was +10%. White arrows are used to illustrate a potential trend, i.e., some change of interest was present but was less than the +10% criteria. See Figure 2 for a description of the symbols.
Figure 2 Symbols Used to Illustrate Type of Change
TYPE OF CHANGE
Positive Increase
Negative Increase
Positive Decrease
Negative Decrease
Neutral Stable Trend
Potential Trend
SYMBOL
+
-
+
-
The first section for each outcome is immediately followed by a more detailed review of each indicator and its related measures. These sections include a variety of tables and graphs that, in most instances, will reference data for a five-year period (fiscal years 2003, 2004, 2005, 2006 and 2007). Narrative provides a very brief explanation of findings and trends. At the end of each major section there is a simple “plain language” summary of the major findings entitled What Does this Mean?
4

2006/2007 Quality Assurance Report
Special Note: Readers are cautioned to use the information contained in this report as only one avenue for conducting a thorough and complete assessment of quality and progress toward improvement in the services and supports provided by DMR. More in-depth analyses should always be conducted and probative questions explored before drawing any definitive conclusions with respect to patterns and trends.
NATIONAL CORE INDICATORS The National Core Indicators (NCI) is a nation-wide effort to provide standardized data regarding the quality of services and supports provided by state DD systems from the consumer’s perspective. Approximately half of all the state DD systems in the United States participate. Because the evaluation process is the same across states, valuable comparative benchmark data is available to help individual states assess their quality and performance relative to other state systems.
NCI data for Massachusetts is available for both 2005 and 2006. Therefore, in addition to reviewing comparative benchmarks related to other states, this year’s QA report also provides Massachusetts-specific comparisons across two years. In doing so it allows for an analysis of change (both positive and negative). NCI data is included in various sections of the report based on its applicability to strategic outcomes.
DATABASE CHANGES This report covers the period from July 1, 2005 through June 30, 2007. During this time period several changes to different components of DMR’s data systems were implemented. These changes were designed to enhance and improve the Department’s ability to provide detailed data on various components of its service delivery system, including but not limited to reporting on minor and major incidents. While these changes represent improvements to data collection capabilities, they have made cross-year comparisons inappropriate for certain indicators, particularly for those associated with the incident reporting system.
DMR has re-designed and fully implemented a Department of Mental Retardation Information System (DMRIS). The system has two basic components. The first is client information system, known as the Meditech system. The second is a web-based incident management system known as the Home and Community Services Information System (HCSIS). Full implementation of both systems statewide was completed in July, 2006. The HCSIS system enables the Department to report on data specifically pertaining to incidents, restraints, medication occurrences and deaths in a more detailed fashion. Data collected through these new systems are included where applicable and in some instances are reported separately from “older” systems data since they are not directly comparable. The DMR Survey and Certification system has also been enhanced. Major changes took effect in April, 2004. As a result of this change, the processes of licensure and certification were separated. Providers are now licensed based on their adherence to essential health, safety and human rights safeguards. Additionally, they are certified based on the combination of their
5

2006/2007 Quality Assurance Report
performance on essential safeguards and the quality of their supports in other life domains including community integration, relationships, choice/control and growth and accomplishments. During FY 2005 a number of providers were licensed and certified utilizing the revised system. Other providers, not scheduled for a routine review, maintained the certification status they received under the previous system. Fiscal Years 2006 and 2007 represent the first complete years under the new system. Longer term trends analyses are therefore not available.
6

2006/2007 Quality Assurance Report
HEALTH OUTCOME: People are supported to have the best possible health. Indicators: 1. Individuals are supported to have a healthy lifestyle.
2. Individuals get annual physical exams. 3. Individuals get routine dental exams. 4. Individual’s medications are safely administered. 5. Serious health and medication issues are identified and
addressed.
RESULTS: The quality of health-related services as evaluated using five major indicators and eight specific measures is summarized below in Figure 3. Four of the measures remained relatively unchanged from prior years and two experienced improvement in both FY 2006 and 2007. The number of Action Required Reports (issues identified during a licensure/certification review that pose a risk to the health and safety of an individual) related to health and medication issues increased in 2006 but then fell by 18% in 2007. “Hotlines” (serious medication occurrence reports) increased in both 2006 and 2007. There were fewer investigations related to medication and medical neglect in 2006 than in 2005.
Figure 3 Summary of Trends for Health Indicators and Measures
FY 2006-2007
OUTCOME Indicator Measure Change
FY05-FY06 Change
FY06-FY07
Health - people are supported to have the best possible health. 1. Healthy Lifestyle Percent Receive Support
2. Physical Exams Percent Receive Annual Exams
3. Dental Exams Percent Receive Annual Exams
4. Safe Medication MOR No. and Rate
- -Percent/No. Hotlines
No. Health/Med Action Required - + 5. Issues Identified and Addressed
Reports No. Substantiated Medication Investigations + NA* No. Substantiated Denial of Treatment Investigations
+ NA*
Direction of Arrow = increase, decrease, stable *Note: At the time of report preparation there were a relatively large Green = positive trend (+) no. of open investigations for FY2007. Consequently, change trends Red = negative trend (-) are provided above only for 2005-2006. White = slight change/neutral trend
7

2006/2007 Quality Assurance Report
In addition, when compared to both general population and other state DD system benchmarks, persons served by the Massachusetts DMR appear to have better access to health related services, use tobacco products less and have fewer concerns regarding weight. However, they may be less physically active.
OUTCOME: People are supported to have the best possible health. Indicator 1: Individuals are supported to have a healthy lifestyle. Measures: Percentage of persons who receive support to eat healthy foods and
exercise on a regular basis (who live in settings that received a DMR survey during the fiscal year).
Data Source: Survey and Certification
FINDINGS: Over the past five years almost all individuals reviewed during Survey and Certification reviews have been found to be receiving necessary support to promote a healthier lifestyle. These findings have remained remarkably consistent, with 99% performance on this measure for both FY06 and FY07. These results are presented below in Table 1.
Table 1 Support for Healthy Lifestyle
FY 2003 - 2007
Healthy Lifestyles 2003 2004 2005 2006 2007
Change 2006 2007
Type of Change
No. People Reviewed 1000 1118 1314 1621 1397 Percent with Support for Healthy Lifestyle 98% 98% 98% 99% 99% 0%
General Population and Developmental Disabilities Benchmarks Comparative data related to general wellness and healthy lifestyle indicators from both the National Core Indicators (NCI) and Centers for Disease Control (CDC)1 suggest that individuals served by the Massachusetts DMR continue to have fewer unhealthy lifestyle behaviors than the general population, but may exhibit higher rates of weight control problems and physical inactivity when compared to their peers in other state DD systems.
Comparison to the General Population. As can be seen in Table 2 below, fewer DMR consumers smoke/use tobacco than adults in the general U.S. or Massachusetts populations. In addition, weight appears to be reported as less of a problem (not obese or overweight) for adults served by DMR than reported by the general population (although the latter statistic is more specific and based on actual body/mass index calculations). On the other hand, self reports
1 Benchmarks are provided only for very general comparative purposes since data is derived from different sources. Data for the general population is based on different questions and methods of data collection than that presented for the DMR. Data is not risk adjusted for age, disability or morbidity. Data for the general MA and US population benchmarks are from the Centers for Disease Control and Prevention (CDC), Behavioral Risk Factor Surveillance System (BRFSS), available at: www.cdc.gov/brfss/index.htm. Massachusetts DMR data in this section is from the Phase VIII National Core Indicators (NCI) report, available at: www.hsri.org/nci/.
8

2006/2007 Quality Assurance Report
suggest that the general population may be slightly more physically active than the individuals served by the Massachusetts DMR.
Table 2 Wellness and Healthy Lifestyle Indicators for the DMR
Compared to the General Population 2006
Tobacco, Exercise & Weight
MA DMR NCI
MA General
Pop
U.S. General
Pop Use Tobacco 7.7% Smoke 17.8% 20.1% Physically active 73.1% Partic in phys activities 78.9% 77.4% Weight not concern 59.6% Not overweight (BMI) 38.2% 44.5%
Comparison to the DD Benchmarks. The National Core Indicators (NCI) provides more direct benchmarks since it includes survey findings for individuals with developmental disabilities who are being served by over 25 state DD systems. Table 3 and Figure 4 below provide direct comparisons for the Massachusetts DMR population compared to the average for those states that participated in the Phase VIII NCI survey. As can be seen, while persons served by the MA DMR may use tobacco products to a lesser extent than their peers in other states, they may be less physically active and have greater concerns about weight (overweight and/or underweight).
Table 3 Prevalence of Weight Issues
Use NCI Healthy Physically Weight is Tobacco Lifestyles Inactive Concern Products
MA DMR NCI 26.9% 40.4% 7.7%
State Avg NCI 22.4% 32.5% 8.9% Data from 2006/07 NCI Phase VIII Report issued March 2007
The results for Massachusetts along these three dimensions of healthy lifestyle are illustrated in Figure 4 compared to the national average and the range (highest and lowest percentages from participating states). This illustration suggests that MA falls somewhat in the middle range for healthy lifestyle indicators on the NCI. It is important to note that for the data presented in both Table 3 and Figure 4 lower percentages reflect generally “healthier” lifestyles.
9

2006/2007 Quality Assurance Report
Figure 4 NCI Healthy Lifestyle Measures
Per
cent
"Yes
" 60%
50%
40%
30%
20%
10%
0%
40.4%
26.9%
7.7%
Physically Weight is Use Tobacco Inactive Concern Products
i
MA NCI State Avg NCI High NCI Low Low er s better
WHAT DOES THIS MEAN? Almost all individuals served in programs that are reviewed by the DMR Survey and Certification process are receiving support to achieve a healthier lifestyle. A very low percentage of individuals served by DMR use tobacco products. When compared to peers in other states, persons in the MA DMR system may be less physically active and have greater concerns about weight.
Indicator 2: Individuals receive annual physical exams. Measure: Percentage of persons who receive annual physical exams over time
and compared to a national benchmark (NCI). Data Source: DMR Survey and Certification
National Core Indicators
FINDINGS: The extent to which individuals receive an annual physical exam by their health care provider is a simple measure of access to and receipt of basic health care. As can be seen in Table 4, during both 2006 and 2007 96% of the individuals included in the DMR Survey and Certification process received an annual physical exam. This represents an increase from 2005.
10
2006/2007 Quality Assurance Report
Comparing the Massachusetts DMR data from the National Core Indicators with that collected for other NCI participating states suggests that persons receiving services in Massachusetts continue to receive annual health exams at a higher rate than their peers in other MR/DD service systems. This comparative data is included in Table 4 and illustrated in Figure 5 below.
Table 4 Percentage of Persons Receiving Annual Physical Exams
2003-2007
Physical Exams 2003 2004 2005 2006 2007
Change 20062007
Type of Change
MA DMR - S&C 94.0% 92.0% 88.0% 96% 96% 0%
NCI - MA DMR 95.4% 92.3%
NCI - State Avg 80.0% 83.5% 83.9% 86.0% MA DMR = Survey/Certification findings for 2006 and 2007 MA NCI = Phase VIII, from FY2006, report issued in March 2007 NCI State Average = 19 states and 1 large county in CA, issued March 2007.
Indicator 3: Individuals receive routine dental exams. Measures: Percentage of persons who have received dental exams over time and
compared to a national benchmark (NCI). Data Source: DMR Survey and Certification
National Core Indicators
FINDINGS: Table 5 presents information pertaining to routine dental exams for the Massachusetts DMR and the NCI from 2003 to 2007. DMR data obtained from Survey and Certification reviews represents a criterion that is different from that of the NCI, i.e., the NCI reports on dental exams within the past 6 months whereas the DMR Survey and Certification data is based on an exam within the past year.
The percentage of persons served by DMR in residential programs reviewed by the Survey and Certification unit and who had received a dental exam within the past 12 months increased rather substantially from 2005 to 2006, rising to a high of 95%. It fell slightly in 2007, but was still higher than levels found in 2003 through 2005. When compared to the NCI Phase VIII findings (dental visit within the past 6 months), Massachusetts continued to perform better than the average of other states participating in the NCI. Comparative findings on the NCI for dental exams are presented in both Table 5 and Figure 5 below.
11

2006/2007 Quality Assurance Report
Table 5 Percentage of Persons Receiving Routine Dental Care
2003 – 2007
Dental Exams 2003 2004 2005 2006 2007 Change
2006-2007 Type of Change
MA DMR - S&C 88.0% 87.0% 86.0% 95% 93% -2%
NCI - MA DMR 69.7% 64%
NCI - State Avg 51.0% 53.5% 52.0% 53% NCI criteria is exam every 6 months. DMR S&C criteria is exam every 12 months.
Table 6 provides additional benchmarks regarding access to and receipt of dental services. As can be seen, a higher percentage of individuals receiving support from programs evaluated by the Survey and Certification process receive dental services than for either the Massachusetts or U.S. general populations.2 This difference has increased slightly from that present in prior years.
Table 6 Comparison of DMR and General Population for
Dental Visits within Past Year 2006
Annual Dental Visit MA DMR
(S&C) MA
Gen Pop U.S.
Gen Pop
Percent Dental Visit in past 12 months 95% 78% 70%
Gynecological Exams for Adult Women. The NCI also reports on the percentage of adult women who have had a gynecological exam within the past 12 months. Phase VIII results suggest that the MA DMR has about the same percentage of adult women receiving such an exam (50.5%) as the national average (51.1%). An illustration of this data is included in Figure 5.
Special Note: DMR has established and is in the process of creating an electronic health care record that will allow analysis of a variety of additional health-related measures, including information related to the percentage of adult women who have received mammograms. Information related to this indicator will be included in future QA reports and will allow for comparison to general population statistics.
2 General population benchmark from the Centers for Disease Control and Prevention (CDC), Behavioral Risk Factor Surveillance System (BRFSS), available at: www.cdc.gov/brfss/index.htm and as reported for 2006.
12

2006/2007 Quality Assurance Report
Figure 5 NCI Measures Related to Health Access
MA DMR Compared to the National Average and Range Phase VIII NCI (2006/07)
Per
cent
"Yes
" 100%
90%
80%
70%
60%
50%
40%
30%
20%
10%
0%
92.3%
50.5%
63.8%
Physical Exam Dental Visit Gyn Exam
MA NCI State Avg NCI High NCI Low
WHAT DOES THIS MEAN? A review of findings associated with basic access to health care suggests that a very high percentage of persons served by DMR are receiving annual physical and dental exams/care. When compared to the general population a much larger proportion of people served in DMR sponsored programs experience annual dental visits than within the state or national adult populations. A higher percentage of persons served by DMR also receive both physical exams and dental care than those in other state DD systems. Adult women have annual gynecological exams at about the same rate as their peers in other states.
Indicator 4: Medications are safely administered. Measures: Medication Occurrence Report (MOR) Rate
No. of Medication Occurrence Reports (MORs) by Cause No. of MOR Hotlines and Percent of MORs classified as “Hotlines”
Data Source: DMR Medication Occurrence Reports FINDINGS: MOR Rate. The number and rate of medication occurrence reports has remained relatively stable since FY2004, with a slight increase noted during 2007. As can be seen in Table 7, there were an estimated 36.5 million doses of medication administered to service recipients by personnel working in DMR operated/funded residential services in 2006. During 2007 there were 3,823 medication occurrences reported, resulting in an occurrence rate of 0.107
13

2006/2007 Quality Assurance Report
per 1,000 doses. This suggests that for every 10,000 doses of medication that were administered in FY2007 there was one MOR. This rate is slightly higher than that estimated for the period between 2004 and 2006. Figure 6 illustrates this trend. Although 2007 experienced a small increase in the number and rate of MORs, data suggest that the rate of reported errors remains very small considering the large number of medications that are being administered on a regular basis within the DMR system.
Table 7 Medication Occurrence Reports
FY 2003 – 2007 Medication Occurrence Reports 2003 2004 2005 2006 2007
2006-2007 Change
Percent Change
Type of Change
No. MORs 4,043 3,599 3,667 3,612 3,823 211 5.8%
Est. No. Doses Adm 27,010,000 34,461,676 36,716,007 36,532,485 35,727,295 -805,190 -2.2%
Occurrence Rate (per 1000) 0.150 0.104 0.100 0.099 0.107 0.008 8.2%
No.
MO
Rs
per 1
000
Dos
es
Figure 6 MOR Rates for FY 2003 – 2007
0.1500.150
0.104 0.107 0.100 0.099
0.100
0.050
0.000
2003 2004 2005 2006 2007
FINDINGS: Type of MOR. The relative proportion of MORs by cause has remained relatively stable over time. As can be seen below in Table 8, there has been relative consistency over time in the percentage of MORs attributed to the five primary types of reported medication errors, with the vast majority associated with wrong time (a category that includes “missed dose”). A slight decrease in MORs related to wrong dose and a slight increase in those associated with wrong time is noted for the period between FY2006 and FY2007.
14

2006/2007 Quality Assurance Report
Table 8 Percentage of MORs by Cause
FY 2003 – 2007 Type of Medication Occurrence 2003 2004 2005 2006 2007
2006-2007 Change
Wrong Dose 18.8% 19.4% 22.6% 24.9% 21.0% -3.9%
Wrong Individual 2.3% 2.3% 2.1% 1.7% 2.3% 0.6% Wrong Medication 2.9% 3.2% 4.4% 3.9% 3.7% -0.2% Wrong Route 0.3% 0.2% 0.3% 0.1% 0.05% -0.1% Wrong Time 75.7% 75.0% 70.6% 69.4% 72.9% 3.5%
Figure 7 illustrates the distribution of MORs by cause for 2006 and 2007. As noted above, about 70% of MORs are associated with administering medication at the wrong time. A MOR is listed as “Wrong Time” when the medication is given more than an hour before or after the specific time ordered by the prescriber or if the medication is not given at all.3 Approximately 1 out of every 4 to 5 reported occurrences is due to providing the wrong dose. As reported in previous years, very few (less than 7% combined) of the MORs are related to administering medication to the wrong person, via the wrong route or using the wrong medication.
Figure 7 Percentage of MORs by Cause
FY 2006 and 2007 100%
80% 69.4%
72.9%
60%
Perc
ent o
f MO
Rs
40%
24.9% 21.0%
20%
3.9% 3.7% 1.7% 2.3% 0.1% 0.1% 0%
Wrong Time Wrong Wrong Wrong Wrong Dose Medication Individual Route
FY06 FY07
3 Enhancements to the database allow a further differentiation of the “Wrong Time” category. FY 2007 data indicate that about 64% of MORs were caused by an omission and 9% were due to administering the medication at the wrong time.
15

2006/2007 Quality Assurance Report
FINDINGS: Hotlines. A medication occurrence that results in any type of medical intervention (e.g., lab test, emergency room visit, hospital admission) is categorized as a “Hotline.” During 2006 there were 27 recorded Hotlines, an increase from 2005 but still representing less than 1% of all MORs. During FY2007 there were 40 reported Hotlines, an increase of 48% from 2006 and suggesting that about 1% of all MORs resulted in medical intervention. These trends are illustrated below in Table 9 and Figure 8.
Table 9 No. and Percentage of MOR “Hotlines”
FY 2003 – 2007
MOR Hotlines 2003 2004 2005 2006 2007 2006-2007 Change
Percent Change
Type of Change
No. MORs 4,043 3,599 3,667 3,612 3,823 211 6%
No. Hotlines 36 28 23 27 40 13 48% -
Percent Hotlines 0.89% 0.78% 0.63% 0.75% 1.05% 0.30% 40% -
No.
Hot
lines
Figure 8 5 Year Trend in MOR Hotlines
FY 2003 – 2007
45 40
40 36
35
2830
2325
20
15
10
5
0
27
2003 2004 2005 2006 2007
More serious MORs may require hospitalization. The number of Hotlines resulting in such a level of medical intervention is presented below in Table 10. As can be seen, since 2004 there has been a steady increase in MOR-related hospitalizations, with 18% of all Hotlines resulting in hospitalization during FY 2007.
16

2006/2007 Quality Assurance Report
Table 10 4 Year Trend in Hotlines Resulting in Hospitalization
FY 2004 to FY 2007
MOR Hotlines & Hospitalization 2004 2005 2006 2007
No. Hotlines 28 23 27 40
No. with Hospitalization 1 2 3 7 Percent Hotlines requiring Hospitalization 4% 9% 11% 18%
WHAT DOES THIS MEAN? There are an estimated 36.5 million doses of medication administered each year within the DMR system. Of these, about 1% are associated with a medication error (occurrence). The vast majority of such occurrences are due to giving the medication at the wrong time. There was a slight increase in the number and rate of reported medication occurrences in FY 2007. The increases noted for 2007 reverse a trend toward fewer medication related incidents found in prior years. More serious medication occurrences are referred to as “Hotlines.” FY 2007 also experienced an increase in the need for medical intervention related to medication occurrences, including 7 cases that required hospitalization.
Indicator 5: Serious health and medication issues are identified and addressed.
Measures: No. and Percent of Action Reports re: Health/Medication Issues. No. of substantiated Medication related Investigations. No. of substantiated Denial of Treatment/Medical Neglect Investigations.
Data Source: Survey and Certification Action Reports, DMR Investigations FINDINGS:
Action Reports. Action Required Reports are completed during surveys when issues relating to health, medication, human rights, safe evacuation, safe environments or consumer funds are identified. Providers must respond within 24-48 hours for issues of “immediate jeopardy” and within 30-60 days for less serious issues of concern.
Table 11 summarizes the number of Action Required Reports by type over the past five years. A substantial reduction in all types of Action Required Reports has occurred since 2003. Reports associated with health and medication experienced an increase in 2006 but then fell back to
17

2006/2007 Quality Assurance Report
levels observed in 2005. Reports for both 2006 and 2007 continued to be well below the numbers present in 2002 and 2003.
Table 11 Action Required Reports
FY 2003-2007
Type of Action Required Report
2003 2004 2005 2006 2007 Change FY06-07
Percent Change
Type of Change No. No. No. No. No.
Health/Medication 53 21 17 22 18 -4 -18% +
Other 216 163 88 98 116 18 18% -
Total 269 184 105 120 134 14 12% -
Figure 9 illustrates these trends over time. As can be seen, while the number of health/medication reports in 2006 and 2007 are substantially below the number of reports in 2003, they have shown a slight increase from 2005. Given the relatively small amount of change it is not clear whether this represents a meaningful trend.
Figure 9 No. of Health/Medication Action Required Reports
FY 2003 – 2007
53
21
17
22
18
0
10
20
30
40
50
60
l/
No.
Hea
th &
Med
AR
Rep
orts
2003 2004 2005 2006 2007
18

2006/2007 Quality Assurance Report
Medication Investigations. Table 12 presents information regarding DMR investigations associated with medication incidents. At the time of report preparation data analysis was not completed for FY 2007. Consequently direct comparison of 2007 with 2006 was not possible. Therefore, the determination of change for this measure is based on a comparison of 2006 with 2005.
As can be seen in Table 12 there was a reduction in both the number of medication-related investigations and the number that were substantiated in 2006 compared to the prior year, representing a decrease of approximately 20%. Both measures were also lower in 2006 than for the period of 2003 through 2005. The general trend for medication investigations is illustrated in Figure 10.
Table 12 Medication Investigations
FY 2003 – 2006
Medication Investigations 2003 2004 2005 2006
Difference 2005-2006
Type of Change
2005-2006
No. Investigations re: Medication 40 29 29 23 -6 + No. Investigations Substantiated 24 17 19 15 -4 + Percent Investigations Substantiated 60% 59% 66% 65% -0.3%
Figure 10 No. of Substantiated Medication Investigations
FY 2003 – FY 2006
24
17 19
15
0
5
10
15
20
25
30
No.
Sub
stan
tiate
d In
vest
2003 2004 2005 2006
19

2006/2007 Quality Assurance Report
Denial of Treatment Investigations. A review of investigations data for denial of medical treatment/medical neglect (see Table 13) shows that there were fewer investigations in 2006 compared to prior years. However, the number of investigations that were substantiated increased slightly from 2005 to 2006. A comparison of FY 2005 and FY 2006 is used for this measure in this report. Figure 11 illustrates changes in the number of substantiated medical neglect investigations and suggests that there has been relative consistency between 2004 and 2006 for substantiated investigations associated with denial of medical treatment.
Table 13 Investigations for Denial of Medical Treatment/Medical Neglect
FY 2003 – 2006
INVESTIGATIONS: Denial of Treatment & Medical Neglect 2003 2004 2005 2006
Percent Change
2005-2006 Type of Change
Total Investigations 102 73 73 58 -21% +
No. Substantiated 50 29 29 31 7% Percent Investigations Substantiated 49% 40% 40% 53%
Figure 11 No. Substantiated Investigations for Denial of Medical Treatment/Medical Neglect
FY 2003 – 2006
No.
Sub
stan
tiate
d In
vest
60
50 50
40
3129 29
30
20
10
0
2003 2004 2005 2006
20

2006/2007 Quality Assurance Report
Table 14 and Figure 12 illustrate the number of substantiated findings4 by cause between FY 2003 and FY 2006. Once again, given incomplete data analysis for FY 2007, the comparison between 2005 and 2006 is used to estimate change. Findings suggest there has been no change in investigation findings pertaining to failure to seek attention for signs and symptoms of an illness. A slight reduction in findings associated with failure to treat medical conditions in accord with standard medical practices was present for FY 2006. All other major categories, including the total number of findings for denial of medical treatment experienced an increase in FY 2006.
It is important to note that given the relatively small number of findings for each category, even a slight change in the number of findings can result in a large percentage increase or decrease. For example, in 2006 there were only two (2) additional findings for failure to utilize standard assessment protocols for presenting signs and symptoms; yet this represented a percentage increase of 100%. For this reason both the magnitude of change (i.e., the actual numerical difference) and the percentage should be reviewed together to best understand the amount of change that has taken place over time.
Table 14 Findings re: Substantiation of Denial of Medical Treatment and Medical Neglect
FY 2003 – 2006
TYPE of FINDINGS: Denial of Treatment & Medical Neglect 2003 2004 2005 2006
Difference 2005-2006
Percent Change
2005-2006 Type of Change
Signs & Symptoms 19 10 15 15 0 0%
Treatment Protocol 14 6 11 9 -2 -18% +
Assessment Protocol 6 5 2 4 2 100% -
Emergency Protocol 11 14 5 7 2 40% -
All Other 19 9 8 11 3 38% -
TOTAL 69 44 41 46 5 12% -
4 Table 13 and Figure 12 include data related to findings resulting from each investigation, whereas Table 12 and Figure 11 are related to the number of investigations. Since one investigation may result in more than one finding there is a difference in the totals.
21

2006/2007 Quality Assurance Report
Figure 12 Leading Causes for Substantiated Denial of Medical Treatment/Medical Neglect
FY 2003 – 2006
0
2
4
6
8
10
12
14
16
18
20
ii
No.
Fnd
ngs
Signs & Treatment Assessment Emergency All Other Symptoms Protocol Protocol Protocol
2003 2004 2005 2006
WHAT DOES THIS MEAN? FY 2007 experienced a reduction in the number of special interventions (Action Required Reports) associated with health and medical concerns for services/programs reviewed by the Survey and Certification process. Compared to prior years, there were fewer medication related investigations that were substantiated in 2006. Little change is noted for the number of substantiated investigations for denial of medical treatment, with the number of such investigations remaining substantially lower than during FY 2003. Specific investigatory findings in 2006 associated with medical neglect increased in three categories, fell in one and remained the same for one of the categories.
22

2006/2007 Quality Assurance Report
PROTECTION FROM HARM OUTCOME: People are protected from harm. Indicators: 1. Individuals are protected when there are allegations of abuse,
neglect or mistreatment. 2. CORI checks are completed for staff and volunteers working
directly with individuals. 3. Safeguards are in place for individuals who are at risk.
RESULTS: Basic protection from harm for persons served by DMR is evaluated using three (3) primary indicators and nine (9) measures. During FY 2006 four of the measures remained relatively consistent with findings in 2005 and a possible increase in CORI violations per provider was observed. The percentage of CORI violations associated with lack of records decreased in 2006. During FY 2007 three measures remained stable and two CORI-related measures showed an increase (negative finding). [Measures related to investigations are based on FY 2006 data.] Data related to critical incidents (CIR) underwent significant changes due to the onset of a new DMR web-based reporting process and is not directly comparable to prior years.
Figure 13 Summary of Trends for Protection from Harm Indicators and Measures
FY 2006 – 2007
OUTCOME Indicator Measure Change
FY05-FY06 Change
FY06-FY07
Protection - people are protected from harm. 1. Investigations
No. & Percent Substantiated Incomplete
Data
Trends: Most Common Types NA NA
2. CORI checks
Percent Without Violations
Violations per Provider -
Percent Lack of Records + -
3. Safeguards for Persons at Risk
Corrective Action
Preventive Action
-CIR Rates NA
CIR by Type NA NA Direction of Arrow = increase, decrease, stable
Green = positive trend (+)Red = negative trend (-)White = slight change/neutral trend
23

2006/2007 Quality Assurance Report
OUTCOME: People are protected from harm. Indicator 1: Individuals are protected when there are allegations of
abuse, neglect or mistreatment. Measures: No. of Investigations and Percentage Substantiated.
Rate of Substantiated Abuse/Neglect Investigations (No. per 1000). Trends in Most Common Types of Substantiated Abuse/Neglect.
Data Source: Investigations
FINDINGS: Table 15 provides information related to Abuse/Neglect investigations conducted by the DMR for the four year period between fiscal years 2003 through 2006. Faor this component of the report – unlike other indicators and measures - the change trends reflect differences between FY05 and FY06, not FY06 and FY07 since investigations data compilation and analysis was not completed at the time of report preparation.
Table 15 No. of Abuse/Neglect Investigations, Percent and Rate Substantiated
FY 2003 – 2006
Abuse/Neglect Investigations 2003 2004 2005 2006
Difference 2005-2006
Percent Change
2005-2006
Type of Change for
FY06
Total Investigations 1,257 1,083 1,093 958 -135 -12% +
Completed 1,148 913 934 785 -149
No. Substantiated 358 299 291 279 -12 -4%
Open 109 170 159 173 14
Percent Substantiated 31% 33% 31% 36% 4% 14% -
Population (> 18 yrs) 22,802 23,157 22,916 23,053 137 No. of Substantiated Investigations per 1000 15.70 12.91 12.70 12.10 -0.6 -5%
As can be seen in Table 15, the total number of investigations for complaints of abuse/neglect has remained relatively stable over time, dropping by about 12% for FY06 compared to the prior year. The actual number of substantiated investigations (a more accurate measure of Abuse/Neglect incidents) for 2006 was slightly less than for the period between 2003 and 2005, falling by 4% from the number substantiated in 2005. Because there were fewer investigations in 2006, the percentage of completed investigations that resulted in a substantiation of abuse or neglect actually increased, rising from slightly more than 31% in FY 2005 to slightly less than 36% in FY 2006.
24

2006/2007 Quality Assurance Report
Figure 14 illustrates the rate of substantiated investigations for the four-year time period. The rate represents the number of substantiated investigations relative to the total DMR population (which tends to change over time) and is expressed as the number of substantiated investigations for abuse/neglect per 1,000 people served in the Department. As can be seen in Figure 14, this measure (rate) has continued to fall over time, suggesting a decrease in the relative proportion of the DMR population involved in substantiated abuse/neglect. As noted above, data regarding the results of investigations for FY07 was not sufficiently complete at the time of data analysis to provide an accurate comparison with prior years. It is important to note that the rate (number of substantiated investigations per 1,000 people served) is based upon a comparison of the number of investigations that were completed at the time this report was generated. This number will change over time as additional investigations are completed.
Figure 14 Four Year Trend in the Rate (n/1000) of
Substantiated Abuse/Neglect Investigations FY 2003 – 2006
12.91 12.10
0
2
4
6
8
10
12
14
16
18
20
15.70
12.70
No.
Sub
Inve
st p
er 1
000
peop
le
2003 2004 2005 2006
The top ten (10) causes for substantiation of abuse/neglect – based on investigation findings5 -have remained relatively stable over time and include:
1. Omission on part of caregiver, placing individual at risk 2. Physical abuse or assault by caregiver 3. Medical neglect and/or denial of treatment
5 It is common for substantiated investigations to include multiple findings, i.e., more than one type of abuse or neglect. Therefore, the number of findings associated with “type” of abuse/neglect will usually be greater than the number of substantiated investigations.
25

2006/2007 Quality Assurance Report
4. Emotional abuse by the caregiver 5. Verbal abuse 6. Medication incident or error 7. Restraint – inappropriate/illegal use (physical and mechanical) 8. Failure to report 9. Failure to provide for basic needs 10. Injury of unknown origin
Table 16 provides information on the total number of substantiated complaints by type of finding for the ten leading causes between 2003 and 2006. As can be seen, substantiated complaints pertaining to acts of omission and medical concerns remained relatively stable in 2006 compared to 2005. All of the other leading types of complaints experienced reductions during 2006, with substantial improvement (decrease in number of substantiated complaints by 30% or more) present for complaints associated with failure to report, failure to meet needs, unknown injuries, inappropriate restraint and verbal abuse.
Table 16 Changes in the No. Substantiated Complaints for the
Top 10 Leading Types of Substantiated Abuse/Neglect FY 2003 – 2006
Top 10 Types of Substantiated Abuse 2003 2004 2005 2006
Difference 2005-2006
Percent Change
2005 - 2006
Type of Change for
FY06
Omission 166 159 129 137 8 6%
Physical 76 61 56 51 -5 -9%
Emotional 45 27 37 29 -8 -22% +
Medical 50 29 30 31 1 3%
Verbal 31 20 27 19 -8 -30% +
Failure: Report 32 22 23 6 -17 -74%
Medication 24 17 19 15 -4 -21% +
Failure: Meet Needs 26 12 17 6 -11 -65% +
Unk Injury 21 14 13 5 -8 -62% +
Inapprop Restraint 14 11 12 7 -5 -42% +
Figure 15 illustrates the magnitude of change from 2003 to 2006 for the top five (5) types of complaints, which account for over 85% of all complaints. As can be seen, a general (although inconsistent) decrease has taken place for substantiated findings associated with physical, verbal
26

2006/2007 Quality Assurance Report
and emotional abuse since 2003. Very slight increases appear to have occurred during 2006 for findings associated with omission and medical neglect.
No.
Sub
stan
tiate
d Fi
ndin
gs
Figure 15 Trends in the 5 Most Common Types of Substantiated Abuse/Neglect
FY 2003 – 2006 180
160
140
120
100
80
60
40
20
0
Omission Physical Emotional Medical Verbal
2003 2004 2005 2006
Figure 16 shows the relative amount of change (percentage) that has taken place between 2005 and 2006 for all 10 types of complaints.6 As can be seen, small increases are noted for findings related to omission and for medical neglect between FY 2005 and FY 2006. During this same time period, substantiated findings related to physical abuse dropped by about 9%. Very large percentage reductions were present for all of the remaining “top 10” findings, with findings associated with unknown injuries, failure to meet needs and failure to report falling by over 60% over the one-year time period between FY 2005 and FY 2006.
6 Relative change does not reflect the magnitude of change, i.e., changes in the actual number of findings/complaints. Rather it simply shows how much change has taken place for the various categories of findings relative to one another. In many instances a high percentage of change may be related to a very small number of actual findings. See Table 15 to review the number of complaints for each category.
27

9
10
2006/2007 Quality Assurance Report
Figure 16 Percent Change for the Top 10 Types of Substantiated Findings for Abuse/Neglect
Between FY 2005 and FY 2006
3%
6%
1
2
3
4
5
6
7
8
il
il
j
i
i
ion
l
l
Omi i
-74%
-65%
-62%
-42%
-30%
-22%
-21%
-9%
Fa ure: Report
Fa ure: Needs
Unk In ury
Inapp Restra nt
Verbal
Emot onal
Medicat
Physica
Medica
ss on
WHAT DOES THIS MEAN? Trends in the actual number of abuse/neglect (A/N) investigations, the number of substantiated complaints and the A/N rate continues to suggest that individuals served by DMR may be experiencing less abuse and neglect. Substantial relative (percentage) reductions are present for most of the top 10 types of substantiated findings between FY05 and FY06. Data for FY07 was not sufficiently complete at the time of the report preparation to allow meaningful analysis of trends for that fiscal year.
28

2006/2007 Quality Assurance Report
Indicator 2: CORI checks are completed for staff and volunteers working directly with individuals.
Measures: No. of providers without CORI violations over time. Average No. Violations per Provider. Percentage of violations caused by lack of records.
Data Source: CORI Audit Database
FINDINGS: CORI audits conducted by the DMR suggest that the vast majority of providers are complying fully with required new employee background checks and associated documentation. For fiscal years 2003 through 2006 there was a relatively consistent improvement in the number and percent of providers that had no CORI violations, reaching 93% for FY06. However, during FY2007 this percentage experienced a slight decrease to 87%. As can be seen in Figure 17 below, the FY07 percentage of providers with zero violations, while lower than that achieved in the prior two years, is still well above the performance levels found in 2003 and 2004.
Figure 17 Percentage of Providers with No CORI Violations
FY 2003 – 2007
li
78% 80%
89%
93%
87%
65%
70%
75%
80%
85%
90%
95%
Per
cent
No
Vio
aton
2003 2004 2005 2006 2007
Table 17 below provides information related to the number of providers audited and the results of those CORI audits. As can be seen, since 2003 a substantially larger number of providers have been audited by DMR. FY06 reviews found very few providers (n=14) with violations. However, in FY07 both this number and the actual number of violations increased, leading to the lower percentage of providers without any CORI violations and a slight increase in the number of violations per provider audited. This latter trend is illustrated in Figure 18 and suggests that
29
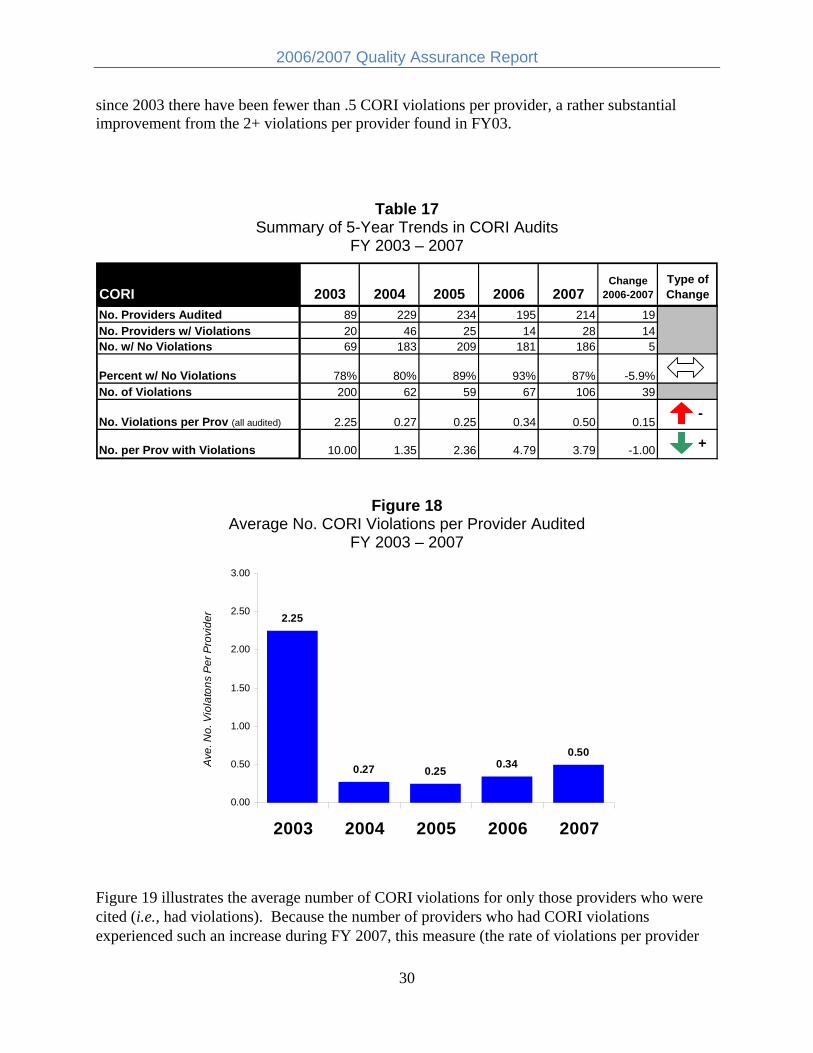
2006/2007 Quality Assurance Report
since 2003 there have been fewer than .5 CORI violations per provider, a rather substantial improvement from the 2+ violations per provider found in FY03.
Table 17 Summary of 5-Year Trends in CORI Audits
FY 2003 – 2007
CORI 2003 2004 2005 2006 2007 Change
2006-2007 Type of Change
No. Providers Audited 89 229 234 195 214 19 No. Providers w/ Violations 20 46 25 14 28 14 No. w/ No Violations 69 183 209 181 186 5
Percent w/ No Violations 78% 80% 89% 93% 87% -5.9% No. of Violations 200 62 59 67 106 39
No. Violations per Prov (all audited) 2.25 0.27 0.25 0.34 0.50 0.15 -
No. per Prov with Violations 10.00 1.35 2.36 4.79 3.79 -1.00 +
Figure 18 Average No. CORI Violations per Provider Audited
FY 2003 – 2007
3.00
2.50
ider
2.25
2.00
1.50
olat
ons
Per
Pro
v
1.00
Ave
. No.
Vi
0.50 0.50 0.27 0.25 0.34
0.00
2003 2004 2005 2006 2007
Figure 19 illustrates the average number of CORI violations for only those providers who were cited (i.e., had violations). Because the number of providers who had CORI violations experienced such an increase during FY 2007, this measure (the rate of violations per provider
30

2006/2007 Quality Assurance Report
with violations) actually decreased from FY 2006 to FY 2007. Five-year trends in this measure indicate that the number of actual CORI violations, even for those providers who are cited, is less than half that experienced in FY 2003, a positive sign that adherence to CORI requirements has been consistently improving over time.
Num
ber V
iola
tions
Figure 19 Average No. Violations per Provider
Only for those Providers with Violations FY 2003 -2007
10.00 10
8
6
4.79
3.79 4
2.36
2 1.35
0
2003 2004 2005 2006 2007
Lack of adequate records7 is a major reason for CORI citations during an audit. As can be seen in Table 18, citations in this category increased somewhat during FY 2007 from levels observed in the prior three years, representing almost 60% of all CORI citations. The category of “Other Causes” is composed primarily of violations related to the 5- or 10-year presumptive disqualification requirement.8 Across both FY 2006 and FY 2007 there was only one citation for an outstanding warrant and no violations associated with failure of applicants to disclose convictions. A summary of the causes for violations between 2003 and 2007 is presented below in Table 18, and a more detailed review of causes for CORI violations for FY 2006 and 2007 is presented in Table 19.
7 This category is listed as a violation when a provider cannot produce formal documentation that it requested a CORI on individuals in its employ. 8 Certain criminal offenses carry with them different periods of time before an individual becomes eligible for employment. The most serious offenses have a “lifetime presumptive disqualification,” i.e., an individual convicted for one these offenses can never be employed in a program serving DMR service recipients. Less serious offenses have a “5-year presumptive disqualification,” meaning the individual cannot be employed for five years following conviction. Intermediate offenses have a “10-year presumptive disqualification.”
31

2006/2007 Quality Assurance Report
Table 18 Summary of Causes of CORI Violations
FY 2003 – 2007
Type of CORI Violation Percentage of Violations 2003 2004 2005 2006 2007
Pending Status 1% 13% 3% 9% 7%
Lack of Records 98% 47% 47% 34% 58%
Other Causes 2% 40% 49% 57% 36%
Table 19 Listing of all Causes for CORI Violations
FY 2006 – 2007
Type of CORI Violation 2006 2007
No. Violations Percent
No. Violations Percent
Pending status must be cleared 6 9% 7 7%
Lack of CORI Records 23 34% 61 58%
Other Causes: 38 57% 38 36%
Nonconforming Application 0 0% 0 0%
Nondisclosure of convictions 0 0% 0 0%
5 Year Presumptive Disqualification 6 9% 18 17%
10 Year Presumptive Disqualification 23 34% 19 18%
Lifetime Presumptive Disqualification 3 4% 1 1%
Hiring Process Deficiency 3 4% 0 0%
Inaccurate Query Request 2 3% 0 0%
Outstanding Warrants 1 1% 0 0%
Total Violations 67 100% 106 100%
WHAT DOES THIS MEAN? A very high percentage of providers are carefully following hiring procedures for employees to prevent individuals with criminal records from working with persons served by DMR. Provider compliance with CORI requirements has been improving over time, although there was a slight decrease in the percentage of providers without any CORI violations in FY07 compared to the prior three years. Lack of records and issues related to 5-year and 10-year disqualification requirements are the major causes of CORI violations for those providers who are audited by DMR. This has shown an increase over the past two years.
32

2006/2007 Quality Assurance Report
Indicator 3: Safeguards are in place for individuals who are at risk. Measures: Percentage of situations in which people have been mistreated where
corrective actions are taken. Percentage of situations in which people have been mistreated in which steps are taken to prevent the situation from occurring again. Critical incident report (CIR) rates. No. of Critical Incident Reports (CIR) by type.
Data Source: Survey and Certification (5.2C and 5.2D) Critical Incident database
FINDINGS: Corrective and Preventive Action. During the Survey and Certification process surveyors identify situations where concerns exist regarding possible mistreatment (e.g., abuse/neglect) of the individuals being reviewed. This is done through a review of substantiated investigations and action plans that have occurred since the last review. The review also includes an assessment as to whether the provider has taken appropriate actions to correct the situation and to prevent it from occurring in the future.
Data from the Survey and Certification database (Indicators 5.2C and 5.2D) are presented below in Tables 20 and 21. Findings indicate that there continues to be a relatively high rate for both corrective and preventive actions by providers, with 97% of concerns corrected and 96% showing evidence of preventive action during fiscal year 2007. A general trend toward improvement over time is present for both of these measures, as illustrated in Figures 20 and 21.9
Table 20 Corrective Actions Taken for Concerns about Mistreatment
FY 2003 – 2007
Corrective Action: Mistreatment (5.2C) 2003 2004 2005 2006 2007
Change 2006-2007
No. w Concerns 269 368 392 599 332
No. w Corrective Action 250 339 370 578 321
Percent Corrected 93% 92% 94% 96% 97%
9 The larger numbers of concerns observed in FY 2006 are directly related to an increase that year in the number of reviews that were conducted by the DMR Survey and Certification unit. Because the number of reviews varies year to year, the percentage corrected is a more valid measure than the number of concerns reported.
33

2006/2007 Quality Assurance Report
Table 21 Preventive Actions Taken for Concerns about Mistreatment
FY 2003 – 2007
Preventive Action: Mistreatment (5.2D)
2003 2004 2005 2006 2007
Change 2006-2007
No. w Concerns 269 368 390 598 333
No. w Corrective Action 248 340 363 579 319
Percent Corrected 92% 92% 93% 97% 96%
Per
cent
with
Cor
rect
ive
Act
ion
Figure 20 5 Year Trend for Corrective Action re: Concerns about Mistreatment
FY 2003 – 2007 100%
98% 96% 97%
96% 94%
94% 93%92%
92%
90%
88%
86%
84%
82%
80%
2003 2004 2005 2006 2007
34

2006/2007 Quality Assurance Report
Figure 21 5 Year Trend for Preventive Action re: Concerns about Mistreatment
FY 2003 – 2007
100% P
erce
nt w
ith P
reve
ntiv
e A
ctio
n 98% 97%
96% 96%
94% 93% 92% 92%
92%
90%
88%
86%
84%
82%
80%
2003 2004 2005 2006 2007
WHAT DOES THIS MEAN? When concerns are raised re: past or potential abuse/neglect, providers take acceptable corrective and preventive action more than 95% of the time. These rates have risen slightly from the levels identified in 2003.
FINDINGS: Critical Incident Reports.
The Critical Incident Reporting (CIR) system, now part of the HCSIS data system, underwent very significant change during this report period (i.e., FY 2006), including modifications to incident categories, the addition of numerous fields and an important “roll-out” of a web-enabled reporting process. Because of this major system enhancement the CIR data for both FY 2006 and 2007 are not directly comparable to prior years. More specifically, for FY 2006 data on CIRs based on the older “paper” system is only available for 9 of the 12 months as the new HCSIS system went “live” for selected but not all regions in March of 2006. In FY 2007 the HCSIS web-based reporting process was implemented statewide. Data for 2007 cannot be directly compared to any of the prior years due to a number of major changes, including: (a) changes in reportable categories; (b) movement from a system that was both a “paper” and “database” system to a comprehensive web-based database system; (c) differences in how data is configured and (d) a change to the population base for computing rates. For example, under the “older” system only incidents that were determined to be “critical” were entered electronically whereas under the “new” system all incidents are electronically reported. Therefore, the incident counts prior to FY 2007 do not include the literally thousands of reports now entered for events such as those related to unexpected hospital visits.
35

2006/2007 Quality Assurance Report
SPECIAL CAUTION. The incident data reported below must be viewed with extreme caution due to the qualifications noted above. HCSIS represents a new system that cannot be directly compared to prior reporting processes and the data re: incidents are different than in prior years. In addition, the new system continued to undergo minor modifications in 2007 to improve reliability and reporters were being trained during that time period. Given these important limitations, 2007 CIR data is perhaps best viewed as a foundation for “looking forward” and evaluating future trends, not for comparing incidents with prior years.
It is important to note that the improvements to data collection and analysis stemming from this system enhancement will provide a significantly increased capacity within DMR to conduct focused analyses that can and will be used by an expanded risk management system to identify patterns and trends that are indicative of risk and act in a more timely fashion to intervene to mitigate those risks.10
Table 22 presents information related to changes in CIR data between FY 2003 and FY 2006. During 2005 and into 2006 changes were introduced to both reporting requirements and incident categories, although the process or method of reporting stayed relatively consistent (paper form submission). In order to allow a more appropriate – although not exact – comparison of FY 2005 and FY 2006 with previous years, the number of critical incident reports for these two years includes two measures: (1) the number of reports (with the newer categories included) and (2) the number of reports minus the newer categories. Data for FY 2006 is pro-rated to estimate projected totals for a 12-month time period.11 In FY 2006 there were an estimated (pro-rated) 2,283 incidents reported to DMR compared to 1,920 reported in FY 2005. Of these, 1,297 were in reporting categories present prior to 2005.
Table 22 No., Percent and Rate of Critical Incidents
FY 2003 – 2006
CIR Rates No. CIR (with new
categories)
Mid-Year Population
Rate with new
categories (no. per 1000)
No. CIR (minus new categories)
Rate minus new
categories (no. per 1000)
Percent Change
(rate with new categories)
Type of Change
2005-2006
2003 32,004 875 27.3
2004 32,144 985 30.6
2005 1,920 31,592 60.8 1,058 33.5
2006 2,283 31,663 72.1 1,297 41.0 18.6% -
10 For example, a new risk management committee has been established by DMR that has begun to use HCSIS incident data to identify system-wide issues for more focused analysis and remediation. In addition, DMR has partnered with the University of Massachusetts Medical School’s Center for Developmental Disabilities Evaluation and Research to prepare monthly and quarterly reports on selected incident categories that can be used by Regional and Area staff to identify persons and issues that may require further review and possible intervention to reduce the risk of harm. 11 As previously noted, during FY 2006 only 9 months of CIR data using the “paper” process (non-HCSIS) were available for review due to the phase-in of the HCSIS system at the end of that fiscal year. The 9 months of data have been inflated to estimate totals over a 12 month time period, assuming a similar pattern of reporting.
36

2006/2007 Quality Assurance Report
The rate (no. of reports per 1,000 people served) rose by about 18% from 2005 to 2006 when only considering incident categories that were present in those two years. Figure 22 illustrates this change. Given the periodic changes to the system during this time period as well as a presumed increase in focus on reporting, it cannot be determined with any certainty whether or not this change reflects an actual increase in incidents or a more responsive process of reporting.
No.
Inc
per 1
000
Figure 22 Comparison of Incident Rates
FY 2005 – FY 2006
80 72.1
70 60.8
60
50
40
30
20
10
0
2005 2006
As noted above, in 2006 there were a total of 2,283 critical incidents (pro-rated to 12 months) that were reported to DMR. With the “newer categories” removed, there were an estimated 1,297 reported incidents. Table 23 provides more detailed information regarding the type of incidents that were reported between FY 2003 and FY 2006. As can be seen, Unplanned Hospitalizations and Emergency Room Visits accounted for about 40% of all reported incidents in 2006. Potential increases in reported incidents took place for half of the incident categories. Incident categories that appear to have experienced a relatively large increase include those associated with fires, accidents, missing persons and caretakers.
37

2006/2007 Quality Assurance Report
Table 23 No. Critical Incident Reports by Type
FY 2003 – 2006
Type of Critical Incident Report 2003 2004 2005
2006 9-mo.
actuals
2006 prorated to
full year 2005-2006 Change
Percent Change
Type of Change
Accident 104 113 149 183 244 95 64% -
Assault 137 201 58 48 64 6 10% -
Caretaker 40 27 45 45 60 15 33% -
Criminal 139 105 114 84 112 -2 -2%
Inapp Behavior 166 142 298 229 305 7 2%
Medical 33 46 63 24 32 -31 -49% +
Missing 75 90 67 80 107 40 59% -
Other 120 218 221 137 183 -38 -17% +
Physical Abuse 10 0 0 0 0 0 0%
Inapp Sexual 28 26 23 11 15 -8 -36% +
Fire 23 17 20 32 43 23 113% -
Sexual Assault 31 26 35 4 12% -
Unplanned Hospital Categories Not 761 677 903 142 19% -
Victim of Crime Available before 2005
70 46 61 -9 -12% +
Total No. Incidents with New Categories 1,920 1,622 2,163 243 13%
-
Total minus New Categories 875 985 1,058 873 1,164 106 10%
-
Three incident categories remained stable and four decreased between 2005 and 2006. The largest decreases were noted for incidents involving medical issues, inappropriate sexual behavior and being a victim of a crime.
Data for FY 2007 is presented separately due to the significant differences in the reporting process and incident categories present in the new HCSIS system. While 2007 data cannot be compared to prior years, it should nonetheless provide a baseline for future trends analyses since only minor modifications are anticipated as the system undergoes a process of continuous improvement based on analysis and user feedback.
As can be seen in Table 24, the new HCSIS reporting system resulted in a major increase in the overall number of reported incidents. In FY 2007 a total of almost 15,000 incidents were reported to DMR. Once again the largest single category of incidents was associated with
38

2006/2007 Quality Assurance Report
unexpected hospitalization and emergency room visits. In this category alone, over 6,000 incidents were reported.12
Table 24 No. of Reported Incidents for FY 2007
Based on the New HCSIS System
HCSIS IR Category No. Inc FY 2007
Rate (no. per 1000)
Assaults 513 22.0 Behavioral Incident in Community 241 10.3 Behavioral Incident - Law Enforcement 233 10.0 Community Complaint 55 2.4 Emergency Relocation 10 0.4 Escalating Series of Incidents 729 31.3 Fire 32 1.4 Medical Treatment from Injury 716 30.7 Missing Person 256 11.0 Near Drowning 1 0.0 Other Criminal Activity 49 2.1 Other/other 1,691 72.5 Physical Altercation 3,076 131.9 Property Damage 395 16.9 Staff involvement with Law Enforcement 32 1.4 Suicide Attempt 16 0.7 Suspected Mistreatment 290 12.4 Theft 157 6.7 Transportation Accident 245 10.5 Unplanned Transportation Restraint 35 1.5 Unexpected Hospital Visit or ER Visit 6,150 263.7 Unexpected or Suspicious Death 35 1.5 Total 14,957 641.2
Population (>18 yrs) 23,325 Rate (no. per 1,000 adults) 641.2
Data also reflect a substantial change in the rate of incidents within the DMR system. At the current time reporting is not required for children (individuals under the age of 18-years) who are eligible for DMR services in the new system and an analysis of reports conducted in early
12 Due to both the magnitude and complexity of the information in this incident category DMR began working with the University of Massachusetts Medical School’s Center for Developmental Disabilities Evaluation and Research (CDDER) in early FY 2008 to conduct more comprehensive data analyses of this category to allow for more focused identification of factors that may be contributing to unplanned or unexpected hospital based service. This information is now being used by the DMR risk management system.
39

2006/2007 Quality Assurance Report
FY 2008 confirmed that no such reports were in fact present within the HCSIS database. Consequently, the population base for determining the rate (no. of incidents per 1,000 people served) has been adjusted to include only adults (persons 18-years of age and older). This modification significantly reduced the population (denominator) for rate calculation, resulting in a large change (increase) in the incident rate for 2007 over prior years.
SPECIAL NOTE: Comparison of the total number of incidents and the incident rate between 2007 and all prior years is not appropriate due to overall changes in the reporting system, types of incident categories and method for calculating the incident rate and the change-over from a “paper” to an electronic system.
Table 25 presents information on the top 5 categories of incident reports which together accounted for over 80% of all reported incidents in FY 2007. As can be seen, the most frequent reasons for reporting an incident included, in rank order: (1) Unexpected hospitalization, (2) Physical altercation, (3) Other, (4) Escalating series of incidents, and (5) Injuries requiring medical treatment.
Table 25 Top 5 Incident Categories in FY 2007 Top 5 HCSIS IR No. Inc Categories FY2007
Unexp Hospital/ER 6,150 Phys Altercation 3,076 Other/other 1,691 Escal Series of Inc 729 Med Trtmnt/Injury 716 Subtotal 12,362 Percent Total Irs 83%
WHAT DOES THIS MEAN? The introduction of new reporting requirements, methods and categories of critical incidents makes comparisons of 2006 data with prior years difficult and unreliable. Given this qualification, trends nonetheless suggest a possible increase in incidents from 2005 to 2006.
Direct comparisons of FY 2007 incident data with prior years should not be performed. Given the comprehensive change that has encompassed the CIR system over the past few years – in particular the change-over in FY 2007 to the HCSIS reporting process - it is not possible to determine the nature or extent of actual changes in incidents affecting persons served by DMR.
Looking forward, the presence of the new web-enabled HCSIS reporting system and database should provide a relatively stable foundation for future trends analysis of incident data. Preliminary analysis of 2007 data suggests that a majority of all reported incidents are associated with unexpected hospitalization and ER visits and physical altercations.
40

2006/2007 Quality Assurance Report
SAFE ENVIRONMENTS OUTCOME: People live and work in safe environments. Indicators: 1. Homes and work places are safe, secure and in good repair.
2. People can safely evacuate in an emergency. 3. People and their supporters know what to do in an emergency.
RESULTS: Results from survey and certification reviews for FY 2006 and FY 2007 indicate that a very high percentage – 93% to 94% – of individuals lived and/or worked in safe environments and settings that were secure and in good repair. During the review process any safety issues that were identified (e.g., relating to smoke detectors, required inspections, etc.) were noted, with follow-up taking place within 24-48 hours. Almost all individuals reviewed (98%) were deemed able to safely evacuate their residence or work site (with or without assistance). During this same time period, approximately 95% of the individuals who were reviewed were determined to either possess the knowledge themselves and/or have support staff knowledgeable regarding how to effectively respond to emergency situations. All of these measures have remained very stable over the past five years.
Action Required Reports are issued by the DMR Survey and Certification unit when there are issues identified that affect the safety and welfare of individual consumers. Action Required Reports related to safe and secure environments fluctuated between 2005 and 2007, dropping substantially in FY 2006 but then rising somewhat in FY 2007. Reports associated with evacuation stayed at about the same level as in 2005.
Figure 23 illustrates the general trends for this outcome for both FY06 and FY07.
Figure 23 Summary of Trends for Safe Environments Indicators and Measures
FY 2006 – 2007
OUTCOME Indicator Measure Change
FY05-FY06 Change
FY06-FY07
Safe Environments People live and work in safe environments.
1. Safe homes and work places Percent Safe Environment
Action Required Reports: Environmental Issues + -
2. Evacuate Safely Percent - Safely Evacuate
Action Required Reports: Evacuation
3. Know what to do in Emergency Percent - Know what to do
Direction of Arrow = increase, decrease, stable
Green = positive trend (+)Red = negative trend (-)White = slight change/neutral trend
41

2006/2007 Quality Assurance Report
OUTCOME: Indicator 1: Measures:
Data Source:
People live and work in safe environments. Homes and work places are safe, secure and in good repair. Percentage of individuals found to be living and working in safe environments Percentage of Action Required citations due to environmental concerns Survey and Certification (5.1A) NCI data
FINDINGS: Living/working in safe environments. Table 26 below provides summary Survey and Certification data related to the number and percentage of persons reviewed who were determined to live and work in environments that are safe, secure and in good repair. As can be seen, this percentage has remained remarkably consistent over the past five years, even as larger numbers of individuals are reviewed.
Table 26 No. and Percent of Persons Who Live and Work in Safe Environments
FY 2003 - 2007
Safe Environments 2003 2004 2005 2006 2007
Type of Change
2006-2007
No. Applicable 1,881 1,882 2,126 2,729 2,475 No. Safe, Secure & Good Repair 1,742 1,726 1,969 2,538 2,320 Percent Safe, Secure & Good Repair 93% 92% 93% 93% 94%
NCI Indicators for Safety. Two survey items contained in the Phase VIII National Core Indicators (covering 2005 through 2006) evaluate consumer perception of safety. Results for these NCI measures for Massachusetts compared to the national state averages are presented below in Table 27. As can be seen, when interviewed, about 80% of DMR consumers feel safe in their homes and in their neighborhoods. These percentages are similar to but slightly lower than the average for the 20 states reporting data in the Phase VIII NCI. Figure 24 illustrates this comparison and shows Massachusetts falling in the mid-range of the 20 states that reported on these measures during 2005/06.
42

2006/2007 Quality Assurance Report
Table 27 NCI Safety Indicators
2006
National NCI Safety MA DMR State Avg
Feel Safe at Home 80.6% 83.0%
Feel Safe in Neighborhood 79.6% 83.6%
Per
cent
"Yes
"
NCI data based on average for 20 states from the Phase VIII report (2005/06) issued March, 2007
Figure 24 Comparison of Massachusetts with the National State Average and
Range (High and Low) on NCI Measures of Safety 2006
100%
95%
90%
85%
80%
75%
70%
80.6% 79.6%
Safe at Home Safe in Neighborhood
MA NCI State Avg NCI High NCI Low
Action Required Reports. Action Required Reports are issued by the DMR Survey and Certification unit when there are issues identified that affect the safety and welfare of individual consumers. Two categories of Action Required Reports are associated with environmental safety. The action reports are divided into those that need to be corrected within 24 hours and those that pose a less immediate threat. As can be seen in Table 28, there was a rather large and substantial reduction in the number of Action Required Reports during FY 2006. In FY 2007 the number of reports pertaining to environmental issues experienced an increase. Although higher than the prior year, the number of such reports in 2007 was still lower than for the period of time between 2003 and 2005. Given this fluctuation, no clear trend is present.
43

2006/2007 Quality Assurance Report
Table 28 Action Required Reports for Environmental Issues
FY 2003 - 2007
Action Required Reports: Environmental Issues 2003 2004 2005 2006 2007
Percent Change
2006-2007 Type of Change
No. Reports for Environmental Issues 90 62 75 45 57 27%
-
Percent of Total Reports 33% 34% 59% 38% 41%
Indicator 2: People can safely evacuate in an emergency. Measures: Percentage of individuals who can safely evacuate in an emergency Data Source: Survey and Certification 5.1C FINDINGS: Table 29 provides information related to safe evacuation13 in living and working environments. Survey and Certification review findings continue to demonstrate an extremely consistent trend for this measure, with a very slight increase noted during 2006 and 2007. Table 30 provides an overview of Action Required Reports issued for concerns regarding safe evacuation. As can be seen, the significant decrease in 2005 from prior years was maintained in both 2006 and 2007. Figures 25 and 26 illustrate the relative proportion of Action Required Reports associated with Evacuation and Environmental issues compared to reports issued for other types of concerns during both FY 2006 and FY 2007.
Table 29 Percentage of Persons Able to Safely Evacuate
FY 2003 - 2007
Safely Evacuate 2003 2004 2005 2006 2007
Type of Change
2006-2007
No. Reviewed 2,162 2,184 2,438 3,080 2,741
No. able to Evacuate 2,079 2,103 2,360 3,010 2,685
Percent able to Evacuate 96% 96% 97% 98% 98%
13 Safe evacuation is defined as being able to leave a residence with or without assistance within 2.5 minutes.
44

2006/2007 Quality Assurance Report
Table 30 Action Required Reports for Evacuation Issues
FY 2003 - 2007
Action Required Reports: Evacuation 2003 2004 2005 2006 2007
Percent Change
2006-2007
Type of Change
2006-2007 No. Reports for Evacuation Issues 48 41 25 23 24 4%
Percent of Total Reports 18% 23% 20% 19% 18%
Figure 25 Distribution of Action Required Reports for FY 2006
Other
( ) 37% (
( ) 18% l
i i(
Environment n=45
Evacuation n=23) 19%
Funds n=21
Hea th & Med cat on
n=22) 18%
(n=9) 8%
Figure 26 Distribution of Action Required Reports for FY 2007
( ) 42%
(
(
lion
(
(
Environment n=55
Evacuation n=24) 18%
Funds n=27) 20%
Hea th & Medicat
n=18) 13%
Other n=10) 7%
45

2006/2007 Quality Assurance Report
Indicator 3: People and their supporters know what to do in an emergency.
Measures: Percentage of individuals who know what to do in an emergency Data Source: Survey and Certification (5.1B) FINDINGS: Survey and Certification reviewers evaluate the general knowledge of individuals and their support staff regarding how to respond emergency situations. Table 31 presents the results for this measure over the past five years. As can be seen, a very high percentage of people interviewed (94%+) appear to know what to do in an emergency. This finding has been consistent since 2003.
Table 31 No. and Percentage of Persons Who Know What to Do in an Emergency
FY 2003 - 2007
Emergency Response 2003 2004 2005 2006 2007
Type of Change
2004-2005
No. Reviewed 2162 2184 2438 3080 2741
No. Know What to Do 2030 2036 2306 2918 2572
Percent Know What to Do 94% 93% 95% 95% 94%
WHAT DOES THIS MEAN? The vast majority of individuals reviewed by the DMR Survey and Certification process for both 2006 and 2007 live and work in safe and secure environments. Most people served by DMR (80%) report feeling safe both at home and within their neighborhoods. Almost all individuals who were reviewed during this time period are able to safely evacuate (98%) and possess knowledge on how to properly respond to an emergency situation (94%).
46

2006/2007 Quality Assurance Report
PRACTICE HUMAN & CIVIL RIGHTS OUTCOME: People understand and practice their human and civil
rights. Indicator: 1. People exercise their rights in their everyday lives.
RESULTS: Over time there has been very little change in the Survey and Certification findings regarding the extent to which individuals in DMR-reviewed programs understand and practice their human and civil rights and are treated with respect by staff and others.
Figure 27 illustrates the general trends for this outcome for the past two fiscal years.
Figure 27 Summary of Trends for Human and Civil Rights Indicators and Measures
FY 2006 – 2007
OUTCOME Indicator Measure Change
FY05-FY06 Change
FY06-FY07
Practice Rights -People understand and practice their human and civil rights. 1. People exercise their rights
Percent Exercise Rights
Percent Treated Same
Percent Treated with Respect Direction of Arrow = increase, decrease, stableGreen = positive trend (+)Red = negative trend (-)White = slight change/neutral trend
47

2006/2007 Quality Assurance Report
OUTCOME:
Indicator 1: Measures:
Data Source:
FINDINGS:
People understand and practice their human and civil rights. People exercise their rights in their everyday lives.
Percentage of individuals found to be exercising their rights
Percentage of people who receive the same treatment as other employees at work Percentage of people who experience respectful interactions compared to NCI Survey and Certification (1.2B, 1.2C, 1.1A) NCI
Exercise Rights. The extent to which people were seen as exercising their rights in their everyday lives based on Survey and Certification reviews remained extremely high (97%) for both 2006 and 2007. As can be seen Table 32, since FY 2003 there has been a gradual and steady growth in the percentage of individuals who have been determined to be able to exercise rights in surveyed programs.
Table 32 No. and Percentage of Persons Who Exercise Their Rights
FY 2003 - 2007
Exercise Rights 2003 2004 2005 2006 2007
Type of Change
2006-2007
No. Applicable 2,162 2,184 2,438 3,081 2,743
No. Exercising Rights 2,027 2,082 2,356 2,997 2,674 Percent Exercising Rights 94% 95% 97% 97% 97%
Same Treatment. The Survey and Certification process also reviews the extent to which individuals within DMR employment settings are treated the same as other employees. As can be seen below in Table 33, reviews demonstrate the presence of a very stable trend, with over 97% of individuals reviewed determined to be treated in the same manner as other non-disabled employees during FY 2006 and 2007, about the same level as previous years.
48

2006/2007 Quality Assurance Report
Table 33 No. and Percentage of Persons Who Receive the Same Treatment
as Other Employees (Employment Programs Only) FY 2003 - 2007
Treated Same as Other Employees 2003 2004 2005 2006 2007
Type of Change
2006-2007
No. Reviewed 948 914 1,000 1,285 1,160
No. Treated Same 916 888 974 1,247 1,133
Percent Treated Same 97% 97% 97% 97% 98%
Respectful Interactions. Survey and Certification reviews during 2006 and 2007 found that 99%+ of individuals within settings/programs reviewed by the unit were found to experience respectful interactions with staff and others. Interestingly these results are somewhat higher than those obtained in the Phase VIII National Core Indicators evaluation.14 As can be seen below in Table 34 and Figure 28, NCI results suggest that about 88% of individuals who receive residential services indicate that staff treat them with respect. A somewhat higher percentage of people (93%) indicate staff in day service programs treat them with respect. Massachusetts falls slightly below the national state average for both residential and day (employment) ratings.
Table 34 Percentage of Persons Experiencing Respectful Interactions
Comparison of Massachusetts DMR with National Core Indicators 2003 – 2007
Respectful Interactions 2003 2004 2005 2006 2007
Type of Change
2006-2007 MA Day & Residential (S&C) 97.0% 98.0% 99.0% 99.6% 99.0%
MA DMR NCI - Resid 87.7% 88.0%
MA DMR NCI - Day 93.2% 93.0%
State Avg NCI - Resid 89.0% 88.4% 89.4% 89.4%
State Avg NCI - Day 94.0% 93.5% 93.3% 94.6% MA Day/Res from Survey and Certification reviews
MA and State Average NCI from Phase VIII report, 2005/06, issued March 2007
14 The Massachusetts Survey and Certification data combines residential and day settings, whereas the NCI data is reported separately for each type of service/support setting. The NCI results are based on consumer interview responses (consumer perspective) and represent a broader-based population.
49

2006/2007 Quality Assurance Report
Figure 28 Percent of Persons Experiencing Respectful Interactions
Comparison of DMR Survey and Certification Findings with Phase VIII NCI Results for Massachusetts and the National State Average
Per
cent
99.6%
100%
94.6% 95% 93.0%
89.4% 90% 88.0%
85%
80%
75%
70%
S/C - Day and NCI - Resid Staff NCI - Day Staff Resid
MA DMR NCI National Ave
WHAT DOES THIS MEAN? Almost all individuals receiving supports that are reviewed through the DMR Survey and Certification process appear to be practicing their civil and human rights. The percentage of persons reported to experience respectful interactions within Massachusetts DMR is also very high. NCI results in Massachusetts continue to suggest that more respect is shown by staff in day service settings than in residential programs, a finding that parallels that found across the nation.
50
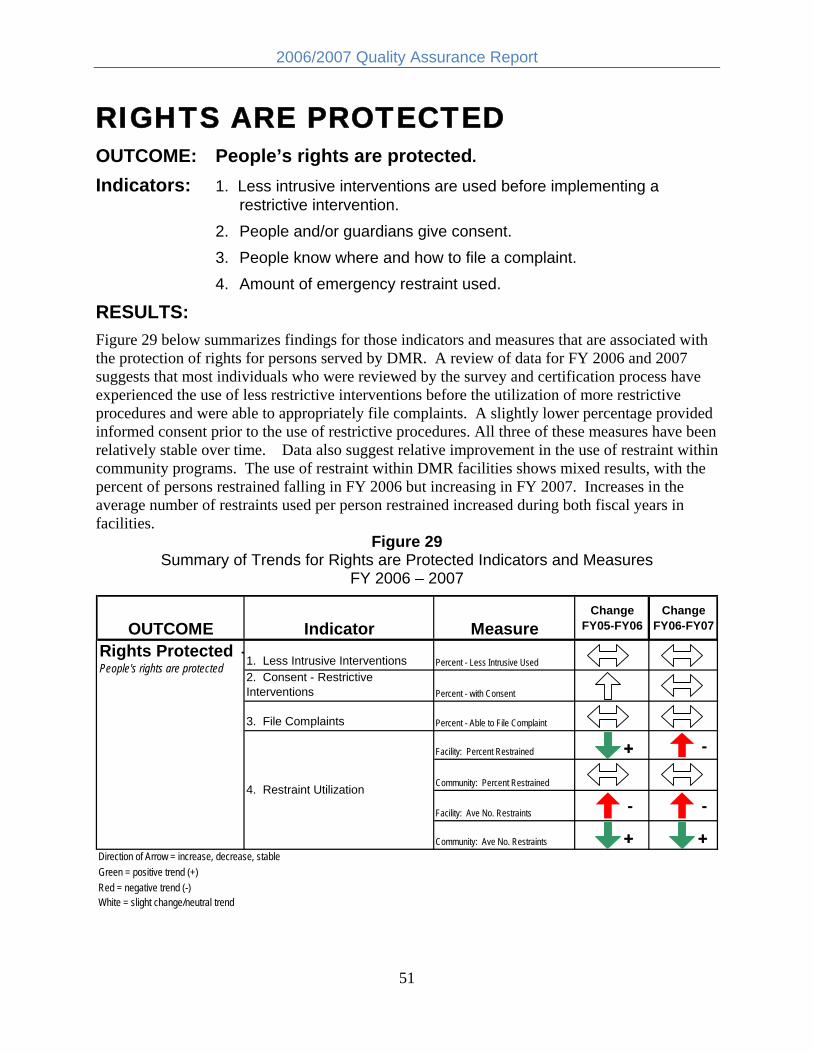
2006/2007 Quality Assurance Report
RIGHTS ARE PROTECTED OUTCOME: People’s rights are protected.
Indicators: 1. Less intrusive interventions are used before implementing a restrictive intervention.
2. People and/or guardians give consent. 3. People know where and how to file a complaint. 4. Amount of emergency restraint used.
RESULTS: Figure 29 below summarizes findings for those indicators and measures that are associated with the protection of rights for persons served by DMR. A review of data for FY 2006 and 2007 suggests that most individuals who were reviewed by the survey and certification process have experienced the use of less restrictive interventions before the utilization of more restrictive procedures and were able to appropriately file complaints. A slightly lower percentage provided informed consent prior to the use of restrictive procedures. All three of these measures have been relatively stable over time. Data also suggest relative improvement in the use of restraint within community programs. The use of restraint within DMR facilities shows mixed results, with the percent of persons restrained falling in FY 2006 but increasing in FY 2007. Increases in the average number of restraints used per person restrained increased during both fiscal years in facilities.
Figure 29 Summary of Trends for Rights are Protected Indicators and Measures
FY 2006 – 2007
OUTCOME Indicator Measure Change
FY05-FY06 Change
FY06-FY07
Rights Protected -People's rights are protected 1. Less Intrusive Interventions Percent - Less Intrusive Used
2. Consent - Restrictive Interventions Percent - with Consent
3. File Complaints Percent - Able to File Complaint
4. Restraint Utilization
Facility: Percent Restrained ++ -
Community: Percent Restrained
Facility: Ave No. Restraints - -
Community: Ave No. Restraints ++ ++Direction of Arrow = increase, decrease, stable
Green = positive trend (+)Red = negative trend (-)White = slight change/neutral trend
51

2006/2007 Quality Assurance Report
OUTCOME: People’s rights are protected. Indicator 1: Less intrusive interventions are used before
implementing a more restrictive intervention. Measures: Percentage of individuals who have had less intrusive interventions
tried. Data Source: Survey and Certification (1.3A)
FINDINGS: Table 35 below presents findings from Survey and Certification reviews regarding the use of less intrusive interventions for fiscal years 2003 through 2007. Over the past five years a relatively high percentage of individuals who were reviewed had evidence that less intrusive interventions were used before programs implemented more intrusive approaches. The trend has been stable over time, slowly and consistently increasing to 98% by 2006 and continuing into 2007.
Table 35 No. and Percentage of Persons with Less Intrusive Interventions Used First
FY 2003 - 2007
Less Intrusive Interventions 2003 2004 2005 2006 2007
Type of Change
2004-2005
No. Reviewed 1,155 1,548 1,776 2,612 2,210 Less Intrusive Interventions Used First 1,097 1,509 1,730 2,563 2,162 Percent Less Intrusive Interventions Used First 95% 97% 97% 98% 98%
Indicator 2: People and guardians give consent for restrictive interventions.
Measures: Percentage of individuals who provide informed consent for the use of restrictive interventions
Data Source: Survey and Certification (1.3C)
FINDINGS: During the Survey and Certification process, a review is conducted to determine whether informed consent was given for the use of any restrictive interventions. This review includes an analysis as to whether a full explanation is provided regarding the risks and benefits of a procedure and the presence of an appropriate explanation of a person’s rights to withdraw that consent at any time. Survey and Certification reviews in FY 2006 indicate that 89% of persons with restrictive interventions had all appropriate processes followed with respect to obtaining informed consent, an increase from levels present in prior years. Reviews conducted in FY 2007 show that 83% of restrictive interventions had undergone all the necessary
52

2006/2007 Quality Assurance Report
procedures related to obtaining informed consent, a decrease from 2006 but still slightly higher than levels obtained in FY 2003 through FY 2005.
Table 36 No. and Percentage of Persons with Restrictive Interventions
Who Provided Informed Consent FY 2003 - 2007
Consent for Restrictive Interventions 2003 2004 2005 2006 2007
Type of Change
2006-2007
No. Applicable 921 991 1,148 1,498 1,195
No. with Consent 716 811 939 1,338 987
Percent with Consent 78% 82% 82% 89% 83%
Indicator 3: People know where and how to file a complaint. Measures: Percentage of individuals who know where and how to file complaints. Data Source: Survey and Certification (5.2E)
FINDINGS: FINDINGS: Survey and Certification reviews indicate that almost all persons in reviewed programs (99%) possessed the knowledge on how to file complaints and were able to do so during both FY 2006 and FY 2007. Reviews suggest that this quality measure has been extremely stable over the past five years.
Table 37 No. and Percentage of Persons Able to File Complaints
FY 2003 - 2007
Know How to File Complaint 2003 2004 2005 2006 2007
Type of Change
2006-2007
No. Reviewed 2,162 2,184 2,438 3,081 2,743 No. Able to File Complaint 2,110 2,148 2,386 3,039 2,711 Percent Able to File Complaint 98% 98% 98% 99% 99%
WHAT DOES THIS MEAN? Almost all individuals reviewed in the Survey and Certification process know how to file complaints and are provided with less intrusive interventions prior to the use of more restrictive procedures. A somewhat lower percentage of individuals have been provided with all the necessary steps for informed consent prior to the use of a restrictive procedure. All trends appear stable.
53

2006/2007 Quality Assurance Report
Indicator 4: Restraint utilization. Measures: Number and percentage of individuals served by DMR who experience
emergency restraint Average number of restraints used per person restrained
Data Source: DMR Restraint database FINDINGS: Percent Restrained. Table 38 provides information regarding the use of restraint in both community-based and DMR operated residential facilities between FY 2003 and FY 2007. As can be seen, approximately 6% of all individuals served by DMR in residential programs over this time period have experienced an emergency restraint.15 Compared to prior years, FY 2006 experienced a slight reduction in both the number of persons restrained and the percentage of the population that was restrained at least once. However, both measures increased slightly in FY 2007, with the increase most noticeable within DMR facilities (an increase of 25% from 2006 levels); although FY 2007 levels were similar to those observed in FY 2005.
Table 38 Restraint Utilization for Persons in Facilities and Community Settings
FY 2003 - 2007
Percent Population Restrained
Residential Setting
No. People Served
No. People Restrained
Percent of Population Restrained
Type of Change
2006-2007
Facility 1,157 68 5.88% 2003 Community 12,417 711 5.73%
Combined 13,574 779 5.74% Facility 1,109 49 4.42%
2004 Community 12,301 733 5.96% Combined 13,410 782 5.83% Facility 1,067 63 5.90%
2005 Community 12,574 746 5.93% Combined 13,641 809 5.93%
Facility 1,013 48 4.74% 2006 Community 12,773 729 5.71%
Combined 13,786 777 5.64%
Facility 994 59 5.94% -
2007 Community 12,547 758 6.04%
Combined 13,541 817 6.03%
15 The number of people subject to restraint was derived from the CRS database of all active individuals over the age of 18. Persons in family and individual support services are not included.
54

2006/2007 Quality Assurance Report
Figure 30 illustrates the five year trend in restraint utilization (the percentage of people that experienced restraint) for the combined DMR population. As can be seen, there has been a small but gradual increase over time, with the exception of FY 2006.
Figure 30 Percent Population Restrained
Combined Facilities and Community FY 2003 - 2007
6.03%
5.74% 5.83%
5.93%
5.64%
2003 2004 2005 2006 2007
Figure 31 illustrates the differential trends over time in the percentage of population restrained for facilities and community programs. As can be seen, within community programs the trend has been relatively stable, increasing slightly in FY 2007 to the same level observed in FY 2004. However, the trend for facilities is much more erratic, showing a “zig-zag” pattern of increases and decreases over time. While the total population within facilities has gradually declined, the increase in restraint observed for FY 2007 was a function of both a real increase in the number of people restrained as well as the drop in population.
55
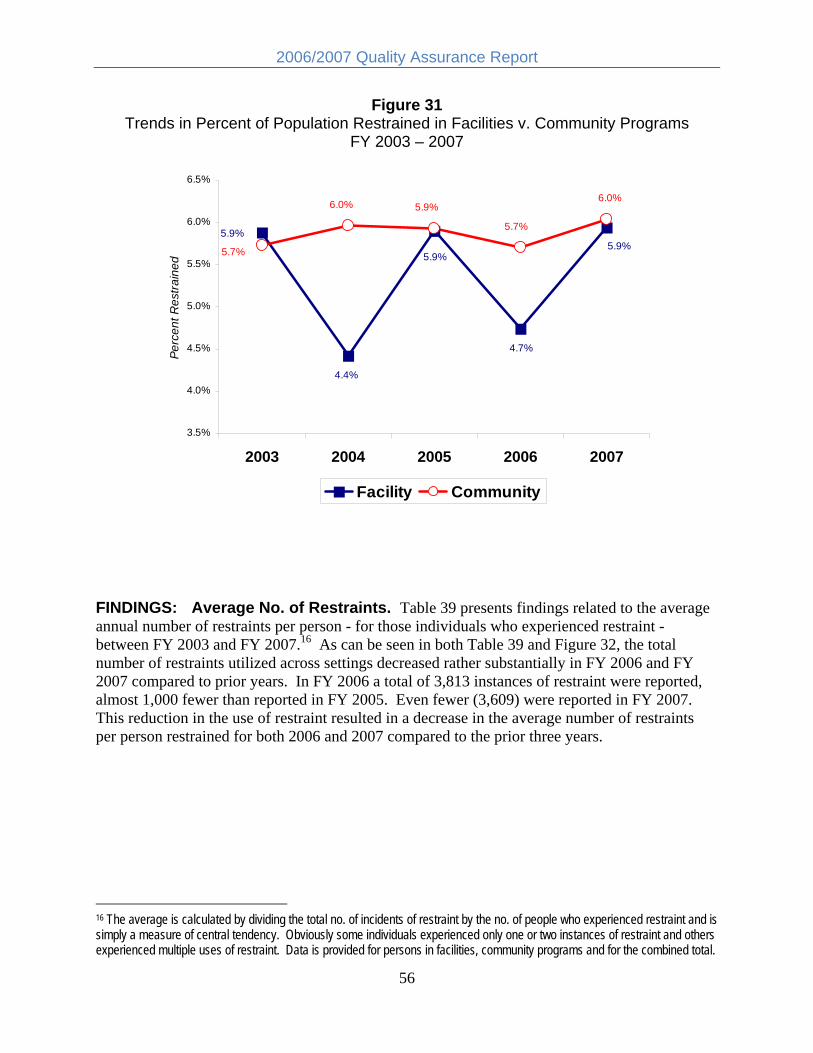
2006/2007 Quality Assurance Report
Figure 31 Trends in Percent of Population Restrained in Facilities v. Community Programs
FY 2003 – 2007
Perc
ent R
estra
ined
6.5%
6.0%
5.5%
5.0%
4.5%
4.0%
3.5%
5.9% 5.9%
5.9%
4.7%
4.4%
5.7%
6.0%
5.7%
6.0% 5.9%
2003 2004 2005 2006 2007
Facility Community
FINDINGS: Average No. of Restraints. Table 39 presents findings related to the average annual number of restraints per person - for those individuals who experienced restraint between FY 2003 and FY 2007.16 As can be seen in both Table 39 and Figure 32, the total number of restraints utilized across settings decreased rather substantially in FY 2006 and FY 2007 compared to prior years. In FY 2006 a total of 3,813 instances of restraint were reported, almost 1,000 fewer than reported in FY 2005. Even fewer (3,609) were reported in FY 2007. This reduction in the use of restraint resulted in a decrease in the average number of restraints per person restrained for both 2006 and 2007 compared to the prior three years.
16 The average is calculated by dividing the total no. of incidents of restraint by the no. of people who experienced restraint and is simply a measure of central tendency. Obviously some individuals experienced only one or two instances of restraint and others experienced multiple uses of restraint. Data is provided for persons in facilities, community programs and for the combined total.
56

2006/2007 Quality Assurance Report
Table 39 Average No. Restraints per Person
FY 2003 - 2007
Avg No. Restraints per Person Restrained
Setting No. People Restrained
Total No. of Restraints
Average per Person
Restrained
Type of Change
2006-2007
Facility 68 340 5.00 2003 Community 711 4,043 5.69
Combined 779 4,383 5.63 Facility 49 267 5.45
2004 Community 733 4,542 6.20 Combined 782 4,809 6.15 Facility 63 242 3.84
2005 Community 746 4,522 6.06 Combined 809 4,764 5.89 Facility 48 276 5.75
2006 Community 729 3,537 4.85 Combined 777 3,813 4.91
Facility 59 388 6.58 -2007 Community 758 3,221 4.25 +
Combined 817 3,609 4.42 +
This pattern in the reduction in restraint was not, however, present for both community and facility programs. The actual number of instances of restraint in DMR facilities increased during both FY 2006 and FY 2007 compared to prior years. This increase, which was accompanied by an actual reduction in the number of people served in those settings, is illustrated in Figure 33.
Conversely, the number of instances of restraint utilized in community programs underwent a dramatic reduction, dropping from 4,522 instances in FY 2005 to 3,221 during FY 2007 and reversing the trend present before FY 2005. This reduction was responsible for the overall (combined) decrease noted above and is illustrated below in Figure 34.
57

2006/2007 Quality Assurance Report
Figure 32 Total No. of Emergency Restraints Utilized in DMR
FY 2003 – 2007
li
4,383
4,809 4,764
3,813
3,609
2,000
2,500
3,000
3,500
4,000
4,500
5,000 To
ta N
o. R
estra
nts
2003 2004 2005 2006 2007
Figure 33 Trends in Total No. of Restraints Used in DMR Facilities
FY 2003 – 2007
100
150
200
250
300
350
400
i
340
267
242
276
388
No.
Res
trant
s
2003 2004 2005 2006 2007
58

2006/2007 Quality Assurance Report
Figure 34 Trends in Total No. of Restraints Used in Community Programs
FY 2003 – 2007 5000
No.
Res
train
ts
4542 45224500
4043
4000
3500 3,221
3000
2500
2000
3,537
2003 2004 2005 2006 2007
This difference between facility and community program use of restraint resulted in a differential trend in the average number of restraints used per person restrained. As can be seen in Figure 35, this measure has consistently decreased in community settings since 2005. Within facility programs the average number of restraints per person restrained has consistently increased over this same time period, surpassing the average for community programs for the first time during FY 2006.
59
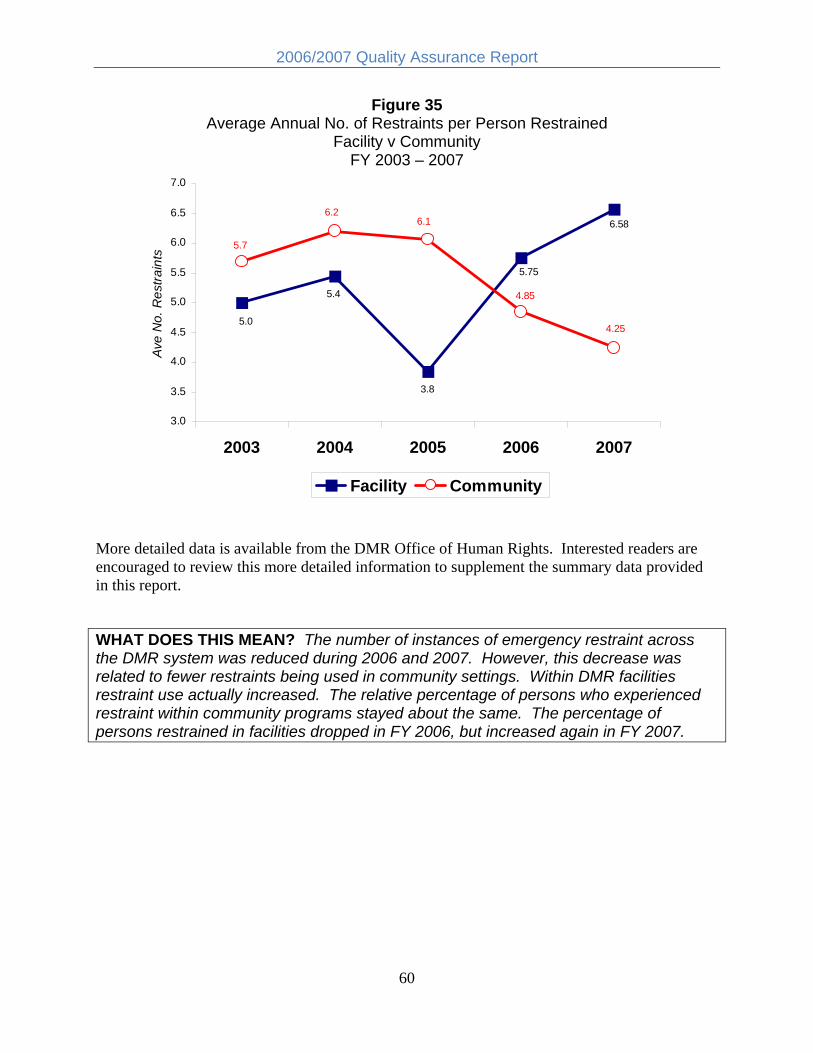
2006/2007 Quality Assurance Report
Figure 35 Average Annual No. of Restraints per Person Restrained
Facility v Community Av
e N
o. R
estra
ints
FY 2003 – 2007
7.0
6.5
6.0
5.5
5.0
4.5
4.0
3.5
3.0
5.75
3.8
5.4
5.0 4.25
6.1 6.2
5.7
6.58
4.85
2003 2004 2005 2006 2007
Facility Community
More detailed data is available from the DMR Office of Human Rights. Interested readers are encouraged to review this more detailed information to supplement the summary data provided in this report.
WHAT DOES THIS MEAN? The number of instances of emergency restraint across the DMR system was reduced during 2006 and 2007. However, this decrease was related to fewer restraints being used in community settings. Within DMR facilities restraint use actually increased. The relative percentage of persons who experienced restraint within community programs stayed about the same. The percentage of persons restrained in facilities dropped in FY 2006, but increased again in FY 2007.
60

2006/2007 Quality Assurance Report
CHOICE & DECISION-MAKING OUTCOME: People are supported to make their own decisions. Indicators: 1. People make choices about their everyday routines and schedules.
2. People control important decisions about their home and home life. 3. People choose where they work. 4. People influence who provides their supports.
RESULTS: Analysis of Survey and Certification data related to choice and decision-making suggests the continuation of a stable trend across all measures. This trend can be seen in Figure 36 below. National Core Indicators (NCI) findings for 2006 show improvement in a number of dimensions of choice and control for persons served by DMR. Massachusetts falls in the mid-range on all measures of choice compared to other NCI participating states.
Figure 36 Summary of Trends for Choice & Decision-making Indicators and Measures
2006 – 2007
OUTCOME Indicator Measure Change
FY05-FY06 Change
FY06-FY07
Choice & Decision making People are supported to make their own decisions.
-1. Choices re: everyday routines
Percent - Choose schedule
Comparison with NCI
2. Decisions re: home and home life
Percent - Control decisions
Comparison with NCI
3. Choose where work Percent - Choose where work
Comparison with NCI
4. Influence who provides support Percent - Influence who supports
Comparison with NCI
Direction of Arrow = increase, decrease, stable
Green = positive trend (+)Red = negative trend (-)White = slight change/neutral trend
61

2006/2007 Quality Assurance Report
OUTCOME: People are supported to make their own decisions. Indicator 1: People make choices about their everyday routines and
schedules. Measures: Percentage of individuals who choose their own schedule
Comparison to NCI Data Source: Survey and Certification (2.2A)
NCI
FINDINGS: Survey and Certification findings continue to show that almost all persons (98%) who were reviewed in both FY 2006 and FY 2007 were able to choose their daily schedule. This measure has very gradually improved over time. Table 40 below presents both Survey and Certification results, data from the recent NCI evaluations for DMR and the national NCI results for both 2005 and 2006 for this measure. As can be seen, while the NCI results are somewhat lower for Massachusetts than the Survey and Certification findings, rather substantial improvement in the NCI took place between 2005 and 2006 for DMR. In fact, in 2006 the percentage of persons surveyed in Massachusetts who indicated they could decide their daily schedule was slightly higher than the national state average for this measure.
Table 40 Percent Who Choose Daily Schedule
Survey and Certification Reviews and NCI 2003 – 2007
Choose Daily Schedule 2003 2004 2005 2006 2007
Change MA 2006-2007
Choose Schedule - DMR S&C 96% 97% 97% 98% 98% Decide Daily Schedule - DMR NCI 76% 85% Decide Daily Schedule - State Avg NCI 84% 83% 82% 82% DMR S&C only reviews persons in licensed/certified programs NCI - samples all persons served by the state agency
Indicator 2: People control important decisions about their home and home life.
Measures: Percentage of individuals who control important decisions about home life Comparison to NCI
Data Source: Survey and Certification (2.3C) NCI
62

2006/2007 Quality Assurance Report
FINDINGS: Table 41 below presents the results of the Survey and Certification reviews associated with the extent to which individuals have exercised control over decisions regarding their home life between FY 2003 and FY 2007. Slight improvements over findings in 2005 are present.
Results from the NCI show a substantially lower proportion of people who report they are able to control important decisions about their home life, as measured by response to specific questions related to choice over where to live and who to live with.17 In all instances, the NCI results are substantially lower than the Survey and Certification results. Interestingly, improvement on the more recent NCI is once again present for Massachusetts, with a sizeable increase from 2005 to 2006 in the percentage of persons reporting they can choose with whom to live. Whereas in 2005 results for Massachusetts fell below the national state average for both questions, in 2006 Massachusetts slightly exceeded the national average.
Table 41 Percent Who Control Important Decisions Survey and Certification Reviews and NCI
2003 – 2007 Control Important Decisions 2003 2004 2005 2006 2007
Change MA 2006-2007
Decisions re: Home/life - DMR S&C 92% 93% 91% 95% 94% Choose Where Live DMR NCI 43% 55% Choose Where Live State Avg NCI 49% 54% 56% 54% Choose Who Live With - DMR NCI 36% 47% Choose Who Live With - State Avg NCI 44% 47% 49% 46%
Indicator 3: People choose where they work. Measures: Percentage of individuals who choose where they work and what type
of work/day activity they are involved in. Comparison to NCI
Data Source: Survey and Certification (2.3D) NCI
FINDINGS: Survey and Certification findings show that the percentage of persons reviewed who had exercised choice over where they work (or if not engaged in employment, were able to control their day activity) fell slightly in 2007 compared to 2006. Over the five-year time period
17 The NCI questions represent a much more rigorous standard in that they measure actual choice and decision-making over an important quality of life standard rather than “influence over and input into” general decisions as measured by the Survey and Certification process. This difference may be responsible for lower ratings on the NCI for similar measures.
63

2006/2007 Quality Assurance Report
between FY 2003 and FY 2007, this measure has remained relatively stable, fluctuating between 82% and 87%. These findings are presented below in Table 42.
As on previous measures of choice and control Survey and Certification findings were higher than for the NCI data and improvement in the Massachusetts NCI results took place between 2005 and 2006. Interestingly, while Massachusetts was substantially lower than the national state average for this measure in 2005 it actually exceeded the average for 2006.
Table 42 Percent Who Choose Where They Work
Survey and Certification Reviews and NCI 2003 – 2007
Choose Where Work 2003 2004 2005 2006 2007 Change MA 2006-2007
Choose Work - DMR S&C 82% 88% 85% 87% 85%
Choose Work - DMR NCI 46% 63% Choose Work - State Avg NCI 61% 62% 64% 61%
Indicator 4: People influence who provides their support. Measures: Percentage of individuals who influence who provides their support
(staff) Comparison to NCI
Data Source: Survey and Certification (2.3B) NCI
FINDINGS: Survey and Certification findings for this indicator are presented below in Table 43. As can be seen, since FY 2003 over 90% of those reviewed were determined to have exercised influence over who provided them with support. There was a slight improvement in 2006, increasing to 95% but falling back to 91% in FY 2007.
As with other indicators of choice and control, the NCI measures are more specific and focused on actual choice (selection) of staff for both residential and day supports as opposed to “influence” over decisions. As can be seen in Table 43, the percentages of persons indicating they either chose or had assistance choosing staff support was lower than that obtained in the Survey and Certification reviews. However, and as noted on all of the previous NCI measures of choice, improvement for Massachusetts took place between 2005 and 2006 for both measures of choice/control over who provides support. Over 2/3 of respondents in 2006 indicated they could
64

2006/2007 Quality Assurance Report
choose staff who provided support in their home (residence) compared to 58% in 2005. A smaller increase was observed for choice over staff in the employment setting/program, increasing from 67% to 69%.
Table 43 Percent Who Choose Support Staff
Survey and Certification Reviews and NCI 2003 – 2007
Influence Who Provides Support 2003 2004 2005 2006 2007
Change MA 2006-2007
Influence Support - DMR S&C 91% 93% 92% 95% 91% Choose Staff Home DMR NCI 58% 67% Choose Staff Home State Avg NCI 61% 63% 63% 66% Choose Staff Work - DMR NCI 67% 69% Choose Staff Work - State Avg NCI 67% 66% 68% 68%
Table 44 compares findings from the 2005 and 2006 NCI for the Massachusetts DMR that are related to a broad range of measures of choice and control. Improvement is noted for 7 of the 9 specific measures of choice. Two measures remained stable (no change) between surveys.
Table 44 Changes in NCI Findings re: Choice and Control
Massachusetts DMR: 2005 and 2006
Choice & Control: MA DMR NCI
2005 MA NCI
Eval
2006 NCI Phase
VIII Difference 2005-2006
Type of Change
Decide Schedule 76.2% 84.6% 8.4%
Spend Free Time 88.4% 92.8% 4.4%
Use Spending Money 82.7% 89.4% 6.7%
Choose Where Live 42.6% 54.7% 12.1%
Choose Who Live With 35.9% 46.8% 10.9%
Choose Where Work 45.9% 62.6% 16.7%
Choose Staff - Home 58.1% 67.2% 9.1%
Choose Staff - Work 67.0% 68.6% 1.6%
Choose CM/Serv Coor 48.0% 56.7% 8.7%
65

2006/2007 Quality Assurance Report
National Core Indicators Comparison for Measures of Choice and Control Table 45 presents a summary of findings on the most recent (Phase VIII) NCI for both Massachusetts and the national state average for consumer survey items associated with choice and control. As can be seen, Massachusetts exceeded the national average on all but one of these 9 measures with only choice regarding one’s service coordinator falling slightly below the national state average.
Table 45 Comparison of MA DMR and National State Average
Phase VIII NCI Measures re: Choice and Control 2006
NCI: Choice and Control
MA DMR NCI
State Avg NCI
Difference MA - State
Avg
Decide Schedule 84.6% 82.4% 2.2%
Spend Free Time 92.8% 91.1% 1.7%
Use Spending Money 89.4% 87.5% 1.9%
Choose Where Live 54.7% 53.8% 0.9%
Choose Who Live With 46.8% 46.3% 0.5%
Choose Where Work 62.6% 61.2% 1.4%
Choose Staff - Home 67.2% 66.2% 1.0%
Choose Staff - Work 68.6% 67.6% 1.0%
Choose CM/Serv Coor 56.7% 56.9% -0.2%
Figures 37 to 39 provide illustrations of the Massachusetts NCI results compared to the corresponding state average and the range (highest and lowest) for all NCI participating states. Massachusetts was in the middle range for all measures of choice and control.
66

2006/2007 Quality Assurance Report
Figure 37 Comparison of Massachusetts to the State Average and Range
Phase VIII NCI Measures of Choice re: Routine and Money
70%
75%
80%
85%
90%
95%
100%
92.8%
84.6%
89.4%
Per
cent
"Yes
"
Decide Schedule Spend Free Time Use Spending Money
MA NCI NCI State Avg NCI High NCI Low
Per
cent
"Yes
"
Figure 38 Comparison of Massachusetts to the State Average and Range
Phase VIII NCI Measures of Choice re: Residence and Work
75%
70%
65%
60%
55%
50%
45%
40%
35%
46.8%
62.6%
54.7%
Choose Where Choose Who Live Choose Where Live With Work
MA NCI NCI State Avg NCI High NCI Low
67

2006/2007 Quality Assurance Report
Figure 39 Comparison of Massachusetts to the State Average and Range
Phase VIII NCI Measures of Choice re: Staff
75% P
erce
nt "Y
es"
70%
65%
60%
55%
50%
68.6%
56.7%
67.2%
Choose Staff - Choose Staff - Choose CM/Serv Home Work Coor
MA NCI NCI State Avg NCI High NCI Low
WHAT DOES THIS MEAN? Individuals served in programs that are reviewed by the DMR Survey and Certification process appear to experience relatively high levels of input into choice and personal decision-making. Over the past five years, these levels have remained about the same. National Core Indicator survey results indicate substantial improvement for Massachusetts between 2005 and 2006 on almost all measures of choice and control. Unlike previous years (when Massachusetts fell below the national average on all measures of choice), in 2006 Massachusetts exceeded the national state average for 8 of the 9 measures associated with choice and control. Compared to all other states that participated in the NCI in 2006, Massachusetts falls in the middle range.
68

2006/2007 Quality Assurance Report
COMMUNITY INTEGRATION OUTCOMES: People use integrated community resources and participate in
everyday community activities.
People are connected to and valued members of their community
Indicators: 1. People use the same community resources as others on a frequent and on-going basis.
2. People are involved in activities that connect them to other people in the community.
RESULTS: Analysis of Survey and Certification data related to community integration suggests the continuation of a relatively stable trend associated with the use of community resources by persons served by DMR. Involvement in community activities increased in FY 2006 from levels achieved in prior years. However, it fell back to 2005 levels in FY 2007. Summary findings are illustrated in Figure 40. Additional information related to community integration, including comparisons with National Core Indicator results, is presented below.
Figure 40 Summary of Trends for Community Integration Indicators and Measures
FY 2006 – 2007
OUTCOME Indicator Measure Change
FY05-FY06 Change
FY06-FY07
Community Integration - People use integrated community resources and participate in everyday community activities.
1. Use the same community resources as others
Percent Use Community Resources
Comparison to NCI
People are connected to and valued members of their 2. Involved in acitivities that connect Percent Involved in Community Activities
+ -
community. to other people Comparison to NCI
Direction of Arrow = increase, decrease, stableGreen = positive trend (+)Red = negative trend (-)White = slight change/neutral trend
69

2006/2007 Quality Assurance Report
OUTCOME:
Indicator 1:
Measures:
Data Source:
People use integrated community resources and participate in everyday community activities. People use the same community resources as others on a frequent and ongoing basis. Percentage of individuals who use community resources Comparison to NCI Survey and Certification (3.1B) NCI
FINDINGS: Survey and Certification findings from 2003 to 2007 indicate a relatively stable trend over time with the percentage of persons who regularly use community resources increasing slightly in FY 2006 but dropping back to pre-2006 levels in FY 2007. These results, presented below in Table 46 and Figure 41, suggest that about 9 out of every 10 individuals in a support/service reviewed by the DMR Survey and Certification process are using community resources on a regular basis.
Table 46 Use of Community Resources
5 Year Trends in Survey and Certification Findings FY 2003 – 2007
Community Resources: [DMR S&C] 2003 2004 2005 2006 2007
Change 2006-2007
Use Community Resources 88% 90% 89% 93% 90%
Figure 41 5 Year Trends in Use of Community Resources
FY 2003 – FY 2007 93%
88% 89%
90% 90%
2003 2004 2005 2006 2007
70

2006/2007 Quality Assurance Report
A comparison of the 2005 and 2006 National Core Indicator results for Massachusetts on survey items related to the use of community resources shows slight improvement for all measures. As can be seen below in Table 47, the largest increases took place for going out to eat and for entertainment.
Table 47 Comparison of 2005 and 2006 NCI for Massachusetts
Community Resource Use
Inclusion - Use of Community Resources: MA DMR NCI
2005 MA NCI
Eval
2006 NCI Phase
VIII Difference 2005-2006
Type of Change
Go Shopping 91.4% 94.3% 2.9%
Go on Errands 94.6% 97.1% 2.5%
Go Out to Eat 88.2% 93.5% 5.3%
Go Out for Entertainment 82.5% 86.4% 3.9%
NCI findings for Massachusetts compared to the national state average on the 2006 NCI are presented in Table 48. As can be seen, Massachusetts appears to be very similar to the average on all measures. Figure 42 further illustrates that Massachusetts falls within the middle range of states on these same indicators of community resource use.
Table 48 Comparison of Phase VIII NCI Findings for Massachusetts and the National State
Average for Measures of Community Resource Use
Community Inclusion: NCI Phase VIII MA NCI
NCI State Avg NCI High NCI Low
Difference MA-State
Avg
Go Shopping 94.3% 94.0% 95.4% 91.9% 0.3%
Go on Errands 97.1% 97.0% 97.6% 96.4% 0.1%
Go Out to Eat 93.5% 93.0% 94.3% 89.4% 0.5%
Go Out Entertainment 86.4% 86.8% 88.2% 85.3% -0.4%
71

2006/2007 Quality Assurance Report
Figure 42 Comparison of Massachusetts to the State Average and Range
Phase VIII NCI Measures of Community Resource Use P
erce
nt "Y
es"
100%
95%
90%
85%
86.4%
97.1%
93.5%
94.3%
Go Shopping Go on Errands Go Out to Eat Go Out Entertainment
MA NCI NCI State Avg NCI High NCI Low
OUTCOME: People are connected to and valued members of their community.
Indicator 1: People are involved in activities that connect them to other people in the community.
Measures: Percentage of individuals involved in activities that connect them to others Comparison to NCI
Data Source: Survey and Certification (3.2B) NCI
FINDINGS: Survey and Certification findings indicate that the percentage of persons who are involved in community activities that promote interaction with and connection to others in the community experienced a sizeable increase in FY 2006 but then fell back down to pre-2006 levels in FY 2007 (see Table 49). This 5-year trend is also illustrated in Figure 43. It should be noted that all recent years, with the exception of FY 2006, are lower on this measure than was present in FY 2002 (74%).
72

2006/2007 Quality Assurance Report
Table 49 Community Involvement
5 Year Trends in Survey and Certification Findings FY 2003 – 2007
Community Involvement: [DMR S&C] 2003 2004 2005 2006 2007
Change 2006-2007
Community Involvement 69% 69% 67% 79% 68%
-
Figure 43 5 Year Trend in Community Involvement
FY 2003 – FY 2007
79%
69% 69% 68%
67%
2003 2004 2005 2006 2007
A comparison of the 2005 and 2006 National Core Indicator results for Massachusetts on survey items related to community involvement shows a substantial increase in the percentage of persons who attend religious services. Smaller increases are present for the other two measures: play integrated sports and attend community meetings/clubs. Table 50 presents this two-year comparison on the NCI.
73

2006/2007 Quality Assurance Report
Table 50 Comparison of 2005 and 2006 NCI for Massachusetts
Community Resource Use
Inclusion - Community Involvement: MA DMR NCI
2005 MA NCI
Eval
2006 NCI Phase
VIII Difference 2005-2006
Type of Change
Attend Religious Services 42.4% 56.4% 14.0%
Clubs/Community Meetings 19.0% 21.3% 2.3%
Play Integrated Sports 34% 39.9% 5.5%
A further comparison of findings for Massachusetts on the 2006 NCI survey with the national state averages shows that persons supported by DMR are involved in community activities at about the same level as their counterparts in other states. This comparison is presented below in Table 51. Figure 44 shows that Massachusetts once again falls within the middle range of all states that participated in the 2006 NCI for measures of community involvement.
Table 51 Comparison of Phase VIII NCI Findings for Massachusetts and the National State
Average for Measures of Community Involvement and Activity
Community Inclusion: NCI Phase VIII MA NCI
NCI State Avg NCI High NCI Low
Difference MA-State
Avg
Attend Religious Services 56.4% 57.0% 61.4% 50.9% -0.6%
Clubs/Community Meetings 21.3% 21.3% 25.5% 16.6% 0.0%
Play Integrated Sports 39.9% 38.9% 45.0% 34.6% 1.0%
74

2006/2007 Quality Assurance Report
Figure 44 Comparison of Massachusetts to the State Average and Range
Phase VIII NCI Measures of Community Involvement P
erce
nt "Y
es"
65%
60%
55%
50%
45%
40%
35%
30%
25%
20%
15%
56.4%
39.9%
21.3%
Attend Religious Clubs/Community Play Integrated Services Meetings Sports
MA NCI NCI State Avg NCI High NCI Low
WHAT DOES THIS MEAN? Approximately 9 out of every 10 individuals in programs reviewed by the DMR survey and certification process use basic community resources whereas only 7 out of every 10 appear to engage in community activities that promote interaction with members of their communities.
NCI data suggest slight improvement in the use of community resources and involvement in community activities between 2005 and 2006. The most noticeable change was associated with attendance at religious services. When compared to other state DD systems Massachusetts falls in the middle range for all measures of community involvement.
75

2006/2007 Quality Assurance Report
RELATIONSHIPS & FAMILY CONNECTIONS OUTCOME: People maintain/gain relationships with family and
friends.
Indicators: 1. People are supported to maintain relationships with family, friends and co-workers.
2. People are supported to develop new friendships. 3. Individuals have education and support to understand and safely
express their sexuality.
RESULTS: Survey and Certification reviews for FY 2006 and FY 2007 show a very high percentage of persons who are supported to maintain existing relationships with family and friends. However, fewer individuals appear to be supported in efforts to gain new friendships, a distinction noted in previous reports. A relatively stable trend is present for all three indicators associated with relationships and family connections – although a decrease did take place for support to gain new relationships in FY 2007. A summary of these findings is illustrated below in Figure 45.
Figure 45 Summary of Trends for Relationships and Family Connections
FY 2006 – 2007
OUTCOME Indicator Measure Change
FY05-FY06 Change
FY06-FY07
Relationships & Family Connections People maintain and gain relationships with family and friends.
1. Support to maintain relationships Percent Maintain Relationships
2. Support to gain new relationships Percent - New Relationships
3. Receive education about intimacy Percent - Educated re: Intimacy
Direction of Arrow = increase, decrease, stableGreen = positive trend (+)Red = negative trend (-)White = slight change/neutral trend
76

2006/2007 Quality Assurance Report
OUTCOME: People maintain and gain relationships with family and friends.
Indicator 1: People are supported to maintain relationships with family, friends and co-workers.
Measures: Percentage of individuals who maintain relationships. Data Source: Survey and Certification (3.3A)
FINDINGS: Survey and Certification reviews for 2003 through 2007 show a very consistent and stable trend in the percentage of persons reviewed who are determined to be receiving support to maintain their relationships with other people. As illustrated below in Table 52, almost all individuals who were reviewed received such support in both 2006 and 2007.
Table 52 Percentage of Persons Supported to Maintain Relationships
FY 2003 – FY 2007
Maintain Relationships 2003 2004 2005 2006 2007
Type of Change
2006-2007
No. Reviewed 1968 1821 1879 2231 2001
No. Maintain Relationships 1933 1789 1843 2209 1947 Percent Maintain Relationships 98% 98% 98% 99% 97%
Indicator 2: People are supported to gain new relationships. Measures: Percentage of individuals who gain new relationships. Data Source: Survey and Certification (3.3B)
FINDINGS: Survey and Certification reviews for 2003 through 2007 continue to show a lower percentage of persons were supported to gain new relationships compared to those with support for maintenance of relationships. As can be seen in Table 53 below, during FY 2006 there was an increase in the number of persons reviewed who were determined to be receiving sufficient support to gain new relationships. However, in FY 2007 the percentage fell back down to levels observed prior to FY 2006.
77
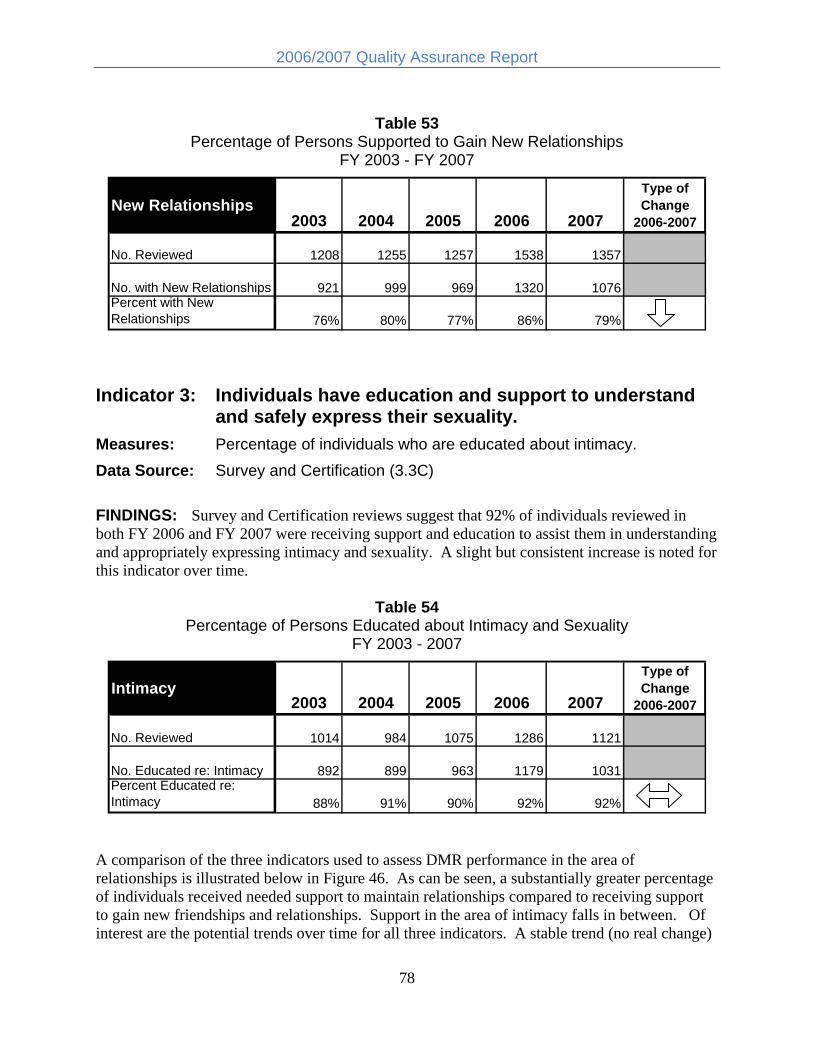
2006/2007 Quality Assurance Report
Table 53 Percentage of Persons Supported to Gain New Relationships
FY 2003 - FY 2007
New Relationships 2003 2004 2005 2006 2007
Type of Change
2006-2007
No. Reviewed 1208 1255 1257 1538 1357
No. with New Relationships 921 999 969 1320 1076 Percent with New Relationships 76% 80% 77% 86% 79%
Indicator 3: Individuals have education and support to understand and safely express their sexuality.
Measures: Percentage of individuals who are educated about intimacy. Data Source: Survey and Certification (3.3C)
FINDINGS: Survey and Certification reviews suggest that 92% of individuals reviewed in both FY 2006 and FY 2007 were receiving support and education to assist them in understanding and appropriately expressing intimacy and sexuality. A slight but consistent increase is noted for this indicator over time.
Table 54 Percentage of Persons Educated about Intimacy and Sexuality
FY 2003 - 2007
Intimacy 2003 2004 2005 2006 2007
Type of Change
2006-2007
No. Reviewed 1014 984 1075 1286 1121
No. Educated re: Intimacy 892 899 963 1179 1031 Percent Educated re: Intimacy 88% 91% 90% 92% 92%
A comparison of the three indicators used to assess DMR performance in the area of relationships is illustrated below in Figure 46. As can be seen, a substantially greater percentage of individuals received needed support to maintain relationships compared to receiving support to gain new friendships and relationships. Support in the area of intimacy falls in between. Of interest are the potential trends over time for all three indicators. A stable trend (no real change)
78

2006/2007 Quality Assurance Report
is observed for maintaining relationships while a gradual increase is present for intimacy. Support for the development of new relationships shows an inconsistent pattern, increasing in some years but declining in others.
Figure 46 Comparison of Indicators for Relationships
FY 2003 - 2007
100%
95%
90%
85%
80%
75%
70%
Maintain Relationships New Relationships Education re: Intimacy
2003 2004 2005 2006 2007
WHAT DOES THIS MEAN? Almost everyone receiving supports reviewed by the Survey and Certification process appear to receive adequate support to maintain existing relationships with family and friends. About 90% of the people reviewed receive support to express intimacy. However, a much smaller proportion of people (about 3 out of 4) receive sufficient support in their efforts to develop new friendships. The level of support for new friendships may be inconsistent over time as measured by the survey and certification process.
National Core Indicators. The NCI has a variety of specific questions related to relationships and friendship. Table 55 provides information on the Massachusetts DMR for these survey items for both 2005 and 2006. As can be seen, approximately 70% of NCI respondents indicated they have a friend other than staff or family and about 80% suggest they have a close friend. A slightly larger percentage (about 85%) indicates they can see their friends or family members whenever they want to. Approximately half of the individuals reviewed in both years indicate they feel lonely some or most of the time.
79

2006/2007 Quality Assurance Report
Table 55 Comparison of 2005 and 2006 Responses for Massachusetts
to NCI Questions re: Relationships
Relationships: MA DMR NCI
2005 MA NCI Eval
2006 NCI Phase VIII
Difference 2005-2006
Type of Change
Have friends other than staff/family 69.9% 70.5% 0.6%
Have a close friend 81.1% 81.4% 0.3%
Can see family when want to 85.4% 86.1% 0.7%
Can see friends when want to 84.7% 84.1% -0.6%
Feel lonely (Not Often/Never) 55.1% 55.0% -0.1%
Table 56 compares Massachusetts with the national state average on these same NCI survey questions. Fewer individuals served by DMR report they have friends other than staff/family or have a close friend when compared to their counterparts in other states (state average). On the other hand, more individuals report they can see family or friends when they want. About the same proportion of people indicate they don’t feel lonely.
Table 56 Comparison of Massachusetts with the National State Average
Phase VIII NCI Questions re: Relationships 2006
NCI: Relationships MA DMR NCI
State Avg NCI
Difference MA - National
Ave Have friends other than staff/family 70.5% 74.6% -4.1%
Have a close friend 81.4% 84.5% -3.1%
Can see family when want to 86.1% 78.9% 7.2%
Can see friends when want to 84.1% 80.1% 4.0%
Feel lonely (Not Often/Never) 55.0% 54.1% 0.9%
Figure 47 illustrates where Massachusetts falls compared to the state average and the range for these items related to relationships. As can be seen, Massachusetts falls in the mid-range for the last item (loneliness).
80

2006/2007 Quality Assurance Report
Figure 47 Comparison of Massachusetts Performance to the State Average and Range on the
Phase VIII National Core Indicators Questions re: Relationships 2006
Per
cent
"Y
es"
100%
90%
80%
70%
60%
50%
40%
30%
20%
70.5%
81.4% 86.1% 84.1%
55.0%
Have Close See Family See Friends Don’t Feel Friends Friend Lonely
MA NCI NCI State Avg NCI High NCI Low Higher is better
WHAT DOES THIS MEAN? Individuals receiving support from the Massachusetts DMR appear to have more access to family members and friends than their peers in other states. However, they may also have fewer friends and/or have a “close” friend less often than their counterparts across the country. Approximately half of all Massachusetts respondents on the National Core Indicators feel lonely some of the time – about the same percentage as other persons served by DD agencies in other parts of the nation.
81

2006/2007 Quality Assurance Report
ACHIEVEMENT OF GOALS OUTCOME: People are supported to develop and achieve goals. Indicators: 1. People develop their personal goals.
2. People have support to accomplish their goals.
RESULTS: Survey and Certification data for FY 2006 and FY 2007 demonstrate little change from prior years with regard to the extent to which people develop their personal goals and the percentage of persons who have access to needed resources to achieve their goals. These trends are illustrated in Figure 48 below.
Figure 48 Summary of Trends for Achievement of Goals Indicators and Measures
FY 2006 – 2007
OUTCOME Indicator Measure Change
FY05-FY06 Change
FY06-FY07 Achievement of Goals - People are
1. Develop Personal Goals Percent Develop Goals
supported to develop and achieve goals. 2. Support to Accomplish Goals
Percent - Access to Resources Direction of Arrow = increase, decrease, stable
Green = positive trend (+)Red = negative trend (-)White = slight change/neutral trend
82

2006/2007 Quality Assurance Report
OUTCOME: People are supported to develop and achieve goals. Indicator 1: People develop their personal goals. Measures: Percentage of individuals who develop their personal goals. Data Source: Survey and Certification (2.3A) FINDINGS: Survey and Certification reviews for both FY 2006 and FY 2007 found that 91% of the individuals reviewed were determined to be developing their personal goals (see Table 57). This level is similar to, but slightly higher than, levels found in previous years.
Table 57 Percentage of Persons Who Develop Goals
FY 2003 - 2007
Develop Goals 2003 2004 2005 2006 2007
Type of Change
2006-2007
No. Applicable 1965 1821 1875 2228 2002
No. Develop Goals 1720 1638 1685 2020 1828
Percent Develop Goals 88% 90% 90% 91% 91%
Indicator 2: People have support to accomplish their goals. Measures: Percentage of individuals who have access to resources to accomplish
their personal goals. Data Source: Survey and Certification (4.1C) FINDINGS: Survey and Certification reviews indicate that 88% of individuals in FY 2006 consistently had access to the resources they need to accomplish their personal goals. In FY 2007 this level fell slightly to 86%. Trends over time remain relatively stable, with a gradual increase noted since FY 2003.
Table 58 Percentage of Persons with Access to Resources to Accomplish Goals
FY 2003 - 2007
Resources to Accomplish Goals 2003 2004 2005 2006 2007
Type of Change
2006-2007
No. Applicable 1970 1824 1880 2234 2001
No with Access to Resources 1617 1534 1627 1963 1726 Percent with Access to Resources 82% 84% 87% 88% 86%
83

2006/2007 Quality Assurance Report
National Core Indicators The NCI also includes survey questions closely related to achievement of personal goals and access to resources and supports needed to reach personal goals. Findings for Massachusetts on the 2005 NCI and the 2006 Phase VIII NCI are presented below in Table 59. As can be seen, there was little change in these measures over the one-year time period between reviews.
Table 59 Comparison of 2005 and 2006 Massachusetts NCI for
Questions Related to Achievement and Access
Achievement & Access: MA DMR NCI
2005 MA NCI Eval
2006 NCI Phase
VIII Difference 2005-2006
Type of Change
Receive Help to Reach Goals/do New Things 77.6% 77.0% -0.6%
Adequate Transportation 84.1% 83.6% -0.5%
Needed Services Available 82.8% 83.2% 0.4%
Table 60 compares Massachusetts with the Phase VIII NCI state average for three survey items related to achievement and access to supports. This comparison, along with information regarding the high and low scores on the national NCI, is also illustrated in Figure 49. As can be seen, Massachusetts fell below the national state average when evaluated on the degree to which individuals receive help to reach their goals and do new things. Massachusetts rated slightly above the average on access to transportation and close to average on access to needed services. As with other NCI measures in 2006, Massachusetts was in the middle range on these measures of achievement and access.
Table 60 Comparison of Massachusetts with the National State Average
Phase VIII NCI Questions re: Achievement and Access 2006
NCI: Achievement and Access
MA DMR NCI
NCI State Avg
Difference MA - State
Ave
Receive Help to Reach Goals/do New Things 77.0% 82.4% -5.4%
Adequate Transportation 83.6% 82.4% 1.2%
Needed Services Available 83.2% 83.8% -0.6%
84

2006/2007 Quality Assurance Report
Figure 49 Comparison of Massachusetts with the National State Average and Range on
Phase VIII NCI Questions re: Achievement and Access 2006
Per
cent
"Yes
"
100%
90%
80%
70%
60%
50%
40%
83.6%
83.2%
77.0%
Help to Do Transportation Needed Things Available Services
Available
MA NCI NCI State Avg NCI High NCI Low
WHAT DOES THIS MEAN? A relatively high percentage of individuals being served in programs that are reviewed by the DMR Survey and Certification process are determined to be developing personal goals. A somewhat lower percentage (86%) has access to the necessary resources to accomplish those goals. When a wider population of people served by DMR was surveyed through the National Core Indicators, about 77% indicated they receive sufficient help to reach their goals and do new things. Almost 84% feel they have access to adequate transportation. On average, responses from Massachusetts are similar to those obtained from other state DD systems.
85

2006/2007 Quality Assurance Report
WORK OUTCOME: People are supported to obtain work. Indicators: 1. Average earnings by type of job support.
3. Average no. hours worked per month by type of job.
RESULTS: Included in this report are major findings from 2006 and 2007 Employment Supports Performance Outcome information for designated four-week time periods during those two years. This employment outcome information is reported for those individuals who receive services through DMR-funded employment supports contracts. The report does not include individuals who receive DMR services and may be working independently in the community, who participate in other day programs such as day habilitation services and those in Community Based Day Supports in which some individuals may receive support to work part-time.
A review of employment support data for FY 2006 and FY 2007 continues to show a substantial difference in the amount of money people make based upon their type of employment and the employment support they receive. Trends indicate that there has been little change over the past few years in the wages for persons in all types of employment settings. Individuals in sheltered facility work settings on average earn much less than their peers in either individual or group supported employment. Information related to employment indicators is illustrated in Figure 50 and explained in greater detail below.
Figure 50 Summary of Trends for Work Indicators and Measures
FY 2006 – 2007
OUTCOME Indicator Measure Change
FY05-FY06 Change
FY06-FY07
Work - People are supported to obtain work.
1. Average Earnings
Individual Job - Average Hourly Wage
Group Job - Average Hourly Wage +
Facility Job - Average Hourly Wage
2. Monthly Hours Worked
Individual Job - Mo. Hrs. Worked
Group Job - Mo. Hrs. Worked
Facility Job - Mo. Hrs. Worked Direction of Arrow = increase, decrease, stable
Green = positive trend (+)Red = negative trend (-)White = slight change/neutral trend
86
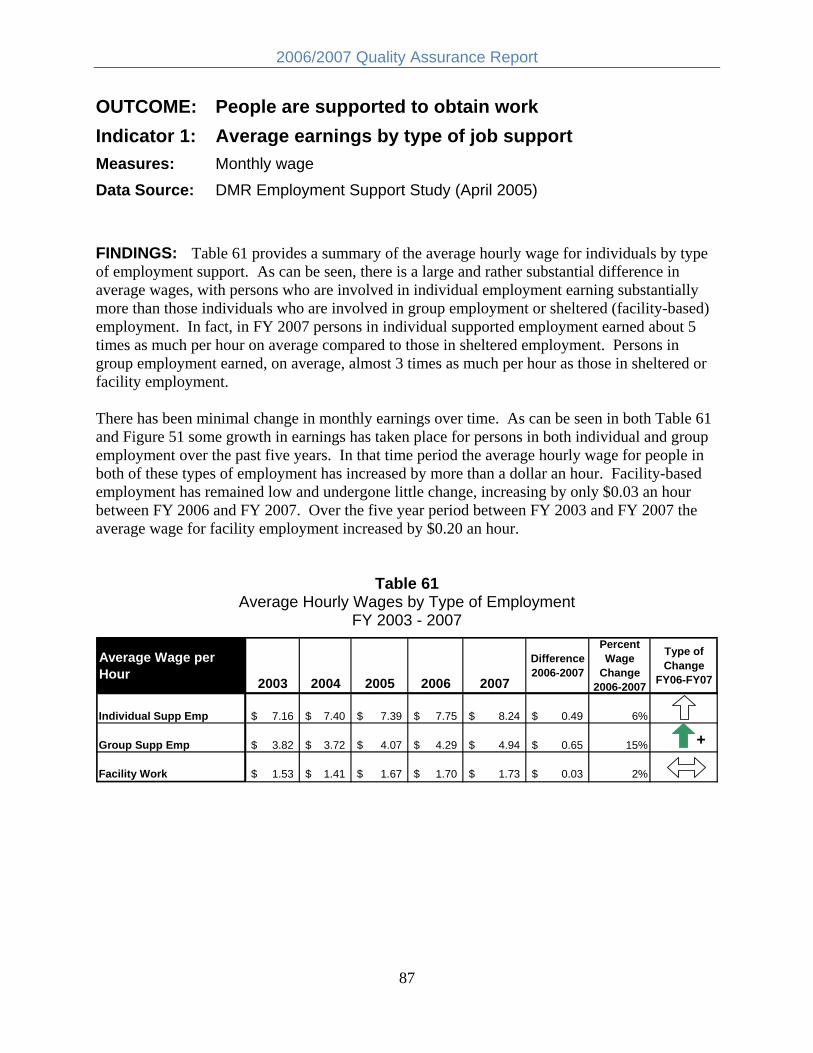
2006/2007 Quality Assurance Report
OUTCOME: People are supported to obtain work Indicator 1: Average earnings by type of job support Measures: Monthly wage Data Source: DMR Employment Support Study (April 2005)
FINDINGS: Table 61 provides a summary of the average hourly wage for individuals by type of employment support. As can be seen, there is a large and rather substantial difference in average wages, with persons who are involved in individual employment earning substantially more than those individuals who are involved in group employment or sheltered (facility-based) employment. In fact, in FY 2007 persons in individual supported employment earned about 5 times as much per hour on average compared to those in sheltered employment. Persons in group employment earned, on average, almost 3 times as much per hour as those in sheltered or facility employment.
There has been minimal change in monthly earnings over time. As can be seen in both Table 61 and Figure 51 some growth in earnings has taken place for persons in both individual and group employment over the past five years. In that time period the average hourly wage for people in both of these types of employment has increased by more than a dollar an hour. Facility-based employment has remained low and undergone little change, increasing by only $0.03 an hour between FY 2006 and FY 2007. Over the five year period between FY 2003 and FY 2007 the average wage for facility employment increased by $0.20 an hour.
Table 61 Average Hourly Wages by Type of Employment
FY 2003 - 2007
Average Wage per Hour
2003 2004 2005 2006 2007
Difference 2006-2007
Percent Wage
Change 2006-2007
Type of Change
FY06-FY07
Individual Supp Emp 7.16$ 7.40 $ 7.39 $ 7.75$ 8.24 $ 0.49$ 6%
Group Supp Emp 3.82$ 3.72 $ 4.07 $ 4.29$ 4.94 $ 0.65$ 15% +
Facility Work 1.53$ 1.41 $ 1.67 $ 1.70$ 1.73 $ 0.03$ 2%
87

2006/2007 Quality Assurance Report
Figure 51 Changes in Average Hourly Wage by Type of Job Support
FY 2003 - 2007
$9 H
ourly
Wag
e (D
olla
rs)
$8
$7
$6
$5
$4
$3
$2
$1
$-
Indiv Supp Emp Group Supp Emp Facility Supp Emp
2003 2004 2005 2006 2007
Indicator 2: Average monthly hours worked by type of job. Measures: Hours worked (per month) Data Source: Employment Support Study FINDINGS: A comparison across job categories for hours worked per month shows that once again persons with individual employment continued to work the greatest number of hours per month during both FY 2006 and FY 2007 while persons in group supported employment worked the least number of hours. Interestingly, since FY 2003 the average hours worked per month has actually decreased by a small amount for both individual and group supported employment categories. In both FY 2006 and FY 2007 persons in individual supported employment worked an average of 53 hours a month (or approximately 14 hours a week) while those in group supported employment worked an average of 41 hours a month (about 10 hours a week) in FY 2006 and 38 hours a month (9.5 hours a week) in FY 2007. On the other hand, individuals in facility-based employment have seen a gradual increase in the number of hours worked per month, rising from 47 hours a month (almost 12 hours per week) in FY 2003 to 50 hours a month (or about 12.5 hours a week) in FY 2007. These trends are illustrated in Table 62 and Figure 52 and are opposite of the strategic objectives established by DMR in 2005
88

2006/2007 Quality Assurance Report
Table 62 Average Hours of Work per Month by Type of Job Support
FY 2003 - 2007
Average Monthly Hours Worked 2003 2004 2005 2006 2007
Difference 2006-2007
Percent Change
2006-2007
Type of Change
2006-2007 Individual Supported Employment 55 53 54 53 53 0 0% Group Supported Employment 41 43 40 41 38 -3 -7%
Facility Work 47 47 50 46 50 4 9%
Hou
rs p
er M
onth
Figure 52 Changes in Monthly Hours Worked by Type of Job Support
FY 2003 - 2007
60
55
50
45
40
35
53
38
50
53 54
53 55
41 40
43
41
46
50
4747
2003 2004 2005 2006 2007
Individual Supported Employment Group Supported Employment Facility Work
Minimum Wage. A review of earnings continues to demonstrate a dramatic difference in the relative percentage of persons who are earning at least minimum wage based upon the type of employment support they receive. As can be seen in Figure 53, over 90% of people involved in individual employment have been consistently earning minimum wage or higher since 2004, although a slight reduction in the percentage is noted for 2007. Approximately 30% of individuals in group supported employment have earned the minimum wage or higher during
89

2006/2007 Quality Assurance Report
that same time period. In 2007 there was a 5% increase for this group. The lowest percentage of persons earning at least the minimum wage has consistently been for sheltered or facility-based work where the percentage has actually fallen since 2004. Table 63 and Figure 53 illustrate these differences and trends.
Table 63 No. and Percentage of People Earning at least the Minimum Wage
By Type of Employment Support FY 2004 - 2007
Minimum Wage No. Earning Minimum Wage or
Above Percent Earning Minimum Wage
or Above 2004 2005 2006 2007 2004 2005 2006 2007
Individual Supported Employment 1,523 1,498 1,450 1,507 93% 94% 95% 92% Group Supported Employment 394 378 473 518 27% 27% 29% 34% Facility-Based Work Programs 341 72 76 92 11% 2% 2% 3%
Figure 53 Percentage of Persons Earning at Least Minimum Wage
By Type of Employment Support FY 2004-2007
93%
27%
2%
95%
2%
92%
34%
3%
0%
i
11%
94%
27% 29%
10%
20%
30%
40%
50%
60%
70%
80%
90%
100%
Per
cent
Min
mum
Wag
e
Indiv Supp Emp Group Supp Emp Facility Work
2004 2005 2006 2007
90

2006/2007 Quality Assurance Report
WHAT DOES THIS MEAN? There is a substantial difference in how much people earn based upon the type of employment support they receive. The highest wages and number of hours worked are associated with individual employment. The lowest wages are present for sheltered employment. Over the past few years there has been very little growth in the average monthly wages earned by people in DMR-funded employment programs. Over 90% of individuals who work in an individual supported employment setting earn at least the minimum wage compared to only about 3% who work in sheltered or facility-based employment settings.
Distribution of Employment Supports Information pertaining to the number of individuals served by DMR in each of the three types of employment supports from FY 2003 to FY 2007 is presented as a basic measure for helping to evaluate progress in meeting the employment-related quality improvement target established by DMR and as recommended by the Statewide Quality Council in 2005. Data related to the distribution of employment supports is illustrated below in Table 64 and Figure 54.
As can be seen in Table 64, there was a 7% increase in the number of people in individual supported employment in FY 2007 compared to FY 2006. At the same time there was a 6% decrease in those served though in group supported employment settings and an increase of about 4% for those engaged in facility-based employment. This growth in facility employment during 2007 served to “offset” the increases in individual employment and resulted in the same general distribution as found in 2005. During both those years a little more than half of all the individuals receiving DMR employment support spent some of their time in facility employment programs.
Table 64 No. People Working by Employment Setting
In Employment Supports Contracts FY 2003-2007
No. People by Employment Setting 2003 2004 2005 2006 2007
Difference 2006-2007
Percent Change
2006-2007
Type of Change
2006-2007
Total No. Individuals* 5,532 5,514 5,442 5,520 5,570 50 1% Individual Supported Employment 1,527 1,654 1,591 1,543 1,644 101 7%
Group Supported Employment 1,484 1,459 1,415 1,615 1,517 -98 -6%
Facility Work Program Only** 2,015 1,971 2,260 2,161 2,247 86 4% Facility Work Program Any Time*** 3,120 3,047 3,252 3,191 3,296 105 3% * This number represents the total number of individuals receiving employment supports for whom complete and accurate data was submitted. ** Facility work program only represents those individuals whose time is spent exclusively in facility based programs. *** Facility Work Prog Any Time includes individuals who spend any amount of time in a facility program and represents a duplicative count since some people may work part time in group or individual supported employment programs.
91

2006/2007 Quality Assurance Report
General trends over time suggest that there has been very little overall change in the number of people served within either individual or group employment supported settings. On the other hand, since 2003 there has been a somewhat consistent and gradual increase in the number of people served within facility-based settings, both for those who participate only in sheltered employment and for those who participate only some of the time. This latter group includes individuals who may be “transitioning” to another type of work or may be spending only a small amount of time in the facility-based setting. Nonetheless, trends appear to indicate change in the overall distribution of employment supports is not taking place in the desired directions.
Figure 54 Four Year Trend in the Number of People Working by
Type of Employment Setting FY 2003-2007
0
le i
500
1,000
1,500
2,000
2,500
3,000
3,500
No.
Peo
p No Real Change
Increase
Incons stent No Real Change
Increase
Indiv Supp Group Supp Facility Work Facility Work Emp Emp Only Any Time
2003 2004 2005 2006 2007
92

2006/2007 Quality Assurance Report
WHAT DOES THIS MEAN? Sixty percent (60%) of the people receiving work/day supports participate in facility-based employment at least some of the time. Over time the number of people served in sheltered employment has gradually increased. Between FY 2003 and FY 2007 the number of individuals involved in both individual and group employment support has shown little change.
93

2006/2007 Quality Assurance Report
QUALIFIED PROVIDERS OUTCOME: People receive services from qualified providers. Indicators: 1. Providers maintain their license/certification to operate.
2. Quality of life citations.
RESULTS: Trends in the certification and licensure status of DMR providers and the number and types of citations resulting from the survey process are summarized below in Figure 55. Some minor changes to the measures related to qualified providers have been introduced to improve accuracy of reporting. These adjustments are explained below in the narrative that accompanies each of the indicators. Changes to the licensing and certification process that took place in 2004 compromise the ability to perform direct comparisons for some of the measures with data after that point in time. Therefore, only findings for FY 2005 through FY 2007 are presented for the first indicator.
Figure 55 Summary of Trends for Qualified Providers Indicators and Measures
FY 2006 - 2007
OUTCOME Indicator Measure Change
FY05-FY06 Change
FY06-FY07
Qualified Providers - People receive services from qualified providers. 1. Maintain licensure/certification
Percent - 2 yr license
Percent - conditional license
Percent - certification with distinction
Percent - certification with 6/6 QoL
2. Quality of life citations
Percent Providers with No Citations
Total No. Citations
Average No. Citations per Provider - all surveyed
-
Average No. Citations per Provider - only -those with citations
Percent Citations by Type Direction of Arrow = increase, decrease, stable
Green = positive trend (+)Red = negative trend (-)White = slight change/neutral trend
94

2006/2007 Quality Assurance Report
OUTCOME: People receive services from qualified providers. Indicator 1: Providers maintain their certification/licensure to
operate Measures: Percent of Providers by Level of Certification Data Source: Survey and Certification database FINDINGS: As noted the DMR licensure and certification system was revised in April of 2004. The “new” process separated licensure from certification, with licensure based upon the provider's ability to assure essential safeguards in the areas of health, safety, and rights. These licensing standards are considered essential and “non-negotiable.” The certification level obtained by a provider is focused on a determination of how outcomes in people's lives, in additional to health and safety, are achieved. These outcomes include relationships, community connections, individual control, and growth and accomplishments. Therefore, the current DMR review of provider agencies results in both a level of licensure and a certification status as illustrated below in Table 65.
Table 65 Structure of DMR Licensure and Certification Process
Beginning in April 2004
New System for DMR Licensure and Certification Effective April 2004
LICENSURE Assurance of Safeguards in the areas of: • Health • Safety • Rights • Organizational Safeguards
CERTIFICATION Achievement of Outcomes in the areas of: • Relationships • Community Connections • Individual Control • Growth and Accomplishments • Organizational outcomes relating to
staff development and strategic planning
To avoid confusion, this report will focus on licensing and certification findings from FY 2005 forward (i.e., those based on the new system). Information regarding qualified providers prior to the start of FY 2005 can be found in the DMR Annual Report for 2005.
Licensure. As noted above, licensure is based on the ability of a provider to meet requirements associated with basic safeguards in health, safety and rights. As can be seen in Table 66 and Figure 56 below, almost all providers (96% to 98%) achieved a full 2-year license between FY
95

2006/2007 Quality Assurance Report
2005 and FY 2007. During this time period there were no providers who were not able to achieve licensure. A relatively small number were given a conditional 1-year license in all three fiscal years; although that number did increase somewhat in 2007.
Table 66 No. and Percentage of Providers by Level of Licensure
FY 2005 - 2007
Level of 2005 2006 2007 Licensure No. Percent No. Percent No. Percent
2-Yr License 96 96% 181 98% 176 96% 1-Yr Conditional License 4 4% 4 2% 7 4%
Non-Licensure 0 0% 0 0% 0 0%
Total 100 1 185 100% 183 100%
Figure 56 Percentage of Providers by Level of Licensure
FY 2007
96%
4% 2 Year
License
1-Yr Conditional
Licensure level for 183 providers during FY 2007 based on the "New" system (effective April 2004.)
Certification. In addition to a level of licensure, providers are now also assigned a level of certification that is based on the extent to which they are able to meet both the licensure quality of life areas as well as quality of life areas related to individual choice/control, relationships and community connections, and growth and accomplishments. A total of six quality of life areas are evaluated. Table 67 presents the results of certification for FY 2005 through FY 2007.
96

2006/2007 Quality Assurance Report
Approximately75% of all providers that were reviewed between 2005 and 2007 received an “achieved” status in all six quality of life areas, including over 35% that were assigned a certification with distinction status. In 2007 a slightly lower percentage achieved certification for 6 out of 6 areas compared to prior years. Only one of the providers met fewer than 3 out of 6 areas across all three years.
Table 67 Percentage of Providers by Level of Certification
FY 2005 - 2007 Certification Status 2005 2006 2007 Certification with Distinction 35% 36% 38% Certification: 6/6 Quality of Life 40% 40% 35% Certification: 5/6 Quality of Life 13% 13% 16% Certification: 4/6 Quality of Life 3% 2% 4% Certification: 3/6 Quality of Life 1% 2% 1% Certification: 2/6 Quality of Life 0% 0% 0% Certification: 1/6 Quality of Life 0% 0% 0%
Certification: 0/6 0% 0% 1%
3 yr CARF 8% 7% 6%
Total 100% 100% 100%
WHAT DOES THIS MEAN? A very large percentage of the community services system is achieving high levels of licensure. In FY07, 96% of providers attained a full 2-year license and only 4% were assigned a 1-year license with conditions. About 75% of those providers reviewed each year between 2005 and 2007 achieved all six quality of life areas for certification. This suggests that with very few exceptions the provider system is meeting basic standards of health, safety and rights.
97

2006/2007 Quality Assurance Report
Indicator 2: Quality of Life citations Measures: Percent of Providers with citations
Average No. of citations per Provider Type of citations
Data Source: Survey and Certification database
FINDINGS: Table 68 and Figures 57 and 58 below illustrate findings regarding the number of citations and the percentage of providers with citations for the five year time period between FY 2003 and FY 2007. In this report the percentage of providers with and without citations - and the average number of citations per provider - have been adjusted to establish a base that includes only those providers surveyed during the fiscal year under consideration.18
As can be seen, slightly fewer providers were surveyed in FY 2007 compared to FY 2006 while the number of citations increased. The percentage of surveyed providers that had no citations has steadily decreased from a high of 73% in FY 2003 to a low of 40% in FY 2007. This trend is illustrated in Figure 57.
Table 68 Summary of Citations
FY 2003-2007
Citations 2003 2004 2005 2006 2007 Type of Change
2006-2007
No. Providers Surveyed 93 68 98 93 78 No. Providers with Citations 25 27 49 50 47 No. Providers with No Citations 68 41 49 43 31 Percent Providers with No Citations 73% 60% 50% 46% 40%
Total No. Citations 83 63 89 88 106 Avg No. Citations per Provider (all Surveyed Providers) 0.89 0.93 0.91 0.95 1.36
-
Avg No. Citations per Provider (only those with citations) 3.32 2.33 1.82 1.76 2.26
-
18 Past reports used the entire population of providers to calculate percentages and average no. of citations. The current measures – which compute percentages and averages based on only those providers surveyed during a given fiscal year – are considered a more accurate reflection of survey results.
98

2006/2007 Quality Assurance Report
Figure 57 Percentage of Providers with No Citations
FY 2003 –2007 P
erce
nt w
ithou
t C
itatio
ns
80%
73%
70%
60%
50%
40% 40%
30%
20%
10%
0%
60%
50% 46%
i iwi itati i i iCon s stent d ownward trend in the percentage o f Prov ders
thout any c ons dur ng the fiscal year n wh ch they were surveyed by DMR.
2003 2004 2005 2006 2007
The average number of citations per provider increased in FY 2007, both when calculated against all of the provider agencies surveyed and just those that received citations. Figure 58 illustrates the average number of citations per provider for those providers surveyed in a given fiscal year that were issued citations. As can be seen, prior to FY 2007 there had been a relatively steady decrease in the average number of citations per provider. That trend was reversed in FY 2007.
Figure 59 presents the five year trend for the average number of citations per provider for all providers surveyed each year (i.e., providers with and without citations). As can be seen, the trend had been relatively stable prior to FY 2007 with approximately 0.9 citations per provider. In FY 2007 it increased to an average of 1.36 citations.
99

2006/2007 Quality Assurance Report
Figure 58 Average No. Citations per Provider
Providers with Citations 2003- 2007
3.50 N
o. C
itatio
ns p
er P
rovi
der
No.
Cita
tions
per
Pro
vide
r 3.32
3.00
2.50 2.33 2.26
2.00 1.82 1.76
1.50
1.00
0.50
0.00
2003 2004 2005 2006 2007
Figure 59 Average No. Citations per Provider
All Providers Surveyed 2003 - 2007
1.50 1.36
1.25
1.00 0.93 0.91 0.95
0.89
0.75
0.50
0.25
0.00
2003 2004 2005 2006 2007
100

2006/2007 Quality Assurance Report
Table 69 provides an overview of the percentage of citations by type. Changes to the review process may have contributed to some “shifts” between citation categories during FY 2005, resulting in the increase in citations associated with organizational outcomes and personal wellbeing. Such changes may also be partially responsible for the noted decrease in citations in the areas of rights and dignity and community/social connections. Therefore, caution should be exercised in reviewing the information contained in Table 69, as it may be more reflective of process changes rather than actual or real changes to outcomes. Nonetheless, data do suggest a reduction in the relative percentage of citations in FY 2007 that were associated with organizational outcomes. No real changes are noted between FY 2006 and FY 2007 for all the other categories.
Table 69 Percentage of Citations by Type
2003 - 2007
Citations by Type 2003 2004 2005 2006 2007 Type of Change
2006-2007
Rights/Dignity 29% 30% 25% 16% 20%
Comm/Soc Conn 20% 22% 9% 3% 3%
Pers Wellbeing 19% 20% 31% 26% 32%
Organiz Outcomes 20% 18% 33% 52% 42% +
Indiv Control 7% 6% 1% 1% 1%
Growth & Accomp 4% 4% 1% 1% 2% Percentages are rounded and may not equal 100
WHAT DOES THIS MEAN? A higher percentage of providers received citations during FY06 and FY07 compared to prior years. In fact, since 2003 there has been a steady decrease in the percentage of providers who do not receive survey citations. The average number of citations per provider (for those cited) increased in FY07, reversing the positive trend present since 2003. Data suggest a possible decrease in the percentage of citations associated with organizational outcomes in FY07 compared to FY06, although the percentage is still higher than it was before FY06.
101

2006/2007 Quality Assurance Report
APPENDIX A
SUMMARY OF OUTCOMES AND INDICATORS
The chart that follows summarizes the key outcomes and indicators that appear in this report. The data for this report draws its information from a variety of quality assurance processes in which the Department is routinely engaged. While the quality assurance processes allow for continuous review, intervention and follow-up on issues of concern, aggregation of data in this report allows for the analysis of patterns and trends in overall performance.
OUTCOME INDICATOR DATA SOURCE People are supported to have the best possible health
1. Individuals are supported to have a healthy lifestyle
2. Individuals get annual physicals
3. Individuals get dental exams
4. Individual’s medications are safely administered
5. Serious health and medication issues are identified and
addressed
1. Survey & Certification Outcome 5.3A
2. Survey & Certification Outcome 5.3C
- National Core Indicators Project
3. Survey & Certification Outcome 5.3C
- National Core Indicators Project
4. Survey & Certification Outcome 5.3E
- Medication Occurrence database
5. Survey & Certification/Action Required
- Investigations data - Risk Management data
People are protected from harm
1. Individuals are protected when there are allegations of abuse, neglect or mistreatment
1. Survey & Certification Outcome 5.2C,D
- Investigations database
2. CORI checks are 2. CORI audit database completed for staff and volunteers working directly with individuals
3. Safeguards are in place for individuals who are at
3. Survey & Certification Outcome 5.2A
risk - Critical Incident data - Risk Management data
102

2006/2007 Quality Assurance Report
OUTCOME INDICATOR DATA SOURCE People live and work in safe environments
1. Homes and work places are safe, secure and in good repair
1. Survey & Certification/Action Required Outcome 5.1A
2. People can safely evacuate in an emergency
2. Survey & Certification/Action Required Outcome 5.1C
3. People and supporters know what to do in an
3. Survey & Certification Outcome 5.1B
emergency People understand and practice their human and civil rights
1. People exercise their rights in their everyday lives
2. People receive the same treatment as other employees
3. People experience respectful interactions
1. Survey & Certification Outcome 1.2B
- National Core Indicators Project 2. Survey & Certification Outcome
1.2C
3. Survey & Certification Outcome 1.1A
People’s rights are protected
1. % of instances where less intrusive interventions are used
1. Survey & Certification Outcome 1.3A
before implementing a restrictive intervention
2. People or guardians give consent to restrictive interventions
2. Survey & Certification Outcome 1.3C
3. People and supporters know how and where to
3. Survey & Certification Outcome 5.2E
file a complaint
4. % of restraints and type of restraint
4. Restraint database
People are supported to make their own
1. People make choices about their everyday routine and schedules
1. Survey & Certification Outcome 2.2A
- National Core Indicators Project decisions
2. People control important decisions about their
2. Survey & Certification Outcome 2.3C
home and home life - National Core Indicators Project
3. People choose where they work
3. Survey & Certification Outcome 2.3D
- National Core Indicators Project
4. People influence who provides their supports
4. Survey & Certification Outcome 3.1B
103

2006/2007 Quality Assurance Report
OUTCOME INDICATOR DATA SOURCE - National Core Indicators
Project
People use integrated community resources and
1. People use the same community resources as others on a frequent and on-going basis
1. Survey & Certification Outcome 3.1B
- National Core Indicators Project
participate in everyday community activities People are connected to
1. People are involved in activities that connect
1. Survey & Certification Outcome 3.2B
and valued them to other people in - National Core Indicators members of the community Project their community People gain/maintain friendships and relationships
1. People are supported to maintain relationships
2. People are supported to develop new friendships
1. Survey & Certification Outcome 3.3A National Core Indicators
2. Survey & Certification Outcome 3.3B
3. Individuals have education and support to understand and safely express their sexuality
3. Survey & Certification Outcome 3.3C
People are supported to develop and achieve goals
1. People are supported to develop an individualized plan that identifies needs and desires
1. Survey & Certification Outcome 2.3A
2. People have support to accomplish goals
2. Survey & Certification Outcome 4.1C
Individuals are supported to obtain work
1. Average hourly wage of people who receive work supports
1. Employment supports performance outcome data
2. Average number of hours worked per/month
2. Employment supports performance outcome data
People receive services from
1. Providers maintain their license/certification to
1. Survey & Certification database
qualified operate providers
2. Quality of Life citations 2. Survey & Certification database
104

2006/2007 Quality Assurance Report
Appendix B
SUMMARY OF DATA SOURCES
The Quality Assurance Annual Report derives its information from a variety of different data sources. One of the strengths of the quality assurance system lies in the fact that no one process or data set is used to arrive at conclusions. Rather, most outcomes reported draw from a diverse array of departmental information systems and evaluation processes. Following is a brief description of the databases and the parameters of the information collected.
Survey and Certification
The Survey and Certification system is the process by which DMR licenses and certifies all public and private providers of community residential, work/day, placement and site based respite services. The tool used to license/certify providers, known as the Quality Enhancement Survey Tool (QUEST) evaluates the impact of a provider’s services on the quality of life of individuals in five key domains and one organizational domain. A random sample of individuals is selected in proportion to the number of individuals served by the provider in discrete service models.
The data presented in this report reflects the number of individual surveys conducted during each of the fiscal years noted. It includes individuals over the age of 18 served in the above-mentioned models. It does not include individuals living in State Developmental Centers or those getting family and individual support services.
National Core Indicators
The National Core Indicators project is a joint project of the National Association of State Directors of Developmental Disabilities Services (NASDDDS) and the Human Services Research Institute (HSRI). States participate in collecting data on performance/outcome indicators that provide national benchmarks for quality. Massachusetts is a participating state. NCI data referenced throughout the Quality Assurance Report includes information from both the national (Phase VIII) report issued by HSRI and the National Association of State Directors of Developmental Disabilities Services (NASDDDS) in March of 2007.
Medication Occurrence Reporting System
Providers are subject to the requirements of the Medication Administration Program (MAP) when non-licensed (non-RN) staff are trained and certified to administer medications in community residential and day programs. The Medication Occurrence Reporting (MOR) system is the process whereby all public and private providers that come under the requirements of the MAP program report medication occurrences. A medication occurrence is defined as any time a medication is given at the wrong time,
105

2006/2007 Quality Assurance Report
the wrong dose, the wrong route, or to the wrong person. A medication occurrence is defined as a “hotline” any time it results in a medical intervention of any kind.
The data presented in this report reflects the number of medication occurrence reports filed by providers in each of the fiscal years 2003 – 2007. This reflects information reported on 173 providers and 2,447 registered sites (as of FY 2007).
Investigations
Mandated reporters are required to notify the Disabled Persons Protection Commission (DPPC) whenever an individual with mental retardation is alleged to be the victim of abuse, neglect, mistreatment or omission. Complaints may be dismissed, resolved without investigation, referred for resolution or investigated.
The data presented in this report reflects the number of complaints filed and substantiated in each of fiscal years 2003 - 2007, for all individuals over the age of 18 regardless of where they reside.
Critical Incident Reporting System
The Incident Reporting system, known as the Home and Community Services Information System (HCSIS), is a web-based system for reporting incidents which rise to a certain threshold. It is used to report on and manage incidents involving individuals at serious risk and to bring prompt support to staff in responding to these incidents. The types of incidents reported include accidents, assaults, physical altercations, fires, unplanned hospital visits and serious injuries.
The data presented in this report reflects the number of critical incident reports filed in each of the fiscal years 2003 - 2007.
Restraint Reporting System
Providers and facilities are required to report any time an emergency restraint is utilized to prevent and individual from harming themselves or others. Data is reported on the number of individuals restrained, the number of restraints utilized, the number of times individuals are restrained, and the duration of the restraint.
Employment Supports Performance Outcome Information
Providers submit information for a designated four-week time period in April of each year. Information is collected on individual, group and facility employment for both hours worked and wages earned.
106

2006/2007 Quality Assurance Report
Appendix C
SUMMARY OF FINDINGS FOR FY 2006 – FY 2007: STATEWIDE QUALITY OUTCOMES
The two-page chart that follows represents a visual representation of major findings for Fiscal Years 2006 and 2007. As in the body of the report, arrows, colors and numerical signs are used to depict change.
The Matrix Includes:
11 - Outcomes 31 - Indicators 64 - Measures
107

2006/2007 Quality Assurance Report
OUTCOME Indicator Measure Change FY05-FY06
Change FY06-FY07
Health - people are supported to have the best possible health.
1. Healthy Lifestyle Perecent Receive Support
2. Physical Exams Percent Receive Annual Exams
3. Dental Exams Percent Receive Annual Exams
MOR No. and Rate 4. Safe Medication
Percent/No. Hotlines - -No. Health/Med Action Required Reports
- + 5. Issues Identified and Addressed
No. Substantiated Medication Investigations
+ Incomplete Data
No. Substantiated Denial of Treatment Investigations
+ Incomplete Data
Protection - people are protected from harm. 1. Investigations
No. Substantiated Incomplete Data
Trends: Most Common Types NA NA
Percent Without Violations
2. CORI checks Violations per Provider -Percent Lack of Records + -Corrective Action
3. Safeguards for Persons Preventive Action
at Risk CIR Rates - NA
CIR by Type NA NA
Safe Environments -People live and work in safe environments.
1. Safe homes and work places
Percent Safe Environment
Action Required Reports: Environmental Issues + -
Percent - Safely Evacuate 2. Evacuate Safely
Action Required Reports: Evacuation
3. Know what to do in Emergency Percent - Know what to do
Practice Rights - Percent Exercise Rights People understand and practice their human and civil rights. 1. People exercise their
rights Percent Treated Same
Percent Treated with Respect
Rights Protected -People's rights are protected
1. Less Intrusive Interventions Percent - Less Intrusive Used
2. Consent - Restrictive Interventions Percent - with Consent
3. File Complaints Percent - Able to File Complaint
4. Restraint Utilization
Facility: Percent Restrained ++ -Community: Percent Restrained
Facility: Ave No. Restraints - -Community: Ave No. Restraints + +
108

2006/2007 Quality Assurance Report
OUTCOME Indicator Measure Change FY05-FY06
Change FY06-FY07
Choice & Decision making - People are supported to make their own decisions.
1. Choices re: everyday routines
Percent - Choose schedule
Comparison with NCI
2. Decisions re: home and Percent - Control decisions
home life Comparison with NCI
Percent - Choose where work 3. Choose where work
Comparison with NCI
4. Influence who provides Percent - Influence who supports
support Comparison with NCI
Community Percent Use Community Resources
Integration - People use integrated community resources and participate in everyday community activities.
1. Use the same community resources as others
Comparison to NCI
People are connected to and valued 2. Involved in acitivities that Percent Involved in Community Activitie + -
members of their community. connect to other people Comparison to NCI
Relationships & Family Connections -People maintain and gain relationships with family and friends.
1. Support to maintain relationships
Percent Maintain Relationships
2. Support to gain new relationships
Percent - New Relationships
3. Receive education about intimacy
Percent - Educated re: Intimacy
Achievement of Goals - People are supported to develop and achieve goals.
1. Develop Personal Goals Percent Develop Goals
2. Support to Accomplish Goals
Percent - Access to Resources
Work - People are supported to obtain work.
1. Average Earnings
Individual Job - Average Hourly Wage
Group Job - Average Hourly Wage +
Facility Job - Average Hourly Wage
Individual Job - Mo. Hrs. Worked
2. Monlthy Hours Worked Group Job - Mo. Hrs. Worked
Facility Job - Mo. Hrs. Worked
Qualified Providers -People receive services from qualified providers.
1. Maintain licensure/certification
Percent - 2 yr license
Percent - conditional license
Percent - certification with distinction
Percent - certification with 6/6 QoL
2. Quality of life citations
Percent Providers with No Citations
Total No. Citations
Average No. Citations per Provider all surveyed -Average No. Citations per Provider -only those with citations
Percent Citations by Type
109