Quality Assurance Project Plan Long-Term Monitoring of ... · Long-Term Monitoring of Persistent,...
44
Quality Assurance Project Plan Long-Term Monitoring of Persistent, Bioaccumulative, and Toxic Chemicals using Age-Dated Lake Sediment Cores September 2016 Publication No. 16-03-118
Transcript of Quality Assurance Project Plan Long-Term Monitoring of ... · Long-Term Monitoring of Persistent,...
Quality Assurance Project Plan
Long-Term Monitoring of Persistent, Bioaccumulative, and Toxic Chemicals using Age-Dated Lake Sediment Cores
September 2016 Publication No. 16-03-118

Publication Information Each study conducted by the Washington State Department of Ecology (Ecology) must have an approved Quality Assurance Project Plan. The plan describes the objectives of the study and the procedures to be followed to achieve those objectives. After completing the study, Ecology will post the final report of the study to the Internet. This Quality Assurance Project Plan is available on Ecology’s website at https://fortress.wa.gov/ecy/publications/SummaryPages/1603118.html Data for this project will be available on Ecology’s Environmental Information Management (EIM) website at www.ecy.wa.gov/eim/index.htm. Search Study ID SEDCORE16. Ecology’s Activity Tracker Code for this study is 06-513. Author and Contact Information Callie Mathieu P.O. Box 47600 Environmental Assessment Program Washington State Department of Ecology Olympia, WA 98504-7710 Communications Consultant: phone 360-407-6834.
Washington State Department of Ecology – www.ecy.wa.gov o Headquarters, Lacey 360-407-6000 o Northwest Regional Office, Bellevue 425-649-7000 o Southwest Regional Office, Lacey 360-407-6300 o Central Regional Office, Union Gap 509-575-2490 o Eastern Regional Office, Spokane 509-329-3400
Any use of product or firm names in this publication is for descriptive purposes only
and does not imply endorsement by the author or the Department of Ecology.
Accommodation Requests: To request ADA accommodation including materials in a format for the visually impaired, call Ecology at 360-407-6834. Persons with impaired hearing may call Washington Relay Service at 711. Persons with speech disability may call TTY at 877-833-6341.
QAPP: PBT Monitoring in Lake Sediment Cores Page 1 – September 2016
Quality Assurance Project Plan
Long-Term Monitoring of Persistent, Bioaccumulative, and Toxic Chemicals using Age-Dated Lake Sediment Cores
September 2016
Approved by: Signature: Date: September 2016 Debby Sargeant, Client, EAP Signature: Date: August 2016 Jessica Archer, Client, EAP Signature: Date: August 2016 Callie Mathieu, Author / Project Manager and Principal Investigator, EAP Signature: Date: August 2016 Christopher Clinton, Field Lead, EAP Signature: Date: August 2016 Joel Bird, Director, Manchester Environmental Laboratory Signature: Date: September 2016 Bill Kammin, Ecology Quality Assurance Officer
Signatures are not available on the Internet version. EAP: Environmental Assessment Program
QAPP: PBT Monitoring in Lake Sediment Cores Page 2 – September 2016
1.0 Table of Contents
Page
1.0 Table of Contents .....................................................................................................2
2.0 Abstract ....................................................................................................................6
3.0 Background ..............................................................................................................7 3.1 Study area and surroundings ........................................................................8
3.1.1 Logistical problems .........................................................................9 3.1.2 History of study area .......................................................................9 3.1.3 Parameters of interest ....................................................................10 3.1.4 Results of previous studies ............................................................10 3.1.5 Regulatory criteria or standards ....................................................12
4.0 Project Description.................................................................................................12 4.1 Project goals ...............................................................................................12 4.2 Project objectives .......................................................................................12 4.3 Information needed and sources ................................................................12 4.4 Target population .......................................................................................12 4.5 Study boundaries ........................................................................................13 4.6 Tasks required ............................................................................................14 4.7 Practical constraints ...................................................................................14 4.8 Systematic planning process ......................................................................14
5.0 Organization and Schedule ....................................................................................15 5.1 Key individuals and their responsibilities ..................................................15 5.2 Special training and certifications ..............................................................15 5.3 Organization chart ......................................................................................15 5.4 Project schedule .........................................................................................16 5.5 Limitations on schedule .............................................................................16 5.6 Budget and funding ....................................................................................17
6.0 Quality Objectives .................................................................................................18 6.1 Decision Quality Objectives (DQOs) ........................................................18 6.2 Measurement Quality Objectives ...............................................................18
6.2.1 Targets for Precision, Bias, and Sensitivity ..................................18 6.2.2 Targets for Comparability, Representativeness, and Completeness .............................................................................................19
7.0 Sampling Process Design (Experimental Design) .................................................20 7.1 Study Design ..............................................................................................20
7.1.1 Field measurements ........................................................................21 7.1.2 Sampling location and frequency ...................................................21 7.1.3 Parameters to be determined ..........................................................21
7.2 Maps or diagram ........................................................................................21 7.3 Assumptions underlying design .................................................................21 7.4 Relation to objectives and site characteristics ...........................................21 7.5 Characteristics of existing data ..................................................................21

QAPP: PBT Monitoring in Lake Sediment Cores Page 3 – September 2016
8.0 Sampling Procedures .............................................................................................22 8.1 Field measurement and field sampling SOPs ............................................22 8.2 Containers, preservation methods, holding times ......................................22 8.3 Invasive species evaluation ........................................................................22 8.4 Equipment decontamination ......................................................................22 8.5 Sample ID ..................................................................................................23 8.6 Chain-of-custody, if required .....................................................................23 8.7 Field log requirements ...............................................................................23 8.8 Other activities ...........................................................................................23
9.0 Measurement Methods ...........................................................................................24 9.1 Field procedures table/field analysis table .................................................24 9.2 Lab procedures table ..................................................................................24 9.3 Sample preparation method(s) ...................................................................24 9.4 Special method requirements .....................................................................25 9.5 Lab(s) accredited for method(s) .................................................................25
10.0 Quality Control (QC) Procedures ..........................................................................25 10.1 Table of field and lab QC required ............................................................25 10.2 Corrective action processes ........................................................................25
11.0 Data Management Procedures ...............................................................................26 11.1 Data recording/reporting requirements ......................................................26 11.2 Laboratory data package requirements ......................................................26 11.3 Electronic transfer requirements ................................................................26 11.4 Acceptance criteria for existing data ..........................................................26 11.5 EIM/STORET data upload procedures ......................................................26
12.0 Audits and Reports .................................................................................................27 12.1 Number, frequency, type, and schedule of audits ......................................27 12.2 Responsible personnel ...............................................................................27 12.3 Frequency and distribution of report..........................................................27 12.4 Responsibility for reports ...........................................................................27
13.0 Data Verification ....................................................................................................28 13.1 Field data verification, requirements, and responsibilities ........................28 13.2 Lab data verification ..................................................................................28 13.3 Validation requirements, if necessary ........................................................28
14.0 Data Quality (Usability) Assessment .....................................................................29 14.1 Process for determining whether project objectives have been met ..........29 14.2 Data analysis and presentation methods ....................................................29 14.3 Treatment of non-detects ...........................................................................29 14.4 Sampling design evaluation .......................................................................30 14.5 Documentation of assessment ....................................................................30
15.0 References ..............................................................................................................30
16.0 Figures....................................................................................................................33
17.0 Tables .....................................................................................................................34
18.0 Appendices .............................................................................................................35

QAPP: PBT Monitoring in Lake Sediment Cores Page 4 – September 2016
Appendix A. Glossaries, Acronyms, and Abbreviations ......................................36
QAPP: PBT Monitoring in Lake Sediment Cores Page 5 – September 2016
List of Figures and Tables
Page
Figures
Figure 1. Target Analytes in Sediment Cores from 2006 to 2015. .....................................7
Figure 2. Sediment Core Collection Locations from 2006 to 2015 (gray circles) and 2016 Sampling Locations (red circles). ................................................................8
Figure 3. Target Sampling Locations for 2016 Sediment Core Collection (orange circles). ...............................................................................................................13
Tables
Table 1. 2016 Sediment Core Study Lakes. ........................................................................9
Table 2. PCB Results Reported in Previous Sediment Core Studies in Washington State. ...................................................................................................................11
Table 3. Organization of project staff and responsibilities. ..............................................15
Table 4. Proposed Schedule for Completing Field and Laboratory Work, Data Entry into EIM, and Reports. ......................................................................................16
Table 5. Project Budget and Funding. ..............................................................................17
Table 6. Measurement Quality Objectives. .......................................................................18
Table 7. Containers, Sample Size, Preservation Methods, and Holding Times. ..............22
Table 8. Lab Procedures. ..................................................................................................24
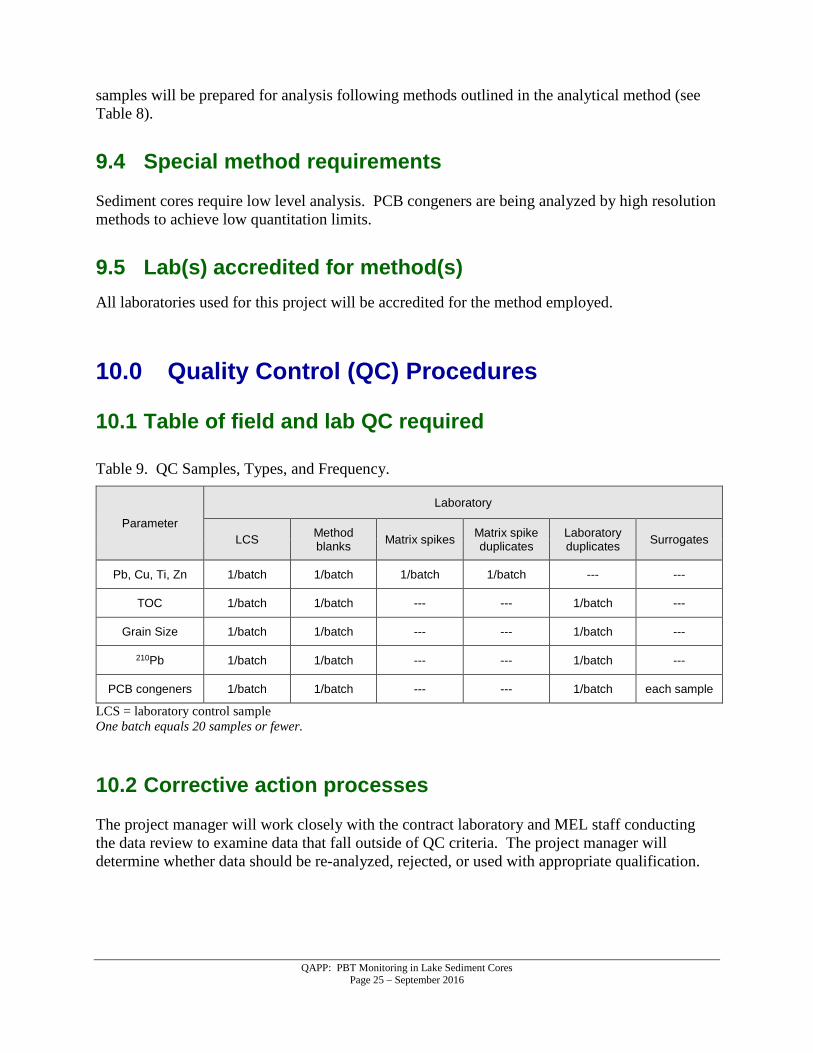
Table 9. QC Samples, Types, and Frequency. ..................................................................25

QAPP: PBT Monitoring in Lake Sediment Cores Page 6 – September 2016
2.0 Abstract
In 2000, the Washington State Department of Ecology (Ecology) developed a strategy to reduce persistent, bioaccumulative, and toxic substances (PBTs) in Washington State. The PBT Reduction Strategy recommended development of a long-term monitoring program for PBTs in Washington’s freshwater systems. In 2006, Ecology began long-term monitoring of sediment cores throughout the state for analysis of mercury. Other PBTs were added to the monitoring program in 2008. Between 2008 and 2015, sediment cores were analyzed for mercury as well as polycyclic aromatic hydrocarbons, perfluoroalkyl substances, hexabromocyclododecane, chlorinated paraffins, and brominated flame retardants on a rotating schedule. Ecology’s PBT Monitoring Program will continue to collect one sediment core from three lakes per year to characterize the occurrence and temporal trends of PBTs in Washington State. Sediment core samples will be analyzed for a rotating PBT contaminant to reconstruct historical deposition profiles. The rotating PBT analyte will be selected annually to fill data gaps in Washington State. Sediment cores will be age-dated using 210Pb techniques. Total lead, TOC, and grain size will also be analyzed to support interpretation of results. Sediment core samples will be analyzed for PCB congeners in 2016. Ecology will collect cores from Deep Lake, Spanaway Lake, and lower Lake Spokane. The sampling locations were selected to evaluate sediment PCB deposition at an urban waterbody (Spanaway Lake), a primarily undeveloped, forested waterbody (Deep Lake), and a waterbody with known PCB contamination issues (Lake Spokane). No PCB data is available for Spanaway or Deep Lakes, while PCB contamination of Lake Spokane and the upstream Spokane River has been well-characterized. Additional metals (copper, titanium, and zinc) will be analyzed in the Deep Lake core at the request of Ecology’s Eastern Regional Office.
QAPP: PBT Monitoring in Lake Sediment Cores Page 7 – September 2016
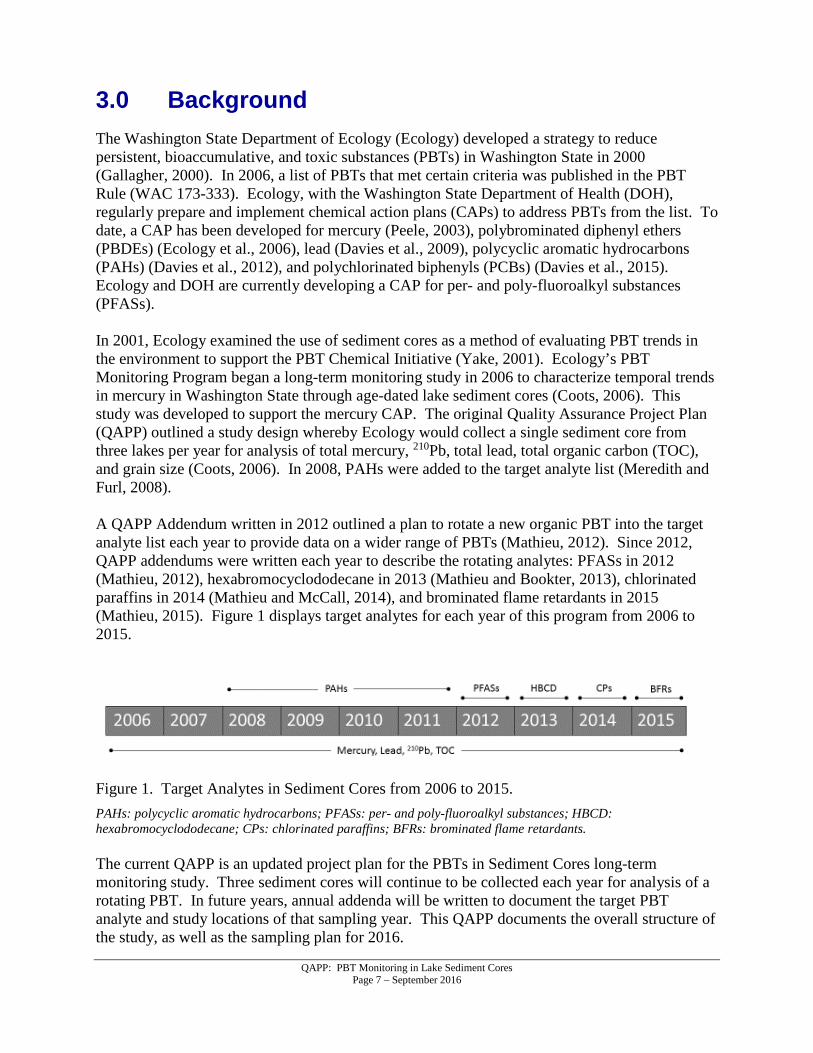
3.0 Background The Washington State Department of Ecology (Ecology) developed a strategy to reduce persistent, bioaccumulative, and toxic substances (PBTs) in Washington State in 2000 (Gallagher, 2000). In 2006, a list of PBTs that met certain criteria was published in the PBT Rule (WAC 173-333). Ecology, with the Washington State Department of Health (DOH), regularly prepare and implement chemical action plans (CAPs) to address PBTs from the list. To date, a CAP has been developed for mercury (Peele, 2003), polybrominated diphenyl ethers (PBDEs) (Ecology et al., 2006), lead (Davies et al., 2009), polycyclic aromatic hydrocarbons (PAHs) (Davies et al., 2012), and polychlorinated biphenyls (PCBs) (Davies et al., 2015). Ecology and DOH are currently developing a CAP for per- and poly-fluoroalkyl substances (PFASs). In 2001, Ecology examined the use of sediment cores as a method of evaluating PBT trends in the environment to support the PBT Chemical Initiative (Yake, 2001). Ecology’s PBT Monitoring Program began a long-term monitoring study in 2006 to characterize temporal trends in mercury in Washington State through age-dated lake sediment cores (Coots, 2006). This study was developed to support the mercury CAP. The original Quality Assurance Project Plan (QAPP) outlined a study design whereby Ecology would collect a single sediment core from three lakes per year for analysis of total mercury, 210Pb, total lead, total organic carbon (TOC), and grain size (Coots, 2006). In 2008, PAHs were added to the target analyte list (Meredith and Furl, 2008). A QAPP Addendum written in 2012 outlined a plan to rotate a new organic PBT into the target analyte list each year to provide data on a wider range of PBTs (Mathieu, 2012). Since 2012, QAPP addendums were written each year to describe the rotating analytes: PFASs in 2012 (Mathieu, 2012), hexabromocyclododecane in 2013 (Mathieu and Bookter, 2013), chlorinated paraffins in 2014 (Mathieu and McCall, 2014), and brominated flame retardants in 2015 (Mathieu, 2015). Figure 1 displays target analytes for each year of this program from 2006 to 2015.
Figure 1. Target Analytes in Sediment Cores from 2006 to 2015. PAHs: polycyclic aromatic hydrocarbons; PFASs: per- and poly-fluoroalkyl substances; HBCD: hexabromocyclododecane; CPs: chlorinated paraffins; BFRs: brominated flame retardants. The current QAPP is an updated project plan for the PBTs in Sediment Cores long-term monitoring study. Three sediment cores will continue to be collected each year for analysis of a rotating PBT. In future years, annual addenda will be written to document the target PBT analyte and study locations of that sampling year. This QAPP documents the overall structure of the study, as well as the sampling plan for 2016.
QAPP: PBT Monitoring in Lake Sediment Cores Page 8 – September 2016
3.1 Study area and surroundings Three waterbodies are selected each year for sediment core collection. Selection of target waterbodies is based primarily on proximity to known and potential sources. Each year, approximately two lakes are chosen close to or within known/potential sources of the target organic PBT. The third lake is located far from sources or in an area where atmospheric deposition is the predominant source. Other considerations for waterbody selection include:
• Spatial distribution to achieve statewide coverage. • Access to the waterbody. • Waterbodies where data from other studies is available. • Watersheds within a range of land-use types. • Physical features of the lake and watershed, including lake depositional patterns. • Collaboration with other programs and agencies.
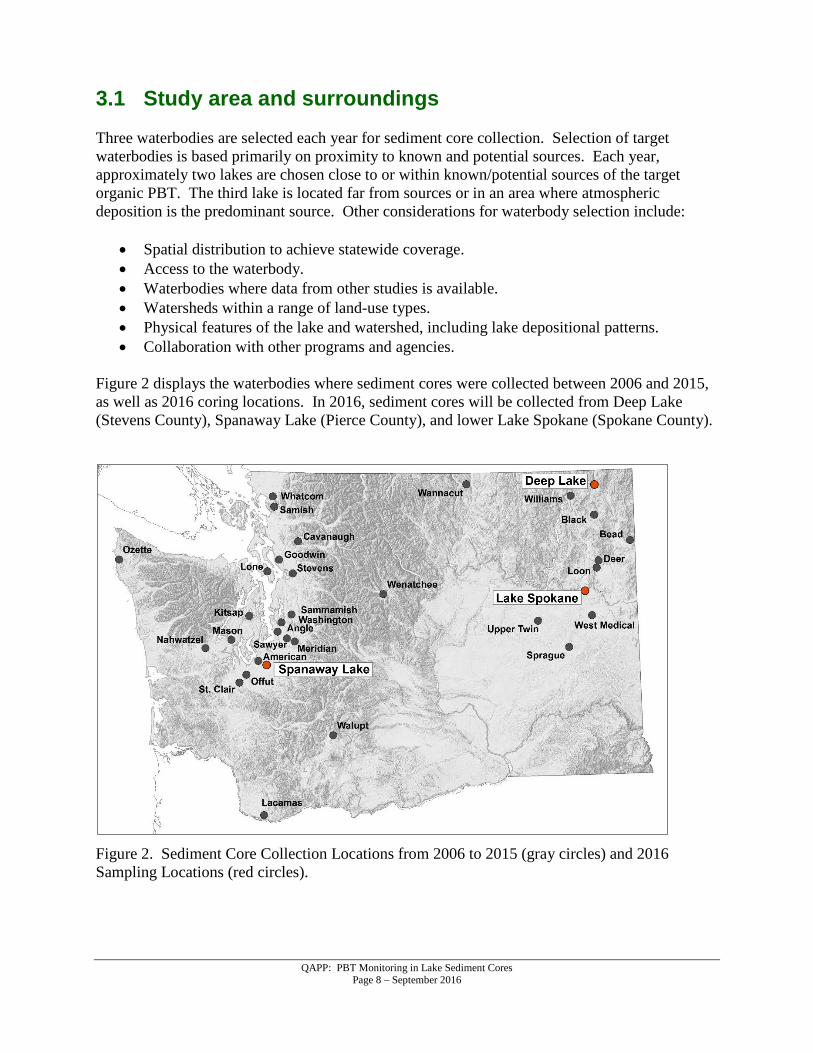
Figure 2 displays the waterbodies where sediment cores were collected between 2006 and 2015, as well as 2016 coring locations. In 2016, sediment cores will be collected from Deep Lake (Stevens County), Spanaway Lake (Pierce County), and lower Lake Spokane (Spokane County).
Figure 2. Sediment Core Collection Locations from 2006 to 2015 (gray circles) and 2016 Sampling Locations (red circles).

QAPP: PBT Monitoring in Lake Sediment Cores Page 9 – September 2016
Table 1. 2016 Sediment Core Study Lakes.
Waterbody County Elevation (ft)
Max Depth
(ft)
Mean Depth
(ft)
Lake Area (ac)
Watershed Area (ac) WA:LA
Deep Lake Stevens 2,025' 49' 34' 210 30,784 147
Lower Lake Spokane Spokane 1,536' 180' 50' 45,227 4,249,600 94
Spanaway Lake Pierce 320' 28' 16' 280 10,880 39
WA:LA = watershed area to lake area ratio 3.1.1 Logistical problems Suitable access has been a limiting factor for waterbody selection in the past. From 2006 to 2015, sediment core collections have been aboard a 28' research vessel that required highly developed boat launch access. Ecology is currently researching modifications to a smaller boat for access to a broader range of waterbodies, particularly to reach undeveloped lakes. Physical characteristics of the sediments at some waterbodies has hampered efforts to collect a suitable sediment core in past sampling. The sediment grain size and percent water content of the core can make for unsuccessful sediment core collection efforts. Unfortunately, desk reconnaissance is not adequate in identifying these potential issues. For some areas, preliminary grab samples from the waterbody are possible during the planning phase. However, particularly for eastern Washington lakes, this is not typically feasible. Instead, several back-up lakes nearby will be selected in case a sediment core cannot be collected from the primary target lake. High water content in sediments of a core can also affect laboratory analyses. Low percent solids can result in too little sample material for analytical methods, or could result in raised reporting limits. Obtaining sufficient material for organic contaminant analyses has been a difficulty in past sampling years. To mitigate this problem, samples to be analyzed for the organic PBT analyte will be centrifuged and overlying water decanted prior to shipment to the laboratory. The organic PBT analyses typically require the largest amount of material. Priority of sample material will be in the order of organic PBT (PCBs in 2016) > 210 Pb > metals > TOC. 3.1.2 History of study area The 2016 sampling locations were selected to evaluate sediment PCB deposition at a primarily undeveloped, forested waterbody (Deep Lake), an urban waterbody (Spanaway Lake), and a waterbody with known PCB contamination issues (Lake Spokane). No PCB data are available for Spanaway or Deep Lakes. PCB contamination of Lake Spokane and the upstream Spokane River has been well-characterized (Serdar et al., 2011). Currently, the Spokane River Regional Toxics Task Force leads efforts to find and reduce PCBs and other toxics in the Spokane River (http://srrttf.org/).
QAPP: PBT Monitoring in Lake Sediment Cores Page 10 – September 2016
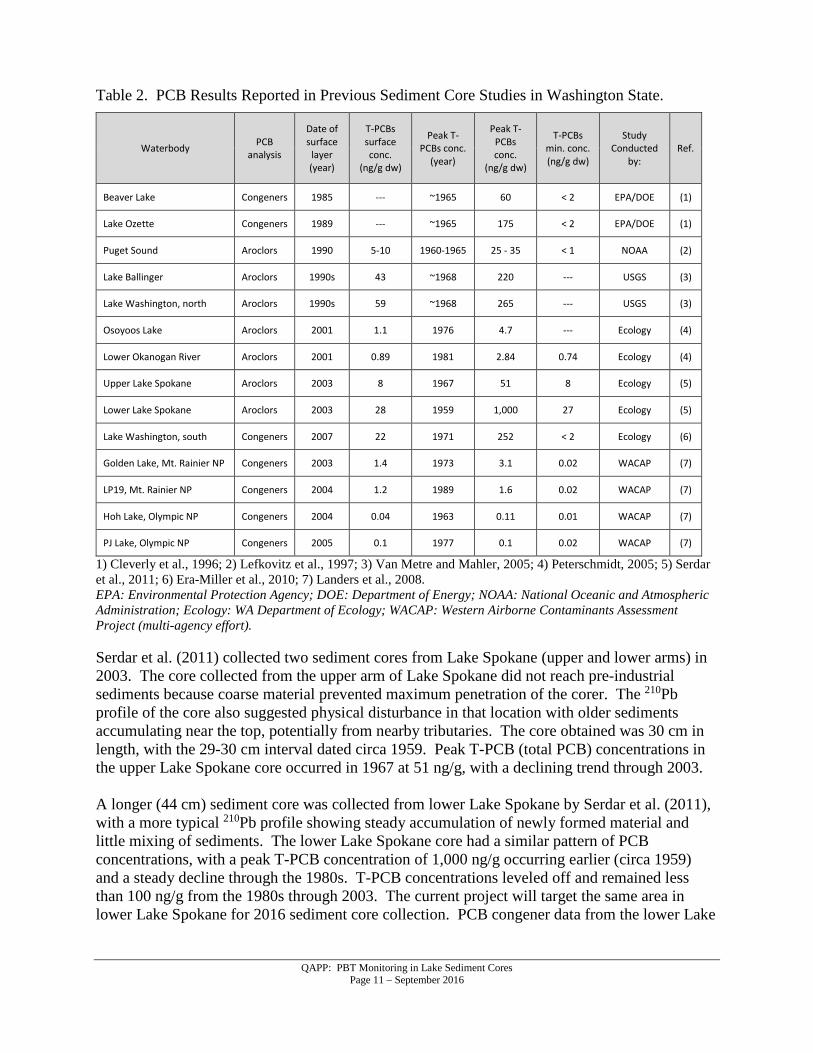
Ecology conducted a monitoring study of Deep Lake in 2014 to address water quality issues and algal blooms in the lake (Stuart, 2015). Monitoring results showed elevated fecal coliform and total suspended sediments coming into the lake from the inlet stream, significant sediment trapping by the lake, and anoxia in the hypolimnion during the summer months. Additional water quality sampling is planned for the lake in 2017/2018 (Albrecht, 2016). 3.1.3 Parameters of interest Target PBT analytes include those that are persistent in the environment, bioaccumulate up the food chain, and are toxic to aquatic or human life. Total lead (Pb), 210Pb, TOC, and grain size will be analyzed as well, for age-dating and interpretation of the sediment core. In 2016, the rotating PBT will be PCB congeners. PCBs are highly persistent in the environment, bioaccumulative, and have toxicity concerns including cancer and harm to immune, nervous, and reproductive systems, as well as thyroid disruption. Ecology and DOH published a CAP for PCBs in 2015, which describes major sources and pathways of PCBs, exposure to PCBs, toxic effects, and recommendations for actions to protect human health and the environment (Davies et al., 2015). Copper, titanium, and zinc will be analyzed in the Deep Lake sediment core in 2016 at the request of Ecology’s Eastern Regional Office (ERO) Water Quality Program. ERO’s Water Quality Program is interested in determining the history of metals inputs from nearby mining activities. 3.1.4 Results of previous studies Ecology’s PBT Monitoring Program publishes annual reports summarizing sediment core data on the website: http://www.ecy.wa.gov/programs/eap/toxics/cores.html. Results of previous sediment core studies relative to the 2016 target analyte – PCBs – are presented in Table 1. In general, sediment cores collected in Washington State have showed PCB concentrations starting to rise beginning in the 1940s, with peak concentrations in the mid-1960s to 1970s. Concentrations have generally fallen sharply after the peak, until around 1980, at which time they leveled off through the most recent sediments.
QAPP: PBT Monitoring in Lake Sediment Cores Page 11 – September 2016
Table 2. PCB Results Reported in Previous Sediment Core Studies in Washington State.
Waterbody PCB analysis
Date of surface
layer (year)
T-PCBs surface conc.
(ng/g dw)
Peak T-PCBs conc.
(year)
Peak T-PCBs conc.
(ng/g dw)
T-PCBs min. conc. (ng/g dw)
Study Conducted
by: Ref.
Beaver Lake Congeners 1985 --- ~1965 60 < 2 EPA/DOE (1)
Lake Ozette Congeners 1989 --- ~1965 175 < 2 EPA/DOE (1)
Puget Sound Aroclors 1990 5-10 1960-1965 25 - 35 < 1 NOAA (2)
Lake Ballinger Aroclors 1990s 43 ~1968 220 --- USGS (3)
Lake Washington, north Aroclors 1990s 59 ~1968 265 --- USGS (3)
Osoyoos Lake Aroclors 2001 1.1 1976 4.7 --- Ecology (4)
Lower Okanogan River Aroclors 2001 0.89 1981 2.84 0.74 Ecology (4)
Upper Lake Spokane Aroclors 2003 8 1967 51 8 Ecology (5)
Lower Lake Spokane Aroclors 2003 28 1959 1,000 27 Ecology (5)
Lake Washington, south Congeners 2007 22 1971 252 < 2 Ecology (6)
Golden Lake, Mt. Rainier NP Congeners 2003 1.4 1973 3.1 0.02 WACAP (7)
LP19, Mt. Rainier NP Congeners 2004 1.2 1989 1.6 0.02 WACAP (7)
Hoh Lake, Olympic NP Congeners 2004 0.04 1963 0.11 0.01 WACAP (7)
PJ Lake, Olympic NP Congeners 2005 0.1 1977 0.1 0.02 WACAP (7)
1) Cleverly et al., 1996; 2) Lefkovitz et al., 1997; 3) Van Metre and Mahler, 2005; 4) Peterschmidt, 2005; 5) Serdar et al., 2011; 6) Era-Miller et al., 2010; 7) Landers et al., 2008. EPA: Environmental Protection Agency; DOE: Department of Energy; NOAA: National Oceanic and Atmospheric Administration; Ecology: WA Department of Ecology; WACAP: Western Airborne Contaminants Assessment Project (multi-agency effort). Serdar et al. (2011) collected two sediment cores from Lake Spokane (upper and lower arms) in 2003. The core collected from the upper arm of Lake Spokane did not reach pre-industrial sediments because coarse material prevented maximum penetration of the corer. The 210Pb profile of the core also suggested physical disturbance in that location with older sediments accumulating near the top, potentially from nearby tributaries. The core obtained was 30 cm in length, with the 29-30 cm interval dated circa 1959. Peak T-PCB (total PCB) concentrations in the upper Lake Spokane core occurred in 1967 at 51 ng/g, with a declining trend through 2003. A longer (44 cm) sediment core was collected from lower Lake Spokane by Serdar et al. (2011), with a more typical 210Pb profile showing steady accumulation of newly formed material and little mixing of sediments. The lower Lake Spokane core had a similar pattern of PCB concentrations, with a peak T-PCB concentration of 1,000 ng/g occurring earlier (circa 1959) and a steady decline through the 1980s. T-PCB concentrations leveled off and remained less than 100 ng/g from the 1980s through 2003. The current project will target the same area in lower Lake Spokane for 2016 sediment core collection. PCB congener data from the lower Lake
QAPP: PBT Monitoring in Lake Sediment Cores Page 12 – September 2016
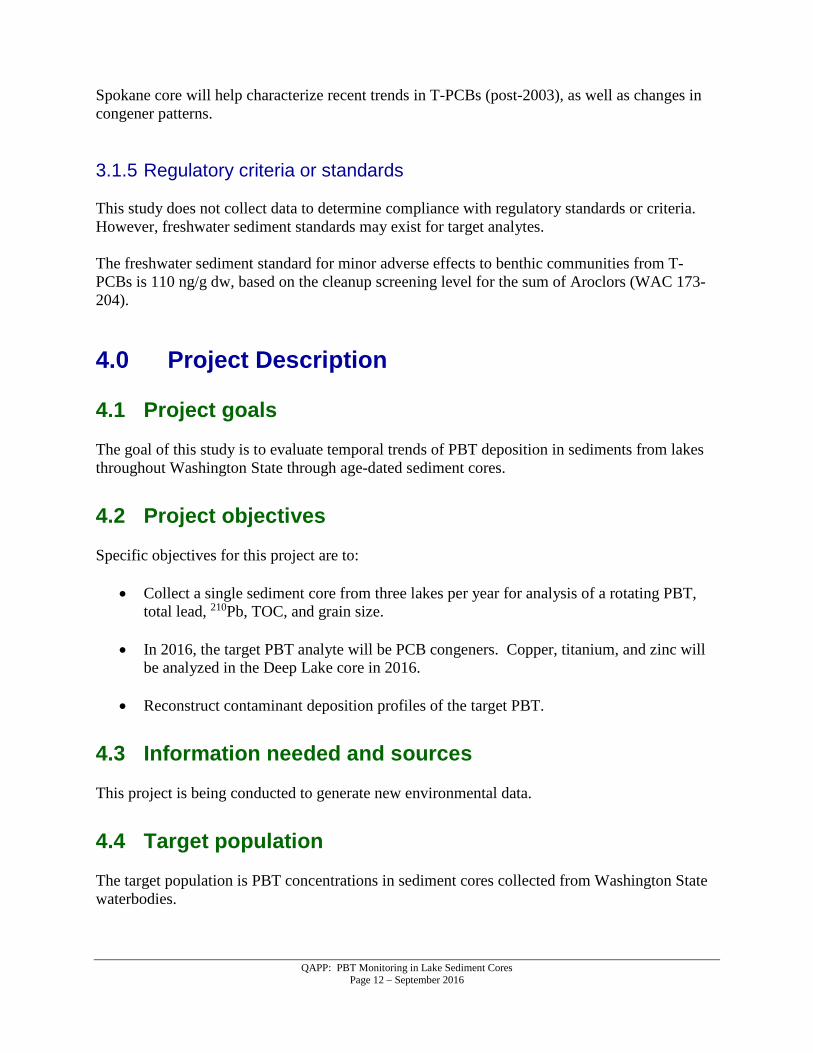
Spokane core will help characterize recent trends in T-PCBs (post-2003), as well as changes in congener patterns. 3.1.5 Regulatory criteria or standards This study does not collect data to determine compliance with regulatory standards or criteria. However, freshwater sediment standards may exist for target analytes. The freshwater sediment standard for minor adverse effects to benthic communities from T-PCBs is 110 ng/g dw, based on the cleanup screening level for the sum of Aroclors (WAC 173-204). 4.0 Project Description
4.1 Project goals The goal of this study is to evaluate temporal trends of PBT deposition in sediments from lakes throughout Washington State through age-dated sediment cores.
4.2 Project objectives Specific objectives for this project are to:
• Collect a single sediment core from three lakes per year for analysis of a rotating PBT, total lead, 210Pb, TOC, and grain size.
• In 2016, the target PBT analyte will be PCB congeners. Copper, titanium, and zinc will be analyzed in the Deep Lake core in 2016.
• Reconstruct contaminant deposition profiles of the target PBT.
4.3 Information needed and sources This project is being conducted to generate new environmental data.
4.4 Target population The target population is PBT concentrations in sediment cores collected from Washington State waterbodies.

QAPP: PBT Monitoring in Lake Sediment Cores Page 13 – September 2016
4.5 Study boundaries At each study lake, a sediment core will be collected from a discrete sampling point in the deepest flat part of the lake. Figure 3 displays the target sampling locations for 2016.
Figure 3. Target Sampling Locations for 2016 Sediment Core Collection (orange circles).
QAPP: PBT Monitoring in Lake Sediment Cores Page 14 – September 2016
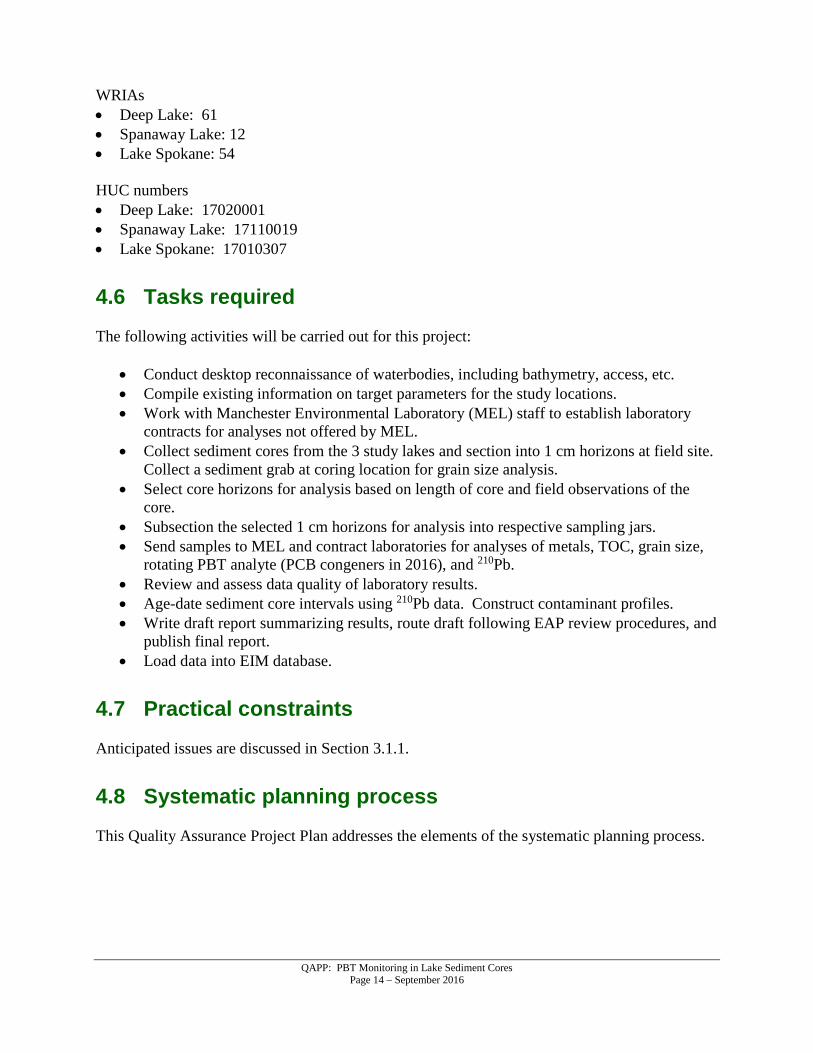
WRIAs • Deep Lake: 61 • Spanaway Lake: 12 • Lake Spokane: 54 HUC numbers • Deep Lake: 17020001 • Spanaway Lake: 17110019 • Lake Spokane: 17010307
4.6 Tasks required The following activities will be carried out for this project:
• Conduct desktop reconnaissance of waterbodies, including bathymetry, access, etc. • Compile existing information on target parameters for the study locations. • Work with Manchester Environmental Laboratory (MEL) staff to establish laboratory
contracts for analyses not offered by MEL. • Collect sediment cores from the 3 study lakes and section into 1 cm horizons at field site.
Collect a sediment grab at coring location for grain size analysis. • Select core horizons for analysis based on length of core and field observations of the
core. • Subsection the selected 1 cm horizons for analysis into respective sampling jars. • Send samples to MEL and contract laboratories for analyses of metals, TOC, grain size,
rotating PBT analyte (PCB congeners in 2016), and 210Pb. • Review and assess data quality of laboratory results. • Age-date sediment core intervals using 210Pb data. Construct contaminant profiles. • Write draft report summarizing results, route draft following EAP review procedures, and
publish final report. • Load data into EIM database.
4.7 Practical constraints Anticipated issues are discussed in Section 3.1.1.
4.8 Systematic planning process This Quality Assurance Project Plan addresses the elements of the systematic planning process.

QAPP: PBT Monitoring in Lake Sediment Cores Page 15 – September 2016
5.0 Organization and Schedule
5.1 Key individuals and their responsibilities
Table 3. Organization of project staff and responsibilities.
EAP Staff Title Responsibilities Debby Sargeant Toxics Studies Unit SCS Phone: 360-407-6775
Client and Supervisor for the Project Manager
Clarifies scope of the project. Provides internal review of the QAPP, addendums, and reports. Approves the final QAPP and addendums. Manages budget and staffing needs.
Jessica Archer SCS Phone: 360-407-6698
Client and SCS Manager
Clarifies scope of the project. Provides internal review of the QAPP, addendums, and reports. Approves the final QAPP and addendums.
Callie Mathieu Toxics Studies Unit SCS Phone: 360-407-6965
Project Manager and Principal Investigator
Writes the QAPP, addendums, and reports. Coordinates with MEL and contract laboratory. Oversees field collections. Conducts QA review of data, analyzes and interprets data. Responsible for final reports.
Christopher Clinton Toxics Studies Unit SCS Phone: 360-407-6060
Field Lead Leads field collections, records field information, and sends samples to the laboratory. Enters data into EIM.
Joel Bird Manchester Environmental Laboratory Phone: 360-871-8801
Director Reviews and approves the final QAPP.
Contract Laboratory Contract Laboratory Project Manager
Reviews draft QAPP, coordinates with MEL QA Coordinator
William R. Kammin Phone: 360-407-6964
Ecology Quality Assurance Officer
Reviews and approves the draft QAPP and the final QAPP.
EAP: Environmental Assessment Program EIM: Environmental Information Management database QAPP: Quality Assurance Project Plan SCS: Statewide Coordination Section
5.2 Special training and certifications All field crew carrying out sampling will have specialized training and experience in collection of sediment cores using a box corer.
5.3 Organization chart Tables 3 and 4 outline the organization for this study.
QAPP: PBT Monitoring in Lake Sediment Cores Page 16 – September 2016
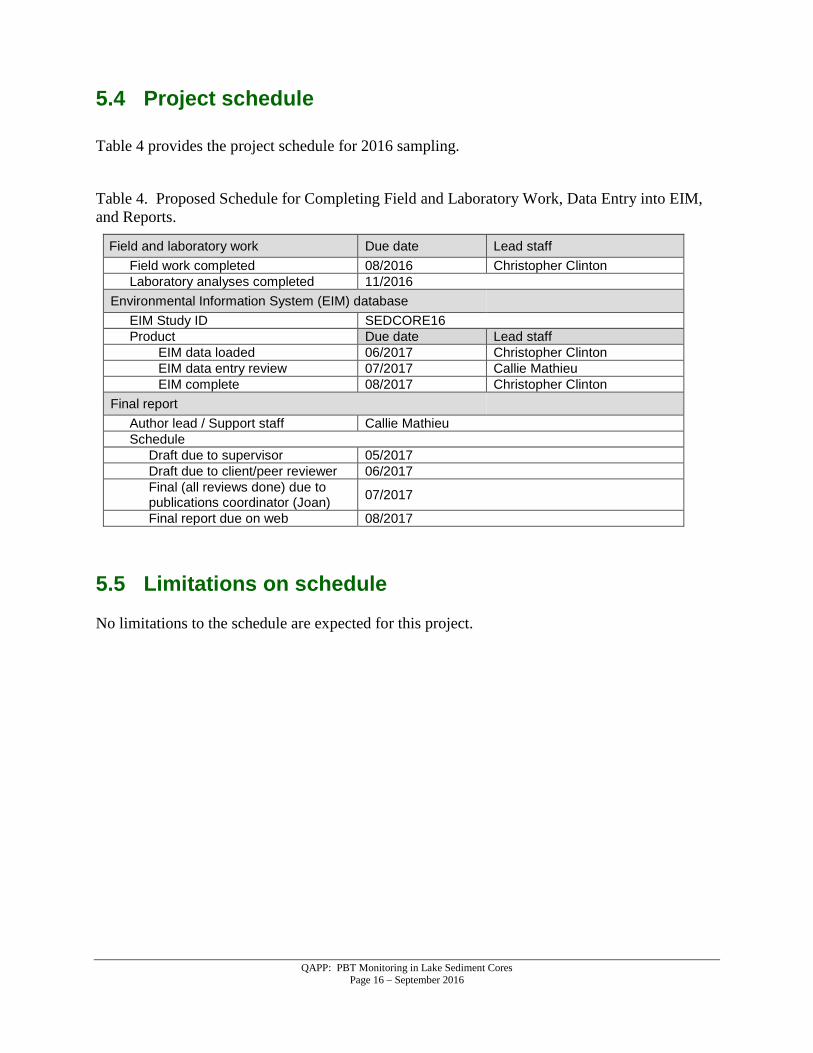
5.4 Project schedule
Table 4 provides the project schedule for 2016 sampling.
Table 4. Proposed Schedule for Completing Field and Laboratory Work, Data Entry into EIM, and Reports.
Field and laboratory work Due date Lead staff Field work completed 08/2016 Christopher Clinton Laboratory analyses completed 11/2016
Environmental Information System (EIM) database EIM Study ID SEDCORE16 Product Due date Lead staff
EIM data loaded 06/2017 Christopher Clinton EIM data entry review 07/2017 Callie Mathieu EIM complete 08/2017 Christopher Clinton
Final report Author lead / Support staff Callie Mathieu Schedule
Draft due to supervisor 05/2017 Draft due to client/peer reviewer 06/2017 Final (all reviews done) due to publications coordinator (Joan) 07/2017
Final report due on web 08/2017
5.5 Limitations on schedule No limitations to the schedule are expected for this project.
QAPP: PBT Monitoring in Lake Sediment Cores Page 17 – September 2016
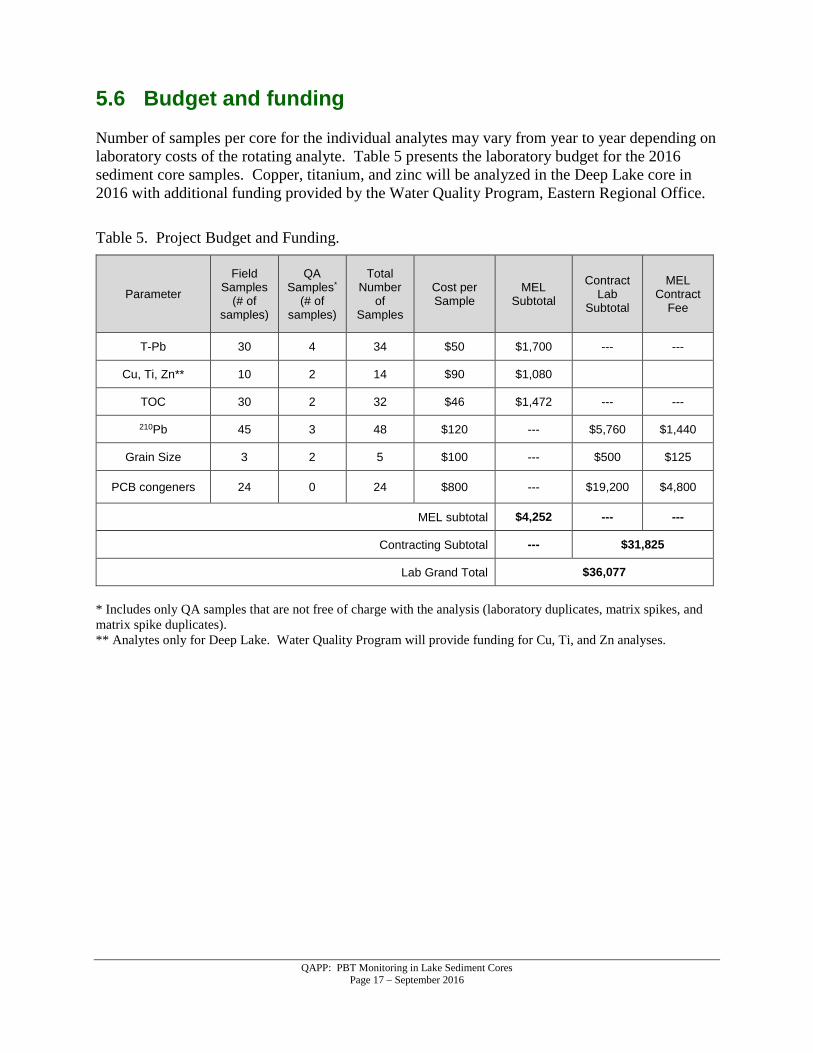
5.6 Budget and funding Number of samples per core for the individual analytes may vary from year to year depending on laboratory costs of the rotating analyte. Table 5 presents the laboratory budget for the 2016 sediment core samples. Copper, titanium, and zinc will be analyzed in the Deep Lake core in 2016 with additional funding provided by the Water Quality Program, Eastern Regional Office.
Table 5. Project Budget and Funding.
Parameter
Field Samples
(# of samples)
QA Samples*
(# of samples)
Total Number
of Samples
Cost per Sample
MEL Subtotal
Contract Lab
Subtotal
MEL Contract
Fee
T-Pb 30 4 34 $50 $1,700 --- ---
Cu, Ti, Zn** 10 2 14 $90 $1,080
TOC 30 2 32 $46 $1,472 --- ---
210Pb 45 3 48 $120 --- $5,760 $1,440
Grain Size 3 2 5 $100 --- $500 $125
PCB congeners 24 0 24 $800 --- $19,200 $4,800
MEL subtotal $4,252 --- ---
Contracting Subtotal --- $31,825
Lab Grand Total $36,077
* Includes only QA samples that are not free of charge with the analysis (laboratory duplicates, matrix spikes, and matrix spike duplicates). ** Analytes only for Deep Lake. Water Quality Program will provide funding for Cu, Ti, and Zn analyses.
QAPP: PBT Monitoring in Lake Sediment Cores Page 18 – September 2016
6.0 Quality Objectives
6.1 Decision Quality Objectives (DQOs) This study does not require decision quality objectives.
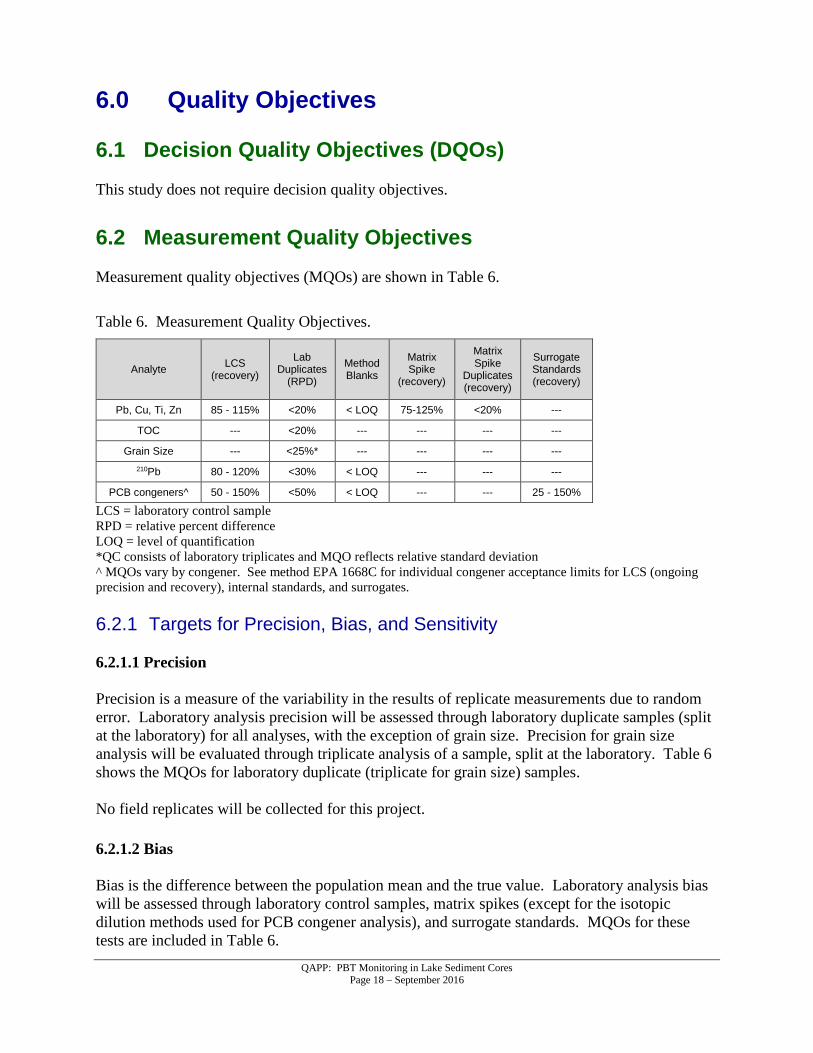
6.2 Measurement Quality Objectives Measurement quality objectives (MQOs) are shown in Table 6.
Table 6. Measurement Quality Objectives.
Analyte LCS (recovery)
Lab Duplicates
(RPD)
Method Blanks
Matrix Spike
(recovery)
Matrix Spike
Duplicates (recovery)
Surrogate Standards (recovery)
Pb, Cu, Ti, Zn 85 - 115% <20% < LOQ 75-125% <20% ---
TOC --- <20% --- --- --- ---
Grain Size --- <25%* --- --- --- --- 210Pb 80 - 120% <30% < LOQ --- --- ---
PCB congeners^ 50 - 150% <50% < LOQ --- --- 25 - 150%
LCS = laboratory control sample RPD = relative percent difference LOQ = level of quantification *QC consists of laboratory triplicates and MQO reflects relative standard deviation ^ MQOs vary by congener. See method EPA 1668C for individual congener acceptance limits for LCS (ongoing precision and recovery), internal standards, and surrogates. 6.2.1 Targets for Precision, Bias, and Sensitivity 6.2.1.1 Precision Precision is a measure of the variability in the results of replicate measurements due to random error. Laboratory analysis precision will be assessed through laboratory duplicate samples (split at the laboratory) for all analyses, with the exception of grain size. Precision for grain size analysis will be evaluated through triplicate analysis of a sample, split at the laboratory. Table 6 shows the MQOs for laboratory duplicate (triplicate for grain size) samples. No field replicates will be collected for this project. 6.2.1.2 Bias Bias is the difference between the population mean and the true value. Laboratory analysis bias will be assessed through laboratory control samples, matrix spikes (except for the isotopic dilution methods used for PCB congener analysis), and surrogate standards. MQOs for these tests are included in Table 6.
QAPP: PBT Monitoring in Lake Sediment Cores Page 19 – September 2016
6.2.1.3 Sensitivity Sensitivity is a measure of the capability of a method to detect a substance above background noise. Laboratory analysis sensitivity is defined for the study as the quantitation limit. See Table 8 for quantitation (reporting) limits. 6.2.2 Targets for Comparability, Representativeness, and Completeness 6.2.2.1 Comparability Sediment cores will be collected according to Ecology’s standard operating procedures (SOP) to help ensure comparability between results from previous and future sampling events. Section 8.1 discusses SOPs followed for this study. Laboratory methods will remain the same from year to year in order to maintain comparable laboratory results. 6.2.2.2 Representativeness Sediment cores provide a representative, time-integrated historical deposition profile of sediment-bound contaminants. Issues of representativeness for long-term monitoring studies, such as inconsistent reporting limits and missing data, are alleviated by using sediment cores, as samples from multiple dates are being analyzed at once instead over time. Study locations are selected to represent lakes with a range of contamination potential, watershed land uses, and physical characteristics (i.e., watershed area to surface area ratios). 6.2.2.3 Completeness The project manager will consider the study to have achieved completeness if 95% of the samples are analyzed acceptably.
QAPP: PBT Monitoring in Lake Sediment Cores Page 20 – September 2016
7.0 Sampling Process Design (Experimental Design)
7.1 Study Design Ecology’s PBT Monitoring Program will collect one sediment core from three lakes per year to help characterize the occurrence and temporal trends of PBTs in Washington State. Sediment core samples will be analyzed for a rotating PBT contaminant (PCBs in 2016) to reconstruct historical deposition profiles. The rotating PBT analyte will be selected annually based on data needs. Analytes will be selected from Ecology’s current PBT List or may be a new persistent contaminant that has potential for agency actions. Ecology will use the information to fill data gaps concerning whether known or potential PBT chemicals are increasing or decreasing in fresh waterbodies of Washington. Sediment core samples will be analyzed for 210Pb for calculation of dates and sedimentation rates using the constant rate of supply (CRS) model (Appleby and Oldfield, 1978). Total lead will be analyzed to use as a secondary marker for dating to align with peak leaded gasoline usage. TOC and grain size will be analyzed to support interpretation of the results. Field crews will collect a vertical sediment profile (35-50 cm) from the deepest flat area in each waterbody and section in the field into 1 cm intervals, with the exception of the top 2 cm. The top (water-sediment surface) 2 cm will be combined in order to have sufficient sample material for analyses, due to the high water content of the sediments at the top. Select intervals will be processed at Ecology headquarters by thoroughly homogenizing the sediment layer and then splitting into subsamples for analyses. The sediment layers selected for analysis will be based on total length of core and field observations (i.e., sediment color and consistency changes). A higher density of intervals will be tested near the top (most recent sediments). Spacing between the selected layers will be farther apart as sampling moves down the core. Generally, 8 sediment intervals (samples) per core will be analyzed for the rotating PBT analyte. Ten samples per core will be analyzed for total lead and TOC. Fifteen samples per core will be analyzed for 210Pb to achieve high resolution age-dating of the core. A separate sediment grab at the coring site will be collected using a standard ponar grab and the top 2 cm will be collected for analysis of grain size. New lakes will be selected each year to target waterbodies that capture different contaminant sources, such as point sources, stormwater, and atmospheric deposition. Two lakes per year will be selected nearby or within potential sources of the organic PBT being analyzed. For some analytes, such as those used in consumer products, this may include urban lakes that receive stormwater. The third lake selected will be representative of diffuse inputs, such as atmospheric deposition. Section 3.1 describes lake selection criteria in more detail.

QAPP: PBT Monitoring in Lake Sediment Cores Page 21 – September 2016
7.1.1 Field measurements The total length of the sediment core will be measured in the field, both immediately upon retrieval and after the core is stationed onto the sectioning apparatus table. A sediment coring log will be kept with field notes for each interval, including visual descriptions and characteristics of the core, such as odor and debris present. Geographic coordinates and water depth of the coring location will also be recorded in the field. 7.1.2 Sampling location and frequency Sediment core samples will be collected once during the summer at each of the three waterbodies. All three sediment cores will typically be collected within the same week or within a two-week timeframe. 7.1.3 Parameters to be determined In 2016, sediment samples will be analyzed for PCB congeners, total lead, TOC, 210Pb, and grain size. Copper, titanium, and zinc will be analyzed in the Deep Lake samples only. 7.2 Maps or diagram The study area and sampling locations are displayed in Figures 2 and 3, respectively. 7.3 Assumptions underlying design This study makes the assumption that the target analytes are persistent in sediments and that concentrations measured at depth in the core are a preserved representation of what was deposited at the time of sedimentation. Smearing, bioturbation, and migration of analytes through porewater can impact the preservation of chemicals within the sediment profile and may affect this assumption. At least one deep layer sample will be analyzed for the rotating PBT analyte to attempt to reach sediment dated before production of the chemical began. This will help inform the project manager whether smearing has occurred. 7.4 Relation to objectives and site characteristics Objectives of the project are supported by the study design. 7.5 Characteristics of existing data This study provides temporal trends of PBTs in Washington State freshwater waterbodies across a range of land use types and contamination potential. Other freshwater sediment core studies in Washington have been limited in scope, primarily focusing on areas of known contamination or clean-up sites for pollutants.

QAPP: PBT Monitoring in Lake Sediment Cores Page 22 – September 2016
8.0 Sampling Procedures
8.1 Field measurement and field sampling SOPs Sediment cores will be collected following Ecology’s SOP Number EAP038 for Collection of Freshwater Sediment Core Samples Using a Box or KB Corer (Furl and Meredith, 2008). Surface sediments will be collected via a standard ponar following Ecology’s SOP Number EAP040 for Obtaining Freshwater Sediment Samples (Blakley, 2013).
8.2 Containers, preservation methods, holding times
Table 7. Containers, Sample Size, Preservation Methods, and Holding Times.
Parameter Minimum Quantity Required
Container Field preservation
Preservation after processing Holding Time
Pb, Cu, Ti, Zn 25 g ww 4 oz. glass jar cool to 4° C freeze, -10° C 1 year
TOC 25 g ww 4 oz. glass jar cool to 4° C freeze, -10° C 1 year
Grain Size 150 g ww 8 oz. HDPE jar cool to 4° C cool to 4° C 6 months
210Pb 20 g ww 2 oz. glass jar cool to 4° C none required n/a
PCB Congeners 10-20 g dw 8 oz. glass jar cool to 4° C freeze, -10° C 1 year extraction, 1 year analysis
ww = wet weight dw = dry weight
8.3 Invasive species evaluation Boat and sampling gear will be inspected and decontaminated following Ecology’s SOP Number EAP070 for Procedures to Minimize the Spread of Invasive Species Version 2.0 (Parson et al., 2012).
8.4 Equipment decontamination Field staff will follow Ecology’s SOP Number EAP090, Decontaminating Field Equipment for Sampling Toxics in the Environment (Friese, 2014), to clean the sampling equipment prior to field collection. Acrylic liners and subsectioning equipment will be scrubbed with Liquinox and hot tap water, followed by sequential rinses with 10% nitric acid, deionized water, acetone, and hexane. Equipment will be dried in a hood, and then wrapped in aluminum foil for transport to

QAPP: PBT Monitoring in Lake Sediment Cores Page 23 – September 2016
the field location. While sectioning the sediment core in the field, equipment will be rinsed (and scrubbed, if necessary) with ambient water from the lake surface in between 1 cm sediment intervals. Excess water will be shaken off prior to sectioning the next interval.
8.5 Sample ID While sectioning the sediment core in the field, each 1 cm interval (0-2 cm for the top interval) will be placed into an 8 oz. glass jar and labeled with the three-letter waterbody abbreviation plus sediment interval (i.e., MER0-2, MER2-3, etc.) written on the jar and lid in permanent ink. Once intervals are homogenized and split into laboratory samples at Ecology’s Headquarters, the samples will be assigned a sample ID using MEL’s work order number followed by a consecutive number.
8.6 Chain-of-custody, if required Chain of custody will be maintained for all samples throughout the project. Samples will be stored in a cooler or freezer in Ecology’s locked chain-of-custody room at Headquarters. MEL’s chain of custody form will be used for documentation of shipment to laboratories.
8.7 Field log requirements Field data will be recorded in a bound, waterproof notebook on Rite-in-the-Rain paper. Corrections will be made with single line strikethroughs, initials, and date. The following information will be recorded in the field log: • Name and location of project • Field personnel • Sequence of events • Any changes or deviations from the QAPP • Environmental conditions • Date, time, and location of sediment core collection • Length and description of full core • Description of core intervals, such as color, odor, and appearance • Unusual circumstances that might affect interpretation of results
8.8 Other activities An additional core will be collected from Deep Lake in 2016 following the procedures documented above. Sample material will be archived for potential study in the future related to the ongoing monitoring of water quality there.

QAPP: PBT Monitoring in Lake Sediment Cores Page 24 – September 2016
9.0 Measurement Methods
9.1 Field procedures table/field analysis table No parameters will be measured/analyzed in the field for this project.
9.2 Lab procedures table
Table 8. Lab Procedures.
Parameter
Samples
Expected range of results Reporting limit Method Analytical
instrument Number of
samples Arrival date
Pb 30 8/31/2016 1.0 - 1,000 mg/Kg 0.1 mg/Kg EPA 6020 ICP-MS
Cu 10 8/31/2016 < 0.1 - 50 mg/Kg 0.1 mg/Kg EPA 6020 ICP-MS
Ti 10 8/31/2016 <0.1 - 2,000 mg/Kg 0.1 mg/Kg EPA 6020 ICP-MS
Zn 10 8/31/2016 <5 - 100 mKg/g 5 mg/Kg EPA 6020 ICP-MS
TOC 30 8/31/2016 1.0 - 30 % 1% PSEP-EPA, 1986
Acidification and CO2
measurement
Grain Size 3 8/31/2016 --- 0.10% PSEP-EPA, 1986 Sieve-pipette
210Pb 45 8/31/2016 < 0.45 - 30 pCi/g 0.45 pCi/g Alpha spectroscopy
Alpha spectroscopy
PCB congeners 24 8/31/2016 < 0.01 - 1,000,000
pg/g 0.01 - 200 pg/g* EPA1668C HRGC/HRMS
EPA = Environmental Protection Agency PSEP = Puget Sound Estuary Program ICP-MS = Inductively Coupled Plasma Mass Spectrometry HRGC/HRMS = High Resolution Gas Chromatography / High Resolution Mass Spectrometry *Varies by congener, per EPA Method 1668C.
9.3 Sample preparation method(s) Metals will be prepared for analysis following EPA Method 3052B. Samples being analyzed for 210Pb will be prepared following the contract laboratory’s standard operating procedures. The contract laboratory’s preparation method for 210Pb will be reviewed by the project manager and MEL’s QA coordinator and should include a digestion step using hydrofluoric acid. All other
QAPP: PBT Monitoring in Lake Sediment Cores Page 25 – September 2016
samples will be prepared for analysis following methods outlined in the analytical method (see Table 8).
9.4 Special method requirements Sediment cores require low level analysis. PCB congeners are being analyzed by high resolution methods to achieve low quantitation limits.
9.5 Lab(s) accredited for method(s) All laboratories used for this project will be accredited for the method employed. 10.0 Quality Control (QC) Procedures
10.1 Table of field and lab QC required
Table 9. QC Samples, Types, and Frequency.
Parameter
Laboratory
LCS Method blanks Matrix spikes Matrix spike
duplicates Laboratory duplicates Surrogates
Pb, Cu, Ti, Zn 1/batch 1/batch 1/batch 1/batch --- ---
TOC 1/batch 1/batch --- --- 1/batch ---
Grain Size 1/batch 1/batch --- --- 1/batch ---
210Pb 1/batch 1/batch --- --- 1/batch ---
PCB congeners 1/batch 1/batch --- --- 1/batch each sample
LCS = laboratory control sample One batch equals 20 samples or fewer.
10.2 Corrective action processes The project manager will work closely with the contract laboratory and MEL staff conducting the data review to examine data that fall outside of QC criteria. The project manager will determine whether data should be re-analyzed, rejected, or used with appropriate qualification.

QAPP: PBT Monitoring in Lake Sediment Cores Page 26 – September 2016
11.0 Data Management Procedures
11.1 Data recording/reporting requirements All field data and observations will be recorded on waterproof paper kept in field notebooks. Staff will transfer information contained in field notebooks to Excel spreadsheets after they return from the field. Data entries will be independently verified for accuracy by another member of the project team. Field and laboratory data for the project will be entered into Ecology’s EIM system. Laboratory data will be uploaded into EIM, using the EIM XML results template.
11.2 Laboratory data package requirements Contract laboratories will deliver a Tier 4 Level data package to MEL with the complete raw laboratory dataset. After reviewing data packages from the contract laboratory, MEL will provide case narratives to the project manager with the final qualified results and a description of the quality of the contract laboratory data. MEL will also provide case narratives for analyses performed in-house. Case narratives should include any problems encountered with the analyses, corrective actions taken, changes to the referenced method, and an explanation of data qualifiers. Narratives will also address the condition of samples on receipt, sample preparation, methods of analysis, instrument calibration, and results of QC tests.
11.3 Electronic transfer requirements MEL will deliver case narratives in PDF format, and electronic data deliverables of contract laboratory data in an Excel spreadsheet format, to the project manager via email. Data generated by MEL (analyses done in-house) will be delivered to the project manager via LIMS.
11.4 Acceptance criteria for existing data Not applicable. This study will not use existing data.
11.5 EIM/STORET data upload procedures All laboratory data will be uploaded to Ecology’s EIM database following internal procedures, including a review process.

QAPP: PBT Monitoring in Lake Sediment Cores Page 27 – September 2016
12.0 Audits and Reports
12.1 Number, frequency, type, and schedule of audits MEL and contracted laboratories must participate in performance and system audits of their routine procedures. No audits are planned specifically for this project.
12.2 Responsible personnel Not applicable. No audits are planned for this study.
12.3 Frequency and distribution of report A draft report of the annual sampling results will be completed in July of each year and a final report will be published on the internet in October. See Table 4 for the 2016 report schedule. Reports will include, at a minimum, the following:
• A map showing sampling locations. • A brief description of field and laboratory methods. • A discussion of data quality. • Summary tables of contaminant concentrations and enrichment factors. • Graphs showing contaminant profiles of sediment cores. • A discussion of the results, including sedimentation rates and contaminant concentrations
and fluxes. • Recommendations based on the sampling results.
The additional metals being analyzed in the Deep Lake core will be reported to Ecology’s Eastern Regional Office staff in a separate data submittal memo.
12.4 Responsibility for reports The project manager/principal investigator will be the lead responsible for the final report.

QAPP: PBT Monitoring in Lake Sediment Cores Page 28 – September 2016
13.0 Data Verification
13.1 Field data verification, requirements, and responsibilities Field notes will be verified by the project manager. No data will be generated in the field.
13.2 Lab data verification Data verification involves examining the data for errors, omissions, and compliance with QC acceptance criteria. MEL’s SOPs for data reduction, review, and reporting will meet the needs of the project. Data packages will be assessed by MEL’s QA Officer using the EPA Functional Guidelines for Organic Data Review (EPA, 2014). MEL staff will provide a written report of their data review which will include a discussion of whether (1) MQOs were met, (2) proper analytical methods and protocols were followed, (3) calibrations and controls were within limits, and (4) data were consistent, correct, and complete, without errors or omissions. The principal investigator/project manager is responsible for the final acceptance of the project data. The complete data package, along with MEL’s written report, will be assessed for completeness and reasonableness. Based on these assessments, the data will either be accepted, accepted with qualifications, or rejected and re-analysis considered. Accuracy of data entered into EIM will be verified by someone other than the data engineer per the Environmental Assessment Program’s EIM data entry business rules.
13.3 Validation requirements, if necessary Independent data validation will not be required for this project.

QAPP: PBT Monitoring in Lake Sediment Cores Page 29 – September 2016
14.0 Data Quality (Usability) Assessment
14.1 Process for determining whether project objectives have been met After the project data have been reviewed and verified, the principal investigator/project manager will determine if the data are of sufficient quality to make determinations and decisions for which the study was conducted. The data from the laboratory’s QC procedures will provide information to determine if MQOs have been met. Laboratory and QA staff familiar with assessment of data quality may be consulted. The project final report will discuss data quality and whether the project objectives were met. If limitations in the data are identified, they will be noted. Some analytes will be reported near the detection capability of the selected methods. MQOs may be difficult to achieve for these results. MEL’s SOP for data qualification and best professional judgment will be used in the final determination of whether to accept, reject, or accept the results with qualification. The assessment will be based on a review of laboratory QC results. This will include assessment of laboratory precision, contamination (blanks), accuracy, matrix interferences, and the success of laboratory QC samples meeting MQOs.
14.2 Data analysis and presentation methods A summary of the data will be presented in the final report. Contaminant results will be presented as both concentrations and fluxes. Fluxes will be calculated as the contaminant concentration multiplied by the sedimentation rate for the sediment core interval. Other components to be included in the final report are described in Section 12.3. In 2016, both T-PCB and PCB congener profiles will be analyzed and presented in the final report.
14.3 Treatment of non-detects Laboratory data will be reported down to the method detection limit, with an associated “U” or “UJ” qualifier for non-detected results. When calculating total PCB values (T-PCBs), non-detects will be assigned a value of zero. Summed values in the final report will include only detected congener results that are unqualified and/or that have been qualified “J” (indicating that the analyte was positively identified and the associated numerical value is approximate). Congener values that have been qualified “NJ” (indicating that the analyte has been “tentatively identified” and the associated value represents its approximate concentration) will not be included in T-PCB sums. If a sample is comprised of all non-detected congener results, then the final T-PCB value will be assigned “ND” for not detected. T-PCB values will be qualified “J” if more than 10% of the total result is composed of congener values containing “J” qualifiers.

QAPP: PBT Monitoring in Lake Sediment Cores Page 30 – September 2016
For summed T-PCB values in the final report, results will be censored for blank contamination using a 10 times rule. A congener will be considered a non-detect if the concentration is less than 10 times the concentration of the associated laboratory method blank. PCB data will also be examined for changes in congener make-up over the years. For this congener profile analysis, data will be censored for blank contamination using a 3 times rule. A congener will be considered a non-detect if the concentration is less than 3 times the associated laboratory method blank. Data qualified as “NJ” will also be used in the PCB congener profile analysis if the project manager determines the data are useable for that purpose. All data entered into EIM will be censored using the 10 times rule for blank contamination.
14.4 Sampling design evaluation The number and type of samples collected for this study will be sufficient to meet objectives.
14.5 Documentation of assessment Documentation of assessment will occur in annual final reports. 15.0 References
Albrecht, A., 2016. Quality Assurance Project Plan: Deep Lake (Stevens County) Monitoring Addendum 1.0. Washington State Department of Ecology, Olympia, WA. Publication Number 16-03-117. https://fortress.wa.gov/ecy/publications/SummaryPages/1603117.html Appleby, P.G. and F. Oldfield, 1978. The Calculation of Lead-210 Dates Assuming a Constant Rate of Supply of Unsupported 210Pb to the Sediment. Catena, Vol. 5: 1-8. Blakley, N., 2013. Standard Operating Procedure for Obtaining Freshwater Sediment Samples. Washington State Department of Ecology, Olympia, WA. Publication Number EAP040. http://www.ecy.wa.gov/programs/eap/quality.html Coots, R., 2006. Quality Assurance Project Plan: Depositional History of Mercury in selected Washington Lakes Determined from Sediment Cores. Washington State Department of Ecology, Olympia, WA. Publication Number 06-03-113. https://fortress.wa.gov/ecy/publications/summarypages/0603113.html Davies, H., et al., 2009. Washington State Lead Chemical Action Plan. Washington State Department of Ecology, Olympia, WA. Publication Number 09-07-008. https://fortress.wa.gov/ecy/publications/summarypages/0907008.html Davies, H., et al., 2012. PAH Chemical Action Plan. Washington State Department of Ecology, Olympia, WA. Publication Number 12-07-048. https://fortress.wa.gov/ecy/publications/SummaryPages/1207048.html
QAPP: PBT Monitoring in Lake Sediment Cores Page 31 – September 2016
Davies, H., et al., 2015. PCB Chemical Action Plan. Washington State Department of Ecology, Olympia, WA. Publication Number 15-07-002. https://fortress.wa.gov/ecy/publications/SummaryPages/1507002.html Ecology and Health, 2006. Washington State Polybrominated Diphenyl Ether (PBDE) Chemical Action Plan: Final Plan. Washington State Department of Ecology, Olympia, WA. Publication Number 05-07-048. https://fortress.wa.gov/ecy/publications/summarypages/0507048.html Era-Miller, B., R. Jack, and J. Colton, 2010. General Characterization of PCBs in South Lake Washington Sediments. Washington State Department of Ecology, Olympia, WA. Publication Number 10-03-014. https://fortress.wa.gov/ecy/publications/SummaryPages/1003014.html Furl, C. and C. Meredith, 2008. Standard Operating Procedure for Collection of Freshwater Sediment Core Samples Using a Box or KB Corer. Washington State Department of Ecology, Olympia, WA. Publication Number EAP038. http://www.ecy.wa.gov/programs/eap/quality.html Gallagher, M.J., 2000. Proposed Strategy to Continually Reduce Persistent Bioaccumulative Toxics (PBTs) in Washington State. Washington State Department of Ecology, Olympia, WA. Publication Number 00-03-054. https://fortress.wa.gov/ecy/publications/summarypages/0003054.html Mathieu, C., 2012. Addendum 2 to Quality Assurance Project Plan: Depositional History of Mercury in Selected Washington Lakes Determined from Sediment Cores. Washington State Department of Ecology, Olympia, WA. Publication Number 12-03-119. https://fortress.wa.gov/ecy/publications/summarypages/1203119.html Mathieu, C., 2015. Addendum 5 to Quality Assurance Project Plan: Depositional History of Mercury in Selected Washington Lakes Determined from Sediment Cores. Washington State Department of Ecology, Olympia, WA. Publication Number 15-03-113. https://fortress.wa.gov/ecy/publications/SummaryPages/1503113.html Mathieu, C. and A. Bookter, 2013. Addendum 3 to Quality Assurance Project Plan: Depositional History of Mercury in Selected Washington Lakes Determined from Sediment Cores. Washington State Department of Ecology, Olympia, WA. Publication Number 13-03-119 Mathieu, C. and M. McCall, 2014. Addendum 4 to Quality Assurance Project Plan: Depositional History of Mercury in Selected Washington Lakes Determined from Sediment Cores. Washington State Department of Ecology, Olympia, WA. Publication Number 14-03-120. https://fortress.wa.gov/ecy/publications/SummaryPages/1403120.html Meredith, C., and C. Furl, 2008. Addendum #1 to Quality Assurance Project Plan: Depositional History of Mercury in Selected Washington Lakes Determined from Sediment Cores. Washington State Department of Ecology, Olympia, WA. Publication Number 06-03-113ADD1. https://fortress.wa.gov/ecy/publications/summarypages/0603113ADD1.html

QAPP: PBT Monitoring in Lake Sediment Cores Page 32 – September 2016
Peele, C., 2003. Washington State Mercury Chemical Action Plan. Washington State Department of Ecology, Olympia, WA. Publication Number 03-03-001. https://fortress.wa.gov/ecy/publications/summarypages/0303001.html Serdar, D., B. Lubliner, A. Johnson, and D. Norton, 2011. Spokane River PCB Source Assessment, 2003-2007. Washington State Department of Ecology, Olympia, WA. Publication Number 11-03-013. https://fortress.wa.gov/ecy/publications/SummaryPages/1103013.html Stuart, T., 2015. Deep Lake (Stevens County) Water Quality Monitoring Study. Washington State Department of Ecology, Olympia, WA. Publication Number 15-03-028. https://fortress.wa.gov/ecy/publications/SummaryPages/1503028.html Yake, W., 2001. The Use of Sediment Cores to Track Persistent Pollutants in Washington State: A Review. Washington State Department of Ecology, Olympia, WA. Publication Number 01-03-001. https://fortress.wa.gov/ecy/publications/SummaryPages/0103001.html
QAPP: PBT Monitoring in Lake Sediment Cores Page 33 – September 2016
16.0 Figures
The figures in this QAPP are inserted after they’re first mentioned in the text.
QAPP: PBT Monitoring in Lake Sediment Cores Page 34 – September 2016
17.0 Tables
The tables in this QAPP are inserted after they’re first mentioned in the text.

QAPP: PBT Monitoring in Lake Sediment Cores Page 35 – September 2016
18.0 Appendices

QAPP: PBT Monitoring in Lake Sediment Cores Page 36 – September 2016
Appendix A. Glossaries, Acronyms, and Abbreviations
Glossary of General Terms Ambient: Background or away from point sources of contamination. Surrounding environmental condition.
Anthropogenic: Human-caused.
Point source: Source of pollution that discharges at a specific location from pipes, outfalls, and conveyance channels to a surface water. Examples of point source discharges include municipal wastewater treatment plants, municipal stormwater systems, industrial waste treatment facilities, and construction sites where more than 5 acres of land have been cleared.
Sediment: Soil and organic matter that is covered with water (for example, river or lake bottom).
Stormwater: The portion of precipitation that does not naturally percolate into the ground or evaporate but instead runs off roads, pavement, and roofs during rainfall or snow melt. Stormwater can also come from hard or saturated grass surfaces such as lawns, pastures, playfields, and from gravel roads and parking lots.
Watershed: A drainage area or basin in which all land and water areas drain or flow toward a central collector such as a stream, river, or lake at a lower elevation.
Acronyms and Abbreviations Following are acronyms and abbreviations used frequently in this report. Ecology Washington State Department of Ecology e.g. For example EIM Environmental Information Management database EPA U.S. Environmental Protection Agency et al. And others LCS Laboratory Control Sample MEL Manchester Environmental Laboratory MQO Measurement quality objective PBT persistent, bioaccumulative, and toxic substance PCB polychlorinated biphenyls QA Quality assurance SOP Standard operating procedures TOC Total organic carbon WRIA Water Resource Inventory Area

QAPP: PBT Monitoring in Lake Sediment Cores Page 37 – September 2016
Units of Measurement °C degrees centigrade dw dry weight g gram, a unit of mass mg/Kg milligrams per kilogram (parts per million)
ng/g nanograms per gram (parts per billion) pg/g picograms per gram (parts per trillion) pCi/g picocuries per gram

QAPP: PBT Monitoring in Lake Sediment Cores Page 38 – September 2016
Quality Assurance Glossary Accreditation: A certification process for laboratories, designed to evaluate and document a lab’s ability to perform analytical methods and produce acceptable data. For Ecology, it is “Formal recognition by (Ecology)…that an environmental laboratory is capable of producing accurate analytical data.” [WAC 173-50-040] (Kammin, 2010) Accuracy: The degree to which a measured value agrees with the true value of the measured property. USEPA recommends that this term not be used, and that the terms precision and bias be used to convey the information associated with the term accuracy. (USGS, 1998) Analyte: An element, ion, compound, or chemical moiety (pH, alkalinity) which is to be determined. The definition can be expanded to include organisms, e.g., fecal coliform, Klebsiella. (Kammin, 2010) Bias: The difference between the population mean and the true value. Bias usually describes a systematic difference reproducible over time, and is characteristic of both the measurement system, and the analyte(s) being measured. Bias is a commonly used data quality indicator (DQI). (Kammin, 2010; Ecology, 2004) Blank: A synthetic sample, free of the analyte(s) of interest. For example, in water analysis, pure water is used for the blank. In chemical analysis, a blank is used to estimate the analytical response to all factors other than the analyte in the sample. In general, blanks are used to assess possible contamination or inadvertent introduction of analyte during various stages of the sampling and analytical process. (USGS, 1998) Calibration: The process of establishing the relationship between the response of a measurement system and the concentration of the parameter being measured. (Ecology, 2004) Check standard: A substance or reference material obtained from a source independent from the source of the calibration standard; used to assess bias for an analytical method. This is an obsolete term, and its use is highly discouraged. See Calibration Verification Standards, Lab Control Samples (LCS), Certified Reference Materials (CRM), and/or spiked blanks. These are all check standards, but should be referred to by their actual designator, e.g., CRM, LCS. (Kammin, 2010; Ecology, 2004) Comparability: The degree to which different methods, data sets and/or decisions agree or can be represented as similar; a data quality indicator. (USEPA, 1997) Completeness: The amount of valid data obtained from a project compared to the planned amount. Usually expressed as a percentage. A data quality indicator. (USEPA, 1997) Continuing Calibration Verification Standard (CCV): A QC sample analyzed with samples to check for acceptable bias in the measurement system. The CCV is usually a midpoint calibration standard that is re-run at an established frequency during the course of an analytical run. (Kammin, 2010)

QAPP: PBT Monitoring in Lake Sediment Cores Page 39 – September 2016
Control chart: A graphical representation of quality control results demonstrating the performance of an aspect of a measurement system. (Kammin, 2010; Ecology 2004) Control limits: Statistical warning and action limits calculated based on control charts. Warning limits are generally set at +/- 2 standard deviations from the mean, action limits at +/- 3 standard deviations from the mean. (Kammin, 2010) Data Integrity: A qualitative DQI that evaluates the extent to which a data set contains data that is misrepresented, falsified, or deliberately misleading. (Kammin, 2010) Data Quality Indicators (DQI): Commonly used measures of acceptability for environmental data. The principal DQIs are precision, bias, representativeness, comparability, completeness, sensitivity, and integrity. (USEPA, 2006) Data Quality Objectives (DQO): Qualitative and quantitative statements derived from systematic planning processes that clarify study objectives, define the appropriate type of data, and specify tolerable levels of potential decision errors that will be used as the basis for establishing the quality and quantity of data needed to support decisions. (USEPA, 2006) Data set: A grouping of samples organized by date, time, analyte, etc. (Kammin, 2010) Data validation: An analyte-specific and sample-specific process that extends the evaluation of data beyond data verification to determine the usability of a specific data set. It involves a detailed examination of the data package, using both professional judgment, and objective criteria, to determine whether the MQOs for precision, bias, and sensitivity have been met. It may also include an assessment of completeness, representativeness, comparability and integrity, as these criteria relate to the usability of the data set. Ecology considers four key criteria to determine if data validation has actually occurred. These are: • Use of raw or instrument data for evaluation. • Use of third-party assessors. • Data set is complex. • Use of EPA Functional Guidelines or equivalent for review. Examples of data types commonly validated would be: • Gas Chromatography (GC). • Gas Chromatography-Mass Spectrometry (GC-MS). • Inductively Coupled Plasma (ICP). The end result of a formal validation process is a determination of usability that assigns qualifiers to indicate usability status for every measurement result. These qualifiers include: • No qualifier, data is usable for intended purposes. • J (or a J variant), data is estimated, may be usable, may be biased high or low. • REJ, data is rejected, cannot be used for intended purposes (Kammin, 2010; Ecology, 2004).
QAPP: PBT Monitoring in Lake Sediment Cores Page 40 – September 2016
Data verification: Examination of a data set for errors or omissions, and assessment of the Data Quality Indicators related to that data set for compliance with acceptance criteria (MQOs). Verification is a detailed quality review of a data set. (Ecology, 2004) Detection limit (limit of detection): The concentration or amount of an analyte which can be determined to a specified level of certainty to be greater than zero. (Ecology, 2004) Duplicate samples: Two samples taken from and representative of the same population, and carried through and steps of the sampling and analytical procedures in an identical manner. Duplicate samples are used to assess variability of all method activities including sampling and analysis. (USEPA, 1997) Field blank: A blank used to obtain information on contamination introduced during sample collection, storage, and transport. (Ecology, 2004) Initial Calibration Verification Standard (ICV): A QC sample prepared independently of calibration standards and analyzed along with the samples to check for acceptable bias in the measurement system. The ICV is analyzed prior to the analysis of any samples. (Kammin, 2010) Laboratory Control Sample (LCS): A sample of known composition prepared using contaminant-free water or an inert solid that is spiked with analytes of interest at the midpoint of the calibration curve or at the level of concern. It is prepared and analyzed in the same batch of regular samples using the same sample preparation method, reagents, and analytical methods employed for regular samples. (USEPA, 1997) Matrix spike: A QC sample prepared by adding a known amount of the target analyte(s) to an aliquot of a sample to check for bias due to interference or matrix effects. (Ecology, 2004) Measurement Quality Objectives (MQOs): Performance or acceptance criteria for individual data quality indicators, usually including precision, bias, sensitivity, completeness, comparability, and representativeness. (USEPA, 2006) Measurement result: A value obtained by performing the procedure described in a method. (Ecology, 2004) Method: A formalized group of procedures and techniques for performing an activity (e.g., sampling, chemical analysis, data analysis), systematically presented in the order in which they are to be executed. (EPA, 1997) Method blank: A blank prepared to represent the sample matrix, prepared and analyzed with a batch of samples. A method blank will contain all reagents used in the preparation of a sample, and the same preparation process is used for the method blank and samples. (Ecology, 2004; Kammin, 2010) Method Detection Limit (MDL): This definition for detection was first formally advanced in 40CFR 136, October 26, 1984 edition. MDL is defined there as the minimum concentration of

QAPP: PBT Monitoring in Lake Sediment Cores Page 41 – September 2016
an analyte that, in a given matrix and with a specific method, has a 99% probability of being identified, and reported to be greater than zero. (Federal Register, October 26, 1984) Percent Relative Standard Deviation (%RSD): A statistic used to evaluate precision in environmental analysis. It is determined in the following manner:
%RSD = (100 * s)/x where s is the sample standard deviation and x is the mean of results from more than two replicate samples (Kammin, 2010) Parameter: A specified characteristic of a population or sample. Also, an analyte or grouping of analytes. Benzene and nitrate + nitrite are all “parameters.” (Kammin, 2010; Ecology, 2004) Population: The hypothetical set of all possible observations of the type being investigated. (Ecology, 2004) Precision: The extent of random variability among replicate measurements of the same property; a data quality indicator. (USGS, 1998) Quality Assurance (QA): A set of activities designed to establish and document the reliability and usability of measurement data. (Kammin, 2010) Quality Assurance Project Plan (QAPP): A document that describes the objectives of a project, and the processes and activities necessary to develop data that will support those objectives. (Kammin, 2010; Ecology, 2004) Quality Control (QC): The routine application of measurement and statistical procedures to assess the accuracy of measurement data. (Ecology, 2004) Relative Percent Difference (RPD): RPD is commonly used to evaluate precision. The following formula is used:
[Abs(a-b)/((a + b)/2)] * 100 where “Abs()” is absolute value and a and b are results for the two replicate samples. RPD can be used only with 2 values. Percent Relative Standard Deviation is (%RSD) is used if there are results for more than 2 replicate samples (Ecology, 2004). Replicate samples: Two or more samples taken from the environment at the same time and place, using the same protocols. Replicates are used to estimate the random variability of the material sampled. (USGS, 1998) Representativeness: The degree to which a sample reflects the population from which it is taken; a data quality indicator. (USGS, 1998) Sample (field): A portion of a population (environmental entity) that is measured and assumed to represent the entire population. (USGS, 1998) Sample (statistical): A finite part or subset of a statistical population. (USEPA, 1997)

QAPP: PBT Monitoring in Lake Sediment Cores Page 42 – September 2016
Sensitivity: In general, denotes the rate at which the analytical response (e.g., absorbance, volume, meter reading) varies with the concentration of the parameter being determined. In a specialized sense, it has the same meaning as the detection limit. (Ecology, 2004) Spiked blank: A specified amount of reagent blank fortified with a known mass of the target analyte(s); usually used to assess the recovery efficiency of the method. (USEPA, 1997) Spiked sample: A sample prepared by adding a known mass of target analyte(s) to a specified amount of matrix sample for which an independent estimate of target analyte(s) concentration is available. Spiked samples can be used to determine the effect of the matrix on a method’s recovery efficiency. (USEPA, 1997) Split sample: A discrete sample that is further subdivided into portions, usually duplicates. (Kammin, 2010) Standard Operating Procedure (SOP): A document which describes in detail a reproducible and repeatable organized activity. (Kammin, 2010) Surrogate: For environmental chemistry, a surrogate is a substance with properties similar to those of the target analyte(s). Surrogates are unlikely to be native to environmental samples. They are added to environmental samples for quality control purposes, to track extraction efficiency and/or measure analyte recovery. Deuterated organic compounds are examples of surrogates commonly used in organic compound analysis. (Kammin, 2010) Systematic planning: A step-wise process which develops a clear description of the goals and objectives of a project, and produces decisions on the type, quantity, and quality of data that will be needed to meet those goals and objectives. The DQO process is a specialized type of systematic planning. (USEPA, 2006) References for QA Glossary Ecology, 2004. Guidance for the Preparation of Quality Assurance Project Plans for Environmental Studies. https://fortress.wa.gov/ecy/publications/SummaryPages/0403030.html Kammin, B., 2010. Definition developed or extensively edited by William Kammin, 2010. Washington State Department of Ecology, Olympia, WA. USEPA, 1997. Glossary of Quality Assurance Terms and Related Acronyms. U.S. Environmental Protection Agency. http://www.ecy.wa.gov/programs/eap/quality.html USEPA, 2006. Guidance on Systematic Planning Using the Data Quality Objectives Process EPA QA/G-4. U.S. Environmental Protection Agency. http://www.epa.gov/quality/qs-docs/g4-final.pdf USGS, 1998. Principles and Practices for Quality Assurance and Quality Control. Open-File Report 98-636. U.S. Geological Survey. http://ma.water.usgs.gov/fhwa/products/ofr98-636.pdf