
Quality Assurance Project Plan for the 2009 Beach … · amsl above mean sea level ... GC/ECD gas...
84
UPPER COLUMBIA RIVER Quality Assurance Project Plan for the 2009 Beach Sediment Study Prepared for Teck American Incorporated P.O. Box 3087 Spokane, WA 99220-3087 Prepared by 7900 SE 28 th Street, Suite 410 Mercer Island, WA 98040 411 108 th Avenue NE, Suite 1800 Bellevue, WA 98004 in consultation with HydroQual, Inc. and Archaeological Investigations Northwest, Inc. March 2009
Transcript of Quality Assurance Project Plan for the 2009 Beach … · amsl above mean sea level ... GC/ECD gas...

UPPER COLUMBIA RIVER
Quality Assurance Project Plan for the
2009 Beach Sediment Study
Prepared for Teck American Incorporated
P.O. Box 3087 Spokane, WA 99220-3087
Prepared by
7900 SE 28th Street, Suite 410
Mercer Island, WA 98040
411 108th Avenue NE, Suite 1800 Bellevue, WA 98004
in consultation with
HydroQual, Inc. and
Archaeological Investigations Northwest, Inc.
March 2009
Upper Columbia River Quality Assurance Project Plan—Beach Sediment Study
SECTION A: PROJECT MANAGEMENT
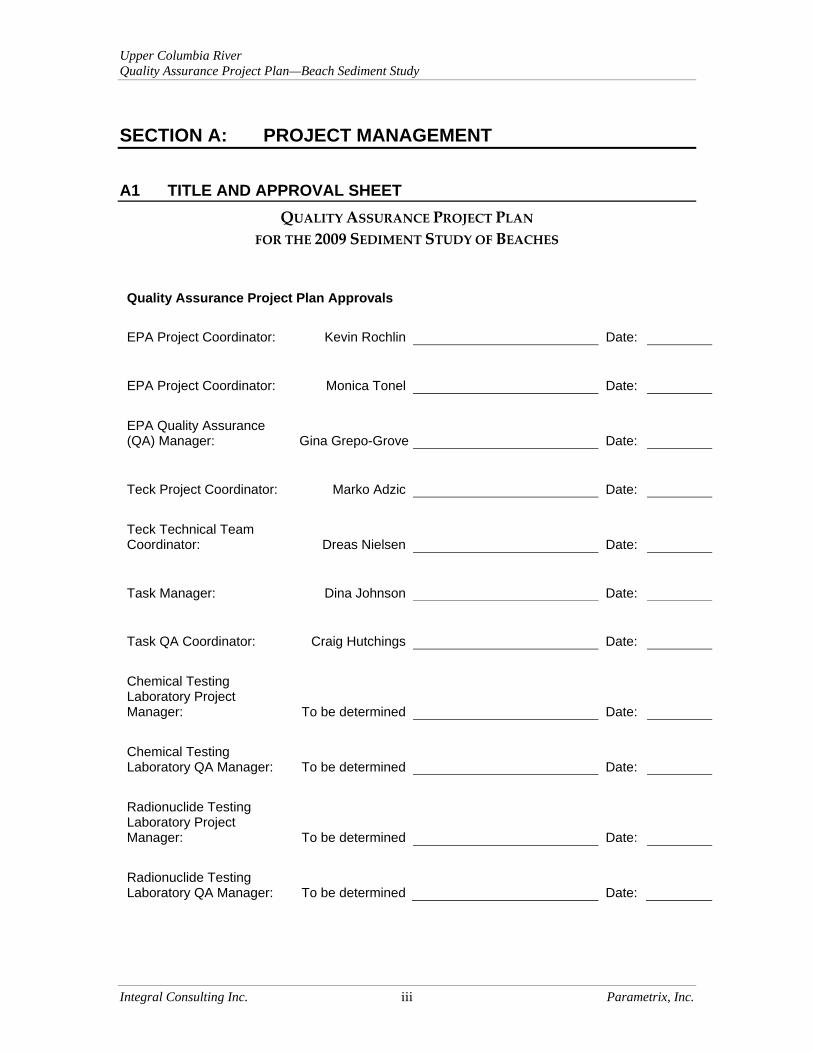
A1 TITLE AND APPROVAL SHEET QUALITY ASSURANCE PROJECT PLAN
FOR THE 2009 SEDIMENT STUDY OF BEACHES
Quality Assurance Project Plan Approvals
EPA Project Coordinator: Kevin Rochlin Date:
EPA Project Coordinator: Monica Tonel Date:
EPA Quality Assurance (QA) Manager: Gina Grepo-Grove Date:
Teck Project Coordinator: Marko Adzic Date:
Teck Technical Team Coordinator: Dreas Nielsen Date:
Task Manager: Dina Johnson Date:
Task QA Coordinator: Craig Hutchings Date:
Chemical Testing Laboratory Project Manager: To be determined Date:
Chemical Testing Laboratory QA Manager: To be determined Date:
Radionuclide Testing Laboratory Project Manager: To be determined Date:
Radionuclide Testing Laboratory QA Manager: To be determined Date:
Integral Consulting Inc. iii Parametrix, Inc.


Upper Columbia River Quality Assurance Project Plan—Beach Sediment Study
A2 TABLE OF CONTENTS
SECTION A: PROJECT MANAGEMENT ........................................................................... iii A1 TITLE AND APPROVAL SHEET .......................................................................... iii A2 TABLE OF CONTENTS ........................................................................................... v A3 DISTRIBUTION LIST ........................................................................................... xiii A4 INTRODUCTION AND TASK ORGANIZATION ....................................... A‐1
A4.1 Introduction .............................................................................................. A‐1 A4.2 Task Organization .................................................................................. A‐14
A5 PROBLEM DEFINITION AND BACKGROUND ........................................ A‐17 A6 TASK DESCRIPTION ........................................................................................ A‐17 A7 QUALITY OBJECTIVES AND CRITERIA FOR MEASUREMENT
DATA .................................................................................................................... A‐20 A7.1 The Data Quality Objective Process .................................................... A‐20 A7.2 Data Quality Indicators for Laboratories ............................................ A‐21
A8 SPECIAL TRAINING/CERTIFICATION ....................................................... A‐24 A9 DOCUMENTS AND RECORDS ...................................................................... A‐24
A9.1 Field Documentation ............................................................................. A‐25 A9.2 Laboratory Documentation .................................................................. A‐25 A9.3 Data Quality Documentation ............................................................... A‐26
SECTION B: DATA GENERATION AND ACQUISITION .......................................... B‐1 B1 SAMPLING DESIGN ............................................................................................ B‐1 B2 SAMPLING METHODS ....................................................................................... B‐2 B3 SAMPLE HANDLING AND CUSTODY .......................................................... B‐4 B4 ANALYTICAL METHODS .................................................................................. B‐4
B4.1 Chemical Analyses .................................................................................... B‐5 B4.2 Radionuclide Analyses ............................................................................. B‐9 B4.3 Bioaccessibility of Lead, Arsenic, and Other Metals ............................ B‐9
B5 QUALITY CONTROL ......................................................................................... B‐10 B5.1 Field Quality Control Samples .............................................................. B‐10 B5.2 Laboratory Quality Control ................................................................... B‐10
B6 INSTRUMENT/EQUIPMENT TESTING, INSPECTION, AND MAINTENANCE ................................................................................................. B‐11
B7 INSTRUMENT/EQUIPMENT CALIBRATION AND FREQUENCY ........ B‐11 B8 INSPECTION/ACCEPTANCE OF SUPPLIES AND CONSUMABLES .... B‐12 B9 NON‐DIRECT MEASUREMENTS ................................................................... B‐12
Integral Consulting Inc. v Parametrix, Inc.

Upper Columbia River Quality Assurance Project Plan—Beach Sediment Study
Integral Consulting Inc. vi Parametrix, Inc.
B10 DATA MANAGEMENT ..................................................................................... B‐12 B10.1 Field Data ................................................................................................. B‐13 B10.2 Laboratory Data ...................................................................................... B‐13
SECTION C: ASSESSMENT AND OVERSIGHT .......................................................... C‐1 C1 ASSESSMENTS AND RESPONSE ACTIONS ............................................... C‐1 C2 REPORTS TO MANAGEMENT ........................................................................ C‐2
SECTION D: DATA VALIDATION AND USABILITY ................................................ D‐1 D1 CRITERIA FOR DATA REVIEW, VERIFICATION, AND
VALIDATION ....................................................................................................... D‐1 D2 VERIFICATION AND VALIDATION METHODS ....................................... D‐2 D3 RECONCILIATION WITH USER REQUIREMENTS ................................... D‐2
SECTION E: REFERENCES .................................................................................................. E‐1
Appendices are provided on CD only.
Appendix A. Upper Columbia River RI/FS, Field Sampling Plan for the 2009 Beach Sediment Study
Appendix B. RI/FS Work Plan Comments Addressed in the Quality Assurance Project Plan for the Beach Sediment Study
Appendix C. Memoranda from Syracuse Research Corporation and E‐mail from EPA: “Phase II Beach Surface Sediment Data Quality Objectives and Sampling Design” (2008b, pers. comm.); “Phase II Beach Subsurface Sediment Sampling Design Recommendations” (Tonel 2008a, pers. comm.); and Follow‐up re: Sediment IVBA (Stifelman 2008, pers. comm.)
Appendix D. Cultural Resources Coordination Plan
Appendix D1. Sampling Specific Cultural Resources Information

Upper Columbia River Quality Assurance Project Plan—Beach Sediment Study
LIST OF FIGURES
Figure A‐1. Proposed 2009 Sampling Areas
Figure A‐2. EPA Phase I Beach, Transect, and Bioassay Sample Locations
Figure A‐3. Other Historical Beach Sample Locations
Figure A‐4. Organization Chart for the 2009 Beach Sediment Study for the UCR Site RI/FS
LIST OF TABLES
Table A‐1. Summary of the DQOs Developed for the 2009 Beach Sediment Study for the UCR Site RI/FS
Table A‐2. Summary of Beaches Selected for Inclusion in the Planned Study
Table A‐3. Task Team Contact Information
Table A‐4. Estimated Numbers of Site and Field QC Samples
Table A‐5. Laboratory Methods for Sediment Samples
Table A‐6. Size Fractions Included in Grain Size Analysis
Table A‐7. Analytes, Method Reporting Limits, and Human Health Screening Values for Beach Sediment Samples
Table A‐8. Measurement Quality Objectives
Table B‐1. Sample Containers, Preservation, and Holding Time Requirements for Sediment
Integral Consulting Inc. vii Parametrix, Inc.


Upper Columbia River Quality Assurance Project Plan—Beach Sediment Study
ACRONYMS AND ABBREVIATIONS
Agreement June 2, 2006, Settlement Agreement
amsl above mean sea level
ARARs applicable or relevant and appropriate requirements
CLP Contract Laboratory Program
COC chain‐of‐custody
COI chemical of interest
DOE U.S. Department of Energy
DQI data quality indicator
DQO data quality objective
EDD electronic data deliverable
EPA U.S. Environmental Protection Agency
FSP field sampling plan
GC/ECD gas chromatography/electron capture detector
GC/MS gas chromatography/mass spectrometry
HAZWOPER Hazardous Waste Operations and Emergency Response
HHRA human health risk assessment
HRGC/HRMS high‐resolution gas chromatography/high‐resolution mass spectrometry
ICP/MS inductively coupled plasma/mass spectrometry
IVBA in vitro bioaccessibility assay
Lake Roosevelt Franklin D. Roosevelt Lake
LCS laboratory control sample
MDL method detection limit
MQO measurement quality objective
MRL method reporting limit
NPL National Priorities List
PA/SI preliminary assessment and/or site inspection
PAH polycyclic aromatic hydrocarbon
Integral Consulting Inc. Parametrix, Inc. ix

Upper Columbia River Quality Assurance Project Plan—Beach Sediment Study
Integral Consulting Inc. Parametrix, Inc. x
PARCC precision, accuracy or bias, representativeness, completeness, and comparability
PBDE polybrominated diphenyl ether
PCB polychlorinated biphenyl
PRG preliminary remediation goal
PSEP Puget Sound Estuary Program
QA quality assurance
QA/QC quality assurance and quality control
QAPP quality assurance project plan
RI/FS remedial investigation and feasibility study
RBA relative bioavailability
RBC risk‐based concentration
RM river mile
RPD relative percent difference
SHSP site health and safety plan
SIM selective ion monitoring
Site Upper Columbia River site
SOP standard operating procedure
SRC Syracuse Research Corporation
SVOC semivolatile organic compound
TAL target analyte list
TCM Teck Cominco Metals Limited
Teck Teck American Incorporated
TOC total organic carbon
UCR Upper Columbia River
USGS U.S. Geological Survey

Upper Columbia River Quality Assurance Project Plan—Beach Sediment Study
UNITS OF MEASURE
°C degrees Celsius
cm centimeter(s)
ft foot (feet)
g gram(s)
in. inch(es)
m meter(s)
mg/kg milligram(s) per kilogram
mL milliliter(s)
mm millimeter(s)
μg microgram(s)
μL microliter(s)
μm micron(s)
Integral Consulting Inc. Parametrix, Inc. xi


Upper Columbia River Quality Assurance Project Plan—Beach Sediment Study
Integral Consulting Inc. Parametrix, Inc. xiii
A3 DISTRIBUTION LIST EPA Project Coordinator: Kevin Rochlin
EPA Project Coordinator: Monica Tonel
EPA QA Manager: Gina Grepo-Grove
Teck Project Coordinator: Marko Adzic
Teck Technical Team Coordinator: Dreas Nielsen
Task Manager: Dina Johnson
Task QA Coordinator: Craig Hutchings
Task Field Supervisor: To be determined
Database Administrator: Dreas Nielsen
Parametrix Project Manager David Mayfield
Chemical Testing Laboratory Project Manager:
To be determined
Chemical Testing Laboratory QA Manager: To be determined
Radionuclide Testing Laboratory Project Manager:
To be determined
Radionuclide Testing Laboratory QA Manager:
To be determined

Upper Columbia River Quality Assurance Project Plan—Beach Sediment Study
Integral Consulting Inc. A‐1 Parametrix, Inc.
A4 INTRODUCTION AND TASK ORGANIZATION
A4.1 Introduction This document presents the quality assurance project plan (QAPP) for the 2009 study of sediments at selected beaches subject to human use in the Upper Columbia River (UCR) (Site1). This study represents one of the tasks that will be completed as part of the remedial investigation and feasibility study (RI/FS) that is being conducted for the Site. The objective of the RI/FS is to investigate the nature and extent of contamination at the Site, assess risks to human health (to be completed by the U.S. Environmental Protection Agency [EPA]) and the environment (to be completed by Teck American Incorporated [Teck]), conduct analyses necessary to identify applicable or relevant and appropriate requirements (ARARs), and develop and evaluate potential remedial alternatives for the Site. It is anticipated that the RI/FS will be conducted in an iterative manner as detailed in the RI/FS work plan for the Site and following EPA’s data quality objectives (DQOs) process (USEPA 2006a).
This QAPP describes the organization, DQOs, study design, analytical procedures, and quality assurance and quality control (QA/QC) procedures upon which the 2009 sediment study of beaches will be based. This QAPP is focused on the study of 34 beaches along the UCR (Figure A‐1) that have been identified for sampling in 2009 based on the findings of the 2005 Phase I beach sampling effort by EPA, along with input from the community and other interested parties. All of the sampling locations selected are believed to represent areas that are important based on human use.
The immediate timeframe of interest for the collection of beach sediments is dictated primarily by the ease of sediment sample collection (i.e., it is easier to collect sediments when they are exposed than when they are covered by surface water). At full pool (1,290 ft above mean sea level [amsl]), the Franklin D. Roosevelt Lake (Lake Roosevelt) reservoir extends upstream of Grand Coulee Dam approximately 133 miles to Onion Creek (U.S. Geological Survey [USGS] River Mile [RM] 7302), approximately 15 river
1 The Site consists of the areal extent of hazardous substances contamination with in the United States in or adjacent to the Upper Columbia River, including Franklin D. Roosevelt Lake (Lake Roosevelt), from the U.S.-Canadian border downstream to the Grand Coulee Dam and all suitable areas in proximity to such contamination necessary for implementation of the response actions described in the Settlement Agreement (USEPA 2006d). 2 There is a discrepancy in river mile designations by U.S. Geological Survey (USGS) and by USEPA (2006c). USGS river miles increase from RM 680 to RM 682 over a less than 1 river mile segment when transitioning between the Inchelium and Rice USGS quadrants, whereas USEPA (2006c) river miles

Upper Columbia River Quality Assurance Project Plan—Beach Sediment Study
Integral Consulting Inc. A‐2 Parametrix, Inc.
miles south (downstream) of the U.S.‐Canadian border. However, constriction of the channel, with reduced conveyance, occurs through the Little Dalles (USGS RM 728) such that water levels upstream of this point may rise during high flow events (USCGS 1950).
The extent of water level increases is expected to be influenced by interactions between flow magnitude, reservoir pool level, and conveyance limitations through the Little Dalles. Thus, the portion of the UCR that is most influenced by the reservoir occurs below the Little Dalles. Below this point, the area of exposed sediments is greatest during the narrow window of low pool conditions that occurs in the April to May timeframe, due to drawdown of the reservoir in anticipation of the spring freshet. Of the 34 beaches selected for sampling, 29 of them occur below Little Dalles. The remaining five beaches occur above this point (in the portion of the UCR less influenced by reservoir conditions).
The field sampling plan (FSP) describes field sampling protocols that will be followed when sediment samples are collected; the FSP is presented as Appendix A to this QAPP. This format was adopted to provide an autonomous and concise document for use in the field during sample collection activities.
As described in the RI/FS work plan, concerns regarding historical discharges, such as ferrous granules (i.e., granular slag), a metal‐containing waste product, by Teck Cominco Metals Limited (TCM) into the Columbia River from the Trail facility in British Columbia, Canada, led EPA to select the Site for further study in 1999. Granular slag was discharged into the river at Trail from the early 1930s until 1995. As summarized in the RI/FS work plan, prior investigations conducted by state and federal agencies have identified elevated concentrations of a number of inorganic (i.e., metals/metalloids) and organic constituents within various environmental media of the Site from a wide range of potential sources. However, the Trail smelter was identified as the primary source of contamination. The 2009 beach sediment study was designed to ensure that the nature and extent of contamination in exposed beach surface and subsurface sediments is sufficiently well characterized to allow a reliable evaluation of potential risks to humans (including recreational use by nearby residents, subsistence users, and workers) who may be exposed via direct contact (ingestion and dermal). The planned study is intended to expand and augment information provided by these prior investigations, which include EPA’s Phase I investigation and other historical studies of exposed sediments along the UCR.
increase from RM 680 to RM 681 over the same segment. To remain consistent with international borders, the USGS river mile designations are used herein.
Upper Columbia River Quality Assurance Project Plan—Beach Sediment Study
While numerous exposed surface sediment samples are represented in these studies, as discussed in the draft human health risk assessment (HHRA) work plan for the UCR (USEPA 2008b), data on the concentrations of chemicals of interest (COIs) from subsurface sediment samples from beaches and shorelines along the UCR are extremely limited. There are only two samples (one from the flats near Haag Cove and one from Marcus Flats near Pingston Creek) that provide information on subsurface sediments (18–24 in.) from UCR beaches. These samples were collected in spring 2001 as part of the EPA expanded site inspection (USEPA 2003) and were analyzed for metals, pesticides, polychlorinated biphenyls (PCBs; as Aroclors), grain size, and total organic carbon (TOC). Pesticides and PCBs (as Aroclors) were not detected in either subsurface sample. Collocated surface (0–6 in.) sediment data are available only for the sample from Haag Cove. A comparison of the concentrations in the surface sample to the subsurface sample at this location shows that the surface sediment tended to have higher metals concentrations than the subsurface sediment.
A brief summary of each of these prior investigations, primarily focused on exposed surface sediments, is presented below.
A4.1.1 The EPA Phase I Sediment Sampling Investigation Phase I of the RI/FS for the Site was conducted by EPA in 2005. The EPA Phase I sediment sampling investigation included collection of surface sediments at identified beaches, along transects, and in conjunction with bioassay samples. Figure A‐2 shows the locations of EPA’s Phase I beach surface sediment samples as well as locations of other Phase I surface sediment samples (i.e., selected transect and bioassay samples) collected along the UCR at locations above the approximate 2005 low pool elevation level, 1,250 ft amsl. These transect and bioassay samples, along with the Phase I beach samples, augment our understanding of the spatial distribution of chemical constituents in surface sediments at locations along the UCR where human beach use may occur. A summary of the 2005 sampling events for each of these types of sediment data is provided below.
Summary of the 2005 Beach Sampling Event During the 2005 beach sampling event, surface sediments (surface to a depth of 10–15 cm) were sampled at 15 beaches distributed throughout the UCR (Figure A‐2). Those beaches were selected for evaluation because they were considered representative of popular recreational areas in the UCR, based on comments from the Confederated Tribes of the Colville Reservation, the Spokane Tribe of Indians, the National Park Service, and the Washington State Department of Ecology (Ecology) and Department of
Integral Consulting Inc. A‐3 Parametrix, Inc.

Upper Columbia River Quality Assurance Project Plan—Beach Sediment Study
Integral Consulting Inc. A‐4 Parametrix, Inc.
Health (USEPA 2006c). In addition, they were spatially distributed throughout the UCR to identify potential longitudinal trends within the Site.
EPA used a balanced sampling design at all 15 beaches (USEPA 2006b). At each beach, three transects were established perpendicular to the shoreline, and three discrete sediment samples were collected on each transect at target elevations of approximately 1,285, 1,270, and 1,255 ft amsl. In some cases, station locations were adjusted in response to site‐specific conditions. A total of 135 stations were therefore sampled by EPA in 2005 (USEPA 2006b). At all but three beaches (i.e., Northport City Boat Launch, Kettle Falls Swim Beach, and Columbia Campground), sediment samples collected within each elevation were composited in the field, such that a single sample was submitted for laboratory analysis at each elevation (i.e., resulting in a total of three sediment samples being evaluated for 12 of the 15 beaches). At the aforementioned three beaches, sediments collected at each station were analyzed as discrete samples to provide an indication of the spatial variability of contaminant concentrations.
The analytical results for the 15 beaches sampled in 2005 are summarized in EPA’s screening level risk assessment (USEPA 2006c). Based on the 2005 sampling results, the highest metals concentrations were found at the three most upstream beaches located between RM 729 and RM 745 (i.e., Black Sand Beach, Northport Boat City Launch, and Dalles Orchard), with concentrations generally decreasing as a function of river mile at the remaining beaches. Overall, these results agreed closely with historical beach data collected in 2001 by Majewski et al. (USGS 2003).
In general, organic contaminant concentrations in the 2005 beach sediment samples were infrequently detected and those detected concentrations were well below human health‐based risk standards (USEPA 2006c) as discussed below.
In response to public concerns about the safety of recreational use of UCR beaches, EPA completed a screening level risk assessment for sediment exposure from limited recreational use at the 15 beaches sampled by EPA in 2005 (USEPA 2006b). For each beach, the maximum concentrations of all of the inorganic and organic constituents EPA analyzed were compared with generic residential preliminary remediation goals (PRGs) developed by EPA Region 9 (Smucker 2004). None of the organic constituents exceeded the residential PRGs. The maximum concentration exceeded the residential PRG at least once for the following seven constituents: antimony, arsenic, copper, iron, lead, manganese, and uranium.3 Each of these seven constituents was then further evaluated
3 As elemental uranium.

Upper Columbia River Quality Assurance Project Plan—Beach Sediment Study
against recreational PRGs developed by EPA as part of the screening level risk assessment (USEPA 2006c). Based on these evaluations, USEPA (2006c) concluded: “Twelve of the fifteen beaches are safely below health‐based risk standards for all the contaminants for which EPA tested, including arsenic, lead, pesticides, and PCBs. At three beaches (Black Sand Beach, Northport Boat Launch, and Dalles Orchard), EPA found levels of arsenic and/or lead that were slightly above EPA screening levels, but those beaches remain safe for seasonal recreation as well.”
Summary of the 2005 Transect and Bioassay Sampling Events EPA’s Phase I transect surface sediment samples were collected along regularly spaced interval lines (i.e., transects) laid out perpendicular to a line drawn upstream‐to‐downstream through the middle of the river. Between the U.S.‐Canadian border and RM 720, transect samples were generally collected along transects spaced at 1‐mile intervals. Between RM 720 and Grand Coulee Dam, transect samples were generally collected along transects spaced at 3‐mile intervals. Some sample locations were moved upstream or downstream from the planned transect to accommodate site‐specific sediment conditions encountered at the time of sampling.
A minimum of three samples were typically collected along each transect: a sample near each opposing river bank, and a sample near the center of the original pre‐dam river channel. At selected transects (RM 605, RM 633, RM 637, RM 642, RM 661, RM 678, RM 692, RM 706, RM 715, RM 723, RM 732, and RM 742), up to six additional samples were collected in different positions across the channel to further assess transverse sediment variability.
EPA’s Phase I bioassay surface sediment samples were collected for bioassay testing to evaluate potential toxicity of the constituents to aquatic organisms and to allow correlation of contaminant concentrations and sediment toxicity. Most of the 50 bioassay samples were collocated with the transect samples. Those that were not collocated with the transects were collected from RM 642, RM 700, and RM 735 at elevations of 1,263.74, 1,274, and 1,276.99 ft amsl, respectively. In addition, bioassay results were run for six reference areas in tributaries of the Columbia River.
A4.1.2 Summary of Other Historical “Beach” Sediment Investigations In addition to the EPA Phase I data, several historical studies of exposed sediments along the UCR are also available for use in evaluating constituent distributions in beach sediments to which potential human exposures may occur. Figure A‐3 shows the locations of these historical study samples.
Integral Consulting Inc. A‐5 Parametrix, Inc.

Upper Columbia River Quality Assurance Project Plan—Beach Sediment Study
Integral Consulting Inc. A‐6 Parametrix, Inc.
Criteria for inclusion of surface sediment data reported in these investigations were developed in collaboration with EPA and their human health risk assessment contractor, Syracuse Research Corporation (SRC), following the January 2008 UCR workshop. Surface samples represented on Figure A‐3 satisfy the following agreed upon criteria:
• Samples are of acceptable quality to be used during the remedial investigation process as outlined in the RI/FS work plan historical data quality review process
• Samples were collected as exposed surface sediments (i.e., from an approximate 0–6 in. [0–15 cm] depth range that was not submerged beneath several feet of water at the time of sampling)
• Samples were collected from locations representative of potential beach exposures along the main stem of the UCR (i.e., not along tributaries to the UCR)
• Samples were analyzed as bulk/coarse sediment samples or sieved for analysis of the < 2 mm size fraction (i.e., do not include fine fraction analyses)
• Samples were collected after 1995, coinciding with the operational changes that occurred at the Trail smelter around that same year
• Samples were not collected by the petit ponar sampling method4.
With the exception of depth range,5 similar criteria also apply to historical subsurface sediment samples represented in Figure A‐3. However, as discussed previously, subsurface sediment data for COIs at UCR beaches and shorelines are extremely limited. Therefore, the brief summary of each historical investigation provided below and represented in Figure A‐3 focuses primarily on exposed surface sediment.
EPA Stevens County Mines and Mills Preliminary Assessments and Site Inspections (E&E 2002) EPA conducted CERCLA preliminary assessments and/or site inspections (PAs/SIs) at 39 mine and mill sites in Stevens County, to determine which sites, if any, qualified for listing on the National Priorities List (NPL), and to establish priorities for additional action, if warranted. Most samples for this investigation were collected from upland 4 EPA’s expanded site inspection (USEPA 2003) reported surface sediment samples collected by petit ponar or spoon and bowl methods. Based on input provided by EPA and SRC, only the surface sediment samples collected via the latter method were considered suitable for use in evaluating historical beach sediment data. 5 Exposed subsurface sediments were collected from an approximate 0–30 in. (0–75 cm) depth range that was not submerged beneath several feet of water at the time of sampling.

Upper Columbia River Quality Assurance Project Plan—Beach Sediment Study
Integral Consulting Inc. A‐7 Parametrix, Inc.
sites in Stevens County; however, nine sediment samples from this investigation met the criteria for inclusion in the beach sediment data set. These samples were collected in June 2001 from “slag areas” along the Columbia River as part of the PA/SI of the Le Roi/Northport smelter site in Northport, Washington, using dedicated plastic bowls and spoons/scoops (E&E 2002). Target analyte list (TAL) metals6 analysis was performed by an EPA Contract Laboratory Program (CLP) laboratory (E&E 2002).
EPA Expanded Site Inspection (USEPA 2003) This study was conducted by EPA to provide information for determining whether the UCR should be included on the NPL, and to establish priorities for additional action, if warranted. Sampling was conducted in May and June 2001. Surface sediments (surface to depth of 2–20 cm) were sampled at 49 stations in the upper and middle portions of the UCR from the U.S.‐Canadian border to USGS RM 675 near Inchelium. In general, sample locations that were exposed at the time of sampling were screened at approximately three locations for metals content using a portable x‐ray fluorescence analyzer prior to sample collection, and the location showing the highest concentrations was sampled. Twenty‐nine samples from this investigation met the criteria for inclusion in the beach surface sediment data set. These samples were collected from locations between RM 686 to RM 744, using stainless steel bowls and spoons. TAL metals analysis was performed by an EPA CLP laboratory.
In addition, as described previously, two subsurface samples from this study also met criteria for inclusion in the beach sediment data set. These samples were analyzed for metals, pesticides, PCBs (as Aroclors), grain size, and TOC and provide information on subsurface sediments at two beach locations along the UCR: at the flats near Haag Cove and at Marcus Flats near Pingston Creek.
Cox et al. (2005) Study This study was conducted by researchers from USGS to evaluate the vertical distributions of metals in sediments throughout the UCR, to determine the potential for remobilization of trace elements in buried sediment, and to assess sediment for the occurrence of slag (Cox et al. 2005). Sampling was conducted in September 2002. Submerged sediment cores were sampled at five stations from USGS RM 705 to RM 624 and at one station in the Spokane River, and additional sediment samples with identifiable slag content were collected at three sites. One surface sediment sample from
6 TAL metals consist of aluminum, antimony, arsenic, barium, beryllium, cadmium, calcium, chromium, cobalt, copper, iron, lead, magnesium, manganese, mercury, nickel, potassium, selenium, silver, sodium, thallium, vanadium, and zinc.
Upper Columbia River Quality Assurance Project Plan—Beach Sediment Study
this investigation met the criteria for inclusion in the beach sediment data set. This sample was collected at RM 743 from a sand bar deposit immediately adjacent to the Columbia River (Cox et al. 2005). The method used to collect this sample is uncertain based on the information provided. The sample was freeze‐dried and submitted to the USGS laboratory in Denver, Colorado, for elemental analysis (Cox et al. 2005).
Washington State Department of Ecology Field Reconnaissance and Sediment Sampling Report (Ecology 2007) Ecology conducted a 1‐day reconnaissance of the UCR during a period of maximum drawdown (May 2007) in order to observe sediment depositional patterns and collect a limited number of exposed, near‐shore bank and beach samples. In all, 10 surface sediment samples from eight stations were collected between RM 700 and RM 737. The samples from each station generally consisted of composites of five discrete samples, collected from the surface to depths up to 6 in., from five locations within a 10‐ft radius. The samples were collected using a stainless steel spoon. Following collection, the composite samples were sieved, and the < 2 mm fractions of all samples were submitted to Ecology’s Manchester Laboratory for metals (arsenic, cadmium, copper, lead, and zinc) analysis. All but one of the samples from this investigation met the criteria for inclusion in the beach sediment data set.
A4.1.3 Overview of the 2009 Beach Sediment Study In keeping with the iterative nature of the RI/FS for the UCR, the 2009 beach sediment study described in this QAPP and associated FSP were designed to expand and augment the information on UCR beach sediment provided by the prior investigations summarized above. Comments received on the RI/FS work plan that pertain to beach sediment exposures by people are also addressed in this QAPP and summarized in Appendix B. The following sections provide an overview of the 2009 sediment study.
The primary objective of the 2009 beach sediment study is to collect additional sediment data that will allow reliable characterization of risks to humans who are exposed to beach sediments at UCR beach and shoreline areas. EPA’s DQO process (USEPA 2006a) as well as information provided by EPA in memoranda by SRC regarding “Phase II Beach Surface Sediment Data Quality Objectives and Sampling Design” (Tonel 2008a, pers. comm.) and “Phase II Beach Subsurface Sediment Sampling Design Recommendations” (Tonel 2008b, pers. comm.) were used to guide the requirements and design rationale for data collection activities presented in this QAPP and associated FSP. A summary of the output from this DQO process is provided in Table A‐1, and detailed discussions of the various study components are presented in subsequent
Integral Consulting Inc. A‐8 Parametrix, Inc.

Upper Columbia River Quality Assurance Project Plan—Beach Sediment Study
Integral Consulting Inc. A‐9 Parametrix, Inc.
sections of this QAPP and associated FSP. The EPA memoranda are also included as Appendix C to this QAPP.
Although the primary objective of the 2009 beach sediment study will be to support the HHRA, the beach sampling results may be used to inform the ecological risk assessment and nature and extent evaluations as secondary data. For example, the biologically active zone of the sediments (i.e., 0–15 cm) will be characterized, and detection limits will be sufficiently low to allow comparison with available soil and sediment quality guidelines. However, the complete set of data needs for the ecological risk assessment will be developed based on the screening level risk assessment and ecological risk assessment work plan that are also being developed as part of the RI/FS. Similarly, additional bulk samples will be collected during the 2009 beach sediment study and archived for later analysis (e.g., particle density [including specific gravity] and percent granular slag composition), as needed to support evaluation of potential remedial alternatives. A subset of archived surface sediment samples will also be submitted for analysis of two radionuclides, uranium‐238 and radium‐226, due to concerns expressed by EPA regarding potential for exposures to radionuclides associated with elemental uranium and analytical data quality issues for elemental uranium that were encountered during Phase I sediment investigations. The results of these initial analyses7 will be used by EPA and Teck to assess the need for radionuclide analysis of the remaining archived beach surface and subsurface sediment samples.
Collectively, the 2009 beach sediment study will address 34 beaches that are believed to represent areas that are important based on human use. Some of these beaches have been identified on the basis of the findings from the 2005 Phase I beach sampling effort by EPA as presented in the screening level risk assessment for sediment exposure from limited recreational use (USEPA 2006c). For example, at Black Sand Beach, Northport Beach, and Dalles Orchard, sediment concentrations of arsenic and/or lead exceeded EPA screening levels for recreational use based on the 2005 sample data (photographs of these beaches are presented in Appendix A, Attachment A6). Additional data collection at these beaches is necessary to ensure that reliable and representative measurements of the levels of chemical contaminants present in exposed sediments at beaches and shorelines along the UCR are available to support EPA’s baseline HHRA.
7 One surface sediment composite from each of the following beaches will be selected randomly and included in the initial radionuclide analyses: Black Sand Beach, Northport Beach, Dalles Orchard, Snag Cove, Kettle Falls Marina, AA Campground 2, Wilmont Creek, Seven Bays, and Spring Canyon. These beaches were selected to represent the spatial distribution of beaches included along the UCR and to augment existing uranium data collected at beaches as part of EPA’s Phase I investigation.

Upper Columbia River Quality Assurance Project Plan—Beach Sediment Study
Integral Consulting Inc. A‐10 Parametrix, Inc.
During public meetings on the results of EPA’s screening level risk assessment (USEPA 2006c), additional priorities with regard to future sampling were identified:
EPA recognizes that perhaps the greatest uncertainty was caused [by] limiting the sampling to 15 locations. During public meetings held in June 2006, EPA learned that the Agency did not include two popular beaches, namely Bradbury Beach and Colville Flats. Sampling at these locations will be recommended during the next phase of field work. Sampling at additional beaches in the vicinity of Dalles Orchard, Northport, and “Black Sand” beaches will also be considered.
Accordingly, Bradbury Beach, Colville Flats, and the Upper Columbia R.V. Park, which is located between Black Sand Beach and Northport Beach, are included in the planned beach sediment study in response to input from the community.
In addition to the six beaches noted above, several other beaches were identified by other interested parties for inclusion in the 2009 beach sediment study. Table A‐2 provides a summary of all 34 beaches selected for inclusion in this study and the basis for inclusion of each. During development of this quality assurance project plan, the Teck technical team contacted representatives from each interested party listed in the “Identified By” column of Table A‐2 to verify the approximate upstream and downstream boundaries for each beach included in the 2009 beach sediment study. A web‐based meeting tool (GoToMeeting™) was used in conjunction with geographic information system viewing software to facilitate this verification process. The location of each of these 34 beaches is shown on Figure A‐1.
Surface Sediment Study Overview For each of the 34 beaches sampled, five composites of surface sediment (0–6 in. [0–15 cm]) samples will be collected. Each composite sample will contain subsamples from 12 unique sampling locations at each beach. Grain size distribution analysis will be conducted on the whole sediment sample. Other conventional analyses (i.e., pH, TOC, percent moisture, and total sulfides), as well as TAL metals/metalloids8 and elemental uranium analyses will be conducted on the sieved (< 2 mm) fraction only. Sample sieving will be conducted by the laboratory. A subsample from each of these sieved composite samples will also be archived by the laboratory for possible future analysis of
8 TAL metals/metalloids specified by EPA (Tonel 2008b, pers. comm.) for this study include aluminum, antimony, arsenic, barium, beryllium, cadmium, calcium, chromium, cobalt, copper, iron, lead, magnesium, manganese, mercury, nickel, potassium, selenium, silver, sodium, thallium, vanadium, and zinc.

Upper Columbia River Quality Assurance Project Plan—Beach Sediment Study
Integral Consulting Inc. A‐11 Parametrix, Inc.
uranium‐238 and radium‐226. Initially, a subset of these archived samples will be analyzed for these radionuclides.9 The results of these initial analyses will be used by EPA and Teck to assess the need for radionuclide analysis of the remaining archived beach surface sediment samples.
TAL metals/metalloids and elemental uranium analyses will also be conducted on four sieve size fractions (2 mm to 250 μm, 250 μm to 125 μm, 125 μm to 63 μm, and < 63 μm) of the sediments in a split of one of the composite surface sediment samples per beach. The selection of these size‐fractioning cut‐offs is based on EPA’s professional judgment (Tonel 2008a, pers. comm.). Specifically, EPA (Tonel 2008a, pers. comm.) states:
In other EPA regions, when evaluating human health risks from soil ingestion, a 250 μm (60 mesh) sieve is used to separate coarse particles from fine particles. Because adhering soil is mostly composed of particles less than 125 μm (Choate et al. 2006), finer sediments will be sieved using a 125 μm (115 mesh) sieve. At the UCR Site, it will also be useful to separate the fine fraction even further using a 63 μm (250 mesh) sieve. According to Majewski et al. (2003), sediment particles less than 63 μm are expected to be representative of airborne dusts generated during ambient and high‐wind conditions. In addition, STI (2006) states that sediment particles less than 63 μm are representative of the size fraction most likely to be incidentally ingested by Tribal members.”
Although USEPA (2006b) also evaluated the fine‐grained fraction of sediments at three beaches sampled in 2005 (i.e., Northport City Boat Launch, Kettle Falls Swim Beach, and Columbia Campground), the fine‐grained fraction was defined as particles smaller than 75 μm. USEPA (2006b) noted that the critical values they used to characterize various particle‐size fractions differed from the Wentworth scale due to “soil testing laboratory considerations.” The authors concluded that the deviation was minor and did not significantly affect the overall assessment, interpretation, and comparability of the sediment data collected in 2005. Therefore, use of 63 μm to define fine‐grained sediment
9 One surface sediment composite from each of the following beaches will be selected randomly and included in the initial radionuclide analyses: Black Sand Beach, Northport Beach, Dalles Orchard, Snag Cove, Kettle Falls Marina, AA Campground 2, Wilmont Creek, Seven Bays, and Spring Canyon. These beaches were selected to represent the spatial distribution of beaches included along the UCR and to augment existing uranium data collected at beaches as part of EPA’s Phase I investigation.

Upper Columbia River Quality Assurance Project Plan—Beach Sediment Study
Integral Consulting Inc. A‐12 Parametrix, Inc.
during the 2009 beach sediment study will be consistent with Majewski et al. (2003) and will provide data comparable to those generated by EPA in 2005.
In addition to the analyses described above, sieved (< 2 mm) sediments in a split of one composite surface sediment sample per beach will also be submitted to a specialty laboratory for in vitro bioaccessibility assays (IVBAs) for arsenic, lead, and other metals10 on the following size fractions: < 250 μm, 250 μm to 125 μm, 125 μm to 63 μm, and < 63 μm. IVBA data provide a quantitative measurement of chemical’s relative bioavailability (RBA) in a particular medium and may vary with grain size. Tonel (2008a, pers. comm.) provides the following rationale for IVBA testing of surface sediments from the 2009 beach sediment study:
In the HHRA Workplan, when evaluating ingestion exposures of metals from sediment, the RBA was set equal to default values (i.e., 0.8 for arsenic, 0.6 for lead, and 1.0 for all other metals) (USEPA 1994; USEPA 2000). However, it is considered likely that the absorption of metals from sediment may not be as high as from food or water, so this approach will often tend to overestimate risks from incidental ingestion of sediment. Therefore, it would be desirable to have reliable site‐specific RBA data for metals in sediment in order to support adjusting the toxicity factors for the baseline HHRA.
As previously mentioned, organic contaminant concentrations in the 2005 beach surface sediment samples were infrequently detected and those detected concentrations were well below generic residential health‐based risk standards applied by USEPA (USEPA 2006c). More recently, however, EPA has conducted additional screening of these data against risk‐based screening values developed based on reasonable maximum exposure parameters for a population with the greatest potential for contact with sediments (i.e., a traditional subsistence scenario) (Tonel 2008a, pers. comm.). Based on this evaluation, EPA intends to include dioxins/furans in surface sediment for further assessment in the HHRA and will use existing Phase I data for this assessment. Thus, analysis of the 2009 beach surface sediment samples for organic contaminant concentrations is not proposed.
10 IVBA results for metals other than lead and arsenic at the UCR site are not intended to be used to estimate relative bioavailability for these metals. Rather, as stated by EPA (Stifelman 2008, pers. comm.), “…application of the IVBA assay at the UCR site to other metals would yield information about the magnitude and spatial variability of acid solubility of these metals and about correlations in acid solubility among metals. This information may be valuable for assessing nature and extent of contamination.”

Upper Columbia River Quality Assurance Project Plan—Beach Sediment Study
In addition to the aforementioned chemical parameters, additional bulk surface sediment samples will be collected and archived for possible later analysis (e.g., particle density [i.e., specific gravity], and percent granular slag composition.
Subsurface Sediment Study Overview For 33 of the 34 beaches sampled, subsurface sediment core samples (i.e., 0–30 in.; 0–75 cm or to refusal) will be collected at five different randomly selected locations. The collection from five locations per beach will allow for exposures in EPA’s baseline HHRA to be calculated on a beach‐specific basis (Tonel 2008b, pers. comm.). Based on review of subsurface sediment results, additional sampling may be required if the variability in the subsurface sediment data set is higher than the variability observed in the surface sediment data set and subsurface sediment concentrations approach a level of potential concern for exposures by people. The maximum depth of 30 in. (75 cm; or to refusal) is based on EPA’s professional judgment (Tonel 2008b, pers. comm.) and “assumes that human receptor populations of interest (e.g., recreational, occupational, subsistence) are most likely to be exposed to sediments no deeper than 30 inches under typical exposure scenarios (e.g., without heavy excavation equipment).” Three depth intervals from each core will be analyzed: 0–6 in. (0–15 cm), 6−18 in. (15–45 cm), and 18–30 in. (45–75 cm). As specified by EPA (Tonel 2008b, pers. comm.), “[t]he three depth strata cut‐offs are also based on professional judgment to represent potential differences in exposure scenarios. For example, recreational scenarios (e.g., child playing in beach sand) may occur at maximum depth of 18 inches, while occupational scenarios (e.g., digging associated with archaeological or maintenance activities) may encounter a depth of 30 inches.”
Each depth stratum at each location (i.e., 15 discrete samples) will be submitted to the laboratory for sieving to < 2 mm and the analysis of TAL metals/metalloids (Tonel 2008b, pers. comm.). To address sample mass requirements, a single composite sample of each depth stratum from each of the five locations will be collected from each beach (i.e., three composite samples; one per depth interval). The composite sample will be divided into two components: 1) the whole sediment that will be analyzed for grain size distribution, and 2) a sieved < 2 mm size fraction of the sample that will be analyzed for conventional parameters (e.g., pH, TOC, percent moisture, and total sulfides), elemental uranium, and organic compounds (pesticides, semivolatile organic compounds [SVOCs], polycyclic aromatic hydrocarbons [PAHs], and PCBs (as Aroclors). PCB congeners, dioxins and furans, and polybrominated diphenyl ethers [PBDEs] in the
Integral Consulting Inc. A‐13 Parametrix, Inc.

Upper Columbia River Quality Assurance Project Plan—Beach Sediment Study
Integral Consulting Inc. A‐14 Parametrix, Inc.
< 2 mm size fraction will be analyzed only in depth strata composites where TOC is greater than 1 percent.
In addition to the aforementioned chemical parameters, a portion of the depth strata composite samples (sieved < 2 mm fraction) will be archived for possible later analysis of two radionuclides, uranium‐238 and radium‐226. 11
A4.2 Task Organization This section presents the organizational structure for activities associated with the 2009 beach sediment study, including task management and oversight, fieldwork, sample analysis, and data management. Teck and its technical team are conducting this work with oversight from EPA. The overall organizational structure for the project is provided in the RI/FS work plan, which also includes qualifications of Teck technical team members. For this task, the Teck technical team organizational structure and its relationship to the overall project organization is illustrated in Figure A‐4. Contact information for Teck technical team task members is provided in Table A‐3.
Task responsibilities include the following roles:
• EPA and Teck project coordinators
• EPA quality assurance (QA) manager
• Teck technical team task manager
• Teck technical team task field supervisor
• Teck technical team task QA coordinator
• Teck technical team task laboratory coordinator
• Teck technical team database administrator
• Teck technical team task reviewers
• Project manager and QA manager for each subcontractor laboratory.
Responsibilities associated with these roles are described below.
A4.2.1 EPA Organization and Responsibilities EPA will oversee all Teck activities associated with the 2009 beach sediment study and will coordinate all U.S. Department of the Interior, state, and Tribal input with respect to the review of technical and decision documents prepared and submitted by Teck. The 11 The results of the initial analyses of these radionuclides in randomly selected surface sediment composites will be used by EPA and TCAI to assess the need for radionuclide analysis of these archived subsurface sediment composites.

Upper Columbia River Quality Assurance Project Plan—Beach Sediment Study
project coordinators for EPA are Kevin Rochlin and Monica Tonel. The EPA QA manager will be Gina Grepo‐Grove.
A4.2.2 Teck Organization and Responsibilities With the support of its technical team, Teck is responsible for conducting this 2009 beach sediment study with oversight provided by EPA. Marko Adzic will serve as Teck’s project coordinator and will have the primary responsibility for ensuring that Teck meets all the requirements and associated deliverables specified within the June 2, 2006, Settlement Agreement (Agreement) (USEPA 2006d). Mr. Adzic will also be responsible for overseeing all technical aspects of this task, coordinating with EPA, and managing the overall task schedule. Assisting Mr. Adzic in coordinating efforts of the technical team, ensuring that internal deadlines and milestones are met, and overall task budget tracking is Kris McCaig of Teck.
A4.2.3 Key Task Personnel Teck technical team personnel involved in the 2009 beach sediment study and their respective responsibilities are identified below.
Task Manager—Dina Johnson is the task manager and is responsible for overseeing the 2009 beach sediment study. Ms. Johnson will work closely with the senior technical advisor, technical reviewers, field supervisor, and the task QA coordinator to ensure that the objectives of the study are achieved.
Task Field Supervisor—The task field supervisor (to be determined) and is responsible for overseeing the planning and coordination of the sediment sampling efforts and for all aspects of sample collection activities to ensure that appropriate sampling, QA, and documentation procedures are used. In the event that changes in the QAPP or FSP are needed, the task field supervisor will ensure that proposed changes are coordinated with EPA’s project coordinators or other designated EPA staff according to the established lines of communication between the Teck technical team, Teck, and EPA as noted in Figure A‐4 and approved for the RI/FS.
Task QA Coordinator—Craig Hutchings is the task QA coordinator and is responsible for providing overall QA support for the 2009 beach sediment study; producing this QAPP; ensuring that the QAPP and FSP contain all components necessary to meet EPA guidelines (USEPA 2002a); coordinating the validation of laboratory data; communicating data quality issues to the data users; and working with data users and EPA to address any data limitations. Mr. Hutchings will report directly to the task
Integral Consulting Inc. A‐15 Parametrix, Inc.

Upper Columbia River Quality Assurance Project Plan—Beach Sediment Study
manager, and will work closely with the laboratory coordinator and the field supervisor to ensure that the objectives of the QAPP are met.
Task Laboratory Coordinator—The task laboratory coordinator (to be determined) is responsible for ensuring that laboratory method development is satisfactorily completed prior to the analysis of samples collected for this task; coordinating with each testing laboratory and tracking the laboratory’s progress; verifying that each laboratory has implemented the requirements of this QAPP; addressing QA issues related to all laboratory analyses; ensuring that the capacity of each laboratory is sufficient to undertake the required analyses in a timely manner; and addressing scheduling issues related to all laboratory analyses. The task laboratory coordinator will report directly to the task QA coordinator and will work closely with the field supervisor.
Database Administrator—Dreas Nielsen is the database administrator and will have primary responsibility for data management and database maintenance and development. Mr. Nielsen will be responsible for overseeing and/or conducting the following activities: establishing storage formats and procedures appropriate for all data; working with the field crew, laboratories, and data validators to ensure all data entries are correct and complete and are delivered in the correct format; maintaining the integrity and completeness of the database; and providing data summaries to data users in the required formats for interpretation and reporting. Mr. Nielsen will report directly to the Teck technical team coordinator and will work closely with the field supervisor, task QA coordinator, and the data validation firm.
Task Safety Officer—The task safety officer (to be determined) for the 2009 beach sediment study and is responsible for providing health and safety oversight for the field staff that will be collecting the beach sediment samples.
Technical Reviewers—Technical review of this QAPP and associated FSP was provided by various Teck technical team members, including Dr. Rosalind Schoof, Dr. Rick Cardwell, Betsy Day, Dave Mayfield, and Sue Robinson.
A4.2.4 Laboratory The following responsibilities apply to the project manager and QA manager at the analytical laboratories used for the 2009 beach sediment study.
Laboratory Project Manager—The laboratory project manager is responsible for the successful and timely completion of sample analyses, as well as performing the following tasks:
Integral Consulting Inc. A‐16 Parametrix, Inc.

Upper Columbia River Quality Assurance Project Plan—Beach Sediment Study
• Ensure that samples are received and logged in correctly, that the correct methods and modifications are used, and that data are reported within specified turnaround times
• Review analytical data to ensure that procedures were followed as required in this QAPP, the cited methods, and laboratory standard operating procedures (SOPs)
• Keep the task laboratory coordinator apprised of the schedule and status of sample analyses and data package preparation
• Notify the task laboratory coordinator if problems occur in sample receiving, analysis, or scheduling, or if control limits cannot be met
• Take appropriate corrective action as necessary
• Report data and supporting QA information as specified in this QAPP.
Laboratory QA Manager—The laboratory QA manager is responsible for overseeing the QA activities in the laboratory and ensuring the quality of the data for this task. Specific responsibilities include the following:
• Oversee and implement the laboratory’s QA program
• Maintain QA records for each laboratory production unit
• Ensure that QA/QC procedures are implemented as required for each method and provide oversight of QA/QC practices and procedures
• Review and address or approve nonconformity and corrective action reports
• Coordinate responses to any quality control (QC) issues that affect this task with the laboratory project manager.
A5 PROBLEM DEFINITION AND BACKGROUND
As discussed previously, the primary objective of the 2009 beach sediment study is to ensure that the nature and extent of contamination in exposed beach surface and subsurface sediments is sufficiently well characterized to allow a reliable evaluation of potential risks to humans (including recreational use by nearby residents, subsistence users, and workers) who may be exposed via direct contact (ingestion and dermal).
A6 TASK DESCRIPTION Tasks to be completed for the 2009 beach sediment study include fieldwork, laboratory analyses, data quality evaluation, data management, data analysis, and report preparation. Tasks that will be completed in the field, including related documentation
Integral Consulting Inc. A‐17 Parametrix, Inc.

Upper Columbia River Quality Assurance Project Plan—Beach Sediment Study
and QA/QC activities, are described in detail in the FSP (Appendix A) and include the following:
• Station positioning
• Field equipment and sampling methods
• Sample processing methods
• Documentation of sample information and field activities
• Sample handling and shipping procedures
• Chain‐of‐custody (COC) procedures
• Decontamination procedures
• Handling and disposal of investigation‐derived wastes.
As previously mentioned, the task field supervisor will assume custody of samples as they are collected. A list of samples and analyses is provided in Table A‐4. Proposed sampling areas (i.e., beaches) are provided in Figure A‐1. Proposed station locations are provided in Figures 2‐3 through 2‐36 of the FSP (Appendix A).
Surface sediment samples will be analyzed for the following parameters:
• Grain size distribution in whole sediment for all composite samples from each beach
• Conventional parameters (pH, TOC, percent moisture, and total sulfides) in sieved sediment (< 2 mm) for all composite samples from each beach
• TAL metals/metalloids and elemental uranium in sieved sediment (< 2 mm) for all composite samples from each beach
• Uranium‐238 and radium‐226 in sieved sediment (< 2 mm) for select surface sediment composites
• TAL metals/metalloids and elemental uranium in each of the following sediment fractions: 2 mm to 250 μm, 250 μm to 125 μm, 125 μm to 63 μm, and < 63 μm for one surface composite sample from each beach
• IVBAs for arsenic, lead, and other metals on the following size fractions: < 250 μm, 250 μm to 125 μm, 125 μm to 63 μm, and < 63 μm.
Subsurface sediment samples will be analyzed for the following parameters:
• TAL metals/metalloids in sieved sediment (< 2 mm) for each of three depth strata from five subsurface cores from each beach
• Grain size distribution in whole sediment for each of three depth strata composite samples from each beach
Integral Consulting Inc. A‐18 Parametrix, Inc.

Upper Columbia River Quality Assurance Project Plan—Beach Sediment Study
Integral Consulting Inc. A‐19 Parametrix, Inc.
• Conventional parameters (pH, TOC, percent moisture, and total sulfides) in sieved sediment (< 2 mm) for each of three depth strata composite samples from each beach
• Pesticides, SVOCs, PAHs, and PCBs (as Aroclors) in sieved sediment (< 2 mm) for each of three depth strata composite samples from each beach
• PCB congeners, dioxin/furan congeners, and PBDEs in sieved sediment (< 2 mm) for each depth strata composite sample from each beach with a TOC concentration greater than 1 percent.
Samples will be archived for possible analysis of the following parameters:
• Uranium‐238 and radium‐226 in sieved sediment (< 2 mm) for all remaining surface and subsurface sediment composites not submitted for initial analysis12
• Particle density (including specific gravity) and percent granular slag composition in whole sediment.
A complete list of laboratory methods to be used is provided in Table A‐5. Grain size intervals are specified in Table A‐6. Analyses for conventional parameters, TAL metals/metalloids, elemental uranium, and organic compounds (pesticides, SVOCs, PAHs, PCBs [as Aroclors], PCB congeners, dioxin/furan congeners, and PBDEs) will be completed using EPA and Puget Sound Estuary Program (PSEP) methods (PSEP 1986; PSEP 1997a; 1997b; USEPA 1994; USEPA 1999a; USEPA 2007b; USEPA 2008a), as indicated in Table A‐5. Analysis for the radionuclides uranium‐238 and radium‐226 will be completed using EPA and U.S. Department of Energy (DOE) methods (DOE 1997; USEPA 1980). Full laboratory data reports will be provided to Teck in hard copy and electronic data deliverables (EDDs) in spreadsheet format as required for importing into the database. A relational database will be used to manage the field and laboratory data as described in Appendix B of the RI/FS work plan.
Data verification (i.e., confirming the accuracy and completeness of field and laboratory data) will be completed by the Teck technical team for data generated in the field, and by each laboratory for the data that it generates. The completeness of the final database will be verified. Data validation and data quality assessment for this task will be completed by an independent validation firm. The accuracy of the laboratory EDDs will be verified by or under the direction of the database administrator.
12 As stated previously, initially, a subset of the randomly selected surface sediment composite samples will be analyzed for these radionuclides. The results of these initial analyses will be used by EPA and TCAI to assess the need for radionuclide analysis of the remaining archived beach surface and subsurface sediment samples.

Upper Columbia River Quality Assurance Project Plan—Beach Sediment Study
The start date for field sampling will be determined following EPA approval of this QAPP and FSP. However, for illustrative purposes, it is anticipated that 2009 field sampling will begin in early April and be completed by mid‐May 2009. Sample analysis and data validation for all laboratory analyses are each expected to require 4 to 6 weeks for completion, for a total of 8 to 12 weeks from the time that sample collection is completed until finalization of the database. The field and reporting schedules are discussed further in Sections 2.1 and 5.4 of the FSP.
A7 QUALITY OBJECTIVES AND CRITERIA FOR MEASUREMENT DATA As discussed previously, DQOs were developed using EPA’s DQO process (USEPA 2006a) to describe data and data quality needs for this task (see Section A4.1.3). Data quality indicators (DQIs) such as the PARCC parameters (i.e., precision, accuracy or bias, representativeness, completeness, comparability) and analytical sensitivity will be used to assess conformance of data with quality control criteria (USEPA 2002b). DQOs and quality control objectives are described in this section.
A7.1 The Data Quality Objective Process Consistent with the DQOs identified in Section A4.1.3 and Table A‐1, reporting limits for the 2009 beach sediment study are expected to be lower than human health risk‐based concentrations (RBCs) for use in evaluating reasonable maximum exposures to sediments at the Site (as provided by EPA in Rochlin 2008, pers. comm. and Rochlin 2009, pers. comm.) for the purposes of establishing target analytical methods in the development of site sampling and analysis plans in support of the HHRA. These RBCs, which were limited to metals/metalloids and radionuclides in surface sediments, are summarized in Table A‐7 along with method detection limits (MDLs), and method reporting limits (MRLs) for sediment samples collected during the 2005 beach sediment study. MDLs and MRLs for inorganic and organic analyses in subsurface sediment samples are also summarized in Table A‐7 and were selected to ensure consistency with EPA’s sediment detection limit evaluation process (USEPA 2008b, Appendix E).
As stated previously, human health RBCs provided by EPA and summarized in Table A‐7 were used to determine the methods used for this study. The sediment MRL is expected to be below the human health RBC for all analytes except arsenic, for which the RBC is 0.11 mg/kg, and the expected MRL is 0.5 mg/kg (EPA Method 6020, inductively coupled plasma/mass spectrometry [ICP/MS]). If a sample has an arsenic concentration below the MRL as analyzed by EPA Method 6020, it may need to be
Integral Consulting Inc. A‐20 Parametrix, Inc.

Upper Columbia River Quality Assurance Project Plan—Beach Sediment Study
reanalyzed by EPA Method 7062, a hydride generation method with an MRL of approximately 0.1 mg/kg, as summarized in Table A‐7. However, based on the results of EPA’s 2005 study, reanalyses by EPA Method 7062 is not likely to be necessary.
A7.2 Data Quality Indicators for Laboratories The overall quality indicator for this task is to develop and implement procedures that will ensure the collection of representative data of known and acceptable quality. The QA procedures and measurements that will be used for this task are based on EPA, DOE, and PSEP guidance (PSEP 1986; PSEP 1987; PSEP 1997a; 1997b; USEPA 2002a; USEPA 2008a). PARCC parameters are commonly used to assess the quality of environmental data. Measurement quality objectives (MQOs) for the quantitative PARCC parameters are provided in Table A‐8.
Bias represents the degree to which a measured concentration conforms to the reference value. The results for matrix spikes, laboratory control samples, field blanks, and method blanks will be reviewed to evaluate bias of the data. The following calculation is used to determine percent recovery for a matrix spike sample:
100% ×−
=C
UMR
Where:
%R = percent recovery M = measured concentration in the spiked sample U = measured concentration in the unspiked sample C = concentration of the added spike
The following calculation is used to determine percent recovery for a laboratory control sample or reference material:
100% ×=CMR
Where: %R = percent recovery M = measured concentration in the reference sample C = established reference concentration
Integral Consulting Inc. A‐21 Parametrix, Inc.

Upper Columbia River Quality Assurance Project Plan—Beach Sediment Study
Integral Consulting Inc. A‐22 Parametrix, Inc.
Results for field and method blanks can reflect systematic bias that results from contamination of samples during collection or analysis. Any analytes detected in field or method blanks will be evaluated as potential indicators of bias.
Precision reflects the reproducibility between individual measurements of the same property. Precision will be evaluated using the results of laboratory duplicates and field splits. Precision is expressed in terms of the relative standard deviation for three or more measurements and the relative percent difference (RPD) for two measurements. The following equation is used to calculate the RPD between measurements:
1002)( 21
21 ×+
−=
CCCC
RPD
Where: RPD = relative percent difference C1 = first measurement C2 = second measurement
The relative standard deviation is the ratio of the standard deviation of three or more measurements to the average of the measurements, expressed as a percentage. Completeness will be calculated as the ratio of usable data (i.e., unqualified data and J‐qualified data13) to requested data, expressed as a percentage. Additional laboratory QC procedures will be evaluated to provide supplementary information regarding overall quality of the data, performance of instruments and measurement systems, and sample‐specific matrix effects.
QC samples and procedures are specified in each method protocol (Table A‐5). All QC requirements will be completed by each laboratory as described in the protocols, including the following (as applicable to each analysis):
• Instrument tuning
• Initial calibration
• Initial calibration verification
• Continuing calibration
• Calibration or instrument blanks
13Analytes detected at concentrations between the MRL and the MDL will be reported with a J qualifier to indicate that the value is an estimate (i.e., the analyte concentration is below the calibration range).

Upper Columbia River Quality Assurance Project Plan—Beach Sediment Study
• Method blanks
• Laboratory control samples
• Internal standards
• Serial dilutions
• Matrix spikes
• Laboratory duplicates.
To alert the data user to possible bias or imprecision, data qualifiers will be applied to reported analyte concentrations when associated QC samples or procedures do not meet control limits. Laboratory control limits for the methods that will be used for this study will be provided in each laboratory’s QA plan, and will be submitted under separate cover. Data validation criteria and procedures are described in Sections D1 and D2 of this QAPP.
MRLs reflect the sensitivity of the analysis. Methods selected for this study are expected to provide sufficient sensitivity to yield MRLs that are below the lowest reference value (Table A‐7) for this study.
Each chemistry laboratory will determine a method detection limit for each analyte, as required by USEPA (2004; 2005b). The radionuclide testing laboratory will determine a method detection limit for uranium‐238 and radium‐226, as specified in DOE’s Environmental Measurements Laboratory (EML) Procedures Manual (DOE 1997). MDLs are statistically derived and reflect the concentration at which an analyte can be detected in a clean matrix with 99 percent confidence that a false positive result has not been reported. Each laboratory will have established MRLs at levels above the MDLs for the task analytes. These values are based on the laboratory’s experience analyzing environmental samples and reflect the typical sensitivity obtained by the analytical system. Analyte concentrations for this study will be reported to the MDL. Analytes detected at concentrations between the MRL and the MDL will be reported with a J qualifier to indicate that the value is an estimate (i.e., the analyte concentration is below the calibration range). Nondetected values will be reported at the MRL and will be adjusted by the laboratory as necessary to reflect sample dilution or matrix interference.
Representativeness and comparability are qualitative QA/QC parameters. Representativeness is the degree to which data represent a characteristic of an environmental condition. In the field, representativeness will be addressed primarily in the sampling design, by the selection of sampling sites and sample collection
Integral Consulting Inc. A‐23 Parametrix, Inc.

Upper Columbia River Quality Assurance Project Plan—Beach Sediment Study
procedures. In the laboratories, representativeness will be ensured by the proper handling and storage of samples and initiation of analysis within holding times.
Comparability is the qualitative similarity of one data set to another (i.e., the extent to which different data sets can be combined for use). Comparability will be addressed through the use of field and laboratory methods that are consistent with methods and procedures recommended by EPA and PSEP and are commonly used for sediment studies.
A8 SPECIAL TRAINING/CERTIFICATION Teck has assembled a technical team with the requisite experience and technical skills to successfully complete the 2009 beach sediment study. All technical team personnel involved in sample collection have extensive environmental sampling experience. Minimum training and certification requirements for laboratory personnel will be provided in the laboratory QA plans (to be submitted under separate cover).
Sampling personnel who enter the exclusion zone and contaminant reduction zone (see Appendix A, Attachment A1 for definition and discussion of these zones) may be required to have completed the 40‐hour Hazardous Waste Operations and Emergency Response (HAZWOPER) standard training course and 8‐hour refresher courses (see draft general site health and safety plan [SHSP] [TCAI 2007] for further explanation). The training provides employees with knowledge and skills that enable them to perform their jobs safely and with minimum risk to their personal health. Training is also consistent with the requirements of the Washington Industrial Safety and Health Act. Documentation of course completion will be maintained in personnel files.
A9 DOCUMENTS AND RECORDS Records will be maintained documenting all activities and data related to field sampling and to chemical and physical analysis at the laboratories. Results of data verification and validation activities will also be documented. Procedures for documentation of these activities are described in this section. Components of field documentation are discussed in Section 3 of the FSP.
The QAPP, FSP (Appendix A), and the SHSP addendum (Attachment A1 to Appendix A) will be provided to every task participant listed in Section A3. Any revisions or amendments to any of the documents that make up the FSP will also be provided to these individuals.
Integral Consulting Inc. A‐24 Parametrix, Inc.

Upper Columbia River Quality Assurance Project Plan—Beach Sediment Study
A9.1 Field Documentation The Teck technical team field supervisor will ensure that the field team receives the final approved version of the QAPP (including the FSP and SHSP) prior to the initiation of field activities. Field records that will be maintained include the following:
• Field logbooks
• Photo documentation
• Field data and sample collection information forms (if any)
• Field change request forms (as needed)
• Sample tracking/COC forms.
Observations recorded in the field logbook will be used to provide context and aid in presentation and interpretation of analytical results. Additional details regarding the content and use of these documents are described in Section 3 of the FSP.
A9.2 Laboratory Documentation All activities and results related to sample analysis will be documented at each laboratory. Internal laboratory documentation procedures will be described in the laboratory QA plans (to be submitted under separate cover).
Each laboratory will provide a data package for each sample delivery group or analysis batch that is comparable in content to a full CLP package. It will contain all information required for a complete QA review, including the following:
• A cover letter discussing analytical procedures and any difficulties that were encountered
• A case narrative referencing or describing the procedures used and discussing any analytical problems and deviations from SOPs and this QAPP
• COC and cooler receipt forms
• A summary of analyte concentrations (to two significant figures, unless otherwise justified), MRLs, and MDLs
• Laboratory data qualifier codes appended to analyte concentrations, as appropriate, and a summary of code definitions
• Sample preparation, digestion, extraction, dilution, and cleanup logs
• Instrument tuning data
• Initial and continuing calibration data, including instrument printouts and quantification summaries, for all analytes
Integral Consulting Inc. A‐25 Parametrix, Inc.

Upper Columbia River Quality Assurance Project Plan—Beach Sediment Study
Integral Consulting Inc. A‐26 Parametrix, Inc.
• Results for method and calibration blanks
• Results for all QA/QC checks, including internal standards, serial dilutions, laboratory control samples (LCSs), matrix spike samples, laboratory duplicate or triplicate samples, and any other QC procedures required by applicable method protocols and laboratory SOPs
• Original data quantification reports for all analyses and samples
• All laboratory worksheets and standards preparation logs.
Data will be delivered in both hard copy and electronic format to the task QA coordinator, who will be responsible for oversight of data verification and validation and for archiving the final data and data quality reports in the project file. Electronic data deliverables will be compatible with the Teck technical team’s database.
A9.3 Data Quality Documentation Data validation reports for chemical analyses will be prepared by the contracted validation firm and provided to the task QA coordinator. All changes to data stored in the database will be recorded in the database change log. Any data tables prepared from the database for data users will include all qualifiers that were applied by the laboratory and during data validation.

Upper Columbia River Quality Assurance Project Plan—Beach Sediment Study
SECTION B: DATA GENERATION AND ACQUISITION
B1 SAMPLING DESIGN This section presents an overview of the sampling design for the 2009 beach sediment study. A more detailed discussion of the design, sampling methods, and sample handling procedures is presented in Section 2 of the FSP (Appendix A).
A total of 34 beaches have been identified within the Site for the 2009 beach sediment study as described in Section A.4.1.3. As stated previously, this total includes five beaches sampled in 2005 and 29 additional beaches identified based on the results of EPA’s screening level risk assessment for sediment exposure from limited recreational use at 15 beaches (USEPA 2005b; USEPA 2006b), as well as input from community and other interested parties (Tonel 2008a, pers. comm.). In each of these areas, surface sediment samples (i.e., 0–6 in.; 0–15 cm) will be collected from 60 discrete locations randomly distributed throughout the beach between the water’s edge and the maximum elevation for that beach. An approximate range of expected water elevation and approximate maximum elevation for the sample area identified at each beach are summarized in Table A‐2. The 60 samples will be randomly composited into 5 samples (i.e., 12 sampling locations will be composited into each surface sediment sample) that will be sent to the laboratory for chemical analysis. Subsurface sediment core samples (i.e., 0–30 in.; 0–75 cm or to refusal) will also be collected at five randomly selected locations at each beach for 33 of the 34 beaches. Three depth intervals from each core will be analyzed: 0–6 in. (0–15 cm), 6–18 in. (15–45 cm), and 18–30 in. (45–75 cm). In addition, to address sample mass requirements for some of the analyses, three additional depth strata composites will be obtained from the five subsurface cores. The estimated numbers of field samples that will be collected are listed in Table A‐4. As noted previously, based on review of subsurface sediment results, additional sampling may be required if the variability in the subsurface sediment data set is higher than the variability observed in the surface sediment data set and subsurface sediment concentrations approach a level of potential concern for exposures by people.
For both surface and subsurface samples, grain size distribution analysis will be conducted on the whole sediment sample. Analyses for conventional parameters (e.g., pH, TOC, percent moisture, and total sulfides) and all other chemical parameters (i.e., TAL metals/metalloids, elemental uranium, pesticides, SVOCs, PAHs, and PCBs [as Aroclors]) will be conducted on sediment that will be sieved to < 2 mm at the laboratory prior to analysis.
Integral Consulting Inc. B‐1 Parametrix, Inc.

Upper Columbia River Quality Assurance Project Plan—Beach Sediment Study
One of the surface composite samples from each beach will be analyzed for TAL metals/metalloids and elemental uranium on the following sediment fractions: 2 mm to 250 μm, 250 μm to 125 μm, 125 μm to 63 μm, and < 63 μm.
In addition, one of the surface composite samples from each beach will be undergo an IVBA for arsenic, lead, and other metals on the following size fractions: < 250 μm, 250 μm to 125 μm, 125 μm to 63 μm, and < 63 μm.
PCB congeners, dioxin/furan congeners, and PBDEs will be analyzed in sieved (< 2 mm) depth strata composites for which TOC is greater than 1 percent (Tonel 2008b, pers. comm.).
A subset of randomly selected archived surface sediment composite samples will also be submitted for analysis of two radionuclides, uranium‐238 and radium‐226, on the sieved (< 2 mm) sediment. The results of these initial analyses will be used by EPA and Teck to assess the need for radionuclide analysis of the remaining archived beach surface and subsurface sediment samples. An additional archive surface sample will also be collected for particle density (including specific gravity) and percent granular slag composition on the whole sediment.
A minimum of one field split sample and one equipment rinsate blank will also be collected and analyzed at each beach. The field split samples and equipment rinsate blanks will be submitted for metals analysis. Field QC samples are described in Section 2.3 of the FSP.
B2 SAMPLING METHODS Field sampling methods are described in Sections 2 and 3 of the FSP (Appendix A) and include the following activities:
• Station positioning (Section 2.2.2)
• Field equipment and supplies (Section 2.2.1)
• Sampling methods and performance requirements (Section 2.2.3)
• Equipment decontamination procedures (Section 2.2.4)
• Sample containers and labels (sample labels, custody seals, sample custody/tracking procedures) (Sections 2.4 and 3.2)
• Field documentation and procedures (field logbooks, photo documentation, COC form) (Sections 3.1 through 3.4)
• Investigation‐derived wastes (Section 2.5).
Integral Consulting Inc. B‐2 Parametrix, Inc.

Upper Columbia River Quality Assurance Project Plan—Beach Sediment Study
Because field sampling methods associated with the beach sediment study involve sediment collection or ground penetration/disturbance, Teck and its technical team will work with the potentially affected parties to assess the effects of the planned work and seek ways to avoid, minimize, or mitigate any adverse effects on historic properties. A cultural resources coordination plan (Appendix D) has been prepared for the RI/FS to provide relevant background information about site‐related cultural resources, define measures for protecting resources, and define procedures for consulting with the appropriate state, federal, and Tribal parties with interests in the cultural resources of the Site. Proposed sampling methods for the RI/FS, including the beach sediment study, are summarized in the cultural resources coordination plan (Table 3‐1 of Appendix D). Detailed descriptions of the sampling methods to be employed and the specific locations where sampling or field mobilization may result in ground penetration or disturbances are provided in Appendix D‐1. SOPs for each sampling method are provided in Attachment A2 to the FSP. Additional procedures to address cultural resources during sample collection and processing are discussed in Section 2.6 of the FSP (Appendix A).
Requirements for sample containers, sample preservation, storage temperature, and holding times are summarized in Table B‐1. All containers for samples submitted for chemical analyses will have screw‐type lids to ensure adequate sealing. Lids of the glass containers will have Teflon inserts to prevent sample reaction with the plastic lid and to improve the quality of the seal.
Commercially available, precleaned jars will be used for chemistry samples, and each laboratory will maintain a record of certification from the suppliers. The bottle shipment documentation will record batch numbers for the bottles. With this documentation, bottles can be traced to the supplier. The bottle documentation from each laboratory will be included in the project file.
Archived sediment samples that are collected for possible future analysis of radionuclides and to support evaluation of remedial alternatives will be placed in separate sample jars and labeled appropriately.
In the event that unanticipated or changed circumstances occur in the field, the field supervisor will institute the necessary corrective actions, complete a corrective action form (see Appendix A, Attachment A3), and ensure that the appropriate procedures are followed. If corrective actions require a departure from the FSP, these changes will be documented on a field change request form (see Appendix A, Attachment A3). In any other circumstances where sampling conditions are unexpected, the appropriate sampling actions consistent with this task’s objectives will be conducted. This change
Integral Consulting Inc. B‐3 Parametrix, Inc.

Upper Columbia River Quality Assurance Project Plan—Beach Sediment Study
will be noted in the field log, and a change request form will be completed for the project files. Additional information regarding corrective actions and related documentation is provided in Section C1.
B3 SAMPLE HANDLING AND CUSTODY Principal documents used to identify samples and to document possession will be field logbooks and COC records. Custody will be documented for all samples at all stages of the analytical or transfer process. COC procedures for sample handling prior to delivery to each laboratory are outlined in Sections 2.4 and 3.2 of the FSP.
Upon receipt of samples at each laboratory, the physical integrity of the containers and seals will be checked, and the samples will be inventoried by comparing sample labels to those on the COC forms. Each laboratory will include the COC and shipping container receipt forms in the data package. Any breaks in the COC or nonconformances will be noted and reported in writing to the task laboratory coordinator within 24 hours of receipt of the samples. Each laboratory QA plan (to be provided under separate cover) includes procedures used for accepting custody of samples and documenting samples at the laboratory. The laboratory project manager will ensure that a sample‐tracking record is maintained that follows each sample through all stages of sample processing at the laboratory.
Samples will be stored in accordance with Table B‐1. Samples for chemical analyses will be stored under refrigeration (4 ± 2°C). Aliquots of the samples for PCB congener, dioxin and furans, and PBDE analysis and all samples submitted to the analytical laboratory for archiving will be stored at –20°C. Samples for potential radionuclide analyses will be stored at room temperature. Each laboratory will maintain COC documentation and documentation of proper storage conditions for the entire time that the samples are in its possession.
The laboratories will not dispose of the samples for this task until authorized to do so by the task QA coordinator. After authorization is obtained, each laboratory will dispose of samples, as appropriate, based on matrix, analytical results, and information received from the client.
B4 ANALYTICAL METHODS Sediment samples collected for this study will be analyzed for chemical parameters. Laboratory methods that will be used to complete the analyses are described below.
Integral Consulting Inc. B‐4 Parametrix, Inc.

Upper Columbia River Quality Assurance Project Plan—Beach Sediment Study
B4.1 Chemical Analyses Surface sediment samples will be analyzed for conventional parameters, TAL metals/metalloids, and elemental uranium. Subsurface sediment samples will be analyzed for conventional parameters, TAL metals/metalloids, elemental uranium, and organic compounds. Detailed analyte lists and expected MRLs are provided in Table A‐7. MRLs are generally equivalent to the concentration of the lowest calibration standard (i.e., the practical quantification limit) and represent the low end of the calibration range. Analytes that are detected at concentrations below the reporting limit will be reported, but will be qualified as estimated (i.e., a “J” qualifier will be applied to the result by the laboratory).
Laboratory methods for sample preparation and analysis are summarized in Table A‐5 and described in the following sections. Sample containers, preservation, and holding times are provided in Table B‐1.
B4.1.1 Sample Sieving Sediment sieving procedures for the various conventional, chemical, and radionuclide analyses will be provided by the analytical laboratory (to be determined).
B4.1.2 TAL Metals/Metalloids and Elemental Uranium To generate the sediment fractions specified in Table A‐4, sediment samples will be sieved at the chemical testing laboratory (procedures to be determined). The fraction of sample passing through the respective sieve will be used for analysis.
Strong acid digestion with nitric acid and hydrogen peroxide will be used to prepare samples for analysis of metals other than mercury. Analysis will be completed either by ICP/MS according to EPA Method 6020 or by inductively coupled plasma‐optical emission spectrometry according to EPA Method 6010, as shown in Table A‐5.
EPA Method 7471A will be used for mercury analyses. Samples will be digested with aqua regia and oxidized using potassium permanganate. Analysis will be completed by cold vapor atomic absorption spectrometry.
If a sample has an arsenic concentration below the MRL as analyzed by EPA Method 6020, it may need to be reanalyzed by EPA Method 7062. Samples will be reanalyzed for arsenic using strong acid digestion (EPA Method 3050) and borohydride generation with atomic absorption spectrometry (EPA Method 7062). The borohydride method used in EPA Method 7062 will allow for a lower MRL, as described in Section A7.1.
Integral Consulting Inc. B‐5 Parametrix, Inc.

Upper Columbia River Quality Assurance Project Plan—Beach Sediment Study
B4.1.3 Grain Size Distribution and Other Conventional Analyses Grain size distribution will be completed on whole sediment samples using wet sieves and the pipette method (PSEP 1986). Samples will not be treated for oxidation of organic carbon prior to analysis.
To generate the sediment fractions specified in Table A‐4 for other conventional analyses (i.e., pH, TOC, percent moisture, and total sulfides), sediment samples will be sieved at the chemical testing laboratory (procedures to be determined). The fraction of sample passing through the respective sieve will be used for analysis.
EPA and PSEP methods will be used as shown in Table A‐5.
TOC in sediment will be analyzed as described in PSEP (1986). Samples will be pretreated with hydrochloric acid to remove inorganic carbon, dried at 70°C, and analyzed by combustion in an induction furnace.
Percent moisture in sediment samples will be determined according to PSEP (1986). These results will be used to calculate analyte concentrations on a dry‐weight basis and will be reported in the database.
Total sulfide analysis in samples will include distillation of the sulfide into a sodium hydroxide trap and analysis by colorimetry (EPA Method 9030M).
B4.1.4 SVOCs and PAHs To generate the sediment fractions specified in Table A‐4, sediment samples will be sieved at the chemical testing laboratory (procedures to be determined). The fraction of sample passing through the respective sieve will be used for analysis.
Sample extractions for SVOCs and PAHs will be completed using pressurized fluid extraction or Soxhlet extraction procedures and 50 g of sample (wet weight). The extract volume will be reduced to 10 mL, of which 8.0 mL will be processed through gel permeation chromatography. A final extract volume of 0.5 mL will be used. SVOCs will be analyzed by GC/MS in accordance with EPA Method 8270D. Total ion chromatogram results will not be reported. The mass spectrometer may be operated in full‐scan mode with increased ion multiplier settings to meet project sensitivity requirements. Analysis for PAHs will be completed by GC/MS with selected ion monitoring (SIM) in accordance with EPA Method 8270D.
Integral Consulting Inc. B‐6 Parametrix, Inc.
Upper Columbia River Quality Assurance Project Plan—Beach Sediment Study
B4.1.5 Pesticides To generate the sediment fractions specified in Table A‐4, sediment samples will be sieved at the chemical testing laboratory (procedures to be determined). The fraction of sample passing through the respective sieve will be used for analysis.
For organochlorine pesticide analysis, a 25‐g sample aliquot will be extracted using Soxhlet extraction procedures, and the final extract volume will be 5 mL. Florisil column cleanup (EPA SW‐846 Method 3620) will be performed on the sample extract followed by sulfur removal by EPA SW‐846 Method 3660. The surrogate compounds, tetrachloro‐m‐xylene and decachlorobiphenyl, will be added to every sample, QC sample, and to selected instrument standards. Analysis for pesticides will be completed by gas chromatography with an electron capture detector (GC/ECD) in accordance with EPA Method 8081B. For gas chromatography analysis, a splitless injection may be used to optimize the MRLs.
B4.1.6 PCB Aroclors To generate the sediment fractions specified in Table A‐4, sediment samples will be sieved at the chemical testing laboratory (procedures to be determined). The fraction of sample passing through the respective sieve will be used for analysis.
For analysis of PCB Aroclors, a 25‐g sample aliquot will be extracted and the final extract volume will be 10 mL. Acid cleanup (EPA SW‐846 Method 3665) will be performed on the sample extract followed sulfur removal by EPA SW‐846 Method 3660. The surrogate compounds, tetrachloro‐m‐xylene and decachlorobiphenyl, will be added to every sample, QC sample, and to selected instrument standards. PCB Aroclors will be analyzed by GC/ECD in accordance with EPA Method 8082A. For gas chromatography analysis, splitless injection may be used to optimize the MRLs.
B4.1.7 PCB Congeners To generate the sediment fractions specified in Table A‐4, sediment samples will be sieved at the chemical testing laboratory (procedures to be determined). The fraction of sample passing through the respective sieve will be used for analysis. The sample aliquot designated for analysis will be stored at –20°C until the time of extraction.
For PCB congener analysis, the sediment samples will be extracted with toluene by Soxhlet extraction. The cleanup procedures that may be used by the laboratory include back‐extraction with sulfuric acid, acidic and basic silica gel column chromatography, and acidic alumina column chromatography. These procedures are expected to provide
Integral Consulting Inc. B‐7 Parametrix, Inc.
Upper Columbia River Quality Assurance Project Plan—Beach Sediment Study
sufficient cleanup even for samples that contain high levels of interferents such as petroleum hydrocarbons.
Detection limits for PCB congeners are calculated on an individual compound and sample basis and depend on the signal‐to‐background ratio for the specific labeled isomer. The detection limits listed in Table A‐7 are expected to approximate the sample‐specific detection limits for typical samples. Sample‐specific detection limits will be reported in the database for PCB congeners when these analytes are not detected.
B4.1.8 Dioxins and Furans To generate the sediment fractions specified in Table A‐4, sediment samples will be sieved at the chemical testing laboratory (procedures to be determined). The fraction of sample passing through the respective sieve will be used for analysis. The sample aliquot designated for analysis will be stored at –20°C until the time of extraction.
Dioxins and furans in sediment will be extracted with toluene in a Soxhlet extractor. Cleanup procedures will include sulfuric acid cleanup and silica/carbon column cleanup. Additional cleanup procedures will be used if necessary to remove interferences. Samples will be analyzed by high‐resolution gas chromatography with high‐resolution mass spectrometry (HRGC/HRMS). EPA Method 1613B requires isotopically labeled analogs of target analytes to be spiked into each sample before extraction. Target analytes are quantified relative to the labeled analog and therefore their calculated concentration compensates for extraction and cleanup efficiencies.
Detection limits for dioxins and furans are calculated on an individual compound and sample basis and depend on the signal‐to‐background ratio for the specific labeled isomer. The detection limits listed in Table A‐7 are expected to approximate the sample‐specific detection limits for typical samples. Sample‐specific detection limits will be reported in the database for dioxins and furans when these analytes are not detected.
B4.1.9 PBDEs To generate the sediment fractions specified in Table A‐4, sediment samples will be sieved at the chemical testing laboratory (procedures to be determined). The fraction of sample passing through the respective sieve will be used for analysis. The sample aliquot designated for analysis will be stored at –20°C until the time of extraction.
Sample extractions for PBDE congeners will be completed using pressurized fluid extraction or Soxhlet extraction procedures and 50 g of sample (wet weight). After extraction, a labeled cleanup standard is spiked into the extract and the extract is concentrated. Sample extracts may be cleaned up using back‐extraction with sulfuric
Integral Consulting Inc. B‐8 Parametrix, Inc.

Upper Columbia River Quality Assurance Project Plan—Beach Sediment Study
acid and/or base, and gel permeation, silica gel, and/or Florisil or alumina chromatography, as required. The extract will be concentrated to 20 μL and labeled to indicate that injection internal standards are added. PBDE congeners will be analyzed by HRGC/HRMS according to EPA 1614.
B4.2 Radionuclide Analyses To generate the sediment fractions specified in Table A‐4, sediment samples will be sieved at the chemical testing laboratory (procedures to be determined). The fraction of sample passing through the respective sieve will be archived for possible later analysis by the radionuclide testing laboratory as described below.
Radium‐226 levels in sediment will be determined using modified EPA Method 903.1, a radon emanation technique. Procedural modifications include acid digestion followed by filtration prior to precipitation with barium sulfate. The barium‐radium‐sulfate is then dissolved in ethylene diamine tetraacetic acid and transferred to an emanation tube, where the radon is allowed to equilibrate for approximately 30 days. Radium‐226 decays by alpha emission to radon‐222, which is separated and collected from the liquid by a de‐emanation technique. The radon is then counted by alpha scintillation and the radium‐226 is determined by calculation.
Uranium238 levels in sediment will be determined using the U.S. Atomic Energy Commission Health and Safety Laboratory 300 Environmental Measurements Laboratory method. Procedure modifications include the use of an extraction chromatography column (i.e., ICHROM UTEVA) preconditioned with nitric and oxalic acids. Elution of uranium with hydrochloric acid is then followed by electro‐deposition onto a stainless steel disk, which is then counted on a solid state alpha spectrometer. The data from the alpha spectrometer is reduced by the alpha spectrometry data reduction software.
B4.3 Bioaccessibility of Lead, Arsenic, and Other Metals The bioaccessibility of lead, arsenic, and other metals will be determined using methods developed by the Solubility/Bioavailability Research Consortium (USEPA 2007a). Samples are oven dried (<40°C) and sieved to the following size fractions: <250 μm, 250 μm to 125 μm, 125 μm to 63 μm, and < 63 μm. Leachate tests are conducted on the sieved soil samples using a mixture of American Society for Testing and Materials Type II deionized water and glycerin buffered to a pH of 1.5 with hydrochloric acid. The
Integral Consulting Inc. B‐9 Parametrix, Inc.

Upper Columbia River Quality Assurance Project Plan—Beach Sediment Study
leachate is then drawn through a cellulose acetate filter and analyzed in accordance with the methods described in Section B4.1.2.
B5 QUALITY CONTROL Quality control samples will be prepared in the field and at each laboratory to monitor the bias and precision of the sample collection and analysis procedures.
B5.1 Field Quality Control Samples Field QC samples for this study will include field split samples and equipment rinsate blanks. One field split sample will be collected at each beach sampled. It is anticipated that 34 field split samples will be collected during the sampling event for chemical analysis.
One equipment rinsate blank will be generated for all chemical parameter groups at each beach sampled. It is anticipated that 34 equipment rinsate blanks will be collected during the sampling event.
Procedures for preparing field split samples and equipment rinsate blanks are presented in Section 2.3 of the FSP. Validation criteria and procedures for field QC samples are described in Sections D1 and D2 of this QAPP.
B5.2 Laboratory Quality Control Extensive and detailed requirements for laboratory QC procedures are provided in the EPA, PSEP, and DOE protocols that will be used for this study (Table A‐5). Every method protocol includes descriptions of QC procedures, and many incorporate additional QC requirements by reference to separate QC sections. QC requirements include control limits and requirements for corrective action in many cases. QC procedures will be completed by each laboratory, as required in each protocol and as indicated in this QAPP.
The frequency of analysis for laboratory control samples, matrix spike samples, laboratory duplicates, and method blanks will be one for every 20 samples or one per extraction or analysis batch, whichever is more frequent. Internal standards will be added to every field sample and QC sample, when required by the method protocol. Calibration procedures will be completed at the frequency specified in each method description.
Integral Consulting Inc. B‐10 Parametrix, Inc.

Upper Columbia River Quality Assurance Project Plan—Beach Sediment Study
As required for EPA SW‐846 methods, performance‐based control limits have been established by each laboratory. These and all other control limits specified in the method descriptions will be used by each laboratory to establish the acceptability of the data or the need for reanalysis of the samples. Laboratory control limits for recovery of internal standards, matrix spikes, and laboratory control samples, and for relative percent difference of laboratory duplicates, are provided in each laboratory’s QA manual (to be submitted under separate cover).
B6 INSTRUMENT/EQUIPMENT TESTING, INSPECTION, AND MAINTENANCE
Analytical instrument testing, inspection, maintenance, setup, and calibration will be conducted by each laboratory in accordance with the requirements identified in the laboratory’s SOPs and manufacturer instructions. In addition, each of the specified analytical methods provides protocols for proper instrument setup and tuning, and critical operating parameters. Instrument maintenance and repair will be documented in the maintenance log or record book.
B7 INSTRUMENT/EQUIPMENT CALIBRATION AND FREQUENCY Laboratory instruments will be properly calibrated, and the calibration will be verified with appropriate check standards and calibration blanks for each parameter before beginning each analysis. Instrument calibration procedures and schedules will conform to analytical protocol requirements and descriptions provided in the laboratory’s QA plans.
All calibration standards will be obtained from either the EPA repository or a commercial vendor, and the laboratory will maintain traceability back to the National Institute of Standards and Technology. Stock standards will be used to make intermediate standards and calibration standards. Special attention will be given to expiration dating, proper labeling, proper refrigeration, and prevention of contamination. Documentation relating to the receipt, mixing, and use of standards will be recorded in a laboratory logbook. All calibration and spiking standards will be checked against standards from another source, as specified in the methods and the laboratory QA manual.
Integral Consulting Inc. B‐11 Parametrix, Inc.

Upper Columbia River Quality Assurance Project Plan—Beach Sediment Study
B8 INSPECTION/ACCEPTANCE OF SUPPLIES AND CONSUMABLES The quality of supplies and consumables used during sample collection and laboratory analysis can affect the quality of the data. All equipment that comes into contact with the samples and extracts must be sufficiently clean to prevent detectable contamination, and the analyte concentrations must be accurate in all standards used for calibration and quality control purposes.
During sample collection, solvents of appropriate, documented purity will be used for decontamination. Solvent containers will be dated and initialed when they are opened. The quality of laboratory water used for decontamination will be documented at the laboratory. As discussed in Section B2, cleaned and documented sample containers will be provided by the laboratory. All containers will be visually inspected prior to use, and any suspect containers will be discarded.
Reagents of appropriate purity and suitably cleaned laboratory equipment will also be used for all stages of laboratory analyses. Details for acceptance requirements for supplies and consumables at each laboratory are provided in the laboratory SOPs and QA plans. All supplies will be obtained from reputable suppliers with appropriate documentation or certification. Supplies will be inspected to confirm that they meet use requirements, and certification records will be retained by the field supervisor (i.e., for supplies used in the field) or the laboratory QA manager (i.e., for supplies used in the laboratory).
B9 NON-DIRECT MEASUREMENTS Existing chemical data from previous investigations will be used for this study (see Appendix A, Attachment A5). As discussed in the RI/FS work plan, historical data will be reviewed for quality assurance and acceptability for use in the RI/FS.
B10 DATA MANAGEMENT Data for this task will be generated in the field and at each laboratory. The final repository for sample information for the sample collection efforts described in the FSP will be a relational database. Procedures to be used to transfer data from the point of generation to the database are described in this section. The final database will include historical as well as current data (as described in Appendix B of the RI/FS work plan).
Integral Consulting Inc. B‐12 Parametrix, Inc.

Upper Columbia River Quality Assurance Project Plan—Beach Sediment Study
Integral Consulting Inc. B‐13 Parametrix, Inc.
B10.1 Field Data Data that are generated during sediment collection and sample preparation will be manually entered into the field logbook and COC forms. Data from these sources will be entered into the project database directly from the field logbook. These data include station location coordinates, station names, sampling dates, sample identification codes, and additional station and sample information (e.g., water depth, if applicable, sample type, field split number). All entries will be reviewed for accuracy and completeness by a second individual, and any errors will be corrected before the data are approved for release to data users.
B10.2 Laboratory Data A variety of manually entered and electronic instrument data are generated at each laboratory. Data are manually entered into:
• Standard logbooks
• Storage temperature logs
• Balance calibration logs
• Instrument logs
• Sample preparation and analysis worksheets
• Maintenance logs
• Individual laboratory notebooks
• Results tables for conventional analyses (e.g., grain‐size distribution, percent moisture).
All data manually entered into the laboratory information management system will be proofed at each laboratory prior to being released. All data collected from each laboratory instrument, either manually or electronically, will be reviewed and confirmed by analysts before reporting. A detailed description of procedures for laboratory data management and data review and verification is provided in the laboratory QA plans (to be submitted under separate cover).
Laboratory data will be entered directly into the project database from the EDD. A database printout will be used to verify database entries against the hard‐copy laboratory data packages. Data management procedures for this project are provided in Appendix B of the RI/FS work plan.

Upper Columbia River Quality Assurance Project Plan—Beach Sediment Study
SECTION C: ASSESSMENT AND OVERSIGHT This task will rely on the knowledge and expertise of the Teck technical team, as described in the RI/FS work plan. The field team and laboratories will stay in close verbal contact with the task manager and the task QA coordinator during all phases of this task. This level of communication will serve to keep the management team apprised of activities and events, and will allow for informal but continuous task oversight. Few scheduled assessment activities are planned for this task because the scope of the sampling and analysis effort and the size of the team are relatively small.
C1 ASSESSMENTS AND RESPONSE ACTIONS Assessment activities will include readiness reviews prior to sampling and prior to release of the final data to the data users, and internal review while work is in progress. An informal technical systems audit may be conducted if problems are encountered during any phase of this task.
Readiness reviews are conducted to ensure that all necessary preparations have been made for efficient and effective completion of each critical phase of work. The first readiness review will be conducted prior to field sampling. The field supervisor will verify that all field equipment is ready for transfer to the site. The field supervisor will also verify that the field team and subcontractor(s), as required, have been scheduled and briefed (including review of the SHSP) and that the contract for the subcontractor has been signed by both parties. Any deficiencies noted during this readiness review will be corrected prior to initiation of sampling activities.
The second readiness review will be completed before final data are released for use. The database administrator will verify that all results have been received from each laboratory, data validation and data quality assessment have been completed for all of the data, and data qualifiers have been entered into the database and verified. Any deficiencies noted during this review will be corrected by the database administrator, the task QA coordinator, or their designee. Data will not be released for final use until all data have been verified and validated. No report will be prepared in conjunction with the readiness reviews. However, the Teck technical team coordinator and data users will be notified when the data are ready for use.
Technical review of intermediate and final work products generated for this task will be completed throughout the course of all sampling, laboratory, data validation, data management, and data interpretation activities to ensure that every phase of work is
Integral Consulting Inc. C‐1 Parametrix, Inc.

Upper Columbia River Quality Assurance Project Plan—Beach Sediment Study
accurate and complete and follows the QA procedures outlined in this QAPP. Any problems that are encountered will be resolved between the reviewer and the person completing the work. Any problems that cannot be easily resolved or that affect the final quality of the work product will be brought to the attention of the Teck technical team coordinator and Teck project coordinator. EPA will be notified of any problems that may affect the final outcome of this task, according the Agreement.
Each laboratory will be required to have implemented a review system that serves as a formal surveillance mechanism for all laboratory activities. Each phase of work is reviewed by a supervisor before it is approved for release. Details are provided in the laboratory QA plans (to be submitted under separate cover).
Technical system audits may be conducted if serious problems are encountered during sampling or analysis operations. If completed, these audits will be conducted by the task QA coordinator or designee, or by the laboratory, as appropriate. These audits may consist of onsite reviews of any phase of field or laboratory activities or data management. Results of any audits will be provided in the draft field sampling report.
Any task team member who discovers or suspects a nonconformance is responsible for reporting the nonconformance to the task manager, the task QA coordinator, or the laboratory project or QA manager, as applicable. The task QA coordinator will ensure that no additional work dependent on the nonconforming activity is performed until a confirmed nonconformance is corrected. Any confirmed nonconformance issues will be relayed to the Teck technical team coordinator.
C2 REPORTS TO MANAGEMENT The laboratory will keep the appropriate task laboratory coordinator apprised of its progress on a weekly basis. The laboratory will provide the following information:
• Inventory and status of samples held at the laboratory in spreadsheet format by sample delivery group
• Summaries of any laboratory QC data outside of control limits and any corrective actions implemented
• Descriptions and justification for any significant changes in methodology or QA/QC procedures.
The task laboratory coordinator will provide this information to the task QA coordinator, who in turn will provide this information to the task manager.
Integral Consulting Inc. C‐2 Parametrix, Inc.
Upper Columbia River Quality Assurance Project Plan—Beach Sediment Study
Integral Consulting Inc. C‐3 Parametrix, Inc.
Each laboratory will be required to have implemented routine systems of reporting nonconformance issues and their resolution. These procedures are described in the laboratory QA manuals (to be submitted under separate cover). Laboratory nonconformance issues will also be described in the draft field sampling report if they affect the quality of the data.
Data packages and EDDs will be prepared by each laboratory upon completion of analyses for each sample delivery group. The case narrative will include a description of any problems encountered, control limit exceedances (if applicable), and a description and rationale for any deviations from protocol. Copies of corrective action reports generated at the laboratory will also be included with the data package.
Data validation reports will be prepared by an independent validator following receipt of the complete laboratory data package for each analytical round. Validated data will be provided electronically to EPA within 90 days of completion of the data validation.
A draft field sampling report will be prepared by the Teck technical team and submitted to EPA within 150 days of completion of the beach sediment sampling activity (i.e., after the fieldwork, laboratory analyses, and associated data validation have been completed). The draft field sampling report will summarize field sampling activities including sampling locations (maps), results from the requested sample analyses, the sample collection method used, and the rationale for any deviations from the FSP and QAPP. Sample analysis results will be reported in tabular format in the field sampling report. Data will be provided in the field sampling report in sufficient detail for EPA to begin preliminary analysis. Preliminary identification of apparent data gaps that were identified during the beach sediment study will also be summarized in the field sampling report.
Upper Columbia River Quality Assurance Project Plan—Beach Sediment Study
SECTION D: DATA VALIDATION AND USABILITY Data generated in the field and at each laboratory will be verified and validated according to criteria and procedures described in this section. Data quality and usability will be evaluated, and a discussion will be included in the draft field sampling report.
D1 CRITERIA FOR DATA REVIEW, VERIFICATION, AND VALIDATION Field and laboratory data for this task will undergo a formal verification and validation process. All entries into the database will be verified. All errors found during the verification of field data, laboratory data, and the database will be corrected prior to release of the final data.
Data verification and validation for metals and organic compounds will be completed according to methods described in EPA’s functional guidelines for inorganic and organic data review (USEPA 1999b; USEPA 2001; USEPA 2004; USEPA 2005b). Data will be qualified as estimated as necessary if results for laboratory control samples, matrix spike samples, or laboratory duplicates do not meet the MQOs provided in Table A‐8 or if control limits for any other QC sample or procedure do not meet performance‐based control limits. Performance‐based control limits are established periodically by each laboratory. Current values will be provided in the laboratory QA plans (to be submitted under separate cover), as applicable.
No guidelines are available for validation of data for TOC, grain size distribution, moisture content (and porosity), pH, and radionuclides. These data will be validated using procedures described in the functional guidelines for inorganic data review (USEPA 2004), as applicable and their respective methods. The MQO for accuracy (Table A‐8) will be used as control limits for matrix spike recovery, and the MQO for precision will be used as the control limit for laboratory duplicate or triplicate analyses. Performance‐based control limits will be used to qualify these data if results for other quality control samples do not meet control limits.
Results for field duplicates will be evaluated using the MQOs for precision provided in Table A‐8. Data will not be qualified as estimated if the MQOs are exceeded, but RPD results will be tabulated, and any exceedances will be discussed in the draft field sampling report. Equipment rinse blanks will be evaluated and data qualifiers will be applied in the same manner as method blanks, as described in the functional guidelines for data review (USEPA 2004).
Integral Consulting Inc. D‐1 Parametrix, Inc.

Upper Columbia River Quality Assurance Project Plan—Beach Sediment Study
Data will be rejected if control limits for acceptance of data are not met, as described in USEPA (1999b; 2001; 2004; 2005b).
D2 VERIFICATION AND VALIDATION METHODS Field data will be verified during preparation of samples and COC forms. Field data and COC forms will be reviewed daily by the field supervisor. After field data are entered into the project database, 100 percent verification of the entries will be completed to ensure the accuracy and completeness of the database. Any discrepancies will be resolved before the final database is released for use.
Approximately 30 percent of the chemistry data will be fully validated, including the first two data packages generated for each chemical analysis type. If no problems are encountered, validation for the remaining data will be based on review of the summary forms for sample and QC data. If problems are encountered, the laboratory will be contacted for resolution. Additional full validation will be completed if required to fully assess the quality of the data in case of problems or to verify that laboratory errors have been addressed.
Procedures for verification and validation of laboratory data and field QC samples will be completed as described in the functional guidelines and SOP for data validation (USEPA 2004) and summarized in Section D1, above. The accuracy and completeness of the database will be verified at each laboratory when the EDDs are prepared and again as part of data validation. Ten percent of entries to the database from the laboratory EDDs will be checked against the hard‐copy data packages. Data validation will be completed by a subcontracted data validation firm.
In addition to verification of field and laboratory data and information, data qualifier entries into the database will be verified. Any discrepancies will be resolved before the final database is released for use.
MRL goals for this task are provided in Table A‐7. Reporting limits for nondetected results will be compared to the method reporting limit goals to evaluate method sensitivity for each sample. Any exceedance of actual MRLs over the target MRLs will be discussed in the draft field sampling report.
D3 RECONCILIATION WITH USER REQUIREMENTS The goal of data validation is to determine the quality of each data result and to identify those that do not meet the task MQOs. Nonconforming data may be qualified as
Integral Consulting Inc. D‐2 Parametrix, Inc.

Upper Columbia River Quality Assurance Project Plan—Beach Sediment Study
Integral Consulting Inc. D‐3 Parametrix, Inc.
estimated (i.e., a “J” qualifier will be applied to the result) or rejected as unusable (i.e., an “R” qualifier will be applied to the result) during data validation if criteria for data quality are not met. Rejected data will not be used for any purpose. An explanation of the rejected data will be included in the draft field sampling report.
Data qualified as estimated will be used for all intended purposes and will be appropriately qualified in the final project database. However, these data are less precise or less accurate than unqualified data. Data users, in cooperation with the Teck technical team coordinator and the task QA coordinator, are responsible for assessing the effect of the inaccuracy or imprecision of the qualified data on statistical procedures and other data uses. The data quality discussion in the draft field sampling report will include all available information regarding the direction or magnitude of bias or the degree of imprecision for qualified data to facilitate the assessment of data usability. The draft field sampling report will also include a discussion of data limitations and their effect on data interpretation activities
Upper Columbia River Quality Assurance Project Plan—Beach Sediment Study
SECTION E: REFERENCES Choate, L.M., J.F. Ranville, A.L. Bunge, and D.L. Macalady. 2006. Dermally Adhered Soil: 1. Amount and Particle‐Sized Distribution. Integr. Environ. Assess. Manag. 2:375–384.
Cox, S.E., P.R. Bell, J.S. Lowther, and P.C. Van Metre. 2005. Vertical distribution of trace‐element concentrations and occurrence of metallurgical slag particles in accumulated bed sediments of Lake Roosevelt, Washington, September 2002. Scientific Investigations Report 2004‐5090. U.S. Geological Survey, Reston, VA. 70 pp.
DOE. 1997. EML Procedures Manual (HASL 300). 28th Edition. February 1997. Environmental Measurements Laboratory, U.S. Department of Energy, U.S. Department of Homeland Security, New York, NY.
E&E. 2002. Preliminary assessments and site inspections report Upper Columbia River mines and mills, Stevens County, Washington. Prepared for the U.S. Environmental Protection Agency, Region 10, Seattle, WA by Ecology and Environment, Inc., Seattle, WA. Lindberg, M. 1992. Civil Engineering Manual. 6th Edition. Professional Publications, Inc., Belmont, CA.
Ecology. 2007. Field Reconnaissance and Sediment Sampling Report; Upper Columbia River Site, Washington. Washington Department of Ecology Toxics Cleanup Program Eastern Regional Office, Spokane, WA.
Majewski, M.S., S.C. Kahle, J.C. Ebbert, and E.G. Josberger. 2003. Concentrations and distributions of slag‐related trace elements and mercury in fine‐grained beach and bed sediments of Lake Roosevelt, Washington, April‐May 2001. Water‐Resources Investigations Report 03‐4170. U.S. Geological Survey, Reston, VA.
PSEP. 1986. Puget Sound estuary program: Recommended protocols for measuring conventional sediment variables in Puget Sound. Final report TC‐3991‐04. Prepared for U.S. Environmental Protection Agency, Region 10, Seattle, WA, by Tetra Tech and HRA, Inc., Bellevue, WA. (minor corrections, April 2003).
PSEP. 1987. Puget Sound estuary program: Recommended protocols for sampling analyzing subtidal benthic macroinvertebrate assemblages in Puget Sound. U.S. Environmental Protection Agency Region 10, Office of Puget Sound, Seattle, WA.
PSEP. 1997a. Puget Sound estuary program: Recommended guidelines for measuring inorganic compounds in Puget Sound water, sediment and tissue samples. In: Recommended protocols for measuring selected environmental variables in Puget Sound. Puget Sound Action Team, Olympia, WA.
Integral Consulting Inc. E‐1 Parametrix, Inc.

Upper Columbia River Quality Assurance Project Plan—Beach Sediment Study
PSEP. 1997b. Puget Sound estuary program: recommended quality assurance and quality control guidelines for the collection of environmental data in Puget Sound. In: Recommended protocols for measuring selected environmental variables in Puget Sound. Puget Sound Action Team, Olympia, WA.
Rochlin, K. 2008. Personal communication (letter to M. Adzic, Teck Cominco American Incorporated, Spokane, WA, dated May 1, 2008, regarding human health risk‐based concentrations for surface water, fish tissue, and sediment in support of sampling and analysis plan development for the Upper Columbia River Remedial Investigation and Feasibility Study). U.S. Environmental Protection Agency, Region 10, Seattle, WA.
Rochlin, K. 2009. Personal communication (letter to M. Adzic, Teck American Incorporated, Spokane, WA, dated January 29, 2009, regarding Upper Columbia River Remedial Investigation and Feasibility Study). U.S. Environmental Protection Agency, Region 10, Seattle, WA.
Smucker, S. 2004. Region 9 2004 PRG Table. Available at http://www.epa.gov/region9/waste/sfund/prg/whatsnew.htm.
STI. 2006. Law and Order Code of the Spokane Tribe of Indians, Chapter 34 ‐ Hazardous Substances Control Act. Resolution No. 2006‐518. Amended – July 2006.
Stifelman, M. 2008. Personal communication (letter to Rosalind Schoof and Dina Johnson, Integral Consulting inc., Mercer Island, WA, dated June 12, 2008, regarding followup on Sediment IVBA). U.S. Environmental Protection Agency Region 10, Seattle, WA.
TCAI. 2007. Upper Columbia River: Draft general health and safety plan for the remedial investigation and feasibility study. Prepared for Teck Cominco American Incorporated. December 27, 2007. Integral Consulting Inc., Mercer Island, WA, and Parametrix, Bellevue, WA.
Tonel, M. 2008a. Personal communication (letter to M. Adzic, Teck Cominco American Incorporated, Spokane, WA, dated June 20, 2008, regarding Phase II beach subsurface sediment sampling design recommendations to support the baseline human health risk assessment for the Upper Columbia River Remedial Investigation and Feasibility Study). U.S. Environmental Protection Agency, Region 10, Seattle, WA.
Tonel, M. 2008b. Personal communication (letter to M. Adzic, Teck Cominco American Incorporated, Spokane, WA, dated May 21, 2008, regarding Phase II beach surface sediment data quality objectives and sampling design to support the baseline human health risk assessment for the Upper Columbia River Remedial Investigation and Feasibility Study). U.S. Environmental Protection Agency, Region 10, Seattle, WA.
Integral Consulting Inc. E‐2 Parametrix, Inc.

Upper Columbia River Quality Assurance Project Plan—Beach Sediment Study
USCGS. 1950. Descriptive Reports (Hydrographic Surveys for Lake Roosevelt). HO7691, HO7692, HO7693, HO7694, HO7695. U.S. Coast and Geodetic Survey, Department of Commerce, Washington, DC.
USEPA. 1980. Prescribed procedures for measurement of radioactivity in drinking water. EPA/600/4‐80‐032. U.S. EPA National Exposure Research Laboratory, Microbiological and Chemical Exposure Assessment Research Division, Cincinnati, OH.
USEPA. 1994. Method 1613, Tetra‐ through octa‐chlorinated dioxins and furans by isotope dilution HRGC/HRMS. U.S. Environmental Protection Agency, Office of Water, Washington, DC.
USEPA. 1999a. Method 1668, Revision A: Chlorinated biphenyl congeners in water, soil sediment, and tissue by HRGC/HRMS. EPA‐821‐R‐00‐002. U.S. Environmental Protection Agency, Office of Water, Washington, DC.
USEPA. 1999b. USEPA contract laboratory program national functional guidelines for organic data review. U.S. Environmental Protection Agency, Office of Emergency and Remedial Response, Washington, DC.
USEPA. 2000. Guidance for Region 10 human health risk assessments regarding bioavailability of arsenic contaminated soil ‐ interim guidance. U.S. Environmental Protection Agency, Region 10, Seattle, WA. 13 pp.
USEPA. 2001. USEPA contract laboratory program national functional guidelines for low concentration organic data review. U.S. Environmental Protection Agency, Office of Emergency and Remedial Response, Washington, DC.
USEPA. 2002a. Guidance for quality assurance project plans. EPA QA/G‐5. EPA/240/R‐02/009. U.S. Environmental Protection Agency, Office of Environmental Information, Washington, DC.
USEPA. 2002b. Guidance on environmental data verification and validation. EPA QA/G‐8. U.S. Environmental Protection Agency, Office of Environmental Information, Washington, DC.
USEPA. 2003. Upper Columbia River expanded site inspection report; Northeast Washington. TDD:01‐02‐0028. Contract: 68‐S0‐01‐01. U.S. Environmental Protection Agency, Region 10, Seattle, WA. 84 pp.
USEPA. 2004. USEPA contract laboratory program national functional guidelines for inorganic data review. U.S. Environmental Protection Agency, Office of Emergency and Remedial Response, Washington, DC.
Integral Consulting Inc. E‐3 Parametrix, Inc.
Upper Columbia River Quality Assurance Project Plan—Beach Sediment Study
USEPA. 2005a. Estimation of relative bioavailability of arsenic in soil and soil‐like materials by in vivo and in vitro methods. EPA Review Draft ‐ October 2005 and EPA 2007. Estimation of relative bioavailability of lead in soil and soil‐like materials using in vivo and in vitro methods. May 2005. Office of Solid Waste and Emergency Response, U.S. Environmental Protection Agency OSWER 9285.7‐77
USEPA. 2005b. USEPA contract laboratory program functional guidelines for chlorinated dioxin/furan data review. U.S. Environmental Protection Agency, Office of Emergency and Remedial Response, Washington, DC.
USEPA. 2006a. Guidance for the data quality objectives process. EPA QA/G‐4. EPA/600/R‐96/055. U.S. Environmental Protection Agency, Office of Environmental Information, Washington, DC.
USEPA. 2006b. Phase I Sediment Sampling Data Evaluation ‐ Upper Columbia River Site CERCLA RI/FS. Draft Final. August 2006. U.S. Environmental Protection Agency, Washington, DC.
USEPA. 2006c. Screening‐level risk assessment for recreational use of beaches, Upper Columbia River, remedial investigation and feasibility study. Prepared by CH2M HILL and Ecology and Environment, Inc. Draft. U.S. Environmental Protection Agency, Region 10, Seattle, WA.
USEPA. 2006d. Settlement agreement for implementation of remedial investigation and feasibility study at the Upper Columbia River Site. June 2, 2006. U.S. Environmental Protection Agency, Region 10, Seattle, WA.
USEPA. 2007a. Estimation of relative bioavailability of lead in soil and soil‐like materials using in vivo and in vitro methods. OSWER 9285.7‐77. May 2007. U.S. Environmental Protection Agency, Office of Solid Waste and Emergency Response, Washington, DC.
USEPA. 2007b. Method 1614, Brominated diphenyl ethers in water, soil, sediment and tissue by HRGC/HRMS. August 2007. EPA‐821‐R‐07‐005. U.S. Environmental Protection Agency, Office of Water, Office of Science and Technology, Engineering and Analysis Division (4303T), Washington, DC.
USEPA. 2008a. SW‐846 On‐line, test methods for evaluating solid waste‐physical/chemical methods. http://www.epa.gov/epaoswer/hazwaste/test/main.htm. Accessed June 25, 2008. U.S. Environmental Protection Agency, Seattle, WA.
USEPA. 2008b. Work plan for the human health risk assessment for the upper Columbia River site remedial investigation and feasibility study. Draft (for external
Integral Consulting Inc. E‐4 Parametrix, Inc.

Upper Columbia River Quality Assurance Project Plan—Beach Sediment Study
Integral Consulting Inc. E‐5 Parametrix, Inc.
review and comment only). Prepared by Syracuse Research Corporation, Syracuse, NY. U.S. Environmental Protection Agency Region 10, Seattle, WA
USGS. 2003. Concentrations and distributions of slag‐related trace elements and mercury in fine‐grained beach and bed sediments of Lake Roosevelt, Washington, April‐May 2001. Water‐Resources Investigations Report 03‐4170. U.S. Geological Survey, Reston, VA.

FIGURES
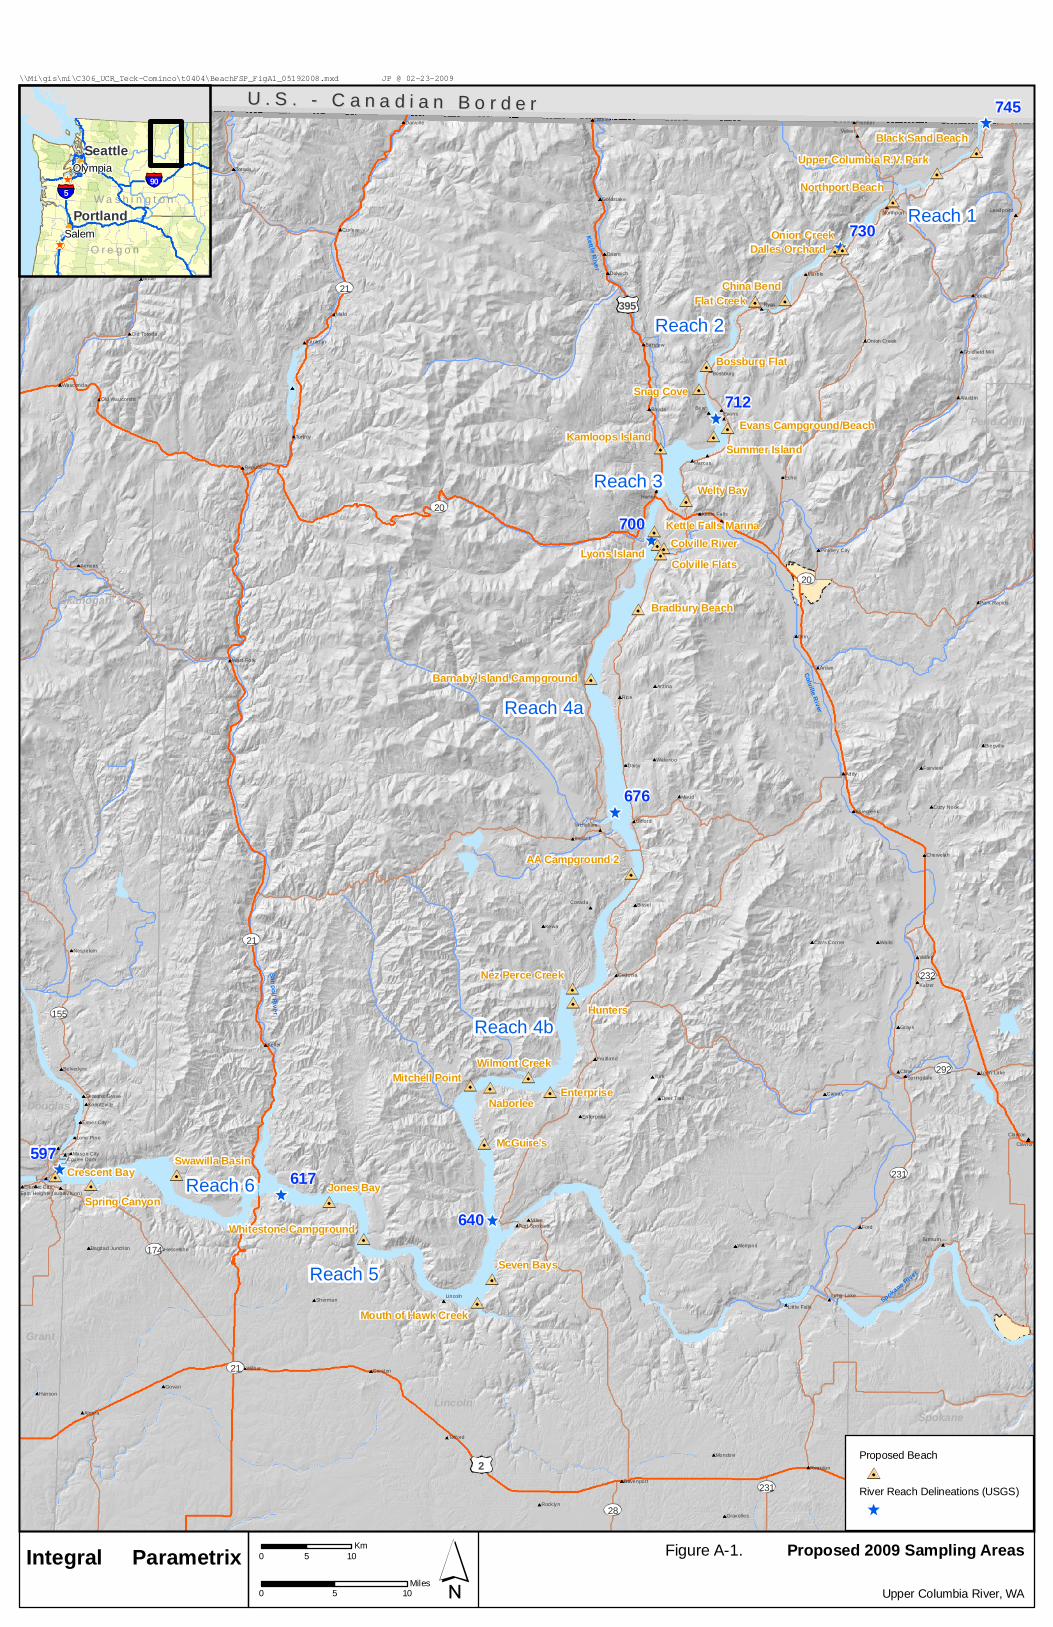
Naborlee
Jones Bay
McGuire’s
Snag Cove
China Bend
Seven Bays
Enterprise
Flat Creek
Wilmont Creek
Evans Campground/Beach
Onion Creek
Crescent Bay
Lyons Island
Spring Canyon
Summer Island
Bossburg Flat
Swawilla Basin
Barnaby Island Campground
Bradbury Beach
Colville Flats
Dalles Orchard
Mitchell Point
Nez Perce Creek
Kamloops Island
Northport Beach
Black Sand Beach
AA Campground 2
Mouth of Hawk Creek
Whitestone Campground
Kettle Falls Marina
Upper Columbia R.V. Park
Welty Bay
Hunters
Colville River
Kettle River
Sanpoil R
iver
Spokane River
Colville River
U . S . - C a n a d i a n B o r d e rU . S . - C a n a d i a n B o r d e r
Reach 6
Reach 5
Reach 3
Reach 2
Reach 1
Reach 4b
Reach 4a
597
676
745
617
640
700
712
730
395
2
20
21
155
174
231
292
28
232
21
20
21
231
Turk
Ryan
Rice
Orin
Maud
Malo
Kewa
Hite
Ford
Echo
Bear
Addy
Waits
Miles
Lyons
Grays
Govan
Evans
Daisy
Cline
Camas
Boyds
Bodie
Arden
Wilbur
Velvet
Valley
Tumtum
Toroda
Torboy
Spirit
Orient
Marcus
Marble
Kulzer
Keller
Impach
Harter
Hanson
Curlew
Covada
Chesaw
Bissel
Arzina
Almira
Aeneas
Telford
Sherman
Rock lyn
Reardan
Mondovi
Lincoln
Laurier
Karamin
Gifford
Dulwich
Creston
Clayton
Clavton
Cedonia
Barstow
Aladdin
Wauconda
Waterloo
Republic
Nespelem
Frontier
Fairview
Danville
Chewelah
Bossburg
West Fork
Wellpinit
Northport
Loon Lake
Long Lake
Lone Pine
Leadpoint
Inchelium
Hazelwood
Gravelles
Goldstake
Fruitland
Fairchild
Davenport
Cozy NookBluecreek
Bingville
Belvedere
Springdale
Old Toroda
Mason City
Hesseltine
EnterpriseElmer City
Deer Trail
Deep Creek
Coulee Dam
Park Rapids
Onion Creek
Koontzville
Pinkney City
Old Wauconda
Litt le Falls
Kettle Falls
Fort Spokane
Carrs Corner
Seatons Grove
Electric City
Goldf ield Mill
Airway Heights
Bagdad Junct ion
East Heights (subdiv is ion)
Ferry
Stevens
Lincoln
Okanogan
Spokane
Grant
Douglas
Pend Oreille
Spokane Intl
\\Mi\gis\mi\C306_UCR_Teck-Cominco\t0404\BeachFSP_FigA1_05192008.mxd JP @ 02-23-2009
Proposed Beach
River Reach Delineations (USGS)
Figure A-1. Proposed 2009 Sampling Areas
Upper Columbia River, WA
Integral Parametrix
Seattle
PortlandSalem
Olympia90
5
O r e g o n
W a s h i n g t o n
0 105Miles
0 105Km

Kettle River
Sanpoil R
iver
Spokane River
Colville River
U . S . / C a n a d i a n B o r d e rU . S . / C a n a d i a n B o r d e r
597
676
745
617 640
700
712
730
395
2
20
21
155
174
231
292
28
232
21
20
21
231
Aladdin
Kin
er
V
Toro
d a C
reek
Addy Gifford
Springdale Hunters
Ced
onia
Addy
Coulee Hite
Kettle River
Deep
La
ke Boundary
Wes
t
Kroupa
Clu
gsto
n C
r eek
O
nio
n Cr
eek
Swen
son
Aeneas Valley
52
50
Crescen t
Bro
oks
Will
iam
s V
a lle
y
Gardenspot
Farwell
Gold Creek
Bia Road 64
3
Ward
Turk
Rice
Orin
Maud
Malo
Kewa
Hite
Ford
Echo
Bear
Addy
Waits
Miles
Lyons
Grays
Govan
Evans
Cline
Camas
Boyds
Bodie
Arden
Wilbur
Velvet
Valley
Tumtum
Toroda
Torboy
Spirit
Orient
Meteor
Marcus
Marble
Kulzer
Keller
Impach
Harter
Hanson
Curlew
Covada
Chesaw
Bissel
Arzina
Almira
Aeneas
Telford
Sherman
Rock lyn
Reardan
Mondovi
Lincoln
Laurier
Karamin
Hunters
Gifford
Dulwich
Creston
Cedonia
Barstow
Aladdin
Wauconda
Waterloo
Republic
Nespelem
Frontier
Fairview
Danville
Chewelah
Bossburg
West Fork
Wellpinit
Northport
Loon Lake
Long Lake
Lone Pine
Leadpoint
Inchelium
Hazelwood
Greenwood
Gravelles
Goldstake
Fruitland
Fairchild
Davenport
Cozy NookBluecreek
Bingville
Belvedere
Springdale
Seven Bays
Old Toroda
Hesseltine
EnterpriseElmer City
Deer Trail
Deep Creek
Park Rapids
Onion Creek
Koontzville
East Marcus
Pinkney City
Old Wauconda
Litt le Falls
Kettle Falls
Fort Spokane
Carrs Corner
Seatons Grove
Electric City
Goldf ield Mill
Airway Heights
Bagdad Junct ion
East Heights (subdiv is ion)
Ferry
Stevens
Lincoln
Okanogan
Spokane
Grant
Douglas
Pend Oreille
Spokane Intl
\\Mi\gis\mi\C306_UCR_Teck-Cominco\t0404\BeachFSP_FigA2_05192008.mxd JP @ 02-18-2009
USEPA 2005 Sediment Sample Locations
Beach
Bioassay
Transect
River Reach Delineations (USGS)
Recreation Sites (CH2M Hill 2004)
Campground
Boat-In Campsite
Boat Launch
Campground / Boat Launch
Marina / Campground
Figure A-2 EPA Phase I Beach, Transect, and BioassaySample Locations
Upper Columbia River, WA
Integral Parametrix
Seattle
Portland
Salem
Olympia90
84
5
W a s h i n g t o n
O r e g o n
I d a h o
0 105Miles
0 105Km

Kettle River
Sanpoil River
Spokane River
Colville River
U . S . / C a n a d i a n B o r d e rU . S . / C a n a d i a n B o r d e r
597
676
745
617 640
700
712
730
395
2
20
21
155
174
231
292
28
232
21
20
21
231
Aladdin
Kine
r
V
Torod
a Cree
k
Addy Gifford
Springdale Hunters
Cedo
n ia Addy
Coulee Hite
Kettle River
Deep La
ke Boundary
West
K roupa
Clug
ston C
r eek O
nion Cr ee
k
Swen
son
Aeneas Valley
52
50
Crescen t
Broo
ks
Willi
ams V
a lley
Gardenspot
Farwell
Gold Creek
Bia Road 64
3
Ward
Turk
Ryan
Rice
Orin
Maud
Malo
Kewa
Hite
Ford
Echo
Bear
Addy
Waits
Miles
Lyons
Grays
Govan
Evans
Cline
Camas
Boyds
Bodie
Arden
Wilbur
Velvet
Valley
Tumtum
Toroda
Torboy
Spirit
Orient
Meteor
Marble
Kulzer
Keller
Impach
Harter
Hanson
Curlew
Covada
Chesaw
Bissel
Arzina
Almira
Aeneas
Telford
Sherman
Rock lyn
Reardan
Mondovi
Lincoln
Laurier
Karamin
Hunters
Gifford
Dulwich
Creston
Cedonia
Barstow
Aladdin
Wauconda
Waterloo
Republic
Nespelem
Frontier
Fairview
Danville
Chewelah
Bossburg
West Fork
Wellpinit
Northport
Loon Lake
Long Lake
Lone Pine
Leadpoint
Inchelium
Hazelwood
Greenwood
Gravelles
Goldstake
Fruitland
Fairchild
Davenport
Cozy NookBluecreek
Bingville
BelvedereSpringdale
Seven Bays
Old Toroda
Hesseltine
EnterpriseElmer City
Deer Trail
Deep Creek
Park Rapids
Onion Creek
Koontzville
East Marcus
Pinkney City
Old Wauconda
Litt le Falls
Kettle Falls
Fort Spokane
Carrs Corner
Seatons Grove
Electric City
Goldf ield Mill
Airway Heights
Bagdad Junct ion
East Heights (subdiv is ion)
Ferry
Stevens
Lincoln
Okanogan
Spokane
Grant
Douglas
Pend Oreille
Spokane Intl
\\Mi\gis\mi\C306_UCR_Teck-Cominco\t0404\BeachFSP_FigA3_05192008.mxd JP @ 07-10-2008
Sample Locations by StudyCox et al. (2005)EPA Stevens County Mines and Mills Preliminary Assessments and Site Inspections (E&E 2002)EPA Expanded Site Inspection (USEPA 2003)Ecology Field Reconnaissance and Sediment Sampling Report (Ecology 2007)
"Popular Beaches" (USEPA 2006a)
River Reach Delineations (USGS)
Recreation Sites (CH2M Hill 2004)CampgroundBoat-In CampsiteBoat LaunchCampground / Boat LaunchMarina / Campground
Figure A-3 Other Historical Beach Sample Locations
Upper Columbia River, WA
Integral Parametrix
Seattle
PortlandSalem
Olympia90
84
5
O r e g o n
W a s h i n g t o n I d a h o
0 105Miles
0 105Km

Figure A-4. Organization Chart for the 2009 Beach Sediment Study for the UCR Site RI/FS. Notes: aSRC = Syracuse Research CorporationbAINW = Archaeological Investigations Northwest, Inc.
Teck—Project CoordinatorMarko Adzic
EPA—Project CoordinatorsKevin Rochlin & Monica Tonel
EPA—Quality Assurance ManagerGina Grepo-Grove
Human Health Risk AssessmentMarc Stifelman, EPA LeadBurt Shephard, EPA Lead
Gary Diamond, SRCa
Teck Technical Team CoordinatorDreas Nielsen, Integral
Remedial InvestigationLucinda Jacobs, Integral
Rick Cardwell, ParametrixPaul Paquin, HydroQual
Task Field SupervisorTo be determined
Task Safety OfficerTo be determined
Cultural Resource Coordinator AINW b
Database AdministratorDreas Nielsen, Integral
Task QA CoordinatorCraig Hutchings, Integral
Task Laboratory CoordinatorTo be determined
Laboratory Project ManagersTo be determined
Laboratory QA ManagersTo be determined
2009 Beach Study
Task ManagerDina Johnson, Integral
TABLES

Upper Columbia River Quality Assurance Project Plan—Beach Sediment Study
Integral Consulting Page 1 of 2 Parametrix, Inc.
Table A-1. Summary of the DQOs Developed for the 2009 Beach Sediment Study for the UCR Site RI/FS
Step 1: State the Problem
Step 2: Identify the Goals of the
Study Step 3:
Identify Information Inputs
Step 4: Define the Boundaries
of the Study Step 5:
Develop the Analytic Approach
Step 6: Specify the Performance or
Acceptance Criteria Step 7:
Optimize the Design for Obtaining Data The UCR RI/FS was initiated due to concerns regarding historical and continuing discharges into the Columbia River from the Teck Cominco Metals Limited (TCM) smelter near Trail, British Columbia. Emissions from the TCM smelter, historical and current, that have potential relevance to the UCR site include but are not limited to discharges of liquid effluents to the UCR; discharges of granulated slag to the UCR prior to mid-1995; accidental spills, “upsets”; and discharges to air. Other potential sources of chemicals of interest (COIs) for the Site including the Le Roi/Northport smelter, other mines and mills, other industrial processes, and municipal and nonpoint sources.
The conceptual site model for the Site identifies beach sediments as an exposure medium for people. Potential scenarios for exposure to COIs at UCR site beaches and shorelines may include: subsistence hunting, fishing, and gathering activities; residential activities; recreational activities (e.g., camping, swimming, boating); and occu-pational activities.
Preliminary risk calculations using available data on the concentrations of metals and other contaminants in surface sediment along the bed and banks of the UCR indicate that metals are the contaminants most likely to be of concern to human health (USEPA 2008). Preliminary estimates of cancer risks from incidental ingestion of dioxins/furans in surface sediment under the most intensive exposure scenario were quite low (9x10⁻⁸ to 5x10⁻⁶) and were usually 20–500 times lower than cancer risks from arsenic (USEPA 2008). Therefore, for the purposes of future surface sediment sampling efforts, EPA has decided
The goal of the study is to collect additional sediment data that will allow reliable characterization of risks to humans who are exposed to the sediments. These findings will be used by risk managers to help determine whether EPA must take action at one or more locations to ensure that risks to humans from beach sediments along the UCR do not exceed an acceptable level.
Two basic types of site-specific data are needed to determine the level of risk to humans exposed to sediments at specifically designated beach areas and other high-use bank shore areas along the UCR: 1. Reliable and represen-
tative measurements of the levels of chemicals that are present in beach sedi-ments that may be encountered during human exposure scenarios.
2. Reliable and represent-ative data on the routes and levels of human exposure to the sediments.
Because metals are one important class of contam-inants known to be of potential concern in sediments, two additional data needs include: 1. Estimates of the relative
bioavailability of metals in the sediment.
2. Data on the natural (“background”) level of metals in sediments.
Spatial—There are three independent variables that are important to characterize the spatial pattern of contaminant levels in beach sediments: 1. River mile—Available surface
sediment data indicate that, with few exceptions (e.g., beryllium, nickel, vanadium), concen-trations of most common metals tend to be highest in the upstream reaches of the UCR, and decrease as a function of distance downstream. In addition, there may be several other point and nonpoint sources along the length of the UCR that could contribute to contaminant levels. The investigation will focus on beach areas of probable human exposure along the river between the inter-national border and Grand Coulee Dam that have been identified based on public and community input.
2. Elevation above water—Because water levels are not constant over time, contaminant levels in beaches may also vary as a function of distance from the waters edge (i.e., elevation). The focus of this investigation is placed on characterization of sediments in the interval between minimum and maximum water elevations, because these sediments are exposed (i.e., are above water) for at least some part of the year and are the most likely source of human contact with sediments.
3. Depth below the surface—Because of varying rates of release and the effect of water flow, concentrations of contaminants in beach sediments may vary as a function of depth below the surface. Attention is focused on surface sediments (i.e., 0–6 in.),
Population Parameter—The 95 percent upper confidence limit (95UCL) of the long-term average sediment concentration.
Action Levels—Risk-based concentrations (RBCs) for incidental ingestion of sediment under a reasonable maximum exposure (RME) scenario and based on 1/10th the typical CERCLA cancer and noncancer risk thresholds (i.e., 1/10th the typical cancer risk of 1x10⁻⁴ and noncancer hazard quotient of 1). The RME scenario represents an individual from the population with the greatest potential for contact with sediments (i.e., the traditional subsistence scenario).
EPA summarized the RBC values to be used for risk management decisions as well as available information on typical background (reference) concentrations for metals in sediment and soil (see Table 1 of Tonel 2008a, pers. comm., in Appendix C). As seen, for some metals, the RBC is within the range of available reference concentrations, which under-scores the importance of collecting site-specific sediment data on background concentrations.
If the 95UCL concentration for a given exposure area is greater than or equal to the lowest RBC, then level of risk to the population with the greatest potential contact with beach sediments will be considered unacceptable.
Statistical Hypotheses—Based on a presumption of contam–ination, the baseline condition (null hypothesis, H0) and alternative condition are as follows:
H0: The true mean concen-tration of chemical i in sediment is greater than or equal to the sediment RBC.
HA: The true mean concen-tration of chemical i in sediment is less than the sediment RBC.
Unless there is conclusive information from the collected data to reject H0 for HA, it will be assumed that the baseline condition is true.
Decision Errors—Rejecting H0 when it is actually true (i.e., false rejection decision error) may leave humans exposed to unacceptable levels of contam-inants in beach sediments. Failing to reject H0 when it is actually false does not result in unacceptable human exposure, but may result in unnecessary expenditure of resources. The probability that decisions errors could result will be controlled as follows: • Use of the 95UCL to estimate
exposure and risk provides a high confidence that the risk estimates are more likely to be high than low, and there is no more than a 5 percent probability that the true mean is above the RBC (i.e., limits probability of a false rejection error).
• The sample collection scheme and number of samples collected will be sufficient to narrow the uncertainty distribution around the mean ensuring that, if the true mean is ≤ ½ the RBC, then risk
Surface Sediments—As summarized in Tonel (2008a, pers. comm.), in the baseline HHRA, EPA will assume that exposures are random over an exposure area, and risk from a chemical is related to the arithmetic mean concentration of that chemical averaged over the entire exposure area. Thus, capturing spatial variability within a designated exposure area is not necessary. EPA believes the natural unit of exposure is no smaller than a beach, so a sampling methodology that incorporates collection of samples across a beach addresses the data needs for the baseline HHRA. To ensure that samples are representative of the beach being investigated, the grab sampling points will be spatially distributed across the entire beach. This ensures that if “hot spots” of contamination are present at a beach, they would be represented in approximate proportion to their areal extent.
Tonel (2008a, pers. comm. and 2008b, pers. comm., in Appendix C) detail the statistical data evaluation underlying the proposed sampling design. Key elements of the sampling design are highlighted below: • For each of the 34 beaches sampled, five composites of
surface sediment 0–6 in. (0–15 cm) samples will be collected. Each composite sample will contain subsamples from 12 unique sampling locations at each beach.
• Surface sediment samples will be analyzed for the following parameters: − Grain size distribution in whole sediment for all
composite samples from each beach. − Conventional parameters (pH, total organic carbon
[TOC], percent moisture, and total sulfides) in sieved sediment (<2 mm) for all composite samples from each beach.
− TAL metals/metalloids and elemental uranium in sieved sediment (<2 mm) for all composite samples from each beach.
− Uranium-238 and radium-226 in sieved sediment (<2 mm) for select surface sediment composites
− TAL metals/metalloids and elemental uranium in each of the following sediment fractions: 2 mm to 250 µm, 250 µm to 125 µm, 125 µm to 63 µm, and < 63 µm for one surface composite sample from each beach.
− In vitro bioaccessibility assays for arsenic, lead, and other metals on the following size fractions: < 250 µm, 250 µm to 125 µm, 125 µm to 63 µm, and < 63 µm.
• At each of the 34 beaches sampled, subsurface sediment core samples (i.e., 0–30 in.; 0–75 cm or to refusal) will be collected at five different randomly selected locations. Three depth intervals from each core will be analyzed: 0–

Upper Columbia River Quality Assurance Project Plan—Beach Sediment Study
Integral Consulting Page 2 of 2 Parametrix, Inc.
Table A-1. Summary of the DQOs Developed for the 2009 Beach Sediment Study for the UCR Site RI/FS
Step 1: State the Problem
Step 2: Identify the Goals of the
Study Step 3:
Identify Information Inputs
Step 4: Define the Boundaries
of the Study Step 5:
Develop the Analytic Approach
Step 6: Specify the Performance or
Acceptance Criteria Step 7:
Optimize the Design for Obtaining Data to focus on metals and radionuclides1 (e.g., U-238 and Ra-226), and rely on previously collected data to assess risks from dioxins/furans.
While the existing surface sediment data set does provide information on spatial and temporal variability for a majority of the metals of interest, additional surface sediment data are needed to provide: • Measured target analyte list
(TAL) metal/metalloids, uranium, and radionuclide sediment concentrations for some beaches that are of importance for human use
• Site-specific information on relative bioavailability for metals in sediment
• Data on the variation of concentration of metals as a function of grain size.
As discussed in the draft human health risk assessment (HHRA) work plan for the UCR (USEPA 2008), data on the concentrations of COIs from subsurface sediment samples from beaches and shorelines along the UCR are not sufficient to characterize the nature and extent of potential subsurface contamination for the purposes of evaluating human exposures. Additional subsurface sediment data are needed to provide: • Data on the variation of
concentration measured TAL metal/metalloid concentrations as a function of sediment depth at some beaches that are of importance for human use
• Measured uranium, radionuclide, and organics sediment concen–trations for some beaches that are of importance for human use.
because these are the sediments that are likely to be contacted by most human receptors at the Site. However, subsurface sediments (>6 in.) may be of potential concern for humans who are exposed during construction, maintenance, or other excavation scenarios. Thus, collection of subsurface sediment sample cores at select surface sample locations will be conducted to quantify observed COI concentration trends as a function of depth.
Temporal—Because the medium of interest for evaluating human exposures is exposed sediment, the time frame of interest for the collection of beach sediments is primarily dictated by when the sediments are exposed. Therefore, sediment sample collection should be performed during the spring reservoir drawdown (i.e., late April-early May) for locations below Little Dalles (the portion of the UCR most influenced by the reservoir) and in early fall for locations above Little Dalles, when river discharge is at its typical seasonal low and side bank sediments are likely to be maximally exposed.
(calculated based on the 95UCL) will not be deemed unacceptable more than 20 percent of the time (i.e., limits probability of a false acceptance error).
• Target analytical methods will be selected to represent the best available analytical techniques, as appropriate, and to ensure that detection limits are sufficiently low to calculate meaningful risk estimates for human health (i.e., limits probability of total decision error) (Table A-7).
• Samples will be collected and analyzed in accordance with EPA-approved field and laboratory quality assurance and quality control (QA/QC) requirements (i.e., limits probability of total decision error).
6 in. (0–15 cm), 6–18 in. (15–45 cm), and 18–30 in. (45–75 cm).
• Subsurface sediment samples will be analyzed for the following parameters: − TAL metals/metalloids in sieved sediment (<2 mm) for
each of three depth strata from five subsurface cores from each beach.
− Grain size distribution in whole sediment for each of three depth strata composite samples from each beach.
− Conventional parameters (pH, TOC, percent moisture, and total sulfides) in sieved sediment (<2 mm) for each of three depth strata composite samples from each beach.
− Pesticides, semivolatile organic compounds, polycyclic aromatic hydrocarbons, and polychlorinated biphenyls (as Aroclors) in sieved sediment (<2 mm) for each of three depth strata composite samples from each beach.
− PCB congeners, dioxin/furan congeners, and polybrominated diphenyl ethers in sieved sediment (<2 mm) for each depth strata composite sample from each beach with a TOC concentration greater than 1 percent.
• Surface and subsurface samples will be archived for possible analysis of the following parameters: − Uranium-238 andrRadium-226 in sieved sediment
(<2 mm) for all surface and subsurface sediment composites not submitted for initial analysis
− Particle density (including specific gravity) and percent granular slag composition in whole sediment.
• Designated beach areas represent portions of nearshore area that is exposed during periods of low water levels and that have been identified as important to human use based on feedback from the public and other interested parties.
• Based on the physical characteristics observed at each beach or due to cultural resource concerns, alternate grab sampling points may be substituted at the discretion of the field supervisor in consultation with the cultural resource representative.
• Figures 2-3 through 2-36 of the FSP (Appendix A to this QAPP) show the locations of grab sampling points anticipated at each beach that will be sampled. Reserved alternate sampling points are also shown.
Additional discussion of sampling locations, depth intervals, compositing schemes, and analytical methods are presented in the FSP (Appendix A to this QAPP).
1 Uranium-238 and radium-226 were added to the list of COIs in response to comments from the participating parties on the draft HHRA work plan (USEPA 2008a).

Upper Columbia RiverQuality Assurance Project Plan—Beach Sediment Study
Table A-2. Summary of Beaches Selected for Inclusion in the Planned Study.
Reach IndexApprox.
River Mile LocationDescending
Bank Identified By
Approximate Expected Water
Elevation (ft amsl)
Approximate Maximum Upper
Elevation of Sample Area (ft
amsl)
Total Area of Selected
Beach (m2)
Total Area of Selected
Beach (ft2)1 742 Black Sand Beach L Phase I findings 1280 - 1290 1332 15,324 164,9432 740 Upper Columbia R.V. Park L Public meeting 1280 - 1290 1325 10,864 116,9403 735 Northport Beach L Phase I findings 1270 - 1280 1290 73,571 791,9104 730 Onion Creek L DOI, STI 1270 - 1290 1296 18,713 201,4285 729 Dalles Orchard L Phase I findings 1270 - 1290 1290 5,081 54,6886 723 China Bend R DOI 1240 - 1250 1290 402,432 4,331,7387 722 Depositional area just downstream from China Bend R DOI 1230 - 1240 1296 23,412 252,0078 716 Bossburg Flat L Ecology 1230 - 1240 1290 12,906 138,9209 714 Snag Cove R Ecology 1240 - 1250 1296 68,432 736,60010 711 Evans Campground/Beach L Ecology 1230 - 1240 1290 200,141 2,154,30011 711 Summer Island R DOI, CCT 1240 - 1250 1290 452,377 4,869,34012 707 Kamloops Island R Ecology 1240 - 1250 1358 31,497 339,03013 704 Welty Bay L DOI 1230 - 1240 1290 372,211 4,006,44314 700 Kettle Falls Marina L DOI 1220 - 1230 1290 20,366 219,22115 700 Lyons Island L DOI 1210 - 1220 1290 326,782 3,517,45516 699 Colville Flats L DOI, public meeting 1230 - 1240 1290 378,869 4,078,11517 699 Colville River L DOI, STI 1230 - 1240 1290 264,886 2,851,20818 693 Bradbury Beach L DOI, public meeting 1230 - 1240 1290 149,068 1,604,55419 687 Barnaby Island Campground R CCT 1250 - 1260 1290 432,320 4,653,45220 671 AA Campground 2 R CCT 1240 - 1250 1318 33,122 356,51921 661 Nez Perce Creek R CCT 1230 - 1240 1302 155,070 1,669,15522 661 Hunters L DOI, STI 1230 - 1240 1290 225,320 2,425,32023 654 Enterprise L DOI 1240 - 1250 1290 144,865 1,559,31224 653 Wilmont Creek R STI, CCT 1230 - 1240 1290 175,541 1,889,51225 650 Naborlee L DOI 1240 - 1250 1290 123,021 1,324,19226 649 Mitchell Point R CCT 1220 - 1230 1290 59,917 644,94027 645 McGuire's L STI 1220 - 1230 1290 118,227 1,272,58528 636 Seven Bays L DOI 1240 - 1250 1305 63,745 686,14129 634 Mouth of Hawk Creek L DOI, CCT 1250 - 1270 1315 64,629 695,66130 624 Whitestone Campground R CCT 1230 - 1240 1309 44,517 479,18031 620 Jones Bay L DOI 1230 - 1250 1290 165,896 1,785,68832 605 Swawilla Basin R CCT 1240 - 1260 1290 100,062 1,077,05333 599 Spring Canyon L DOI 1240 - 1250 1296 96,286 1,036,41334 597 Crescent Bay L DOI 1290 - 1260 1290 15,790 169,957
Notes:CCT = Confederated Tribes of the Colville ReservationDOI = U.S. Department of the InteriorEcology = Washington State Department of EcologyL = LeftR = RightSTI = Spokane Tribe of Indiansft = feetamsl = above mean sea levelft2 = square feetm2 = square meter
5
6
1
2
3
4
Integral Consulting Inc. 1 of 1 Parametrix, Inc.

Upper Columbia RiverQuality Assurance Project Plan—Beach Sediment Study
Table A-3. Task Team Contact Information.
Name Task Role Phone Fax EmailTeck American IncorporatedMarko Adzic Teck Project Coordinator (509) 892-2585 (509) 459-4400 [email protected]
U.S. Environmental Protection AgencyKevin Rochlin EPA Project Coordinator 206-553-2106 TBD [email protected] Tonel EPA Project Coordinator 206-553-0323 TBD [email protected] Grepo-Grove EPA Quality Assurance (QA) Manager 206-553-1632 TBD [email protected]
Consultant TeamDreas Nielsen, Integral Teck Technical Team Coordinator 206-957-0311 206-230-9601 [email protected] Johnson, Integral Task Manager 206-957-0329 206-230-9601 [email protected] Field Supervisor, TBD Task Field Supervisor TBD TBD TBDCraig Hutchings, Integral Task QA Coordinator 360-705-3534 x17 360-705-3669 [email protected] Laboratory Coordinator, TBD Task Laboratory Coordinator TBD TBD TBDDreas Nielsen, Integral Database Administrator 206-957-0311 206-230-9601 [email protected] Safety Officer, TBD Task Safety Officer TBD TBD TBD
LaboratoriesAnalytical Chemistry, TBD Laboratory Project Manager TBD TBD TBDAnalytical Chemistry, TBD Laboratory QA Manager TBD TBD TBDRadiochemical Testing, TBD Laboratory Project Manager TBD TBD TBDRadiochemical Testing, TBD Laboratory QA Manager TBD TBD TBD
Notes:TBD = To be determined
Integral Consulting Inc. 1 of 1 Parametrix, Inc.

Upper Columbia RiverQuality Assurance Project Plan—Beach Sediment Study
Table A-4. Estimated Numbers of Site and Field QC Samples.
Number of Samples
Chemical AnalysisField
SamplesField Replicate
SamplesaField Split Samplesa
Equipment Rinse Blanksb Total
Surface SedimentConventional Parameters (whole sediments)Grain size distribution 170 0 9 0 179Conventional Parameters (less than 2 mm fraction)pH 170 0 9 0 179Total organic carbon 170 0 9 0 179Percent moisture 170 0 9 0 179Total sulfides 170 0 9 0 179Metals/Metalloids and Uranium (less than 2 mm fraction)TAL metals/metalloids 170 0 9 9 188Elemental uranium 170 0 9 9 188TAL Metals/Metalloids and Uranium - Fine Fraction2 mm to 250 µm 34 0 0 0 34250 µm to 125 µm 34 0 0 0 34125 µm to 63 µm 34 0 0 0 34< 63 µm 34 0 0 0 34In Vitro Bioaccessibility Assay for Lead, Arsenic, and Other Metals< 250 µm 34 0 0 0 34250 µm to 125 µm 34 0 0 0 34125 µm to 63 µm 34 0 0 0 34< 63 µm 34 0 0 0 34Radionuclides (less than 2 mm fraction)Radium-226 9 0 0 0 0Uranium-238 9 0 0 0 0Radionuclides (archive; less than 2 mm fraction)Radium-226 161 0 9 9 179Uranium-238 161 0 9 9 179
Subsurface SedimentConventional Parameters (whole sediments)Grain size distribution 495 0 25 0 520
Integral Consulting Inc. 1 of 2 Parametrix, Inc.

Upper Columbia RiverQuality Assurance Project Plan—Beach Sediment Study
Table A-4. Estimated Numbers of Site and Field QC Samples.
Number of Samples
Chemical AnalysisField
SamplesField Replicate
SamplesaField Split Samplesa
Equipment Rinse Blanksb Total
Conventional Parameters (less than 2 mm fraction)pH 495 0 25 0 520Total organic carbon 495 0 25 0 520Percent moisture 495 0 25 0 520Total sulfides 495 0 25 0 520Metals/Metalloids and Uranium (less than 2 mm fraction)TAL metals/metalloids 495 0 25 25 545Elemental uranium 99 0 5 0 104Organics (less than 2 mm fraction)PCBs (Aroclors) 99 0 5 0 104PCB congeners (All 209) c 99 0 5 0 104Dioxins/furans c 99 0 5 0 104PBDEs c 99 0 5 0 104Pesticides 99 0 5 0 104PAHs 99 0 5 0 104SVOCs 99 0 5 0 104Radionuclides (archive; less than 2 mm fraction)Radium-226 99 0 5 0 104Uranium-238 99 0 5 0 104
Notes:a The collection frequency for field replicate and split samples is one per beach.b An equipment rinsate blank will be collected at a frequency of 1 per beach.c These are to be analyzed only if total organic carbon is >1 percent.
Integral Consulting Inc. 2 of 2 Parametrix, Inc.
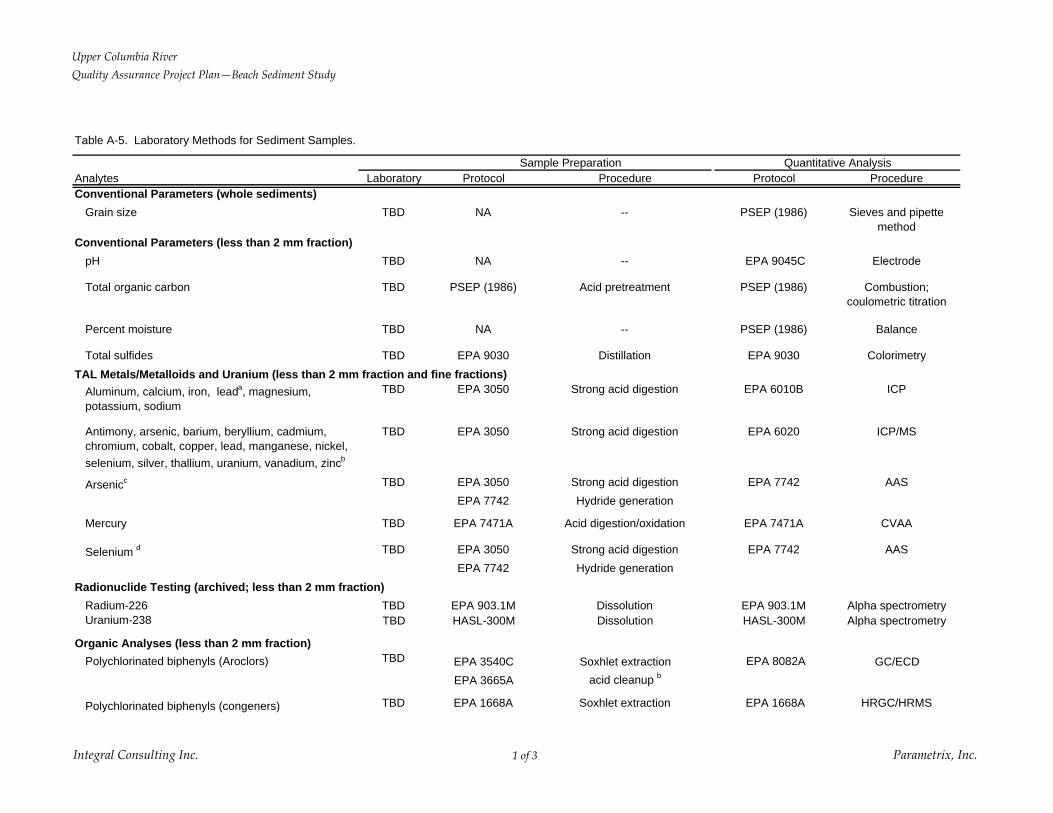
Upper Columbia RiverQuality Assurance Project Plan—Beach Sediment Study
Table A-5. Laboratory Methods for Sediment Samples.
Sample Preparation Quantitative AnalysisAnalytes Laboratory Protocol Procedure Protocol ProcedureConventional Parameters (whole sediments)
Grain size TBD NA -- PSEP (1986) Sieves and pipette method
Conventional Parameters (less than 2 mm fraction)pH TBD NA -- EPA 9045C Electrode
Total organic carbon TBD PSEP (1986) Acid pretreatment PSEP (1986) Combustion; coulometric titration
Percent moisture TBD NA -- PSEP (1986) Balance
Total sulfides TBD EPA 9030 Distillation EPA 9030 ColorimetryTAL Metals/Metalloids and Uranium (less than 2 mm fraction and fine fractions)
Aluminum, calcium, iron, leada, magnesium, potassium, sodium
TBD EPA 3050 Strong acid digestion EPA 6010B ICP
Antimony, arsenic, barium, beryllium, cadmium, chromium, cobalt, copper, lead, manganese, nickel, selenium, silver, thallium, uranium, vanadium, zincb
TBD EPA 3050 Strong acid digestion EPA 6020 ICP/MS
Arsenicc TBD EPA 3050 Strong acid digestion EPA 7742 AASEPA 7742 Hydride generation
Mercury TBD EPA 7471A Acid digestion/oxidation EPA 7471A CVAA
Selenium d TBD EPA 3050 Strong acid digestion EPA 7742 AASEPA 7742 Hydride generation
Radionuclide Testing (archived; less than 2 mm fraction)Radium-226 TBD EPA 903.1M Dissolution EPA 903.1M Alpha spectrometryUranium-238 TBD HASL-300M Dissolution HASL-300M Alpha spectrometry
Organic Analyses (less than 2 mm fraction)Polychlorinated biphenyls (Aroclors) TBD EPA 3540C Soxhlet extraction EPA 8082A GC/ECD
EPA 3665A acid cleanup b
Polychlorinated biphenyls (congeners) TBD EPA 1668A Soxhlet extraction EPA 1668A HRGC/HRMS
Integral Consulting Inc. 1 of 3 Parametrix, Inc.

Upper Columbia RiverQuality Assurance Project Plan—Beach Sediment Study
Table A-5. Laboratory Methods for Sediment Samples.
Sample Preparation Quantitative AnalysisAnalytes Laboratory Protocol Procedure Protocol Procedure
Gel permeation chromatography
Acid/base silica column d
Florisil® chromatography d
Carbopack/Celite cleanup d
HPLC cleanup d
Dioxins/furans TBD EPA 1613B Soxhlet extraction EPA 1613B HRGC/HRMSGel permeation chromatography
Acid/base silica column d
Florisil® chromatography d
Carbon celite d
Layered silver nitrate/acid/base silica d
Alumina cleanup d
HPLC cleanup d
Polybrominated diphenyl ethers TBD EPA 1614 Soxhlet extraction EPA 1614 HRGC/HRMSGel permeation chromatography
Acid/base silica column d
Florisil® chromatography d
Alumina cleanup d
Polycyclic aromatic hydrocarbons TBD EPA 3540 / 3541 Soxhlet / Automated Soxhlet t ti
EPA 8270 (modified) GC/MS-SIMEPA 3640A Gel permeation chromatographyEPA 3630C Silica gel cleanup
Pesticides TBD EPA 3540C Soxhlet extraction EPA 8081B or 1856A GC/ECDEPA 3620C Florisil® chromatographyEPA 3640A Gel permeation chromatography
Semivolatile organic hydrocarbons TBD EPA 3540 / 3541 Soxhlet / Automated Soxhlet t ti
EPA 8270D or 1625 GC/MS
Integral Consulting Inc. 2 of 3 Parametrix, Inc.

Upper Columbia RiverQuality Assurance Project Plan—Beach Sediment Study
Table A-5. Laboratory Methods for Sediment Samples.
Sample Preparation Quantitative AnalysisAnalytes Laboratory Protocol Procedure Protocol Procedure
EPA 3640A Gel permeation chromatography
IVBA for lead, arsenic, and other metalse TBD USEPA (2007a) Buffered glycerin extraction EPA 6020/7742 ICP/MS; AAS
Notes:AAS = atomic absorption spectrometryCVAA = cold vapor atomic absorption spectrometryECD = electron capture detectorEPA = US Environmental Protection AgencyGC = gas chromatographyHASL = U.S. Atomic Energy Commission Health and Safety LaboratoryHRGC = high-resolution gas chromatographyHRMS = high-resolution mass spectrometryICP = inductively coupled plasma/mass spectrometryIVBA = in vitro bioaccessibility assayMS = mass spectrometryNA = not applicablePSEP = Puget Sound Estuary ProgramSIM = selective ion monitoringSOP = standard operating procedureTAL = Target Analyte ListTBD = to be determined; this information will be provided once the laboratories have been selected.a Lead will be analyzed by EPA Method 6020 if it is not detected at the MRL by EPA Method 6010.b Metals may be reported by EPA Method 6010 rather than EPA Method 6020 if the analyte concentrations are sufficiently high.c Arsenic may need to be analyzed by EPA Method 7062 if it is not detected at the MRL by EPA Method 6020.d Selenium will be analyzed by EPA Method 7742 if it is not detected at the MRL by EPA Method 6020.e See USEPA (2007a).
Integral Consulting Inc. 3 of 3 Parametrix, Inc.

Upper Columbia RiverQuality Assurance Project Plan—Beach Sediment Study
Table A-6. Size Fractions Included in Grain Size Analysis.
U.S. Standard TylerDesignation of retained material Size (mm) phi Sieve No. Sieve No.Wet Sieve Analysis
Cobbles and above 64 -6Φ 2-1/2 in. --Very coarse gravel 32 -5Φ 1-1/4 in. --Coarse gravel 16 -4Φ 5/8 in. 0.624 in.Medium gravel 8 -3Φ 5/16 in. 2-1/2 meshFine gravel 4 -2Φ No. 5 5 meshVery fine gravel 2 -1Φ No. 10 9 meshVery coarse sand 1 0Φ No. 18 16 meshCoarse sand 0.5 1Φ No. 35 32 meshMedium sand 0.25 2Φ No. 60 60 meshFine sand 0.125 3Φ No. 120 115 meshVery fine sand 0.063 4Φ No. 230 250 mesh
Pipette AnalysisSilt 0.004 8Φ -- --Clay 0.001 10Φ -- --
Dry Sieve Analysis of Fine Fraction Used for Metals AnalysisFines 0.063 4Φ No. 230 250 mesh
Integral Consulting Inc. 1 of 1 Parametrix, Inc.

Upper Columbia RiverQuality Assurance Project Plan—Beach Sediment Study
Table A-7. Analytes, Method Reporting Limits, and Human Health Screening Values for Beach Sediment Samples.
Rochlin (2008, pers. comm.; 2009, pers. comm.) USEPA (2008b) USEPA (2006c)
Analyte CAS number MDLa MRLa,b,c
Traditional Subsistence Scenario
RBC2005 Mean Sediment
Detection Limit Recreational PRGsChemical Analyses
Conventional and Geotechnical AnalysesGrain size (percent) -- NA 0.1 -- -- --pH (pH units) -- NA NA -- -- --Total organic carbon (percent) -- 0.02 0.05 -- -- --Total solids (percent of whole weight) -- 0.01 0.01 -- -- --Total sulfides (mg/kg) -- 0.03 0.5 -- -- --TAL Metals/Metalloids and Uranium (mg/kg)Aluminum 7429-90-5 10 10 5,733 -- --Antimony 7440-36-0 0.02 0.05 2.3 1.6 521Arsenic 7440-38-2 0.07 / 0.05e 0.5 / 0.1e 0.11 -- 16Barium 7440-39-3 0.03 0.05 1,147 -- --Beryllium 7440-41-7 0.006 0.02 11 -- --Cadmium 7440-43-9 0.007 0.05 5.7 0.13 --Calcium 7440-70-2 3 10 -- -- --Chromium 7440-47-3 0.04 0.2 8,600 -- --Cobalt 7440-48-4 0.01 0.02 115 -- --Copper 7440-50-8 0.02 0.1 229 -- 52,143Iron 7439-89-6 3 4 4,013 -- 782,143Lead 7439-92-1 0.02 0.05 400 -- 400Magnesium 7439-95-4 2 4 -- -- --Manganese 7439-96-5 0.04 0.1 268 -- 60,833Mercury 7439-97-6 0.01 0.02 1.7 0.057 --Nickel 7440-02-0 0.04 0.2 115 -- --Potassium 7440-09-7 300 400 -- -- --Selenium 7782-49-2 0.2 1 29 2.5 --Silver 7440-22-4 0.003 0.02 29 1.0 --Sodium 7440-23-5 10 20 -- -- --Thallium 7440-28-0 0.002 0.02 0.40 2.3 --Uranium 7440-61-1 0.004 0.02 17 20 --Vanadium 7440-62-2 0.03 0.2 5.7 -- 261Zinc 7440-66-6 0.2 0.5 1,720 -- --Pesticides (μg/kg-dry weight)2,4'-DDD 53-19-0 0.16 0.2 0.85 0.73 --4,4'-DDD 72-54-8 0.073 0.2 0.85 0.73 --Total DDD -- -- -- -- -- --2,4'-DDE 3424-82-6 0.046 0.2 0.6 0.73 --4,4'-DDE 72-55-9 0.027 0.2 0.6 0.73 --Total DDE -- -- -- -- -- --2,4'-DDT 789-02-6 0.061 0.2 0.6 0.73 --4,4'-DDT 50-29-3 0.18 0.2 0.6 0.75 --Total DDT -- -- -- -- -- --Total DDx -- -- -- -- -- --Aldrin 309-00-2 0.12 0.2 0.012 0.36 --alpha-BHC 319-84-6 0.097 0.2 0.032 0.36 --beta-BHC 319-85-7 0.14 0.2 0.11 0.36 --delta-BHC 319-86-8 0.11 0.2 -- 0.36 --alpha-Chlordane (cis-) 5103-71-9 0.031 0.2 0.58 0.36 --gamma-BHC (Lindane) 58-89-9 0.062 0.2 0.58 0.36 --gamma-Chlordane (trans-) 5103-74-2 0.027 0.2 -- 0.36 --cis-Nonachlor 5103-73-1 0.087 0.2 -- 0.36 --trans-Nonachlor 39765-80-5 0.034 0.2 -- 0.36 --Oxychlordane 27304-13-8 0.061 0.2 -- 0.36 --Total Chlordane -- -- -- -- -- --Dieldrin 60-57-1 0.03 0.2 0.013 0.73 --Endosulfan I 959-98-8 0.037 0.2 34 0.36 --Endosulfan II 33213-65-9 0.031 0.2 34 0.73 --Endosulfan sulfate 1031-07-8 0.058 0.2 34 0.73 --Endrin 72-20-8 0.071 0.2 1.7 0.73 --Endrin aldehyde 7421-93-4 0.042 0.2 -- 0.73 --Endrin ketone 53494-70-5 0.029 0.2 -- 0.73 --Heptachlor 76-44-8 0.076 0.2 0.045 0.36 --Heptachlor epoxide 1024-57-3 0.068 0.2 0.022 0.36 --Hexachlorobenzene 118-74-1 0.068 0.2 0.13 0.36 --Hexachlorobutadiene 87-68-3 0.14 0.2 2.6 0.36 --Methoxychlor 72-43-5 0.075 0.2 29 3.6 --Toxaphene 8001-35-2 3.4 10 0.18 36 --Semivolatile Organic Compounds (μg/kg-dry weight)1,1'-Biphenyl 92-52-4 -- -- 287 90 --1,2,4-Trichlorobenzene 120-82-1 2.6 10 57 90 --1,2-Dichlorobenzene 95-50-1 2.9 10 516 90 --1,3-Dichlorobenzene 541-73-1 3 10 -- 90 --1,4-Dichlorobenzene 106-46-7 2.9 10 37.7 90 --2,2'-oxybis(1-Chloropropane) -- -- -- 2.9 90 --2,4,5-Trichlorophenol 95-95-4 1.5 10 573 229 --2,4,6-Trichlorophenol 88-06-2 1.4 10 5.7 90 --2,4-Dichlorophenol 120-83-2 1 10 17 90 --2,4-Dimethylphenol 105-67-9 5.5 50 115 90 --2,4-Dinitrophenol 51-28-5 17 200 11 232 --2,4-Dinitrotoluene 121-14-2 1.5 10 11 90 --
Human Health Screening Values
Integral Consulting Inc. 1 of 3 Parametrix, Inc.
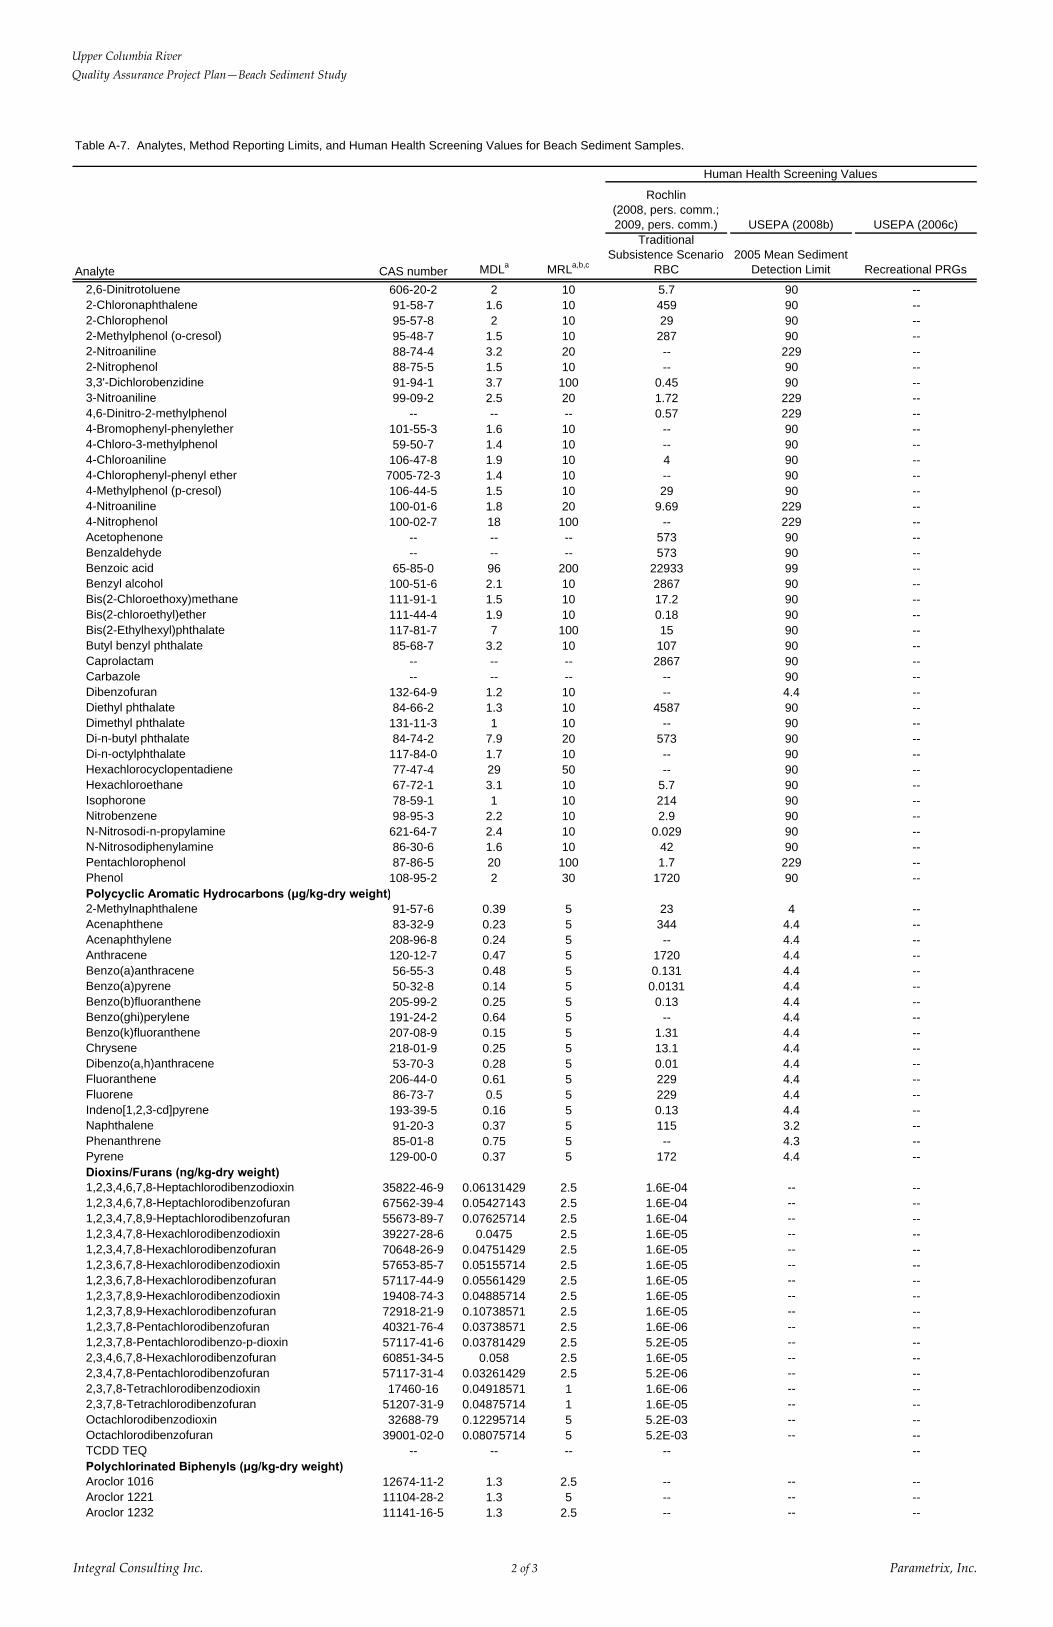
Upper Columbia RiverQuality Assurance Project Plan—Beach Sediment Study
Table A-7. Analytes, Method Reporting Limits, and Human Health Screening Values for Beach Sediment Samples.
Rochlin (2008, pers. comm.; 2009, pers. comm.) USEPA (2008b) USEPA (2006c)
Analyte CAS number MDLa MRLa,b,c
Traditional Subsistence Scenario
RBC2005 Mean Sediment
Detection Limit Recreational PRGs
Human Health Screening Values
2,6-Dinitrotoluene 606-20-2 2 10 5.7 90 --2-Chloronaphthalene 91-58-7 1.6 10 459 90 --2-Chlorophenol 95-57-8 2 10 29 90 --2-Methylphenol (o-cresol) 95-48-7 1.5 10 287 90 --2-Nitroaniline 88-74-4 3.2 20 -- 229 --2-Nitrophenol 88-75-5 1.5 10 -- 90 --3,3'-Dichlorobenzidine 91-94-1 3.7 100 0.45 90 --3-Nitroaniline 99-09-2 2.5 20 1.72 229 --4,6-Dinitro-2-methylphenol -- -- -- 0.57 229 --4-Bromophenyl-phenylether 101-55-3 1.6 10 -- 90 --4-Chloro-3-methylphenol 59-50-7 1.4 10 -- 90 --4-Chloroaniline 106-47-8 1.9 10 4 90 --4-Chlorophenyl-phenyl ether 7005-72-3 1.4 10 -- 90 --4-Methylphenol (p-cresol) 106-44-5 1.5 10 29 90 --4-Nitroaniline 100-01-6 1.8 20 9.69 229 --4-Nitrophenol 100-02-7 18 100 -- 229 --Acetophenone -- -- -- 573 90 --Benzaldehyde -- -- -- 573 90 --Benzoic acid 65-85-0 96 200 22933 99 --Benzyl alcohol 100-51-6 2.1 10 2867 90 --Bis(2-Chloroethoxy)methane 111-91-1 1.5 10 17.2 90 --Bis(2-chloroethyl)ether 111-44-4 1.9 10 0.18 90 --Bis(2-Ethylhexyl)phthalate 117-81-7 7 100 15 90 --Butyl benzyl phthalate 85-68-7 3.2 10 107 90 --Caprolactam -- -- -- 2867 90 --Carbazole -- -- -- -- 90 --Dibenzofuran 132-64-9 1.2 10 -- 4.4 --Diethyl phthalate 84-66-2 1.3 10 4587 90 --Dimethyl phthalate 131-11-3 1 10 -- 90 --Di-n-butyl phthalate 84-74-2 7.9 20 573 90 --Di-n-octylphthalate 117-84-0 1.7 10 -- 90 --Hexachlorocyclopentadiene 77-47-4 29 50 -- 90 --Hexachloroethane 67-72-1 3.1 10 5.7 90 --Isophorone 78-59-1 1 10 214 90 --Nitrobenzene 98-95-3 2.2 10 2.9 90 --N-Nitrosodi-n-propylamine 621-64-7 2.4 10 0.029 90 --N-Nitrosodiphenylamine 86-30-6 1.6 10 42 90 --Pentachlorophenol 87-86-5 20 100 1.7 229 --Phenol 108-95-2 2 30 1720 90 --Polycyclic Aromatic Hydrocarbons (μg/kg-dry weight)2-Methylnaphthalene 91-57-6 0.39 5 23 4 --Acenaphthene 83-32-9 0.23 5 344 4.4 --Acenaphthylene 208-96-8 0.24 5 -- 4.4 --Anthracene 120-12-7 0.47 5 1720 4.4 --Benzo(a)anthracene 56-55-3 0.48 5 0.131 4.4 --Benzo(a)pyrene 50-32-8 0.14 5 0.0131 4.4 --Benzo(b)fluoranthene 205-99-2 0.25 5 0.13 4.4 --Benzo(ghi)perylene 191-24-2 0.64 5 -- 4.4 --Benzo(k)fluoranthene 207-08-9 0.15 5 1.31 4.4 --Chrysene 218-01-9 0.25 5 13.1 4.4 --Dibenzo(a,h)anthracene 53-70-3 0.28 5 0.01 4.4 --Fluoranthene 206-44-0 0.61 5 229 4.4 --Fluorene 86-73-7 0.5 5 229 4.4 --Indeno[1,2,3-cd]pyrene 193-39-5 0.16 5 0.13 4.4 --Naphthalene 91-20-3 0.37 5 115 3.2 --Phenanthrene 85-01-8 0.75 5 -- 4.3 --Pyrene 129-00-0 0.37 5 172 4.4 --Dioxins/Furans (ng/kg-dry weight)1,2,3,4,6,7,8-Heptachlorodibenzodioxin 35822-46-9 0.06131429 2.5 1.6E-04 -- --1,2,3,4,6,7,8-Heptachlorodibenzofuran 67562-39-4 0.05427143 2.5 1.6E-04 -- --1,2,3,4,7,8,9-Heptachlorodibenzofuran 55673-89-7 0.07625714 2.5 1.6E-04 -- --1,2,3,4,7,8-Hexachlorodibenzodioxin 39227-28-6 0.0475 2.5 1.6E-05 -- --1,2,3,4,7,8-Hexachlorodibenzofuran 70648-26-9 0.04751429 2.5 1.6E-05 -- --1,2,3,6,7,8-Hexachlorodibenzodioxin 57653-85-7 0.05155714 2.5 1.6E-05 -- --1,2,3,6,7,8-Hexachlorodibenzofuran 57117-44-9 0.05561429 2.5 1.6E-05 -- --1,2,3,7,8,9-Hexachlorodibenzodioxin 19408-74-3 0.04885714 2.5 1.6E-05 -- --1,2,3,7,8,9-Hexachlorodibenzofuran 72918-21-9 0.10738571 2.5 1.6E-05 -- --1,2,3,7,8-Pentachlorodibenzofuran 40321-76-4 0.03738571 2.5 1.6E-06 -- --1,2,3,7,8-Pentachlorodibenzo-p-dioxin 57117-41-6 0.03781429 2.5 5.2E-05 -- --2,3,4,6,7,8-Hexachlorodibenzofuran 60851-34-5 0.058 2.5 1.6E-05 -- --2,3,4,7,8-Pentachlorodibenzofuran 57117-31-4 0.03261429 2.5 5.2E-06 -- --2,3,7,8-Tetrachlorodibenzodioxin 17460-16 0.04918571 1 1.6E-06 -- --2,3,7,8-Tetrachlorodibenzofuran 51207-31-9 0.04875714 1 1.6E-05 -- --Octachlorodibenzodioxin 32688-79 0.12295714 5 5.2E-03 -- --Octachlorodibenzofuran 39001-02-0 0.08075714 5 5.2E-03 -- --TCDD TEQ -- -- -- -- --Polychlorinated Biphenyls (μg/kg-dry weight)Aroclor 1016 12674-11-2 1.3 2.5 -- -- --Aroclor 1221 11104-28-2 1.3 5 -- -- --Aroclor 1232 11141-16-5 1.3 2.5 -- -- --
Integral Consulting Inc. 2 of 3 Parametrix, Inc.

Upper Columbia RiverQuality Assurance Project Plan—Beach Sediment Study
Table A-7. Analytes, Method Reporting Limits, and Human Health Screening Values for Beach Sediment Samples.
Rochlin (2008, pers. comm.; 2009, pers. comm.) USEPA (2008b) USEPA (2006c)
Analyte CAS number MDLa MRLa,b,c
Traditional Subsistence Scenario
RBC2005 Mean Sediment
Detection Limit Recreational PRGs
Human Health Screening Values
Aroclor 1242 53469-21-9 1.3 2.5 -- -- --Aroclor 1248 12672-29-6 1.3 2.5 -- -- --Aroclor 1254 11097-69-1 1.3 2.5 -- -- --Aroclor 1260 11096-82-5 1.3 2.5 -- 0.94 --Aroclor 1262 37324-23-5 1.3 2.5 -- -- --Aroclor 1268 11100-14-4 1.3 2.5 -- -- --Total PCBs -- -- -- -- -- --Polybrominated Diphenylethers (μg/kg-dry weight)2,2',4-TriBDE (BDE-17) 147217-75-2 0.026 0.1 -- -- --2,4,4'-TriBDE (BDE-28) 41318-75-6 0.021 0.1 -- -- --2,2',4,4'-TetraBDE (BDE-47) 5436-43-1 0.027 0.1 0.57 -- --2,2',4,5'-TetraBDE (BDE-49) 40088-47-9 -- -- -- -- --2,3',4,4'-TetraBDE (BDE-66) 189084-61-5 0.017 0.1 -- -- --2,3',4',6-TetraBDE (BDE-71) 189084-62-6 0.011 0.1 -- -- --2,2',3,4,4'-PentaBDE (BDE-85) 182346-21-0 0.017 0.1 -- -- --2,2',4,4',5-PentaBDE (BDE-99) 60348-60-9 0.043 0.1 0.57 -- --2,2',4,4',6-PentaBDE (BDE-100) 189084-64-8 0.024 0.1 -- -- --2,2',3,3',4,4'-HexaBDE (BDE-128) CASID30336 0.028 0.1 -- -- --2,2',3,4,4',5'-HexaBDE (BDE-138) 182677-30-1 0.016 0.1 -- -- --2,2', 4,4',5,5'-HexaBDE (BDE-153) 68631-49-2 0.009 0.1 1.1 -- --2,2',4,4',5,6'-HexaBDE (BDE-154) 207122-15-4 0.013 0.1 -- -- --2,2',3,4,4',5',6-HeptaBDE (BDE-183) 207122-16-5 0.019 0.1 -- -- --2,2',3,4,4',6,6'-HeptaBDE (BDE-184) -- -- -- -- -- --2,3,3',4,4',5,6-OctaBDE (BDE-190) CASID30338 0.025 0.1 -- -- --2,3,3',4,4',5',6-HeptaBDE (BDE-191) -- -- -- -- -- --2,2',3,4,4',5,5',6-OctaBDE (BDE-203) CASID30339 0.013 0.1 -- -- --2,2',3,3',4,4',5,5',6-NonaBDE (BDE-206) 63936-56-1 0.16 1 -- -- --Decabromodiphenyl ether (BDE-209) 1163-19-5 0.26 1 40 -- --
IVBA Assay for Lead, Arsenic, and Other Metals f NA NA NA NA NA NARadionuclide Testing (pCi/g)
Radium-226 0.1 0.5 0.011 -- --Uranium-238 -- 0.1 0.5 0.37 -- --
Notes:"--" = no data MRL = method reporting limitCAS = Chemical Abstracts Service PRG = preliminary remediation goalMDL = method detection limit RBC = risk-based concenration
b The MRL is provided on a dry-weight basis and assumes 50% moisture in the samples. The MRL for project samples will vary with moisture content in the samples.c The MRL represents the level of lowest calibration standard (i.e., the practical quantitation limit).d The lowest screening value (i.e., the minimum concentration for each metal) is shown in bold.e Limit for EPA Method 6020 / limit for EPA Method 7062. Arsenic will be analyzed by EPA Method 7062 if it is not detected at the MRL by EPA Method 6020.
a MDL and MRL values shown are estimates for typical laboratory procedures. This information will be updated with the selected laboratory's current MDL and MRL values once the laboratory has been chosen.
f See USEPA. 2005.
Integral Consulting Inc. 3 of 3 Parametrix, Inc.

Upper Columbia RiverQuality Assurance Project Plan—Beach Sediment Study
Table A-8. Measurement Quality Objectives.
Bias Precision CompletenessAnalysis (percent) (RPD) (percent)Chemistry samples
Conventional parameters 75–125 ±35 95Metals/metalloids and uranium 75–125 ±35 95Pesticides 50-140 ±50 95SVOCs 50-140 ±50 95PAHs 50-140 ±50 95PCB Aroclors 50-140 ±50 95PCB congeners 25-150 ±50 95Dioxins and furans 25-150 ±50 95PBDEs 50-140 ±50 95
Radioisotope samplesRadium-226 75–125 ±35 95Uranium-238 75–125 ±35 95
Bioaccessibility assay for lead and arsenic 75–125 ±25 95
Notes:PAH = polycyclic aromatic hydrocarbonPBDE = polybrominated diphenyl etherPCB = polychlorinated biphenylRPD = relative percent differenceSVOC = semivolatile organic compound
Integral Consulting Inc. 1 of 1 Parametrix, Inc.

Upper Columbia RiverQuality Assurance Project Plan—Beach Sediment Study
Table B-1. Sample Containers, Preservation, and Holding Time Requirements for Sediment.
Type SizeSurface Sediment
G/P 8 oz b,c Grain size (sediment) 4±2ºC 6 months 100 gb,c
pH 7 days 20 gb
Total organic carbon 14 days 1 gMercury 28 days 5 gMetals/metalloids, uranium and percent moisture 6 months 10 g
G/P 8 oz b Metals/metalloids, and uranium - fine fraction 4±2oC 6 months 10 gWMG 2 oz Total sulfides No headspace; 4±2ºC (do not freeze) 14 day 5 g
P 4 oz Radionuclide None. Store at room temperature 6 months 15 gWMG 16 oz Archival Deep frozen (-20ºC) NA NA
P 4 oz Radionuclide archival Deep frozen (-20ºC) 6 months 15 g
WMG 2 oz IVBA for lead, arsenic, and other metals 4±2ºC NA 30 g
Subsurface SedimentG/P 8 oz b,c Grain size (sediment) 4±2ºC 6 months 100 gb,c
pH 7 days 20 gb
Total organic carbon 14 days 1 gMercury 28 days 5 gMetals/metalloids, uranium and percent moisture 6 months 10 g
G/P 8 oz b Metals/metalloids, and uranium - fine fraction 4±2oC 6 months 10 gWMG 2 oz Total sulfides No headspace; 4±2ºC (do not freeze) 14 days 5 gWMG 8 oz PCBs (Aroclors) 4±2oC 14 days 10 gWMG 8 oz PCB congeners Deep frozen (-20ºC) 1 year 10 gWMG 8 oz Dioxins/furans Deep frozen (-20ºC) 1 year 50 g
G/P 8 oz b 4±2ºC
Sample SizeAnalysis
Containera
Preservation Holding Time
G/P 8 oz b 4±2ºC
Integral Consulting Inc. 1 of 2 Parametrix, Inc.

Upper Columbia RiverQuality Assurance Project Plan—Beach Sediment Study
Table B-1. Sample Containers, Preservation, and Holding Time Requirements for Sediment.
Type SizeSample
SizeAnalysisContainera
Preservation Holding Time WMG 8 oz PBDEs Deep frozen (-20ºC) 1 year 50 g
Pesticides 40 gPAHsSVOCs
WMG 16 oz Archival Deep Frozen (-20ºC) NA NAP 4 oz Radionuclide Archival Deep Frozen (-20ºC) NA 15 g
Notes:G/P = glass or plasticIVBA = in vitro bioaccessibility assayNA = not applicableP = plasticWMG = wide mouth glassaThe size and number of containers may be modified by analytical laboratory.
cA larger sample size will be needed for coarse-grained sediment.
WMG
bCollection of 2 times the indicated sample size will be necessary for 5 percent of samples to allow for laboratory QA procedures.
50 g16 oz 4±2oC 14 days
Integral Consulting Inc. 2 of 2 Parametrix, Inc.