Quality Assurance Project Plan: Albion Wastewater ... · Albion Wastewater Treatment Plant...
45
Quality Assurance Project Plan Albion Wastewater Treatment Plant Discharge of PCB and Dieldrin to the South Fork Palouse River February 2016 Publication No. 16-03-102
Transcript of Quality Assurance Project Plan: Albion Wastewater ... · Albion Wastewater Treatment Plant...

Quality Assurance Project Plan
Albion Wastewater Treatment Plant Discharge of PCB and Dieldrin to the South Fork Palouse River
February 2016 Publication No. 16-03-102

Publication Information Each study conducted by the Washington State Department of Ecology (Ecology) must have an approved Quality Assurance Project Plan. The plan describes the objectives of the study and the procedures to be followed to achieve those objectives. After completing the study, Ecology will post the final report of the study to the Internet. This Quality Assurance Project Plan is available on Ecology’s website at https://fortress.wa.gov/ecy/publications/SummaryPages/1603102.html Data for this project will be available on Ecology’s Environmental Information Management (EIM) website at www.ecy.wa.gov/eim/index.htm. Search Study ID RCOO0015. Ecology’s Activity Tracker Code for this study is 16-034. Author and Contact Information Randy Coots P.O. Box 47600 Environmental Assessment Program Washington State Department of Ecology Olympia, WA 98504-7710 Communications Consultant: phone 360-407-6834.
Washington State Department of Ecology - www.ecy.wa.gov o Headquarters, Lacey 360-407-6000 o Northwest Regional Office, Bellevue 425-649-7000 o Southwest Regional Office, Lacey 360-407-6300 o Central Regional Office, Union Gap 509-575-2490 o Eastern Regional Office, Spokane 509-329-3400
Any use of product or firm names in this publication is for descriptive purposes only
and does not imply endorsement by the author or the Department of Ecology.
Accommodation Requests: To request ADA accommodation including materials in a format for the visually impaired, call Ecology at 360-407-6834. Persons with impaired hearing may call Washington Relay Service at 711. Persons with speech disability may call TTY at 877-833-6341.

QAPP: PCB and Dieldrin Study in Albion WTP Page 1 – February 2016
Quality Assurance Project Plan
Albion Wastewater Treatment Plant Discharge of PCB and Dieldrin
To the South Fork Palouse River
February 2016
Approved by: Signature: Date: January 2016 Ellie Key, Client, Water Quality Program, ERO Signature: Date: February 2016 Diana Washington, Client’s Unit Supervisor, Water Quality Program, ERO Signature: Date: January 2016 James Bellatty, Client’s Section Manager, Water Quality Program, ERO Signature: Date: January 2016 Randy Coots, Author, Project Manager, Principal Investigator, EAP Signature: Date: January 2016 Dale Norton, Author’s Unit Supervisor, EAP Signature: Date: January 2016 Will Kendra, Author’s Section Manager, EAP Signature: Date: January 2016 Tom Mackie, Section Manager for Project Study Area, EAP Signature: Date: February 2016 Joel Bird, Director, Manchester Environmental Laboratory Signature: Date: January 2016 Bill Kammin, Ecology Quality Assurance Officer
Signatures are not available on the Internet version. ERO: Eastern Regional Office EAP: Environmental Assessment Program

QAPP: PCB and Dieldrin Study in Albion WTP Page 2 – February 2016
1.0 Table of Contents
Page
1.0 Table of Contents .....................................................................................................2
2.0 Abstract ....................................................................................................................6
3.0 Background ..............................................................................................................7 3.1 Study area and surroundings ........................................................................7
3.1.1 Logistical problems .........................................................................8 3.1.2 History of study area .......................................................................8 3.1.3 Parameters of interest ......................................................................9 3.1.4 Results of previous studies ..............................................................9 3.1.5 Regulatory criteria or standards ....................................................10
4.0 Project Description.................................................................................................11 4.1 Project goal ................................................................................................11 4.2 Project objectives .......................................................................................11 4.3 Information needed and sources ................................................................11 4.4 Target population .......................................................................................12 4.5 Study boundaries ........................................................................................12 4.6 Tasks required ............................................................................................12 4.7 Practical constraints ...................................................................................12 4.8 Systematic planning process ......................................................................12
5.0 Organization and Schedule ....................................................................................13 5.1 Key individuals and their responsibilities ..................................................13 5.2 Special training and certifications ..............................................................14 5.3 Organization chart ......................................................................................14 5.4 Project schedule .........................................................................................15 5.5 Limitations on schedule .............................................................................15 5.6 Budget and funding ....................................................................................15
6.0 Quality Objectives .................................................................................................17 6.1 Decision Quality Objectives (DQOs) ........................................................17 6.2 Measurement Quality Objectives ...............................................................17
6.2.1 Targets for Precision, Bias, and Sensitivity ..................................17 6.2.2 Targets for Comparability, Representativeness, and Completeness .............................................................................................18
7.0 Sampling Process Design (Experimental Design) .................................................19 7.1 Study Design ..............................................................................................19
7.1.1 Field measurements ........................................................................19 7.1.2 Sampling location and frequency ...................................................19 7.1.3 Parameters to be determined ..........................................................20
7.2 Maps or diagram ........................................................................................21 7.3 Assumptions underlying design .................................................................21 7.4 Relation to objectives and site characteristics ...........................................21 7.5 Characteristics of existing data ..................................................................21
QAPP: PCB and Dieldrin Study in Albion WTP Page 3 – February 2016
8.0 Sampling Procedures .............................................................................................22 8.1 Field measurement and field sampling SOPs ............................................22 8.2 Containers, preservation methods, holding times ......................................22 8.3 Invasive species evaluation ........................................................................22 8.4 Equipment decontamination ......................................................................22 8.5 Sample ID ..................................................................................................22 8.6 Chain-of-custody, if required .....................................................................23 8.7 Field log requirements ...............................................................................23 8.8 Other activities ...........................................................................................23
9.0 Measurement Methods ...........................................................................................24 9.1 Field procedures table/field analysis table .................................................24 9.2 Lab procedures table ..................................................................................24
9.2.1 Analyte ...........................................................................................24 9.2.2 Matrix .............................................................................................24 9.2.3 Number of samples.........................................................................24 9.2.4 Expected range of results ...............................................................24 9.2.5 Analytical method ..........................................................................24 9.2.6 Sensitivity/Method Detection Limit (MDL) ..................................25
9.3 Sample preparation method(s) ...................................................................25 9.4 Special method requirements .....................................................................25 9.5 Lab(s) accredited for method(s) .................................................................25
10.0 Quality Control (QC) Procedures ..........................................................................26 10.1 Table of field and lab QC required ............................................................26 10.2 Corrective action processes ........................................................................26
11.0 Data Management Procedures ...............................................................................27 11.1 Data recording/reporting requirements ......................................................27
11.1.1 Reporting PCB Totals .................................................................27 11.2 Laboratory data package requirements ......................................................27 11.3 Electronic transfer requirements ................................................................28 11.4 Acceptance criteria for existing data ..........................................................28 11.5 EIM/STORET data upload procedures ......................................................28
12.0 Audits and Reports .................................................................................................29 12.1 Number, frequency, type, and schedule of audits ......................................29 12.2 Responsible personnel ...............................................................................29 12.3 Frequency and distribution of report..........................................................29 12.4 Responsibility for reports ...........................................................................29
13.0 Data Verification ....................................................................................................30 13.1 Field data verification, requirements, and responsibilities ........................30 13.2 Lab data verification ..................................................................................30 13.3 Validation requirements, if necessary ........................................................30
14.0 Data Quality (Usability) Assessment .....................................................................30 14.1 Process for determining whether project objectives have been met ..........30 14.2 Data analysis and presentation methods ....................................................31 14.3 Treatment of non-detects ...........................................................................31

QAPP: PCB and Dieldrin Study in Albion WTP Page 4 – February 2016
14.4 Sampling design evaluation .......................................................................31 14.5 Documentation of assessment ....................................................................31
15.0 References ..............................................................................................................32
16.0 Figures....................................................................................................................33
17.0 Tables .....................................................................................................................34
18.0 Appendix. Glossaries, Acronyms, and Abbreviations ...........................................35

QAPP: PCB and Dieldrin Study in Albion WTP Page 5 – February 2016
List of Figures and Tables
Page
Figures
Figure 1. Albion Wastewater Treatment Plant PCB and Dieldrin Study Area. ..................8
Figure 2. Mean monthly discharge for the South Fork Palouse River at Pullman (USGS 13348000). .............................................................................................20
Tables
Table 1. Organization of project staff and responsibilities. ..............................................13
Table 2. Proposed schedule for completing field and laboratory work, data entry into EIM, and reports. ................................................................................................15
Table 3. Project budget and funding. ................................................................................16
Table 4. Measurement Quality Objectives (MQOs). ........................................................17
Table 5. Analytical methods and detection limits for influent and effluent samples. ......18
Table 6. Sample site coordinates. .....................................................................................19
Table 7. Study parameters, sample and container size, preservation, and holding times for study samples. ...............................................................................................22
Table 8. Analytical methods, expected range of results, and detection limits for the study. ..................................................................................................................24
Table 9. Laboratory quality control (QC) samples for influent and effluent composite samples. ..............................................................................................................26

QAPP: PCB and Dieldrin Study in Albion WTP Page 6 – February 2016
2.0 Abstract
Albion is a small town in an area of eastern Washington known as “The Palouse”. In 2007 the United States Environmental Protection Agency approved a Total Maximum Daily Load (TMDL) analysis for toxics in the Palouse River. As a consequence of the TMDL study, the discharge from the Albion Wastewater Treatment Plant (WWTP) received a wasteload allocation (WLA) for PCBs and dieldrin. WLAs were established at 0.0001 gram/day for total PCBs and 0.0001 gram/day for dieldrin. The Albion WWTP discharges treated wastewater seasonally from two facultative lagoons to the South Fork Palouse River. Currently, discharge monitoring reports for Albion’s WWTP do not require reporting of PCBs or dieldrin. Cost of analysis and expertise needed for assessment of low-level toxic parameters can strain the resources of small town operators. To meet WLAs and future National Pollutant Discharge Elimination System permits, sampling protocols and data analysis procedures will be established for PCBs and dieldrin. Composite influent and effluent samples will be collected over a 24-hour period on three occasions during the 2016 discharge season (roughly February through May). The record of total effluent discharged over the 24-hour sample period will be used to calculate daily loads of PCBs and dieldrin released to the South Fork Palouse River. The daily loads of PCBs and dieldrin will be compared to the TMDL interim WLAs.
QAPP: PCB and Dieldrin Study in Albion WTP Page 7 – February 2016
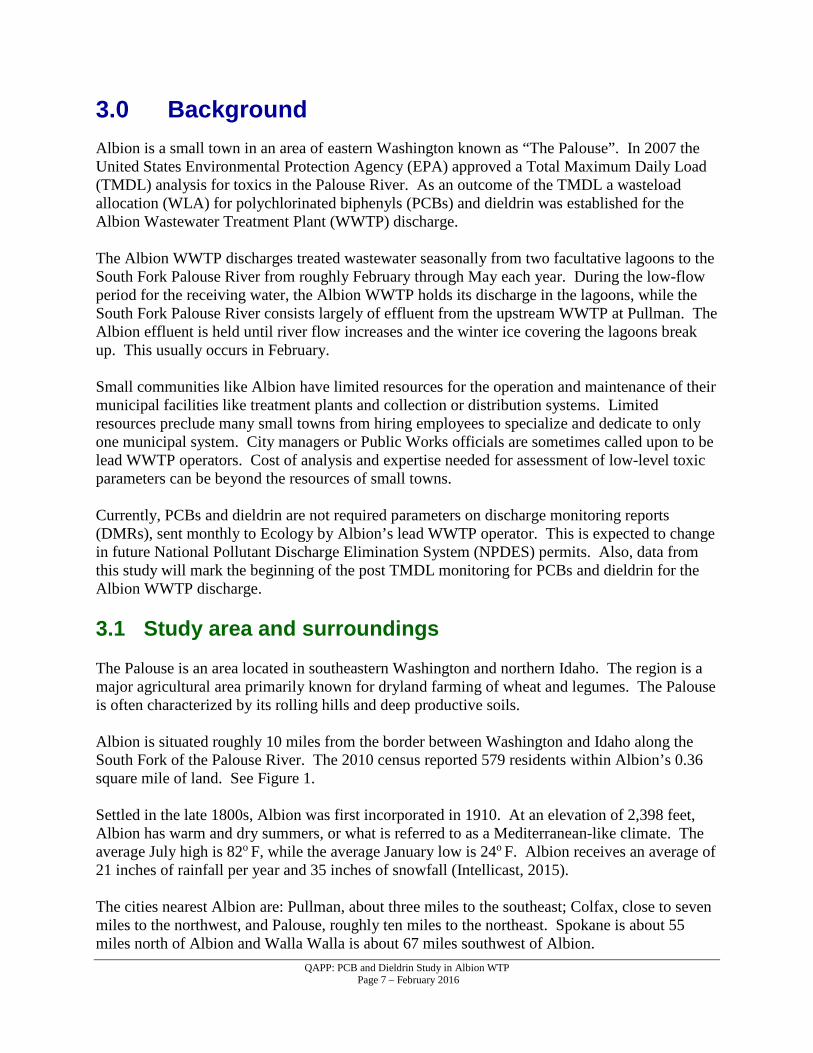
3.0 Background Albion is a small town in an area of eastern Washington known as “The Palouse”. In 2007 the United States Environmental Protection Agency (EPA) approved a Total Maximum Daily Load (TMDL) analysis for toxics in the Palouse River. As an outcome of the TMDL a wasteload allocation (WLA) for polychlorinated biphenyls (PCBs) and dieldrin was established for the Albion Wastewater Treatment Plant (WWTP) discharge. The Albion WWTP discharges treated wastewater seasonally from two facultative lagoons to the South Fork Palouse River from roughly February through May each year. During the low-flow period for the receiving water, the Albion WWTP holds its discharge in the lagoons, while the South Fork Palouse River consists largely of effluent from the upstream WWTP at Pullman. The Albion effluent is held until river flow increases and the winter ice covering the lagoons break up. This usually occurs in February. Small communities like Albion have limited resources for the operation and maintenance of their municipal facilities like treatment plants and collection or distribution systems. Limited resources preclude many small towns from hiring employees to specialize and dedicate to only one municipal system. City managers or Public Works officials are sometimes called upon to be lead WWTP operators. Cost of analysis and expertise needed for assessment of low-level toxic parameters can be beyond the resources of small towns. Currently, PCBs and dieldrin are not required parameters on discharge monitoring reports (DMRs), sent monthly to Ecology by Albion’s lead WWTP operator. This is expected to change in future National Pollutant Discharge Elimination System (NPDES) permits. Also, data from this study will mark the beginning of the post TMDL monitoring for PCBs and dieldrin for the Albion WWTP discharge. 3.1 Study area and surroundings The Palouse is an area located in southeastern Washington and northern Idaho. The region is a major agricultural area primarily known for dryland farming of wheat and legumes. The Palouse is often characterized by its rolling hills and deep productive soils. Albion is situated roughly 10 miles from the border between Washington and Idaho along the South Fork of the Palouse River. The 2010 census reported 579 residents within Albion’s 0.36 square mile of land. See Figure 1. Settled in the late 1800s, Albion was first incorporated in 1910. At an elevation of 2,398 feet, Albion has warm and dry summers, or what is referred to as a Mediterranean-like climate. The average July high is 82o F, while the average January low is 24o F. Albion receives an average of 21 inches of rainfall per year and 35 inches of snowfall (Intellicast, 2015). The cities nearest Albion are: Pullman, about three miles to the southeast; Colfax, close to seven miles to the northwest, and Palouse, roughly ten miles to the northeast. Spokane is about 55 miles north of Albion and Walla Walla is about 67 miles southwest of Albion.

QAPP: PCB and Dieldrin Study in Albion WTP Page 8 – February 2016
Figure 1. Albion Wastewater Treatment Plant PCB and Dieldrin Study Area.
3.1.1 Logistical problems The Albion WWTP discharges treated wastewater from the two facultative lagoons seasonally from roughly February through May each year. Sampling for the study will coincide with the WWTP’s discharge season. 3.1.2 History of study area The Albion area−or more generally the Palouse−has been dominated historically by agriculture. The deep soils and rolling hills have been best known for their high levels of wheat production. PCBs in the study area were historically used in transformers and capacitors, motor oils, hydraulic systems, and a wide range of other products. PCBs are currently found in dyes and inks and may also be associated with wet and dry deposition from a global atmospheric pool. Dieldrin is an organochlorine insecticide/wood preservative used widely in the United States from 1950 to 1970.

QAPP: PCB and Dieldrin Study in Albion WTP Page 9 – February 2016
The Palouse River TMDL implementation plan (Johnson et al., 2007) established an interim WLA for total PCBs (tPCBs) and dieldrin for the discharge from the Albion WWTP. The city of Pullman, upstream from Albion on the South Fork Palouse River, also received an interim tPCBs and dieldrin WLA. The TMDL determined WLAs for these chlorinated compounds were needed for the NPDES-permitted discharges. Also, best management practices (BMPs) for stormwater and load allocations (LAs) for nonpoint sources were determined to be needed to improve water quality within the sub-basin. The most recent NPDES permit for the Albion wastewater treatment plant was issued after the Palouse River Toxics TMDL was approved but does not have a requirement for toxics monitoring (Permit No. WA0022608, expired June 30, 2015). The data from this study will begin the post TMDL monitoring of WLAs for tPCBs and dieldrin from the Albion WWTP discharge and determine if the WLAs are being met. 3.1.3 Parameters of interest PCBs and dieldrin are the target analytes for the study. These legacy chemicals have no natural sources and are considered probable human carcinogens. Both are considered Persistent Bioaccumulative and Toxic (PBTs) chemicals. In addition, the ancillary parameter total suspended solids (TSS) will be analyzed at the laboratory and pH will be determined in the field by handheld meter. 3.1.4 Results of previous studies There are very few PCBs or dieldrin data available from the Albion WWTP to do a toxics loading assessment. Ecology conducted a study in 2007-2008 at three WWTPs and two abandoned landfills in the South Fork Palouse River sub-basin (Lubliner, 2009) in support of the Palouse River TMDL Implementation Plan (Johnson et al., 2007). The study included influent and effluent monitoring at Albion’s WWTP. In April of 2008, based on one set of samples, results showed PCBs and dieldrin from Albion’s WWTP influent to effluent were reduced by an order of magnitude. Freezing spring temperatures delayed the onset of effluent discharge, reducing three planned sample events to one. While dieldrin concentrations met criteria at discharge measuring <30 pg/L (picograms/liter; or parts per quadrillion) (NTR=140 pg/L) the tPCBs in effluent exceeded Washington State’s water quality standard for protection of human health (170 pg/L) in effluent. The tPCBs were reported at 1800 pg/L, roughly an order of magnitude greater than the standard. An 85% reduction in tPCBs was recommended in effluent concentrations to meet interim WLAs. The study also recommended additional effluent sampling for PCBs and dieldrin at the Albion WWTP to determine if the single set of sample results from the 2007-2008 study were representative. Below Table 1 presents the PCB and dieldrin results for the April 2008 study.

QAPP: PCB and Dieldrin Study in Albion WTP Page 10 – February 2016
Table 1. Albion WWTP Influent and Effluent Results for the April 2008 Study.
Analyte Influent Effluent Human Health Criteria1
Total PCBs 7,700 pg/L 1,800 pg/L 170 pg/L Dieldrin 540 pg/L < 30 pg/L 140 pg/L
1 National Toxics Rule (NTR) Human Health Criteria.
3.1.5 Regulatory criteria or standards To determine if WLAs established for the Palouse River are being met, TMDL daily loads of tPCBs and dieldrin will be calculated using concentrations reported from composite effluent samples collected on three separate occasions. The WWTP’s total discharge volume during each 24-hour collection period will be used along with concentration information to calculate a daily load. The daily loads will be compared to the interim WLAs that were established in the TMDL implementation plan. The interim WLAs for the Albion WWTP discharge are 0.0001 gram/day for tPCBs and 0.0001 gram/day for dieldrin. Calculations establishing the WLAs in the TMDL were based on Washington’s water quality standard for tPCBs and dieldrin and the Albion WWTP design flow of 0.12 mgd. For informational purposes effluent tPCBs and dieldrin concentrations will also be directly compared to the human health water quality criteria. The human health water quality criteria for tPCBs and dieldrin are 170 and 140 pg/L, respectively.

QAPP: PCB and Dieldrin Study in Albion WTP Page 11 – February 2016
4.0 Project Description
Influent and effluent PCB and dieldrin composite samples1 will be collected over a 24-hour period on three occasions at the Albion WWTP during the 2016 discharge season (roughly February through May). Sample results from influent will be used to assess the degree of contamination in the collection system and the removal efficiency of the treatment plant. Effluent sample results will be compared to the human health and aquatic life criteria and the interim WLAs. The samples for the PCB congeners and dieldrin analyses will be sent to a contract laboratory. The Manchester Environmental Laboratory (MEL) will analyze the TSS samples. The effluent volume over the 24-hour composite sample collection period will be totaled and used to calculate daily loads of PCBs and dieldrin discharged to the South Fork Palouse River. The tPCB and dieldrin daily loads will be compared to interim WLAs established in the Palouse River TMDL. For informational purposes, laboratory tPCBs and dieldrin results from effluent samples will be compared to the National Toxics Rule (NTR) Human Health and Aquatic Life water quality criteria.
4.1 Project goal The goal of the study is to assess whether WLAs set forth in the Palouse River TMDL are being met for the Albion WWTP discharge.
4.2 Project objectives Objectives for the study are listed below: • Collect 24-hour composite influent and effluent samples on three occasions during one
discharge season from the Albion WWTP and analyze for PCB congeners and dieldrin. • Determine total daily loads for PCBs and dieldrin discharged to the South Fork Palouse River
from the Albion WWTP and compare to interim WLAs established in the Palouse River TMDL Implementation Plan.
• Compare effluent results for tPCBs and dieldrin to human health and aquatic life criteria.
4.3 Information needed and sources This study will generate information on effluent daily loads of PCBs and dieldrin from the Albion WWTP from 24-hour composite samples. The tPCBs and dieldrin loads will be compared to interim WLAs calculated from laboratory results and WWTP total discharge volume measured during the sampling period. Future NPDES permits for the Albion WWTP are
1 Composite samples will consist of eight subsample grabs of 450 mL collected every three hours over a continuous 24-hour period.

QAPP: PCB and Dieldrin Study in Albion WTP Page 12 – February 2016
expected to incorporate PCBs and dieldrin as required reporting parameters. For informational purposes tPCBs and dieldrin concentrations will also be compared to human health and aquatic life water quality criteria.
4.4 Target population The study’s target population are the toxic compounds PCBs and dieldrin within the Albion WWTP effluent. Additional sample analysis and measurements for TSS and pH will also be conducted.
4.5 Study boundaries See Figure 1 for the study area. Water Resource Inventory Area (WRIA) and 8-digit Hydrologic Unit Code (HUC) numbers for the study area:
• WRIA - 34 • HUC - 17060108
4.6 Tasks required • Collect 24-hour composites of influent and effluent from the Albion WWTP on three
occasions and analyze for PCB congeners, dieldrin, TSS, and field measure pH.
• Determine PCB and dieldrin loads in effluent based on the composite sample concentration results and the total WWTP discharge volume during the sample collection period.
4.7 Practical constraints Discharge from the Albion WWTP is directed to the South Fork Palouse River during the high-flow period of the year. The remainder of the year, the facultative lagoons have capacity to store and treat the wastewater. Discharge occurs seasonally from roughly February through May of each year, but timing of release can vary based on freezing conditions. Study sampling will occur during the period effluent is discharged to the South Fork Palouse River.
4.8 Systematic planning process This QAPP represents sufficient systematic planning for this project.
QAPP: PCB and Dieldrin Study in Albion WTP Page 13 – February 2016
5.0 Organization and Schedule
5.1 Key individuals and their responsibilities
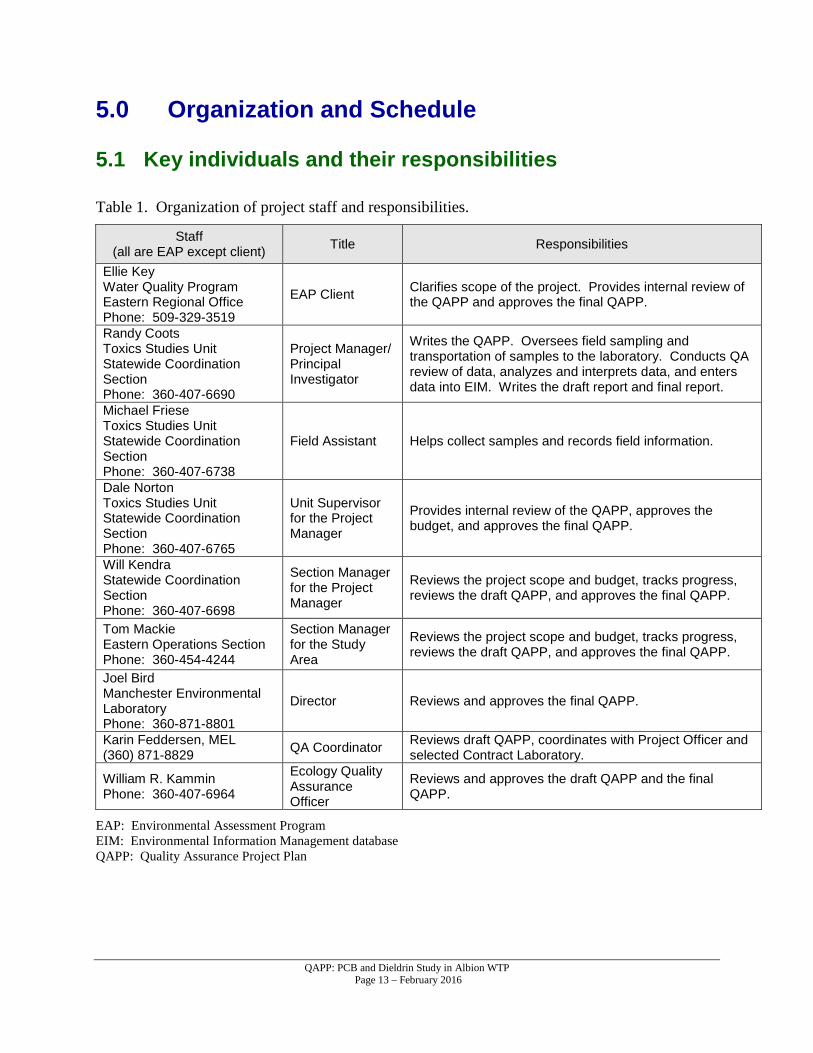
Table 1. Organization of project staff and responsibilities.
Staff (all are EAP except client) Title Responsibilities
Ellie Key Water Quality Program Eastern Regional Office Phone: 509-329-3519
EAP Client Clarifies scope of the project. Provides internal review of the QAPP and approves the final QAPP.
Randy Coots Toxics Studies Unit Statewide Coordination Section Phone: 360-407-6690
Project Manager/ Principal Investigator
Writes the QAPP. Oversees field sampling and transportation of samples to the laboratory. Conducts QA review of data, analyzes and interprets data, and enters data into EIM. Writes the draft report and final report.
Michael Friese Toxics Studies Unit Statewide Coordination Section Phone: 360-407-6738
Field Assistant Helps collect samples and records field information.
Dale Norton Toxics Studies Unit Statewide Coordination Section Phone: 360-407-6765
Unit Supervisor for the Project Manager
Provides internal review of the QAPP, approves the budget, and approves the final QAPP.
Will Kendra Statewide Coordination Section Phone: 360-407-6698
Section Manager for the Project Manager
Reviews the project scope and budget, tracks progress, reviews the draft QAPP, and approves the final QAPP.
Tom Mackie Eastern Operations Section Phone: 360-454-4244
Section Manager for the Study Area
Reviews the project scope and budget, tracks progress, reviews the draft QAPP, and approves the final QAPP.
Joel Bird Manchester Environmental Laboratory Phone: 360-871-8801
Director Reviews and approves the final QAPP.
Karin Feddersen, MEL (360) 871-8829 QA Coordinator Reviews draft QAPP, coordinates with Project Officer and
selected Contract Laboratory.
William R. Kammin Phone: 360-407-6964
Ecology Quality Assurance Officer
Reviews and approves the draft QAPP and the final QAPP.
EAP: Environmental Assessment Program EIM: Environmental Information Management database QAPP: Quality Assurance Project Plan

QAPP: PCB and Dieldrin Study in Albion WTP Page 14 – February 2016
5.2 Special training and certifications Field staff in the Toxics Studies Unit in the Environmental Assessment Program of Ecology has extensive experience sampling toxic parameters, specifically the target parameters for this study. Program SOPs will be followed and field books will document the field portion of the survey. The field team will be familiar with the following Ecology Standard Operating Procedures (SOPs):
• EAP013 – Determining Coordinates via Hand-held Global Positioning System (GPS) Receivers (Janisch, 2006) http://www.ecy.wa.gov/programs/eap/qa/docs/ECY_EAP_SOP_AssigningGPSCoordinates_v1_0EAP013.pdf
• EAP015 – Manually Obtaining Surface Water Samples (Joy, 2006)
http://www.ecy.wa.gov/programs/eap/qa/docs/ECY_EAP_SOP_ManuallyObtainingSurfaceWaterSamples_v1_2EAP015.pdf
• EAP070 – Minimizing the Spread of Aquatic Invasive Species (Parsons et al., 2012)
http://www.ecy.wa.gov/programs/eap/qa/docs/ECY_EAP_SOP_MinimizeSpreadOfAIS_v2_0EAP070.pdf
• EAP090 – Decontaminating Field Equipment for Sampling Toxics in the Environment
(Friese, 2014) http://www.ecy.wa.gov/programs/eap/qa/docs/ECY_EAP_SOP_EquipmentDeconToxicsSampling_v1_0EAP090.pdf
All field staff will be current on EAP safety and first aid training.
5.3 Organization chart See Table 1.

QAPP: PCB and Dieldrin Study in Albion WTP Page 15 – February 2016
5.4 Project schedule
Table 2. Proposed schedule for completing field and laboratory work, data entry into EIM, and reports.
Field and laboratory work Due date Lead staff Field work completed May 2016 Michael Friese Laboratory analyses completed August 2016
Environmental Information System (EIM) database EIM Study ID RCOO0015 Product Due date Lead staff
EIM data loaded 1 December 2016 Michael Friese EIM data entry review 2 January 2017 Melissa McCall EIM complete 3 February 2017 Michael Friese
Final report Author lead / Support staff Randy Coots / Michael Friese Schedule
Draft due to supervisor December 2016 Draft due to client/peer reviewer January 2017 Final (all reviews done) due to publications coordinator February 2017
Final report due on web March 2017 1 All data entered into EIM by the lead person for this task. 2 Data verified to be entered correctly by a different person; any data entry issues identified. Allow one month for this step in your schedule. 3 All data entry issues identified in the previous step are fixed (usually by the original entry person); EIM Data Entry Review Form signed off and submitted to Melissa McCall (who then enters the “EIM Completed” date into Activity Tracker). Allow one month for this step. Normally the final EIM completion date is no later than the final report publication date.
5.5 Limitations on schedule The influent and effluent sampling for the study can only occur during the WWTP discharge period, roughly February through May. During the South Fork Palouse River’s low flow period, between roughly June and January of each year, the facultative lagoons at the Albion WWTP have enough capacity to hold the discharge.
5.6 Budget and funding The estimated laboratory costs for this project total $15,680. Table 3 presents breakdown for these estimates. Contract fee includes a 25% additional charge.

QAPP: PCB and Dieldrin Study in Albion WTP Page 16 – February 2016
Table 3. Project budget and funding.
Parameter Number of Samples
Number of Field
Duplicates
Total Number of Samples
Cost Per Sample
MEL Subtotal
Contract Fee
PCB Congeners 6 3 9 815 7,335 1,834 Dieldrin 6 3 9 550 4,950 1,238 TSS 6 3 9 36 324
Survey Subtotal 12,610 Contracting Subtotal 3,075 Lab Grand Total $15,680
QAPP: PCB and Dieldrin Study in Albion WTP Page 17 – February 2016
6.0 Quality Objectives
6.1 Decision Quality Objectives (DQOs) NA
6.2 Measurement Quality Objectives
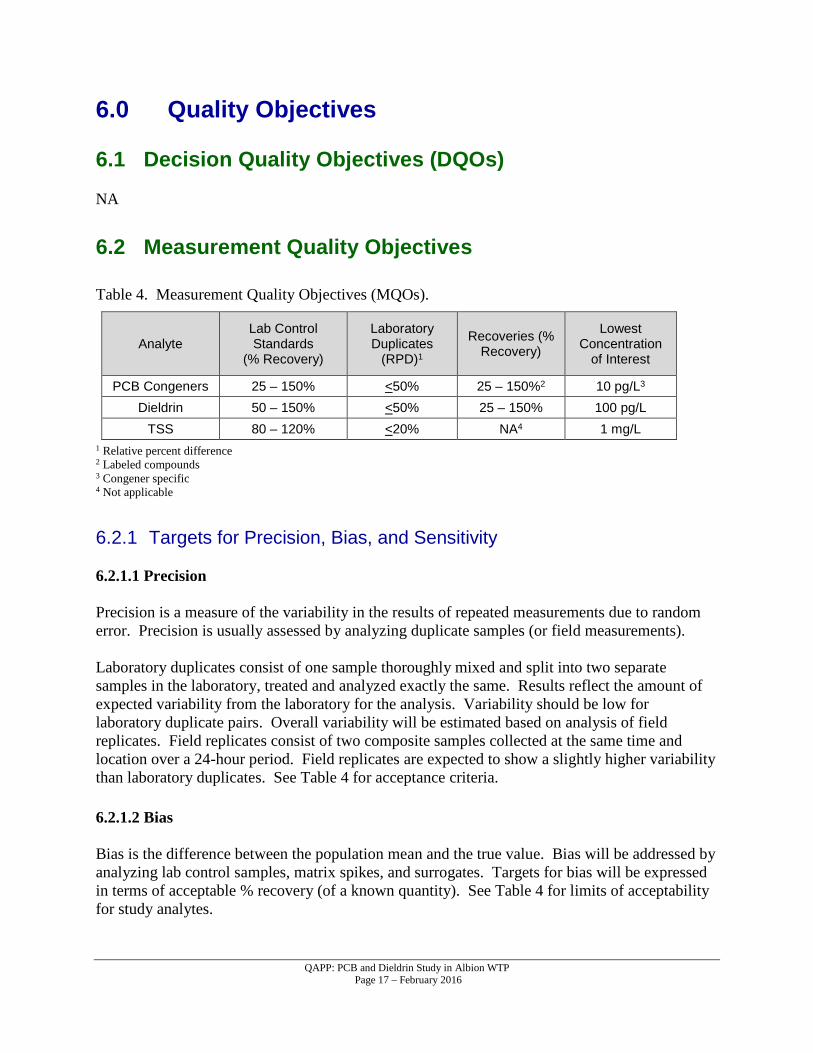
Table 4. Measurement Quality Objectives (MQOs).
Analyte Lab Control Standards
(% Recovery)
Laboratory Duplicates
(RPD)1
Recoveries (% Recovery)
Lowest Concentration
of Interest
PCB Congeners 25 – 150% <50% 25 – 150%2 10 pg/L3 Dieldrin 50 – 150% <50% 25 – 150% 100 pg/L
TSS 80 – 120% <20% NA4 1 mg/L 1 Relative percent difference 2 Labeled compounds 3 Congener specific 4 Not applicable
6.2.1 Targets for Precision, Bias, and Sensitivity 6.2.1.1 Precision Precision is a measure of the variability in the results of repeated measurements due to random error. Precision is usually assessed by analyzing duplicate samples (or field measurements). Laboratory duplicates consist of one sample thoroughly mixed and split into two separate samples in the laboratory, treated and analyzed exactly the same. Results reflect the amount of expected variability from the laboratory for the analysis. Variability should be low for laboratory duplicate pairs. Overall variability will be estimated based on analysis of field replicates. Field replicates consist of two composite samples collected at the same time and location over a 24-hour period. Field replicates are expected to show a slightly higher variability than laboratory duplicates. See Table 4 for acceptance criteria. 6.2.1.2 Bias Bias is the difference between the population mean and the true value. Bias will be addressed by analyzing lab control samples, matrix spikes, and surrogates. Targets for bias will be expressed in terms of acceptable % recovery (of a known quantity). See Table 4 for limits of acceptability for study analytes.

QAPP: PCB and Dieldrin Study in Albion WTP Page 18 – February 2016
6.2.1.3 Sensitivity Table 5. Analytical methods and detection limits for influent and effluent samples.
Analyte Reporting Limits
Sample Prep or Cleanup Method Analytical Method
PCB Congeners 10 pg/L1,2 EPA 3535 EPA 1668C
Dieldrin 30 pg/L3 13C labeled dieldrin,
Isotope dilution4 EPA 1699
TSS 1 mg/L5 SM 2540D6 1 PCBs reporting limits are congener specific. 2 pg/L is parts per quadrillion. 3 A relatively clean 1 L sample, influent may be slightly higher. 4 Prep method for dieldrin analyses may be decided later. 5 mg/L is parts per million. 6 Standard Methods
6.2.2 Targets for Comparability, Representativeness, and Completeness 6.2.2.1 Comparability Comparability of study results will be ensured by using standard operating procedures and adhering to established data quality criteria consistent with other studies analyzing PCB congeners and dieldrin. Selection of analytical methods was based on the ability of the method to detect target analytes below the water quality standards. 6.2.2.2 Representativeness The sampling design was developed to obtain daily averages of tPCBs and dieldrin concentrations represented by 24-hour composite samples. These samples will be collected from the WWTP influent distribution box discharging to the first of the two facultative lagoons and the effluent discharge from the second or polishing lagoon. Representativeness will be ensured by using appropriate sampling and sample handling procedures. Water samples will be collected as 24-hour composites to address variability and reflect average daily PCB and dieldrin concentrations and loads. The influent and effluent water samples will be hand-composited to avoid the potential for contamination from automated compositors. 6.2.2.3 Completeness Completeness can be defined as the need to collect enough valid data to allow decisions to be made for which the study was designed. The goal of completeness is to collect and analyze at least 95% of the samples described in the quality assurance plan.

QAPP: PCB and Dieldrin Study in Albion WTP Page 19 – February 2016
7.0 Sampling Process Design (Experimental Design)
7.1 Study Design The study will be conducted in a way Ecology has formerly called “Class II inspections” of treatment plants. Influent and effluent 24-hour composite samples will be collected for PCB congeners, dieldrin, and TSS analyses. Total discharge volume from the Albion WWTP during the composite sampling period will be provided by the treatment plants flow totalizer and recorded in field logs. Treatment percent removal of target parameters will be described as the difference between the levels measured in the influent and the effluent. Any system anomalies or process recommendations will be described. Only effluent results will be used for the loading analysis and comparison to the interim WLAs and water quality criteria. Influent results will be used to assess the degree of contamination in the collection system and the removal efficiency of the treatment process. Influent is pre-process and has no comparative standards. The PCB and dieldrin samples will be analyzed by high resolution methods (HRGC/HRMS, high resolution gas chromatograph/high resolution mass spectrometer). For PCBs, result values are reported for all 209 congeners, with some co-elutes. Using high resolution analysis lowers detection limits in water by orders of magnitude over other analytical methods. The tPCBs per sample will be determined by adding together all detected and “J” qualified PCB congeners within each homolog group. All homolog groups per sample, with at least one detected or “J” qualified congener, will be summed and reported as tPCBs. 7.1.1 Field measurements The pH of influent and effluent samples will be measured at the start and conclusion of composite sampling. Measurements will be taken by handheld meter following calibration for first use of that day. All pH measurements will be conducted in replicate. For averaging pH, the two log measurements will be converted to their anti-log values, averaged, and converted back to log scale. 7.1.2 Sampling location and frequency Influent samples will be collected from the influent distribution box, while effluent samples will be collected at the discharge v-notch weir. The latitudes and longitudes of the two sampling locations are shown below in Table 6.
Table 6. Sample site coordinates. Sample Type Location Latitude Longitude Sample Method
Influent Distribution box 46 46.933 117 15.605 24 hour grab composite Effluent V-notch weir 46 47.249 117 15.580 24 hour grab composite
Datum: NAD83.

QAPP: PCB and Dieldrin Study in Albion WTP Page 20 – February 2016
Between roughly February and May of 2016 samples will be collected on three occasions. Sampling times will be scheduled to get the best possible coverage for the discharge period. We will collect one sample set early in the discharge season, one set roughly in the middle of the discharge season, and one set near the end of the discharge season. The lead WWTP operator will be consulted on sample timing. Figure 2 below shows the South Fork Palouse River mean monthly discharge at the Pullman gaging station (USGS 13348000) for the period of record (1934 to present), including proposed sample events and the estimated Albion WWTP discharge period. The USGS gaging station at Pullman is roughly five miles upstream of the discharge for the Albion WWTP. Influent and effluent samples will be hand-composited over the same 24-hour period for each of the three surveys. The composite samples will consist of eight subsamples over the 24 hours and will include an effluent field replicate. Effluent subsamples will be collected immediately following the influent subsample. The influent subsamples will be collected at the distribution box during the intermittent two-minute discharge from the influent wet-well. The pH measurements will be taken from grab samples collected at the start and finish of the sample period.
Figure 2. Mean monthly discharge for the South Fork Palouse River at Pullman (USGS 13348000).
7.1.3 Parameters to be determined
• Influent and Effluent o PCBs o Dieldrin o TSS o pH (meter) o WWTP effluent discharge (24 hour)
See Table 5 for reporting limits, and the cleanup and analytical methods proposed for the study.
0
20
40
60
80
100
120
140
Jan Feb Mar Apr May Jun Jul Aug Sep Oct Nov Dec
SF P
alou
se R
iver
Dis
char
ge, c
fs
Proposed Sample Event
Discharge PeriodAlbion WWTP

QAPP: PCB and Dieldrin Study in Albion WTP Page 21 – February 2016
7.2 Maps or diagram See Figure 1. 7.3 Assumptions underlying design We assume the HRGC/HRMS analytical methods for water will provide detection limits low enough to allow comparisons to NTR criteria for the effluent samples. Detection limits for influent composite samples may be slightly higher due to possible matrix effects. 7.4 Relation to objectives and site characteristics The study will be conducted at the Albion WWTP facility. Access should not be an issue. The facility is expected to be open through the daytime hours of the work week and gate keys into the facility are available from the treatment plant operator for after work hours. Physical hazards of the study location could include those common when working around small treatment facilities, like tripping and falling, and minor cuts or bruises. Chlorine is likely the most significant chemical hazard on site. Field samplers will not need access to the chlorine room or the chlorine contact chamber. Always a concern at treatment plants are cold and flu virus. Filter masks will be available for field staff. Samplers will don rubber boots while on site and will wear nitrile gloves throughout any sample collection activity and any time samples are handled, packaged, or shipped. 7.5 Characteristics of existing data Few data are available from the Albion WWTP for PCBs and dieldrin. See Section 3.1.4.

QAPP: PCB and Dieldrin Study in Albion WTP Page 22 – February 2016
8.0 Sampling Procedures
8.1 Field measurement and field sampling SOPs Field SOP’s are listed in Section 5.2, Special training and certifications.
8.2 Containers, preservation methods, holding times Sample containers, preservation, and holding time requirements for the study are shown in Table 7. Pre-cleaned, certified sample containers will be obtained from the MEL prior to each sampling event. Containers will be suitable for the specific analyses to be performed. Containers will be free of contaminants according to the US Environmental Protection Agency (EPA) (1992) and meet quality assurance certification from the supplier.
Table 7. Study parameters, sample and container size, preservation, and holding times for study samples.
Analyte Sample Size Container1 Preservation Holding Time
PCB Congeners 3600 mL 1 Gallon Glass Cool to <4o C 1 year Dieldrin 3600 mL 1 Gallon Glass Cool to <4o C 7 days TSS2 1000 mL 1 Liter Poly Cool to <6o C 7 days
1 Certified sample containers provided by Manchester Environmental Laboratory or their contract laboratory 2 Total suspended solids
8.3 Invasive species evaluation This study will be conducted within the confines of the wastewater treatment system. No ambient stream sampling will be conducted, so the potential for coming in contact with invasive aquatic species is limited. While the potential is low for spreading invasive species through contamination of field gear and equipment from within a wastewater treatment system all field samplers will be familiar with Ecology’s SOP EAP070 (Parsons et al., 2012) which addresses invasive species transport and contamination. With any indication of invasive species in the study area the EAP070 SOP will be implemented and followed.
8.4 Equipment decontamination Refer to section 5.2 under Special Training and Certification, Ecology’s SOP EAP090 (Friese, 2014) Decontamination of Sampling Equipment for Use in Collecting Toxic Chemical Samples.
8.5 Sample ID Sample ID will be maintained throughout the study using unique identifiers. All WWTP samples will be labeled starting with an abbreviation for the city (Alb). The city identifier will

QAPP: PCB and Dieldrin Study in Albion WTP Page 23 – February 2016
be followed by whether it was an effluent or influent sample (Alb-effl or Alb-infl). QA samples will be collected from effluent and identified by the location code followed by QA (Effl-QA).
8.6 Chain-of-custody, if required Chain-of-custody procedures will be followed throughout the sampling and analytical process. The chain-of-custody will be documented and maintained by use of the laboratory analysis request forms.
8.7 Field log requirements A field book will be maintained that includes information for all reconnaissance, sample events, or site visits. All field notes including pictures will be maintained by the project lead and archived with other pertinent study information and materials. Information in field books will include but not be limited to:
• Name and location of project • Field personnel present • Date, time, location, ID, and description of each sample • Weather or other environmental conditions • Any field measurements or picture identification • Identity of QC samples collected • Any changes or deviations from the QAPP Field notes will be written by permanent waterproof ink on rite-in-the-rain paper. Mistakes made in field notes will be corrected by a single line strikethrough with author initials and date.
8.8 Other activities Necessary activities are detailed in other sections of this QAPP.

QAPP: PCB and Dieldrin Study in Albion WTP Page 24 – February 2016
9.0 Measurement Methods
9.1 Field procedures table/field analysis table Measurement of pH will be accomplished by hand held meter calibrated in the field prior to first use in the morning. Calibration checks will be completed prior to other field measurements of the day following first use.
9.2 Lab procedures table
Table 8. Analytical methods, expected range of results, and detection limits for the study.
Analyte
Expected Range of Results
Reporting Limit
Sample Prep Method
Analytical Method
PCB congeners 10-18,000 pg/L 10 pg/L1 EPA 3535 EPA 1668C HRGC/HRMS2
Dieldrin
<30-1000 pg/L
30 pg/L3
13C labeled dieldrin, Isotope dilution4
EPA 1699 HRGC/HRMS
TSS 1-100 mg/L 1 mg/L SM 2540D5 1 PCB reporting limits are congener-specific. 2 High resolution gas chromatography/High resolution mass spectroscopy 3 A relatively clean 1 L sample, influent may be slightly higher. 4 Prep method for contract analysis will be decided later. 5 Standard Methods
9.2.1 Analyte
See Table 8. 9.2.2 Matrix See Table 8. 9.2.3 Number of samples See Table 3. 9.2.4 Expected range of results See Table 8. 9.2.5 Analytical method See Table 8.

QAPP: PCB and Dieldrin Study in Albion WTP Page 25 – February 2016
9.2.6 Sensitivity/Method Detection Limit (MDL) See Table 8.
9.3 Sample preparation method(s) See Table 8.
9.4 Special method requirements All analyses will be conducted using approved standardized EPA or Standard Methods. The PCB congener and dieldrin analyses will use high resolution methods that allow for much lower detection and reporting limits.
9.5 Lab(s) accredited for method(s) MEL is accredited and will conduct the TSS analysis for the influent and effluent samples. MEL will also be the lead and manage the contract for the laboratory conducting the HRGC/HRMS PCB congener and dieldrin analyses. At the time of writing this quality assurance plan, a contract laboratory has not been selected. The laboratory selected for the PCB congener and dieldrin analyses will be required to be accredited by the state of Washington for the specific analysis.
QAPP: PCB and Dieldrin Study in Albion WTP Page 26 – February 2016
10.0 Quality Control (QC) Procedures
10.1 Table of field and lab QC required
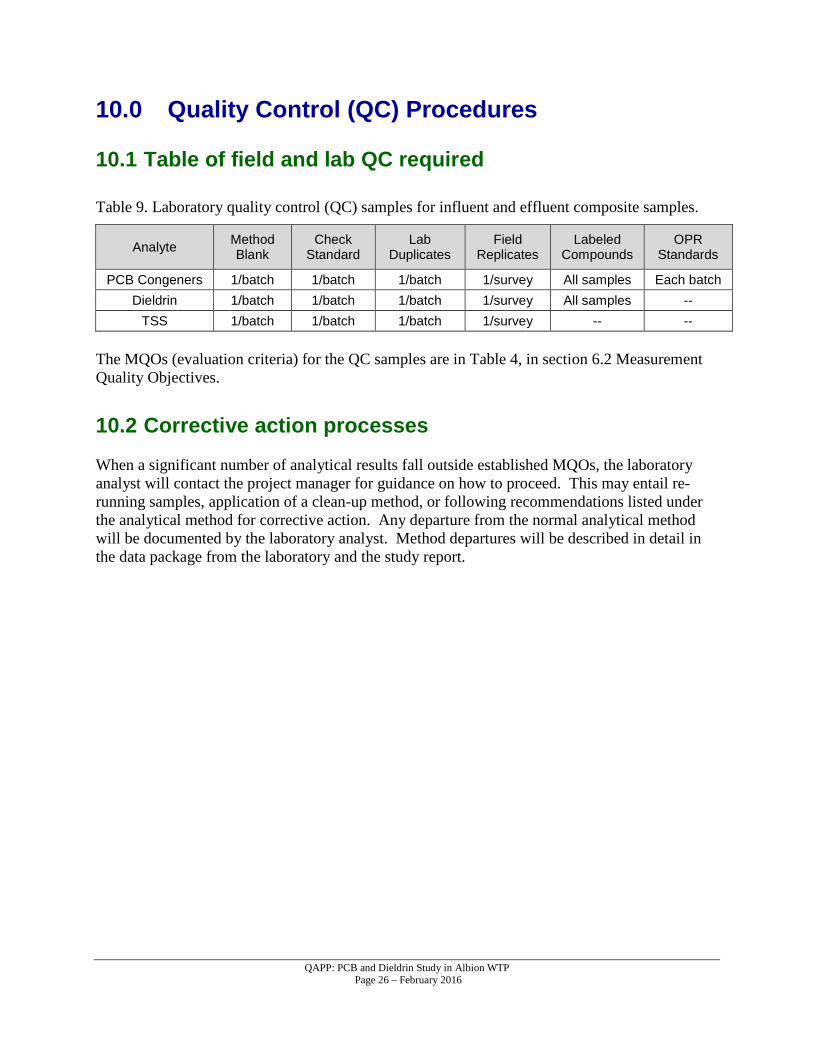
Table 9. Laboratory quality control (QC) samples for influent and effluent composite samples.
Analyte Method Blank
Check Standard
Lab Duplicates
Field Replicates
Labeled Compounds
OPR Standards
PCB Congeners 1/batch 1/batch 1/batch 1/survey All samples Each batch Dieldrin 1/batch 1/batch 1/batch 1/survey All samples --
TSS 1/batch 1/batch 1/batch 1/survey -- -- The MQOs (evaluation criteria) for the QC samples are in Table 4, in section 6.2 Measurement Quality Objectives.
10.2 Corrective action processes When a significant number of analytical results fall outside established MQOs, the laboratory analyst will contact the project manager for guidance on how to proceed. This may entail re-running samples, application of a clean-up method, or following recommendations listed under the analytical method for corrective action. Any departure from the normal analytical method will be documented by the laboratory analyst. Method departures will be described in detail in the data package from the laboratory and the study report.

QAPP: PCB and Dieldrin Study in Albion WTP Page 27 – February 2016
11.0 Data Management Procedures
11.1 Data recording/reporting requirements All field data and observations will be recorded in notebooks on waterproof paper. The information contained in field notebooks will be transferred to Excel spreadsheets after return from the field. Data entries will be independently verified for accuracy by another member of the project team. Case narratives included in the data package from MEL will discuss any problems encountered with the analyses, corrective action taken, changes to the requested analytical method, and a glossary for data qualifiers. Laboratory QC results will also be a part of the data package. This will include results for surrogate recoveries, laboratory duplicates, matrix spikes, and laboratory blanks. The information will be used to evaluate data quality, determine if the MQOs were met, and act as acceptance criteria for project data. Field and laboratory data for the project will be entered into Ecology’s EIM system. Laboratory data will be downloaded directly into EIM from MEL’s data management system. Data from contract laboratories will be submitted in electronic format for inclusion into the EIM system. 11.1.1 Reporting PCB Totals The tPCB results from congener analysis will be presented in units of picograms per liter (pg/L), which are the original units reported for each congener from the laboratory. The PCB totals per sample will be calculated by rules described below:
• Detected and “J” qualified PCB congener results will be summed for tPCBs. • Tentatively identified or “NJ” qualified congener results will not be included in tPCB sums. • Non-detect or “U” qualified congeners will not be included in tPCB sums. • Congeners which do not meet all method identification criteria by the analytical laboratory
are considered non-detects (“U” or “UJ”). • When more than one method blank is analyzed with a sample batch, the average method
blank concentration will be used. • Detected congeners less than ten times their batch method blank concentration will be
considered non-detects (“U” or “UJ”).
11.2 Laboratory data package requirements Following completion of the sample analyses the laboratory will provide a standard deliverable package of results. This will also include all study relevant quality control data generated by the laboratory. The data package may also be transmitted in hard copy but is, at a minimum, required to be delivered electronically via email.

QAPP: PCB and Dieldrin Study in Albion WTP Page 28 – February 2016
11.3 Electronic transfer requirements See 11.2 and 11.5.
11.4 Acceptance criteria for existing data Very little toxics data exist for the Albion WWTP. Data will be considered acceptable if they underwent a Contract Laboratory Program (CLP) review and largely met all quality control requirements established in the quality assurance plan developed for the study. The result data must have also been deemed acceptable under the review for the study in which the samples were collected. Data generated from studies without an approved quality assurance project plan will not be accepted or used. Data referred to in this study will have met a quality assurance review.
11.5 EIM/STORET data upload procedures All data result transmittals from laboratories will be provided in an electronic data deliverable (EDD) format that meets Ecology requirements for loading to Ecology’s Information Management (EIM) database.
QAPP: PCB and Dieldrin Study in Albion WTP Page 29 – February 2016
12.0 Audits and Reports
12.1 Number, frequency, type, and schedule of audits NA
12.2 Responsible personnel NA
12.3 Frequency and distribution of report Following the conclusion of project field sampling, receipt of results, and a QA data review, the principal investigator will write a draft report describing study findings and how study was conducted. The report will include at a minimum the following:
• A map showing all sampling locations and any other pertinent features of the study area. • Coordinates of each sampling site. • Description of field and laboratory methods. • Discussion of data quality and the significance of any problems encountered. • Summary tables of the chemical and flow data. • Results of toxic contaminants related to WLAs and available criteria. • Study results with respect to study goals and objectives. • Conclusions and recommendations based on study findings. • Complete set of the QA data in the Appendix.
12.4 Responsibility for reports The Project Manager/Principal Investigator is responsible for writing the report. See Table 2 for details.

QAPP: PCB and Dieldrin Study in Albion WTP Page 30 – February 2016
13.0 Data Verification
13.1 Field data verification, requirements, and responsibilities NA
13.2 Lab data verification Data verification involves examining the data for errors, omissions, and compliance with quality control (QC) acceptance criteria. MEL’s SOPs for data reduction, review, and reporting will meet the needs of the project. Data packages, including QC results for analyses conducted by MEL, will be assessed by laboratory staff using the EPA Functional Guidelines for Organic Data Review. MEL staff will provide a written report of their data review which will include a discussion of whether (1) MQOs were met, (2) proper analytical methods and protocols were followed, (3) calibrations and controls were within limits, and (4) data were consistent, correct, and complete, without errors or omissions.
13.3 Validation requirements, if necessary NA 14.0 Data Quality (Usability) Assessment
14.1 Process for determining whether project objectives have been met After the project data have been reviewed and verified, the principal investigator will determine if the data are of sufficient quality to make determinations and decisions for which the study was conducted. The data from the laboratory’s QC procedures, as well as results from laboratory control standards and duplicates, will provide information to determine if MQOs have been met, along with an assessment of completeness, representativeness, and comparability. A review of sample results will be performed following each sampling event to assess the need for modifications to the sampling or analysis program. Laboratory and QA staff familiar with assessment of data quality may be consulted. The project final report will discuss data quality and whether the project objectives were met. If limitations in the data are identified, they will be noted.

QAPP: PCB and Dieldrin Study in Albion WTP Page 31 – February 2016
Some compounds may be reported near the detection capability of the selected methods. MQOs may be difficult to achieve for these results. MEL’s SOP for data qualification and best professional judgment will be used in the final determination of whether to accept, reject, or accept the results with qualification. The assessment will be based on a review of laboratory QC results. This will include assessment of laboratory precision, contamination (blanks), accuracy, matrix interferences, and the success of laboratory QC samples meeting MQOs.
14.2 Data analysis and presentation methods Data analysis will consist of PCB and dieldrin results combined with discharge information for the sample period to determine daily loading for comparison to WLAs set forth in the TMDL implementation plan. Target parameters will also be compared to water quality criteria for informational purposes. Data presentation will consist of summary result tables and simple bar graphs or scatter plots of the study results compared to WLAs or water quality criteria.
14.3 Treatment of non-detects Laboratory results reported for PCBs and dieldrin will include detected compounds and “J” qualified values (positively identified, estimated concentration) measured for each sample. Qualified results not included in PCB or dieldrin totals are “NJs” (tentatively identified, approximate concentration) and the non-detected compounds “U” (analyte not detected, preceding value is the sample quantitation limit) or “UJ” (analyte not detected above the approximate quantitation limit). See section 11.1.1 Reporting PCB Totals.
14.4 Sampling design evaluation The Project Manager/Principal Investigator will be responsible for deciding whether the laboratory data package meet the MQOs established in the QA study plan. The assessment will also determine completeness, representativeness, and comparability.
14.5 Documentation of assessment The study report will include a data quality assessment of findings included in the data quality section of the report.

QAPP: PCB and Dieldrin Study in Albion WTP Page 32 – February 2016
15.0 References
Friese, M., 2014. Standard Operating Procedures for Decontaminating Field Equipment for Sampling Toxics in the Environment. Washington State Department of Ecology, Olympia, WA. SOP Number EAP090. www.ecy.wa.gov/programs/eap/quality.html Intellicast, 2015. Albion, Washington’s monthly averages for temperature and precipitation. Accessed on September 3, 2015. http://www.intellicast.com/Local/History.aspx?location=USWA0006 Janisch, J., 2006. Standard Operating Procedure for Determining Global Position System Coordinates, Version 1.0. Washington State Department of Ecology, Olympia, WA. SOP Number EAP013. www.ecy.wa.gov/programs/eap/quality.html Johnson, A., E. Snouwaert, K. Kinney, and B. Era-Miller, 2007. Palouse River Chlorinated Pesticide and PCB Total Maximum Daily Load: Water Quality Improvement Report and Implementation Plan. Washington State Department of Ecology, Olympia, WA, Publication No, 07-03-018. https://fortress.wa.gov/ecy/publications/SummaryPages/0703018.html Joy, J., 2006. Standard Operating Procedure for Grab sampling – Fresh water, Version 1.0. Washington State Department of Ecology, Olympia, WA. SOP Number EAP015. www.ecy.wa.gov/programs/eap/quality.html Lubliner, B., 2009. Palouse River Watershed PCB and Dieldrin Monitoring, 2007-2008, Wastewater Treatment Plants and Abandoned Landfills. Washington State Department of Ecology, Olympia, WA. Publication No. 09-03-004. https://fortress.wa.gov/ecy/publications/SummaryPages/0903004.html Parsons, J., D. Hallock, K. Seiders, B. Ward, C. Coffin, E. Newell, C. Deligeannis, and K. Welch, 2012. Standard Operating Procedures to Minimize the Spread of Invasive Species, Version 2.0. Washington State Department of Ecology, Olympia, WA. SOP EAP070. www.ecy.wa.gov/programs/eap/quality.html USEPA, 1992. Specifications and Guidance for Contaminant Free Sample Containers. U.S. Environmental Protection Agency. Publication Nos. 9240.0-05A; A540/R-93/051. December 1992. WAC 173-201A. Water Quality Standards for Surface Waters in the State of Washington Washington State Department of Ecology, Olympia, WA. www.ecy.wa.gov/laws-rules/ecywac.html

QAPP: PCB and Dieldrin Study in Albion WTP Page 33 – February 2016
16.0 Figures
The figures in this QAPP are inserted after they are first mentioned in the text.

QAPP: PCB and Dieldrin Study in Albion WTP Page 34 – February 2016
17.0 Tables
The tables in this QAPP are inserted after they are first mentioned in the text.

QAPP: PCB and Dieldrin Study in Albion WTP Page 35 – February 2016
18.0 Appendix. Glossaries, Acronyms, and Abbreviations

QAPP: PCB and Dieldrin Study in Albion WTP Page 36 – February 2016
Glossary of General Terms Clean Water Act: A federal act passed in 1972 that contains provisions to restore and maintain the quality of the nation’s waters. Section 303(d) of the Clean Water Act establishes the TMDL program.
Dilution factor: The relative proportion of effluent to stream (receiving water) flows occurring at the edge of a mixing zone during critical discharge conditions as authorized in accordance with the state’s mixing zone regulations at WAC 173-201A-100. http://apps.leg.wa.gov/WAC/default.aspx?cite=173-201A-020
Effluent: An outflowing of water from a natural body of water or from a human-made structure. For example, the treated outflow from a wastewater treatment plant.
Influent: The inflow of water from a collection system or other conveyance to a wastewater treatment facility.
Load allocation: The portion of a receiving water’s loading capacity attributed to one or more of its existing or future sources of nonpoint pollution or to natural background sources.
Loading capacity: The greatest amount of a substance that a water body can receive and still meet water quality standards.
Margin of safety: Required component of TMDLs that accounts for uncertainty about the relationship between pollutant loads and quality of the receiving water body.
National Pollutant Discharge Elimination System (NPDES): National program for issuing, modifying, revoking and reissuing, terminating, monitoring, and enforcing permits, and imposing and enforcing pretreatment requirements under the Clean Water Act. The NPDES program regulates discharges from wastewater treatment plants, large factories, and other facilities that use, process, and discharge water back into lakes, streams, rivers, bays, and oceans.
Nonpoint source: Pollution that enters any waters of the state from any dispersed land-based or water-based activities, including but not limited to atmospheric deposition, surface-water runoff from agricultural lands, urban areas, or forest lands, subsurface or underground sources, or discharges from boats or marine vessels not otherwise regulated under the NPDES program. Generally, any unconfined and diffuse source of contamination. Legally, any source of water pollution that does not meet the legal definition of “point source” in section 502(14) of the Clean Water Act.
pH: A measure of the acidity or alkalinity of water. A low pH value (0 to 7) indicates that an acidic condition is present, while a high pH (7 to 14) indicates a basic or alkaline condition. A pH of 7 is considered to be neutral. Since the pH scale is logarithmic, a water sample with a pH of 8 is ten times more basic than one with a pH of 7.
Point source: Source of pollution that discharges at a specific location from pipes, outfalls, and conveyance channels to a surface water. Examples of point source discharges include municipal
QAPP: PCB and Dieldrin Study in Albion WTP Page 37 – February 2016
wastewater treatment plants, municipal stormwater systems, industrial waste treatment facilities, and construction sites where more than 5 acres of land have been cleared.
Pollution: Contamination or other alteration of the physical, chemical, or biological properties of any waters of the state. This includes change in temperature, taste, color, turbidity, or odor of the waters. It also includes discharge of any liquid, gaseous, solid, radioactive, or other substance into any waters of the state. This definition assumes that these changes will, or are likely to, create a nuisance or render such waters harmful, detrimental, or injurious to (1) public health, safety, or welfare, or (2) domestic, commercial, industrial, agricultural, recreational, or other legitimate beneficial uses, or (3) livestock, wild animals, birds, fish, or other aquatic life.
Streamflow: Discharge of water in a surface stream (river or creek).
Surface waters of the state: Lakes, rivers, ponds, streams, inland waters, salt waters, wetlands and all other surface waters and water courses within the jurisdiction of Washington State.
Total Maximum Daily Load (TMDL): A distribution of a substance in a water body designed to protect it from not meeting (exceeding) water quality standards. A TMDL is equal to the sum of all of the following: (1) individual wasteload allocations for point sources, (2) the load allocations for nonpoint sources, (3) the contribution of natural sources, and (4) a margin of safety to allow for uncertainty in the wasteload determination. A reserve for future growth is also generally provided.
Total suspended solids (TSS): Portion of solids retained by a filter.
Turbidity: A measure of water clarity. High levels of turbidity can have a negative impact on aquatic life.
Wasteload allocation (WLA): The portion of a receiving water’s loading capacity allocated to existing or future point sources of pollution. Wasteload allocations constitute one type of water quality-based effluent limitation.
Watershed: A drainage area or basin in which all land and water areas drain or flow toward a central collector such as a stream, river, or lake at a lower elevation.
Acronyms and Abbreviations BMP Best management practice Ecology Washington State Department of Ecology e.g. For example EIM Environmental Information Management database EPA U.S. Environmental Protection Agency et al. And others GIS Geographic Information System software GPS Global Positioning System i.e. In other words MEL Manchester Environmental Laboratory

QAPP: PCB and Dieldrin Study in Albion WTP Page 38 – February 2016
MQO Measurement quality objective NPDES (See Glossary above) NTR National Toxics Rule PBT persistent, bioaccumulative, and toxic substance PCB polychlorinated biphenyls QA Quality assurance RM River mile RPD Relative percent difference SOP Standard operating procedures TMDL (See Glossary above) TSS (See Glossary above) WAC Washington Administrative Code WRIA Water Resource Inventory Area WWTP Wastewater treatment plant Units of Measurement °C degrees centigrade cfs cubic feet per second ft feet g gram, a unit of mass m meter mm millimeter mg milligram mgd million gallons per day mg/d milligrams per day mg/L milligrams per liter (parts per million) mL milliliter ng/L nanograms per liter (parts per trillion) NTU nephelometric turbidity units pg/L picograms per liter (parts per quadrillion) s.u. standard units ug/L micrograms per liter (parts per billion)

QAPP: PCB and Dieldrin Study in Albion WTP Page 39 – February 2016
Quality Assurance Glossary Accreditation: A certification process for laboratories, designed to evaluate and document a lab’s ability to perform analytical methods and produce acceptable data. For Ecology, it is “Formal recognition by (Ecology)…that an environmental laboratory is capable of producing accurate analytical data.” [WAC 173-50-040] (Kammin, 2010) Accuracy: The degree to which a measured value agrees with the true value of the measured property. USEPA recommends that this term not be used, and that the terms precision and bias be used to convey the information associated with the term accuracy. (USGS, 1998) Analyte: An element, ion, compound, or chemical moiety (pH, alkalinity) which is to be determined. The definition can be expanded to include organisms, e.g., fecal coliform, Klebsiella. (Kammin, 2010) Bias: The difference between the population mean and the true value. Bias usually describes a systematic difference reproducible over time, and is characteristic of both the measurement system, and the analyte(s) being measured. Bias is a commonly used data quality indicator (DQI). (Kammin, 2010; Ecology, 2004) Blank: A synthetic sample, free of the analyte(s) of interest. For example, in water analysis, pure water is used for the blank. In chemical analysis, a blank is used to estimate the analytical response to all factors other than the analyte in the sample. In general, blanks are used to assess possible contamination or inadvertent introduction of analyte during various stages of the sampling and analytical process. (USGS, 1998) Calibration: The process of establishing the relationship between the response of a measurement system and the concentration of the parameter being measured. (Ecology, 2004) Check standard: A substance or reference material obtained from a source independent from the source of the calibration standard; used to assess bias for an analytical method. This is an obsolete term, and its use is highly discouraged. See Calibration Verification Standards, Lab Control Samples (LCS), Certified Reference Materials (CRM), and/or spiked blanks. These are all check standards, but should be referred to by their actual designator, e.g., CRM, LCS. (Kammin, 2010; Ecology, 2004) Comparability: The degree to which different methods, data sets and/or decisions agree or can be represented as similar; a data quality indicator. (USEPA, 1997) Completeness: The amount of valid data obtained from a project compared to the planned amount. Usually expressed as a percentage. A data quality indicator. (USEPA, 1997) Data Quality Objectives (DQO): Qualitative and quantitative statements derived from systematic planning processes that clarify study objectives, define the appropriate type of data, and specify tolerable levels of potential decision errors that will be used as the basis for establishing the quality and quantity of data needed to support decisions. (USEPA, 2006)

QAPP: PCB and Dieldrin Study in Albion WTP Page 40 – February 2016
Data set: A grouping of samples organized by date, time, analyte, etc. (Kammin, 2010) Data validation: An analyte-specific and sample-specific process that extends the evaluation of data beyond data verification to determine the usability of a specific data set. It involves a detailed examination of the data package, using both professional judgment, and objective criteria, to determine whether the MQOs for precision, bias, and sensitivity have been met. It may also include an assessment of completeness, representativeness, comparability and integrity, as these criteria relate to the usability of the data set. Ecology considers four key criteria to determine if data validation has actually occurred. These are: • Use of raw or instrument data for evaluation. • Use of third-party assessors. • Data set is complex. • Use of EPA Functional Guidelines or equivalent for review. Examples of data types commonly validated would be: • Gas Chromatography (GC). • Gas Chromatography-Mass Spectrometry (GC-MS). • Inductively Coupled Plasma (ICP). The end result of a formal validation process is a determination of usability that assigns qualifiers to indicate usability status for every measurement result. These qualifiers include: • No qualifier, data is usable for intended purposes. • J (or a J variant), data is estimated, may be usable, may be biased high or low. • REJ, data is rejected, cannot be used for intended purposes (Kammin, 2010; Ecology, 2004). Detection limit (limit of detection): The concentration or amount of an analyte which can be determined to a specified level of certainty to be greater than zero. (Ecology, 2004) Duplicate samples: Two samples taken from and representative of the same population, and carried through and steps of the sampling and analytical procedures in an identical manner. Duplicate samples are used to assess variability of all method activities including sampling and analysis. (USEPA, 1997) Field blank: A blank used to obtain information on contamination introduced during sample collection, storage, and transport. (Ecology, 2004) Laboratory Control Sample (LCS): A sample of known composition prepared using contaminant-free water or an inert solid that is spiked with analytes of interest at the midpoint of the calibration curve or at the level of concern. It is prepared and analyzed in the same batch of regular samples using the same sample preparation method, reagents, and analytical methods employed for regular samples. (USEPA, 1997) Matrix spike: A QC sample prepared by adding a known amount of the target analyte(s) to an aliquot of a sample to check for bias due to interference or matrix effects. (Ecology, 2004)

QAPP: PCB and Dieldrin Study in Albion WTP Page 41 – February 2016
Measurement Quality Objectives (MQOs): Performance or acceptance criteria for individual data quality indicators, usually including precision, bias, sensitivity, completeness, comparability, and representativeness. (USEPA, 2006) Method: A formalized group of procedures and techniques for performing an activity (e.g., sampling, chemical analysis, data analysis), systematically presented in the order in which they are to be executed. (EPA, 1997) Method blank: A blank prepared to represent the sample matrix, prepared and analyzed with a batch of samples. A method blank will contain all reagents used in the preparation of a sample, and the same preparation process is used for the method blank and samples. (Ecology, 2004; Kammin, 2010) Method Detection Limit (MDL): This definition for detection was first formally advanced in 40CFR 136, October 26, 1984 edition. MDL is defined there as the minimum concentration of an analyte that, in a given matrix and with a specific method, has a 99% probability of being identified, and reported to be greater than zero. (Federal Register, October 26, 1984) Parameter: A specified characteristic of a population or sample. Also, an analyte or grouping of analytes. Benzene and nitrate + nitrite are all “parameters.” (Kammin, 2010; Ecology, 2004) Population: The hypothetical set of all possible observations of the type being investigated. (Ecology, 2004) Precision: The extent of random variability among replicate measurements of the same property; a data quality indicator. (USGS, 1998) Quality Assurance (QA): A set of activities designed to establish and document the reliability and usability of measurement data. (Kammin, 2010) Quality Assurance Project Plan (QAPP): A document that describes the objectives of a project, and the processes and activities necessary to develop data that will support those objectives. (Kammin, 2010; Ecology, 2004) Quality Control (QC): The routine application of measurement and statistical procedures to assess the accuracy of measurement data. (Ecology, 2004) Relative Percent Difference (RPD): RPD is commonly used to evaluate precision. The following formula is used:
[Abs(a-b)/((a + b)/2)] * 100 where “Abs()” is absolute value and a and b are results for the two replicate samples. RPD can be used only with 2 values. Percent Relative Standard Deviation is (%RSD) is used if there are results for more than 2 replicate samples (Ecology, 2004).

QAPP: PCB and Dieldrin Study in Albion WTP Page 42 – February 2016
Replicate samples: Two or more samples taken from the environment at the same time and place, using the same protocols. Replicates are used to estimate the random variability of the material sampled. (USGS, 1998) Representativeness: The degree to which a sample reflects the population from which it is taken; a data quality indicator. (USGS, 1998) Sample (field): A portion of a population (environmental entity) that is measured and assumed to represent the entire population. (USGS, 1998) Sensitivity: In general, denotes the rate at which the analytical response (e.g., absorbance, volume, meter reading) varies with the concentration of the parameter being determined. In a specialized sense, it has the same meaning as the detection limit. (Ecology, 2004) Spiked sample: A sample prepared by adding a known mass of target analyte(s) to a specified amount of matrix sample for which an independent estimate of target analyte(s) concentration is available. Spiked samples can be used to determine the effect of the matrix on a method’s recovery efficiency. (USEPA, 1997) Split sample: A discrete sample that is further subdivided into portions, usually duplicates. (Kammin, 2010) Standard Operating Procedure (SOP): A document which describes in detail a reproducible and repeatable organized activity. (Kammin, 2010) Surrogate: For environmental chemistry, a surrogate is a substance with properties similar to those of the target analyte(s). Surrogates are unlikely to be native to environmental samples. They are added to environmental samples for quality control purposes, to track extraction efficiency and/or measure analyte recovery. Deuterated organic compounds are examples of surrogates commonly used in organic compound analysis. (Kammin, 2010) Systematic planning: A step-wise process which develops a clear description of the goals and objectives of a project, and produces decisions on the type, quantity, and quality of data that will be needed to meet those goals and objectives. The DQO process is a specialized type of systematic planning. (USEPA, 2006) References for QA Glossary Ecology, 2004. Guidance for the Preparation of Quality Assurance Project Plans for Environmental Studies. http://www.ecy.wa.gov/biblio/0403030.html Kammin, B., 2010. Definition developed or extensively edited by William Kammin, 2010. Washington State Department of Ecology, Olympia, WA. USEPA, 1997. Glossary of Quality Assurance Terms and Related Acronyms. U.S. Environmental Protection Agency. http://www.ecy.wa.gov/programs/eap/quality.html
QAPP: PCB and Dieldrin Study in Albion WTP Page 43 – February 2016
USEPA, 2006. Guidance on Systematic Planning Using the Data Quality Objectives Process EPA QA/G-4. U.S. Environmental Protection Agency. http://www.epa.gov/quality/qs-docs/g4-final.pdf USGS, 1998. Principles and Practices for Quality Assurance and Quality Control. Open-File Report 98-636. U.S. Geological Survey. http://ma.water.usgs.gov/fhwa/products/ofr98-636.pdf