
Quality Assurance and Quality Control (QA/QC) Procedures ... · Quality Assurance and Quality...
106
www.defra.gov.uk Quality Assurance and Quality Control (QA/QC) Procedures for UK Air Quality Monitoring under 2008/50/EC and 2004/107/EC September 2013 (updated September 2016)
Transcript of Quality Assurance and Quality Control (QA/QC) Procedures ... · Quality Assurance and Quality...

www.defra.gov.uk
Quality Assurance and Quality Control
(QA/QC) Procedures for UK Air Quality
Monitoring under 2008/50/EC and
2004/107/EC
September 2013 (updated September 2016)

© Crown copyright 2016
You may re-use this information (not including logos) free of charge in any format or
medium, under the terms of the Open Government Licence. To view this licence,
visit www.nationalarchives.gov.uk/doc/open-government-licence/ or write to the
Information Policy Team, The National Archives, Kew, London TW9 4DU, or e-mail:
This document/publication is also available on our website at:
www.gov.uk/defra
Any enquiries regarding this document/publication should be sent to us at:
Department for Environment, Food and Rural Affairs
Nobel House
17 Smith Square
London SW1P 3JR
Executive Summary
This report has been prepared for the UK Department of Environment, Food and
Rural Affairs (Defra) and the Devolved Administrations of Scotland, Wales and
Northern Ireland.
Within the UK, air quality monitoring is undertaken to provide information on air
pollutant concentrations. The primary function of the monitoring is to provide data for
the purpose of assessing the UK’s compliance with EU Directives on Air Quality. The
data are also used by scientists, policy makers and planners to enable them to make
informed decisions on managing and improving air quality for the benefit of health
and the natural environment.
The UK’s air quality compliance monitoring is divided into several sub-networks for
operational and management purposes. The relevant sub-networks are:
• The Automatic Urban and Rural Network (AURN);
• The UK Hydrocarbon Network;
• The UK Urban and Industrial Metals Network;
• The Rural Metals Network; and
• The Polycyclic Aromatic Hydrocarbons (PAH) Network.
To ensure that the data produced are fit for purpose, robust QA/QC procedures are
in place for each pollutant. Responsibility for their implementation rests with the
relevant management and QA/QC contractors for the sub-network. These ensure the
accuracy and precision of the published pollutant concentrations.
This report outlines the EU and UK data quality requirements and describes how these are addressed for all the relevant pollutants monitored. The report covers:
• Measurement methods
• Type-testing and equivalence of analysers
• Data telemetry, and validation of provisional data
• QA/QC including network inter-comparisons and data ratification
• Traceability of the measurements to national and international standards.
• Calculation of uncertainty for comparison with Data Quality Objectives.
Finally, a separate chapter is included, providing additional information on the
QA/QC arrangements in place for air quality monitoring in Gibraltar, where these
differ from those used in the UK.

Contents
1 Introduction ......................................................................................................... 1
1.1 Scope ............................................................................................................. 1
2 EU Requirements ................................................................................................ 3
2.1 EU Legislation on Ambient Air Quality ............................................................ 3
2.2 Pollutants Covered ......................................................................................... 4
2.3 Data Quality Objectives (DQOs) ..................................................................... 5
2.4 Measurement Methods ................................................................................... 6
3 Overview of UK Compliance Monitoring .............................................................. 8
3.1 Overview of the AURN ................................................................................... 9
3.2 Overview of the Hydrocarbon Network ......................................................... 13
3.3 Overview of the Urban and Industrial Metals Network .................................. 17
3.4 Overview of the Rural Metals Network ......................................................... 20
3.5 Overview of the PAH Network ...................................................................... 25
3.6 Other Measurements .................................................................................... 30
4 Type Testing and Equivalence of Analysers ..................................................... 33
4.1 EU Requirements ......................................................................................... 33
4.2 Type-Approval of Analysers for NOx, SO2, O3 and CO ................................ 33
4.3 Equivalence Testing for PM10 and PM2.5 ...................................................... 36
4.4 Equivalence and Type Testing of Benzene Measurement Techniques ........ 37
4.5 Equivalence and Type Testing of Metals Measurement Techniques ........... 38
4.6 Equivalence and Type Testing of PAH Measurement Techniques ............... 40
5 Data Telemetry, Validation and Dissemination ................................................. 41
5.1 Data Handling in the AURN .......................................................................... 41
5.2 Data Handling for Automatic Hydrocarbon Monitoring ................................. 44
5.3 Data Handling for Non-Automatic Benzene Monitoring ................................ 45
5.4 Data Handling for Metals Monitoring ............................................................ 46
5.5 Data Handling for PAH Monitoring ............................................................... 48
5.6 Data Handling for Other Measurements ....................................................... 49
6 Quality Assurance and Quality Control ............................................................. 52
6.1 UK National Reference Laboratories ............................................................ 52
6.2 QA/QC in the AURN ..................................................................................... 53
6.3 QA/QC of Automatic Hydrocarbon Measurements ....................................... 66
6.4 QA/QC of Non-Automatic Benzene Measurements ..................................... 67
6.5 QA/QC of Urban Metals Measurements ....................................................... 68
6.6 QA/QC of Rural Metals Measurements ........................................................ 70
6.7 QA/QC of PAH Measurements ..................................................................... 70
6.8 QA/QC for Other Measurements .................................................................. 71
7 Traceability of Measurements ........................................................................... 77
7.1 Traceability for NOx, SO2, CO and Zero Air ................................................. 77
7.2 Traceability for Ozone .................................................................................. 80
7.3 Traceability for PM10 and PM2.5 .................................................................... 81
7.4 Traceability of Automatic Hydrocarbon Measurements ................................ 82
7.5 Traceability of Non-Automatic Benzene Measurements ............................... 83
7.6 Traceability of Metals Measurements ........................................................... 83
7.7 Traceability of PAH Measurements .............................................................. 84
8 Uncertainty of the Measurements ..................................................................... 86
8.1 Uncertainty in the AURN .............................................................................. 87
8.2 Uncertainty of Automatic Hydrocarbon Measurements ................................ 88
8.3 Uncertainty of Non-Automatic Benzene Measurements ............................... 89

8.4 Uncertainty of Metals Measurements ........................................................... 90
8.5 Uncertainty of PAH Measurements .............................................................. 92
9 Gibraltar ............................................................................................................ 95
10 References ...................................................................................................... 96

1
1 Introduction
1.1 Scope This document provides information on the quality assurance and quality control
(QA/QC) procedures applied to air quality monitoring undertaken within the United
Kingdom (UK) to assess compliance with European Union (EU) Directives on air
quality.
For operational and management reasons, the UK’s air quality compliance
monitoring regime is organised into several constituent sub-networks. However, all
these networks form part of a single compliance network. The relevant sub-networks
are:
• The Automatic Urban and Rural Network (AURN);
• The UK Hydrocarbon Network;
• The UK Urban and Industrial Metals Network;
• The Rural Metals Network; and
• The Polycyclic Aromatic Hydrocarbons (PAH) Network.
This document is not intended as an operational reference manual for day-to-day
working purposes. Rather, it is intended to satisfy the requirement for a
comprehensive record of the QA/QC procedures used for the UK’s various types of
compliance monitoring, together in one document.
Section 2 of this document lists the relevant Directives and the pollutants they cover,
the reference methods, and the Data Quality Objectives (DQOs). Section 3 then
provides an overview of the UK’s compliance monitoring - the pollutants measured
by each sub-network, techniques used, network operation and quality management
procedures.
For each sub-network, this document then describes:
• Type testing and equivalence requirements and procedures (section 4)
• How data are collected from the monitoring sites, how they are handled and
how the provisional data are disseminated to the public and other
stakeholders (section 5).
• QA/QC: how the instruments are calibrated, the precision and accuracy
quantified and monitored, and the processes of data validation and ratification
(section 6).

2
• Details of traceability: in particular, how the requirements of the relevant EU
Directives are met, for measurements to be traceable in accordance with
ISO/IEC 17025:2005 (section 7).
• Measurement and calculation of uncertainty (section 8).
The final section provides additional information on the QA/QC arrangements in
place for air quality monitoring in Gibraltar. The section highlights which aspects
differ from those used in the UK and, where differences exist, the procedures used in
Gibraltar are outlined.
3
2 EU Requirements
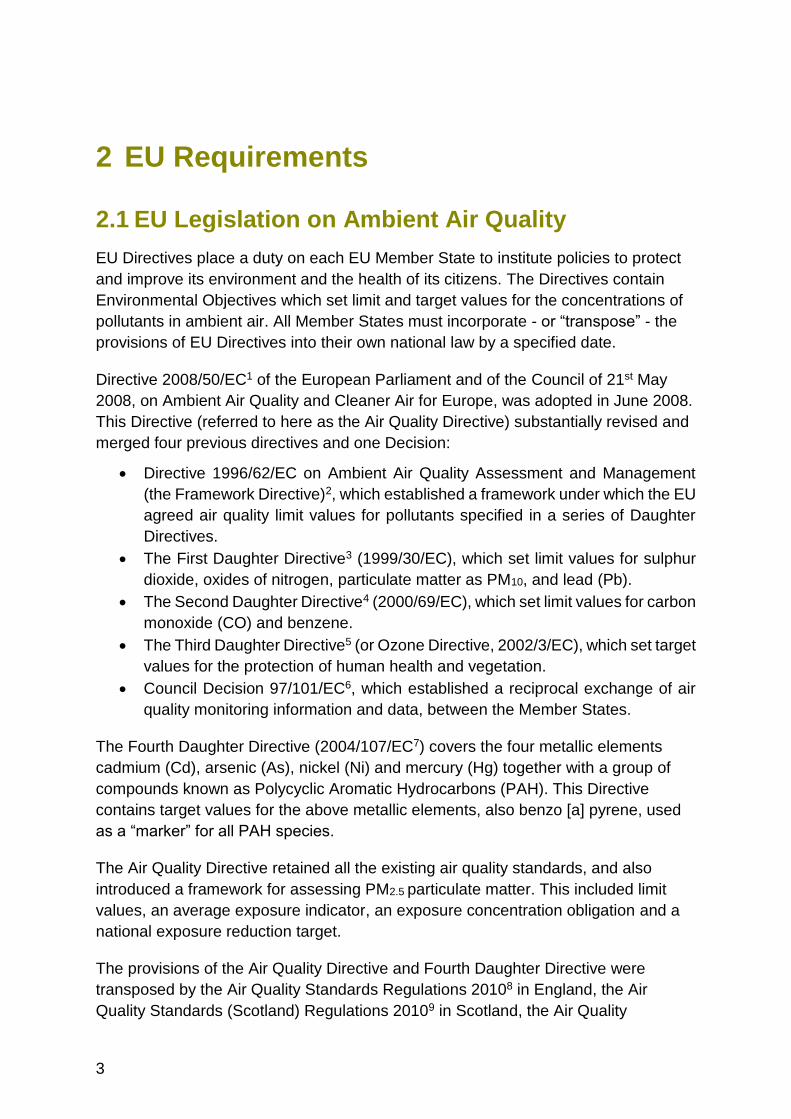
2.1 EU Legislation on Ambient Air Quality
EU Directives place a duty on each EU Member State to institute policies to protect
and improve its environment and the health of its citizens. The Directives contain
Environmental Objectives which set limit and target values for the concentrations of
pollutants in ambient air. All Member States must incorporate - or “transpose” - the
provisions of EU Directives into their own national law by a specified date.
Directive 2008/50/EC1 of the European Parliament and of the Council of 21st May
2008, on Ambient Air Quality and Cleaner Air for Europe, was adopted in June 2008.
This Directive (referred to here as the Air Quality Directive) substantially revised and
merged four previous directives and one Decision:
• Directive 1996/62/EC on Ambient Air Quality Assessment and Management
(the Framework Directive)2, which established a framework under which the EU
agreed air quality limit values for pollutants specified in a series of Daughter
Directives.
• The First Daughter Directive3 (1999/30/EC), which set limit values for sulphur
dioxide, oxides of nitrogen, particulate matter as PM10, and lead (Pb).
• The Second Daughter Directive4 (2000/69/EC), which set limit values for carbon
monoxide (CO) and benzene.
• The Third Daughter Directive5 (or Ozone Directive, 2002/3/EC), which set target
values for the protection of human health and vegetation.
• Council Decision 97/101/EC6, which established a reciprocal exchange of air
quality monitoring information and data, between the Member States.
The Fourth Daughter Directive (2004/107/EC7) covers the four metallic elements
cadmium (Cd), arsenic (As), nickel (Ni) and mercury (Hg) together with a group of
compounds known as Polycyclic Aromatic Hydrocarbons (PAH). This Directive
contains target values for the above metallic elements, also benzo [a] pyrene, used
as a “marker” for all PAH species.
The Air Quality Directive retained all the existing air quality standards, and also
introduced a framework for assessing PM2.5 particulate matter. This included limit
values, an average exposure indicator, an exposure concentration obligation and a
national exposure reduction target.
The provisions of the Air Quality Directive and Fourth Daughter Directive were
transposed by the Air Quality Standards Regulations 20108 in England, the Air
Quality Standards (Scotland) Regulations 20109 in Scotland, the Air Quality

4
Standards (Wales) Regulations 2010 in Wales10 and the Air Quality Standards
Regulations (Northern Ireland) 201011.
As of 12th December 2011, Commission Implementing Decision 2011/850/EU12
introduced new rules for Directives 2004/107/EC and 2008/50/EC as regards the
reciprocal exchange of information and reporting on ambient air quality. These rules
are commonly known as the air quality e-reporting Implementing Provisions for
Reporting.
The Directive provides a common approach to the assessment of ambient air quality
for Member States, thus improving comparability of data and benchmarking, through
the use of standardised measurement techniques and criteria for monitoring sites
and reporting. The QA/QC ensures that these methods and criteria are adhered to in
the UK, in order to maximise confidence in the resulting data.
2.2 Pollutants Covered
The above Directives require assessment of the following pollutants:
• Sulphur dioxide (SO2)
• Nitrogen dioxide (NO2) and total oxides of nitrogen (NOx)
• Carbon monoxide (CO)
• Benzene
• Particulate matter as PM10 and PM2.5
• Ozone
• Ozone precursor substances (note – there are no limit or target values, or
DQOs, for these.)
• Lead
• Arsenic
• Cadmium
• Nickel
• Mercury
• Benzo (a) pyrene, as an indicator species for the group of compounds known
as PAH.
• Additional recommended PAH species.
• Deposition of PAH and metallic elements in the particulate phase. (Note –
there are no limit or target values for these.)
The Air Quality Directive also requires the measurement of the following
chemical species in the PM2.5 fraction: sulphate (SO42-), nitrate (NO3
-), sodium
ion (Na+), potassium ion (K+), ammonium ion (NH4+), chloride ion (Cl-), calcium
5
ion (Ca2+), magnesium ion (Mg2+), elemental carbon (EC) and organic carbon
(OC). These are to be measured in rural background areas. (Note – there are no
limit or target values, or DQOs, for these.)
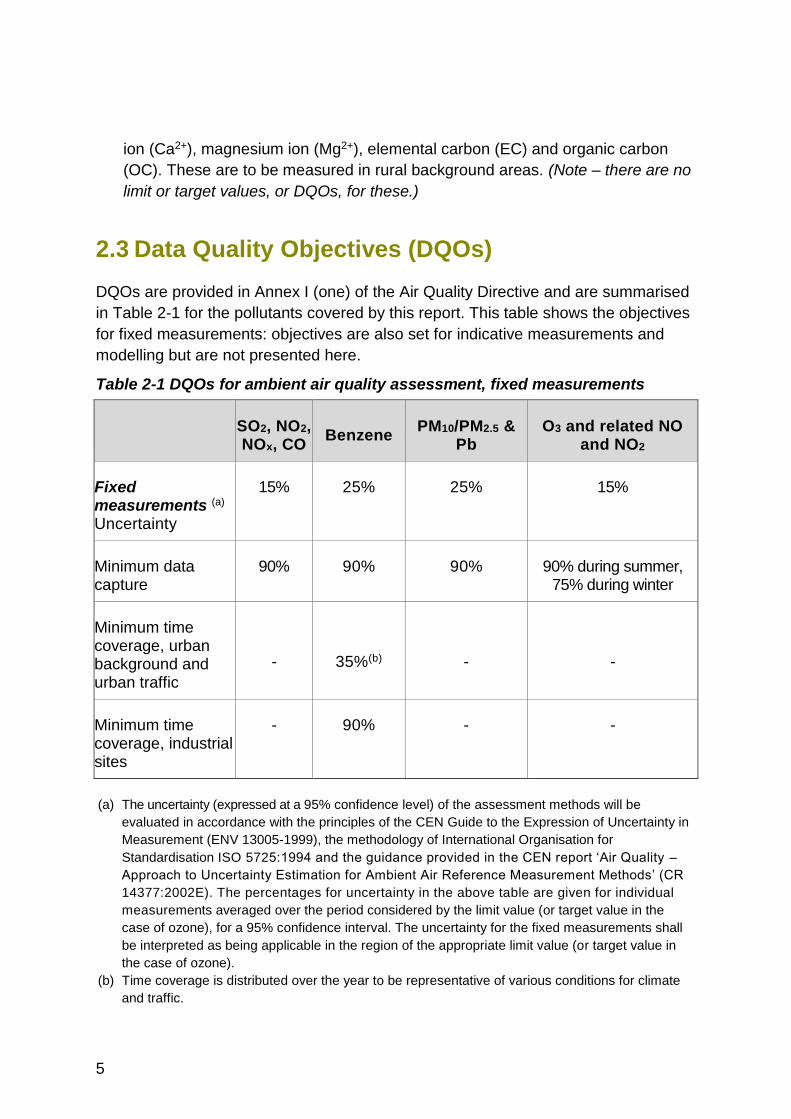
2.3 Data Quality Objectives (DQOs)
DQOs are provided in Annex I (one) of the Air Quality Directive and are summarised
in Table 2-1 for the pollutants covered by this report. This table shows the objectives
for fixed measurements: objectives are also set for indicative measurements and
modelling but are not presented here.
Table 2-1 DQOs for ambient air quality assessment, fixed measurements
SO2, NO2, NOx, CO
Benzene PM10/PM2.5 &
Pb O3 and related NO
and NO2
Fixed measurements (a)
Uncertainty
15% 25% 25% 15%
Minimum data capture
90% 90% 90% 90% during summer, 75% during winter
Minimum time coverage, urban background and urban traffic
-
35%(b)
-
-
Minimum time coverage, industrial sites
- 90% - -
(a) The uncertainty (expressed at a 95% confidence level) of the assessment methods will be
evaluated in accordance with the principles of the CEN Guide to the Expression of Uncertainty in
Measurement (ENV 13005-1999), the methodology of International Organisation for
Standardisation ISO 5725:1994 and the guidance provided in the CEN report ‘Air Quality –
Approach to Uncertainty Estimation for Ambient Air Reference Measurement Methods’ (CR
14377:2002E). The percentages for uncertainty in the above table are given for individual
measurements averaged over the period considered by the limit value (or target value in the
case of ozone), for a 95% confidence interval. The uncertainty for the fixed measurements shall
be interpreted as being applicable in the region of the appropriate limit value (or target value in
the case of ozone).
(b) Time coverage is distributed over the year to be representative of various conditions for climate
and traffic.

6
Calculation of data coverage and allowance for planned maintenance will be taken
into account in determining compliance with the DQOs. In the 4th Daughter Directive,
DQOs are provided in Annex IV. These are summarised in Table 2-2.
Table 2-2 Data Quality Objectives of 4th Daughter Directive
B[a]P As, Cd and Ni
PAH other than B[a]P, and total gaseous Hg
Total Deposition
Uncertainty
Fixed and indicative measurements
50% 40% 50% 70%
Modelling 60% 60% 60% 60%
Minimum data capture
90% 90% 90% 90%
Minimum time coverage
Fixed measurements
30% 50% - -
Indicative measurements a
14% 14% 14% 33%
a Indicative measurements being measurements that are performed at a reduced regularity but fulfil the other data quality
objectives
Details of how measurement uncertainty is calculated are provided in section 9. The
managers of each sub-network are required to report compliance with the above
DQOs on an annual basis. Annual reports from the sub-networks are published
online via the “Library” section of the Defra UK Air Information Resource, UK-AIR,
under the option for “Monitoring Networks”- see http://uk-
air.defra.gov.uk/library/reports?section_id=13 .
2.4 Measurement Methods
The EU reference methods of measurement for the various pollutants are specified
in Annex VI of the Air Quality Directive. These are the Standard Methods developed
7
by CEN (the European Committee for Standardisation) and realised in the UK
through published British Standards (BS) as follows:
• BS EN14211:200513 (NOx).
• BS EN14212:200514 (SO2).
• BS EN14625:200515 (O3).
• BS EN14626:200516 (CO).
• BS EN12341:199917 (PM10).
• BS EN14907:200518 (PM2.5).
• BS EN14662-3:200519 (benzene, C6H6).
• BS EN14902:200520 (Pb, Cd, As, and Ni in the PM10 fraction of suspended
particulate matter).
• BS EN15853:201021, (Hg deposition).
• BS EN15841:200922, (As, Cd, Pb and Ni in atmospheric deposition).
UK experts work closely with CEN to develop standards describing how analysers
should be tested, approved for use, calibrated and have their ongoing performance
determined. The standards allow Member States to reliably and consistently quantify
the uncertainties associated with their measurements of air pollution. CEN, through
the various Working Groups, continue to revise and improve the Standards as new
information becomes available. Many of the QA/QC procedures adopted in the UK
arise directly from the requirements of the CEN standard methods and are described
in later sections of this report.

8
3 Overview of UK Compliance Monitoring
The pollutants measured in the UK air quality compliance monitoring sub-networks
are detailed in Table 3-1.
Table 3-1 The UK’s Air Quality Compliance Monitoring in 2012
Sub-Network Pollutants
Automatic Urban and
Rural Network
(AURN)
Ambient concentrations of CO, NOx, NO (with NO2 calculated
as NOx - NO), SO2, O3, PM10, PM2.5.
UK Hydrocarbon
Network
Ambient concentrations of Benzene and a range of VOCs
UK Urban and
Industrial Metals
Network
Ambient concentrations of As, Cd, cobalt (Co), chromium
(Cr), copper (Cu), iron (Fe), particulates-bound mercury
(Hg[p]), total mercury (Hg[t]), total gaseous mercury (Hg[v]),
manganese (Mn), Ni, Pb, platinum (Pt), selenium (Se),
vanadium (V), zinc (Zn)
Rural Metals
Network
Ambient concentrations, and deposition in the particulate
phase, of aluminium (Al), As, barium (Ba), beryllium (Be), Cd,
Co, Cr, caesium (Cs), Cu, Fe, mercury (Hg) lithium (Li), Mn,
molybdenum (Mo), Ni, Pb, rubidium (Rb), antimony (Sb),
scandium (Sc), Se, tin (Sn), strontium (Sr), titanium (Ti),
uranium (U), vanadium (V), tungsten (W), Zn
PAH Network Ambient concentrations, and deposition in the particulate
phase, of 40 PAH species including benzo[a]pyrene.
Particle Numbers
and Concentrations
Network
Elemental Carbon (EC) and Organic Carbon (OC) in PM2.5.
UKEAP Network The following cations and anions in the PM2.5 fraction, in rural
background areas: sulphate (SO42-), nitrate (NO3
-), sodium ion
(Na+), potassium ion (K+), ammonium ion (NH4+), chloride ion
(Cl-), calcium ion (Ca2+), magnesium ion (Mg2+).

9
Other air quality research monitoring is undertaken in further sub-networks in the UK
but is not detailed here as it is not used for compliance purposes. For information on
these other monitoring programmes, please refer to the following page on Defra’s
online UK Air Information Resource (UK-AIR): http://uk-
air.defra.gov.uk/networks/network-info?view=non-automatic .
3.1 Overview of the AURN
The Automatic Urban and Rural Network (AURN) is the largest automatic monitoring
network in the UK and provides the majority of the UK’s statutory compliance
monitoring evidence base. Data from the AURN are available on Defra’s online UK
Air Information Resource, UK-AIR at http://uk-air.defra.gov.uk/. The AURN aims to:
• Inform the public about air quality in near-real time.
• Provide data for comparison with statutory air quality standards,
objectives, target and limit values.
• Assess effects of air pollution on health and the environment
• Inform and support the development of cost-effective planning solutions
and identify long-term trends and sources of pollution.
• Inform policy development.
• Provide data for use by the scientific community in research.
• Enhance our understanding of atmospheric chemistry.
3.1.1 Pollutants measured in the AURN
The pollutants measured by the AURN are listed in Table 3-1 above.
3.1.2 Measurement Techniques Used in the AURN
The AURN consists predominantly of automatic monitoring equipment. Gaseous
pollutants are monitored with the defined EU reference methods. For particulate
matter the AURN is based on methods which have demonstrated equivalence to the
reference method, but which (unlike the reference method) allow continuous on-line
monitoring. A small number of sites use Partisol gravimetric samplers providing daily
mean results. Details are provided in Table 3-2.

10
Table 3-2 AURN Measurement Techniques
Pollutant CEN standard/ref method Details
O3 EN 14625:2012 “Ambient air quality – standard method for the measurement of the concentration of ozone by ultraviolet photometry”
UV absorption: ozone absorbs UV light. The absorption of UV by sampled air is used to calculate the ozone concentration.
NO2/NOx EN 14211:2012 “Ambient air quality - Standard method for the measurement of the concentration of nitrogen dioxide and nitrogen monoxide [i.e. nitric oxide] by Chemiluminescence”
Chemiluminescence: this method measures the energy emitted when nitric oxide (NO) is reacted with ozone (O3) in an evacuated chamber to form chemiluminescent nitrogen dioxide (NO2).
SO2 EN 14212:2012 “Ambient air quality – Standard method for the measurement of the concentration of sulphur dioxide by UV fluorescence”
UV fluorescence: SO2 molecules are excited to higher energy states by UV radiation. These excited molecules then release their energy as fluorescent radiation. The intensity of this is used to measure the concentration of SO2 in sampled air.
CO EN 14626:2012 “Ambient air quality - Standard method for the measurement of the concentration of carbon monoxide by non-dispersive infra red spectroscopy”
IR absorption: CO strongly absorbs infrared
radiation of wavelength 4.5 to 4.9 µm. A reference detection system is used to alternately measure absorption due to CO in the sampled air stream and a high-concentration pure CO signal as a correlated reference. An infrared detector gives a signal proportional to the CO concentration.
PM10 and PM2.5
EN 12341:1999 “Air quality. Determination of the PM10 fraction of suspended particulate matter. Reference method and field test procedure to demonstrate reference equivalence of measurement methods”
EN 14907:2005 “Ambient air quality - Standard gravimetric measurement method for the determination of the PM2.5 mass fraction of suspended particulate matter”
The AURN uses three methods which are equivalent for one or both parameters:
The Filter Dynamic Measurement System (FDMS), which determines particulate concentration by continuously weighing particles deposited on a filter.
The Beta-Attenuation Monitor (BAM) which measures the attenuation of beta rays passing through a paper filter on which particulate matter from sampled air has been collected.
The Partisol – a gravimetric sampler that collects daily samples onto a filter for subsequent weighing.
11
Between 2004 and 2006 a series of tests on ambient particulate analysers was
undertaken by Bureau Veritas on behalf of Defra and the UK Devolved
Administrations (DAs)23. The purpose of the test programme was to test the overall
performance of a number of ‘candidate’ particulate matter samplers with that of the
EU reference methods for PM10 and PM2.5 particulate fractions. The aims of these
tests were to assess the achievement of criteria of the DQOs in Annex 1 of the Air
Quality Directive, and to provide the required information for the Competent Authority
(Defra and the DAs) to decide whether to declare the instruments equivalent to the
reference method for use in the UK.
For those particulate matter monitoring instruments that are in the AURN, the
previously reported 2006 equivalence trials data (as well as further data collected
since) were reprocessed in accordance with the January 2010 version of The Guide
to Demonstration of Equivalence (GDE)24. This GDE supersedes a version
previously published in November 2005. A new document, EN TS16450, will be
brought out in the near future and may be incorporated into the Air Quality Directive
at a later date.
The 2010 update of the 2006 equivalence trial data showed that for the instruments
deployed in the original tests (the Filter Dynamic Measurement System FDMS 8500,
Partisol 2025 and PM10 Unheated Beta Attenuation Monitor BAM 1020), the results
and recommendations are still valid25. This justifies the UK's continued use of these
instruments within the AURN.
3.1.3 AURN Network Operation and Management
Several organisations are involved in the day-to-day running of the network, under
contract to Defra and the DAs. At the time of writing (2013), the role of Central
Management and Co-ordination Unit (CMCU) for the AURN is contracted to Bureau
Veritas, whilst the Environmental Research Group of King’s College London has
been appointed as CMCU for a number of AURN monitoring sites in London and the
South East. Ricardo-AEA currently undertakes the role of Quality Assurance and
Control Unit (QA/QC Unit) for sites within the AURN. The responsibility for operating
individual monitoring sites is assigned to local site operators (LSOs) with relevant
experience in the field under the direct management of (and under contract to)
CMCU. Calibration gases for the network are supplied by Air Liquide UK Ltd and are
provided with a United Kingdom Accreditation Service (UKAS) certificate of
calibration by Ricardo-AEA. The monitoring equipment is serviced and maintained by
a number of Equipment Support Units (ESUs), under contract to the CMCU.
Dissemination of the data from the AURN via the online Air Information Resource
(UK-AIR) at http://uk-air.defra.gov.uk/ and other media such as free telephone
services and Twitter is undertaken by the Data Dissemination Unit (under separate
12
contract). A summary report of the data is also published annually in the “Air
Pollution in the UK” series of reports, available online via UK-AIR.
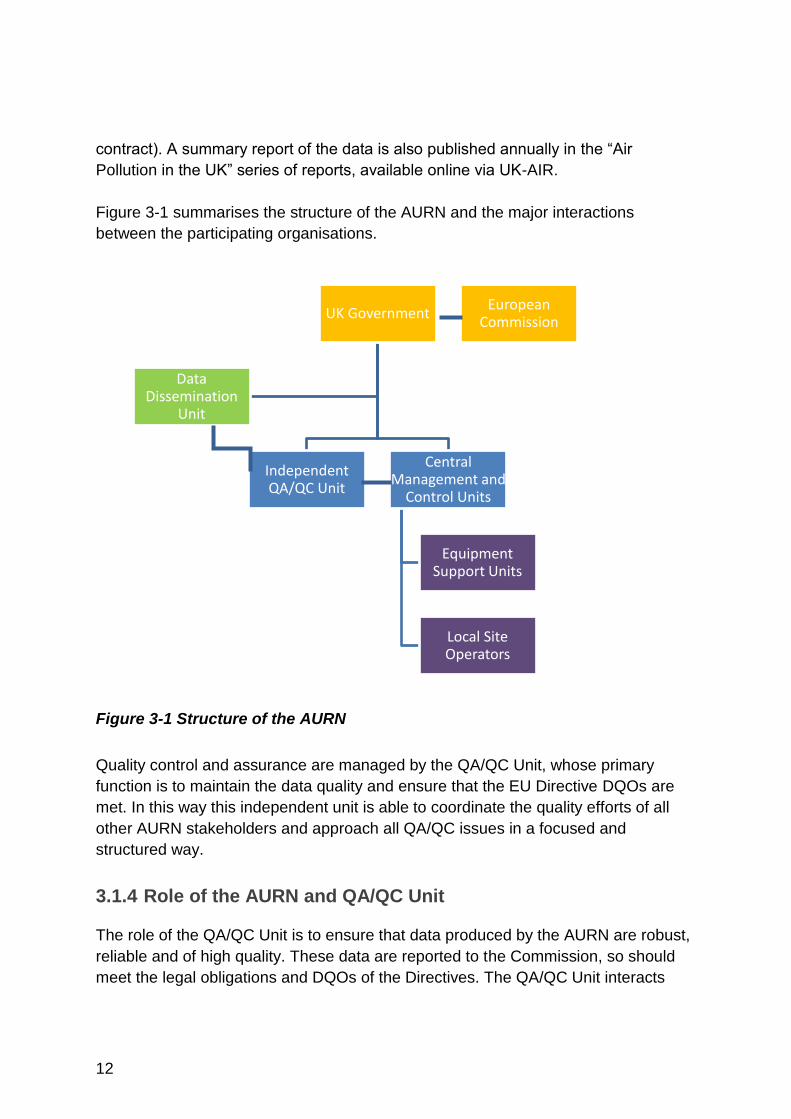
Figure 3-1 summarises the structure of the AURN and the major interactions
between the participating organisations.
Figure 3-1 Structure of the AURN
Quality control and assurance are managed by the QA/QC Unit, whose primary
function is to maintain the data quality and ensure that the EU Directive DQOs are
met. In this way this independent unit is able to coordinate the quality efforts of all
other AURN stakeholders and approach all QA/QC issues in a focused and
structured way.
3.1.4 Role of the AURN and QA/QC Unit
The role of the QA/QC Unit is to ensure that data produced by the AURN are robust,
reliable and of high quality. These data are reported to the Commission, so should
meet the legal obligations and DQOs of the Directives. The QA/QC Unit interacts
UK Government
Independent QA/QC Unit
Central Management and
Control Units
Equipment Support Units
Local Site Operators
Data Dissemination
Unit
European Commission

13
closely with the AURN CMCU and Gas Provision contractors to ensure that these
network objectives are met.
Compliance with the data capture objectives of the Air Quality Directive, for each
pollutant at each site, is currently reported quarterly in the series of reports entitled
“QA/QC Data Ratification Report for the Automatic Urban and Rural Network”,
available via the Library pages of UK-AIR (see http://uk-air.defra.gov.uk/library/ ).
The quarterly report for the final three months of the year (October to December)
contains a summary of data capture for the full calendar year. At the time of writing,
the most recent annual report for the AURN is for 201126.
3.2 Overview of the Hydrocarbon Network
The Air Quality Directive requires measurement and reporting of benzene (which is
covered by the Air Quality Directive as a pollutant in its own right), and ozone
precursor substances. The ozone precursor substances include volatile organic
compounds (VOCs): Annex X (ten) of the Directive provides a list of 29 species
recommended for measurement. The Hydrocarbon Network includes three
components: the Automatic Hydrocarbon Network, European monitoring and
Evaluation Programme (EMEP) supersites and the Non-Automatic Hydrocarbon
Network.
Ozone precursor measurement is carried out by the Automatic Hydrocarbon
Network. Automatic hourly measurements of a range of hydrocarbon species
(including all the ozone precursor species specified in Annex X of the Directive
except formaldehyde and total non-methane hydrocarbons), are made using
automated pumped sampling with in-situ gas chromatography, at four sites in the
UK. The VOCs monitored include benzene. Following advice from the UK Air
Quality Expert Group (AQEG) Defra requested additional measurements in response
to the potential increase of aldehyde emissions from biofuels. Formaldehyde and
acetaldehyde have been measured from August 2012 at five UK sites. These are all
co-located with AURN sites.
Two monitoring sites, at Harwell in Oxfordshire and Auchencorth Moss in Lothian,
are also part of the European EMEP programme, an international co-operative
programme for monitoring and evaluation of the long-range transmissions of air
pollutants in Europe (see http://pollutantdeposition.defra.gov.uk/emep for further
details).
The four automatic Hydrocarbon Network sites are accompanied by a network of 34
non-automatic sites. These measure ambient concentrations of benzene only, by the
CEN standard method27, which involves pumping air through an adsorption tube to

14
trap the compound, which is later analysed in a laboratory. At each site two tubes
sample alternately every eight minutes for a fortnightly exposure period. This
network monitors compliance with the Air Quality Directive’s limit value for benzene.
All non-automatic sites in the Hydrocarbon Network are co-located with AURN sites.
3.2.1 Pollutants Measured in the Hydrocarbon Network
Table 3-3 shows the compounds measured in the Hydrocarbons network. Only
benzene monitoring is required for compliance with the Air Quality Directive.
Table 3-3 Compounds Measured by the Hydrocarbons Network (including the
Automatic Hydrocarbon Network, EMEP supersites and the Non-Automatic
Hydrocarbon Network)
Compounds
ethane 2-methylpentane
ethene n-hexane
propane isoprene
propene benzene
ethyne i-octane
i-butane n-heptane
n-butane n-octane
trans-2-butene Toluene
1-butene ethylbenzene
cis-2-butene meta- and para-xylene
i-pentane ortho-xylene
n-pentane 1,3,5-trimethylbenzene
1,3-butadiene 1,2,4-trimethylbenzene
trans-2-pentene 1,2,3-trimethylbenzene
1-pentene
15
3.2.2 Techniques used in the Hydrocarbon Network
The automatic hydrocarbon network (for ozone precursor compounds and benzene)
uses automated pumped sampling with in-situ gas chromatography. The sample is
drawn from the ambient atmosphere to the analyser in as short a time as possible.
This is achieved by use of a high volume sample manifold, where ambient air is
drawn through the manifold to a point close to the inlet of the analyser. The rate at
which the air is drawn through this high volume inlet is such that the sample remains
in the manifold for less than one second. It is then sampled from this point at a low
flow rate into the analyser.
The analytical system within the automatic hydrocarbon analyser consists of an
automatic trapping/thermal desorptioning system (using Peltier cooling) connected to
a conventional gas chromatograph (GC). The thermal desorber (TD) collects the
sample from ambient air. The TD extracts the analytes from the sample onto a
Peltier cooled adsorbent trap. The trapped analytes are thermally desorbed and
carried through a heated transfer line by carrier gas into the GC. The GC contains
two columns and a heartcut device to separate, by volatility, the analytes into two
fractions. The more volatile fraction is separated on a PLOT (Porous Layer Open
Tubular) column whereas the less volatile fraction is separated on a methyl silicone
column. A flame ionization detector monitors the chromatography on each column.
The control and data-handling system are run from a computer. The system is
supplied with gases from a hydrogen generator, zero air compressor and a helium
carrier gas cylinder.
3.2.3 Hydrocarbon Network Operation and Management
Several organisations are involved in the day-to-day running of the network, under
contract to Defra. At the time of writing (2013), the role of CMCU for the Hydrocarbon
Network is contracted to Ricardo-AEA, which also undertakes the role of QA/QC
Unit. The responsibility for operating individual monitoring sites is assigned to LSOs
with relevant experience in the field under the direct management of (and under
contract to) the CMCU. Calibration gases for the network are supplied by the
National Physical Laboratory (NPL). The monitoring equipment is serviced and
maintained by PerkinElmer, under contract to the CMCU.
Key aspects of the operation and management of this network are as follows:
• Maintenance of the monitoring instruments and associated ancillary
equipment in the network.
• Provision of on-site consumables.

16
• Carrying out preliminary validation of the data, for which proprietary pattern
recognition software “MatchFinder” is used along with other computer
software.
• Supplying these data to the Data Dissemination Unit.
• Retaining and maintaining the raw and validated air quality data in a separate
archive.
• Taking appropriate actions, in consultation with the QA/QC contractor, to
ensure that the network achieves the data quality objectives of the Air Quality
Directive for benzene.
3.2.4 Quality Management in the Hydrocarbon Network
The main aspects of quality management in the hydrocarbon network are:
• Regular visits to network sites (at least once per year) and meetings with the
LSOs in order to discuss and review the condition of the site and equipment,
data capture and associated issues.
• An annual inter-calibration, with provision of advice, and where necessary, of
any service and maintenance requirements arising from the findings.
• Yearly auditing of LSO operations, including the provision of operator training.
These audits are timed to coincide with the inter-calibration to ensure cost-
efficiency.
• Ratification of validated data provided by the CMCU. The ratified data are
transferred to the Defra online air quality information resource (UK-AIR) within
three months of receipt of data.
• Quarterly progress reporting to Defra to cover the operation of the network,
data capture performance and trend analysis.
• Annual reports are produced to summarise the data collected. These reports
describe the data collected and reported for the calendar year.
• Long term data analysis.
• Attendance at the annual network review meeting with the CMCU, Defra,
LSOs and other stakeholders.
• Provision of policy advice on hydrocarbon monitoring issues and data
interpretation to Defra, LSOs, the Air Quality Expert Group and other review
groups as requested.
• Provision of calibration gases for both routine site calibration checks and six-
monthly network intercalibrations.
• Provision of annual benzene and ozone precursor measurement data, for
reporting to the Commission by 30th September of the following year.
• Attendance at any relevant EU intercomparisons and meetings. These are
usually held at the EU Joint Research Council, Ispra although in the past
17
intercomparisons have also consisted of a ‘round robin’ analysis of travelling
gas mixtures.
An annual report is produced covering both the automatic and non-automatic
hydrocarbon monitoring. This includes comparison of the Network’s performance
with the Directive DQOs. The most recent report can be found at http://uk-
air.defra.gov.uk/library/reports?section_id=13 28.
3.3 Overview of the Urban and Industrial Metals
Network
The UK Urban and Industrial Metals Monitoring Network measures metal
concentrations in PM10 in urban locations. As of December 2012, this network
comprised 25 monitoring sites around the country (15 in England, seven in Wales,
two in Scotland and one in Northern Ireland). The Network is also referred to as the
UK Heavy Metals Monitoring Network. The contractor responsible for the
management of this network is the National Physical Laboratory (NPL).
The Network has the following objectives:
• To achieve compliance with monitoring requirements set out in European
legislation.
• To provide data to the UK Government and European Commission (EC) on
the UK’s performance against the limit values, target values, and DQOs
described in the relevant legislation.
• To assess impacts around ‘hot spots’ of metallic pollution to air, particularly in
industrial areas.
• To produce accurate and reliable data for dissemination to the general public
and for use by scientific and medical researchers and the air quality
community.
The UK Urban and Industrial Metals Monitoring Network is the regulatory air quality
monitoring network that fulfils the majority of the UK’s obligation under the Air Quality
Directives relating to the monitoring of the mass concentrations of lead, nickel,
arsenic and cadmium, in the PM10 phase of ambient air, and total gaseous mercury
(referred to as: Hg(v)). The Network forms the basis of the UK’s compliance
monitoring for:
• The Air Quality Directive (for lead).
• The Fourth Daughter Directive (for arsenic, cadmium, nickel and mercury).
18
The Urban and Industrial Metals Network does not make any measurements of
deposition of metallic elements.
3.3.1 Pollutants measured in the Urban and Industrial Metals
Network
The full suite of metals measured by the Network in PM10 is: arsenic, cadmium,
cobalt, chromium, copper, iron, manganese, nickel, lead, platinum, selenium,
vanadium, zinc and mercury.
3.3.2 Measurement Techniques used in the Urban and Industrial
Metals Network
Ambient concentrations of metals are measured by sampling in the PM10 phase of
ambient air, onto filters. This is done using Partisol 2000 instruments (fitted with
PM10 selective inlet heads) operating at a calibrated flow rate, nominally of 1 m3 h-1.
This sampling is carried out in accordance with EN 12341:1999. The filters are then
returned to the contractor’s laboratory where they are analysed to determine the
content of various metals in the particulate matter, in order to produce concentration
values for these metals in ambient air according to EN 14902:2005.
Total gaseous mercury is additionally sampled onto adsorption tubes at 13 of these
Network sites (seven in England, three in Wales, two in Scotland, and one in
Northern Ireland). These absorption tubes are then analysed at the contractor’s
laboratory according to EN 15852:201029 to produce concentration values for total
gaseous mercury in ambient air.
Weekly concentration data are produced for metals in PM10 at six locations and for
mercury vapour at three locations. All other stations produce data averaged over
four-weekly periods. The production of the data is subject to a number of rigorous
QA/QC procedures that are detailed in subsequent sections.
3.3.3 Analytical Techniques used in the Urban and Industrial Metals
Network
Analysis for particulate-phase metals is carried out by the contractor. This uses
PerkinElmer Elan DRC II and Elan 9000 ICP-MS mass spectrometers, following the
contractor’s procedure, accredited by UKAS to ISO 17025:2005, which is fully
compliant with the requirements of EN 14902:2005.
Upon arrival at the contractor’s laboratory, the filters are cut accurately in half (for
sites where weekly results are produced) and into quarters (where four weekly
19
results are produced). For the sites producing weekly data each portion is digested
at temperatures up to 220°C using an Anton Parr Multiwave 3000 microwave. For the
sites producing four-weekly data one quarter of each of the four filters comprising the
four week period is digested. The digestion mixtures used are:
• Mercury and platinum: 5 ml of nitric acid and 5 ml hydrochloric acid.
• All other metals: 8 ml of nitric acid and 2 ml hydrogen peroxide.
ICP-MS analysis of the digested solutions is carried out using at least four
gravimetrically-prepared calibration solutions. A quality assurance (QA) standard is
repeatedly analysed (after every two solutions), and the change in response of the
QA standard has been mathematically modelled to correct for the long-term drift of
the instrument. The short-term drift of the ICP-MS is corrected for by use of an
internal standards mixture (containing elements yttrium (Y), indium (In), bismuth (Bi),
scandium (Sc), gallium (Ga) and rhodium (Rh) continuously added to all the samples
via a mixing block. Each sample is analysed in triplicate, each analysis comprising
five replicates. The amount of each metal in solution (and its uncertainty) is then
determined by a method of generalised least squares using software developed by
the contractor to construct a calibration curve.
Analysis of total gaseous mercury samples is carried out using a PS Analytical Sir
Galahad II analyser with a fluorescence detector, using the contractor’s procedure
which is accredited by UKAS to ISO 17025:2005, which is in accordance with the
published reference method EN 15852:2010. The instrument is calibrated by use of
a gas-tight syringe, making multiple injections of known amounts of mercury vapour
onto the permanent trap of the analyser. Sampled adsorption tubes are placed in the
remote port of the instrument and heated to 900°C, desorbing the mercury onto a
permanent trap. Subsequent heating of this trap then desorbs the mercury onto the
detector.
3.3.4 Urban and Industrial Metals Network Operation and
Management
Operation of the network is currently managed by NPL, using Local Site Operators
(LSOs) who are responsible for changing samples using NPL protocols. Samples are
sent to NPL’s laboratory for analysis. All metal concentrations are analysed by the
contractor using strict QA/QC protocols and uploaded to the UK-AIR online data
repository. Details of data handling for this network are provided in section 5.4.1.
A service and maintenance contract is in operation, with 6-monthly service rounds
and calibrations undertaken by an ESU under subcontract. The ESU is called out as
required to deal with any equipment problems that might occur.
20
The contractor carries out annual site audit visits to all the Network sites. At these
visits the site infrastructure, performance and integrity are assessed. The LSOs are
also audited and receive extra training where required.
3.3.5 Quality Management in the Urban and Industrial Metals
Network
Particulate samples are taken at all sites in the Network using Partisol 2000
instruments (fitted with PM10 heads) operating at a calibrated flow rate, nominally of
1 m3 h-1, in accordance with EN 12341:1999.
Analysis for particulate-phase metals is carried out by the contractor at its laboratory,
using PerkinElmer Elan DRC II and Elan 9000 Inductively Coupled Plasma Mass
Spectrometry (ICP-MS), following the contractor’s procedure, accredited by UKAS to
International Organisation for Standardisation ISO 17025:200530. This is fully
compliant with the requirements of EN 14902:2005.
Analysis of total gaseous mercury samples is carried out at the contractor’s
laboratory using a PS Analytical Sir Galahad II analyser with a fluorescence detector,
using NPL’s procedure, accredited by UKAS to ISO 17025:2005, which is in
accordance with the published reference method EN 15852:2010. A manual variant
of EN 15852:2010 used in the Network has been recently shown to be equivalent to
the automatic reference method within the uncertainty of the analytical
determination.
An annual report is produced, covering both the Urban and Rural Metals Networks.
This includes comparison of the Networks’ performance with the Directive DQOs.
The reports can be found at http://uk-air.defra.gov.uk/library/reports?section_id=13 .
At the time of writing ( 2013) the most recent report covers calendar year 201131.
3.4 Overview of the Rural Metals Network
The Rural Metals (metals deposition mapping) network measures metal
concentrations in PM10 (at 11 rural sites) and concentrations in rain water (at 14 rural
sites). The concentration fields are then combined with the local meteorological data
(rainfall etc.) to calculate values for wet deposition (from rain and snow etc.), dry
deposition (from dust settling etc.) and cloud deposition (condensation of cloud
droplets).
This rural network complements the UK Urban and Industrial Metals Network, which
predominantly monitors at industrial and urban locations.

21
3.4.1 Pollutants measured in Rural Metals Network
A total of 27 different metals are analysed in particulate samples of air (PM10
fraction) and rainwater collected from 11 sites (with 3 additional rainwater only sites)
in rural areas across the UK. The sites were specifically chosen to be representative
of background sites, and are as free from local sources of metal emissions as
possible, while still being accessible for site operators. The metals analysed are:
aluminium (Al), arsenic, antimony, barium, beryllium, cadmium, caesium, chromium,
cobalt, copper, iron, lead, lithium, manganese, mercury, molybdenum, nickel,
rubidium, scandium, selenium, strontium, tin, titanium, tungsten, uranium, vanadium
and zinc. Note that due to quality-control issues, scandium will be removed from the
suite of analytes from 2013 onwards. The network also measures continuous
mercury concentrations at the two EMEP supersites within the network (Auchencorth
Moss and Harwell).
3.4.2 Measurement Techniques used in Rural Metals Network
3.4.2.1 Particulates
Aerosol is sampled using Thermo Partisol Plus 2025 sequential PM10 samplers that
are operated at a flow rate of 1 m3 h-1 using 47 mm diameter Nitrocellulose filters in
FRM-style filter cassettes. The air sampling period is 1 week, with the filter
changeover time being set at 06:00 on the morning of the LSO visit. Experience has
shown that this approach maximises the chance of detecting and rectifying a
sampler fault such as Filter Exchange Error. Filter cassettes are assembled within a
laminar flow cabinet in a dedicated clean room (Certified to Class 5 under ISO
14644-1:199932) taking precautions to minimise metal contamination (i.e. using acid
washed equipment and clean-room powder-free gloves). Aerosol sampler
deployment and changeover of filter cassettes conform to EMEP standards and aim
to prevent contamination by providing a rigorous protocol for filter changeover and
laboratory preparation prior to analysis.
3.4.2.2 Heavy Metals in Rainfall
Bulk collectors, bottle and funnel type, are deployed within the deposition network for
the collection of bulk precipitation. The levels of metals found within precipitation are
at the µg/l level or lower. It is therefore essential that rigorous protocols are used for
cleaning sampling equipment between collector deployments to prevent
contamination within the laboratory. Collectors comprising a 5 L polyethylene bottle,
14 cm diameter polyethylene funnel and a debris filter are cleaned by soaking for 24
hours with 0.1 M nitric acid. Bottles, funnels and debris filters are then rinsed with
ultra-pure water (> 18 MΩ cm-1, Millipore) and finally dried in a filtered air drying
22
cabinet. Bulk collectors are assembled in a dedicated laboratory, double bagged,
and then sent out to field sites in flight cases along with instructions for collector
changeover.
3.4.2.3 Mercury in rainfall
An adapted EMEP protocol for sampling mercury in precipitation (EMEP (2002)33) is
used. The sampling equipment and cleaning protocols are specific for mercury
because of this metal’s special characteristics i.e. it is present at ng/l levels in
precipitation and is prone to background contamination. Briefly, precipitation for the
determination of mercury is collected in special precipitation samplers, based on
those used within the Swedish National Monitoring Program, the Iverfeldt design.
The collector was designed to prevent the diffusion of gaseous mercury (Hg0) into
the collection vessel by the use of a 0.5m capillary tube between collection funnel
and bottle. Sampling and analysis of bulk precipitation for mercury is particularly
prone to contamination and therefore duplicate bulk precipitation samples are
collected at each of the 10 network sites at which mercury is monitored.
The precipitation collector was based on the Iverfeldt design with a long tube to
reduce mercury diffusion to and from the atmosphere. A number of modifications
have been made in order to reduce possible contamination and improve safety of
use:
• The funnel and tube are made of Polytetrafluoroethylene (PTFE) as per the
Florida Atmospheric Monitoring Survey.
• The debris filter and capillary components are made of PTFE.
• The joints connecting individual components are close fitting and thus
designed to reduce contamination form ingress of gaseous Hg0.
• To reduce diffusion of gaseous Hg0 a glass bottle is used for final collection.
Glassware and reagents are rigorously tested in order to identify and reduce sources
of contamination. Bottles are cleaned on a monthly basis according to the EMEP
protocol by soaking in 1% nitric acid followed by bromate/bromide reagent and a final
rinse with ultra pure water.
Mercury samplers are deployed, in duplicate, at the 11 main network sites, pre-
acidified with hydrochloric acid as a preservative and changed on a monthly basis.
The field protocols are similar to those used for the deployment of bulk precipitation
samplers and are designed to prevent sample contamination at the field sites and
during transport.
23
3.4.2.4 Total gaseous mercury
Mercury in air is sampled using an integrated sampler using the gold amalgamation
technique. A small pump pulls air at about 25 ml min-1 through two sequential traps
containing gold coated sand, onto which the mercury adsorbs by amalgamation. This
mercury is then released from the traps using thermal desorption during analysis in
the laboratory. Two traps are used, the first to capture the bulk of the mercury, the
second to catch any breakthrough. During sampling both traps are held at 100°C
using an internal heater, to prevent build of water vapour or organic compounds
within the taps, which would impede mercury capture. A dry gas meter is used to
give a quantitative concentration of mercury as mass per volume of air sampled. The
sampling period is 2 weeks, to ensure a sufficient yield from the first trap, but with
the second trap providing backup should the air concentration result in saturation of
the first trap and breakthrough on to the second trap.
3.4.3 Analytical Techniques Used in the Rural Metals Network
With the exception of mercury, all metals are analysed using ICP-MS. Mercury in
precipitation is determined by Atomic Fluorescence Spectrometry (AFS) using a PS
Analytical Galahad detector employing pre-concentration of mercury on a gold trap
to increase instrument sensitivity. Mercury in air is analysed using a PS Analytical
Millennium Merlin analyser. The sample traps are thermally desorbed in a flow of
argon onto the internal trap of the analyser, which is subsequently desorbed and the
mercury content analysed by Cold Vapour Atomic Fluorescence Spectroscopy.
Continuous measurements of Total Gaseous Mercury (TGM) are made using Tekran
analysers, at two sites - Harwell and at Auchencorth Moss. Harwell monitors TGM
only. At Auchencorth Moss additional mercury-speciation units are fitted to the
Tekran instrument , allowing it to measure three species, Gaseous Elemental
Mercury (GEM), Reactive Gaseous Mercury (RGM) and Particulate Mercury (HgP).
The analytical methods are compatible with:
• BSi British Standards EN 14902:2005, Ambient air quality – Standard method
for the measurement of Pb, Cd, As, and Ni in the PM10 fraction of suspended
particulate matter.
• BSi British Standards EN 15853:2010, Ambient air quality – Standard method
for the determination of mercury deposition.
• BSi British Standards EN 15841:2009, Ambient air quality – Standard method
for the determination of arsenic, cadmium, lead and nickel in atmospheric
deposition.

24
3.4.3.1 Particulate:
Exposed filters are returned to the analytical laboratory and processed upon arrival:
filter identifications and metadata relating to aerosol sampling are entered into a
dedicated rural deposition network database (ORACLE and Microsoft Access based)
and individual PM10 filters are assigned codes for processing via a laboratory
information management system. Prior to measurement of trace metal contents the
PM10 filters are extracted using the recommended EMEP method for filter dissolution
that has been adapted for the specific equipment used by the analyst. Briefly, PM10
filters are extracted with 10 ml of HNO3 (Baker, Ultrex II) for 12 minutes at 200°C
within sealed Teflon vessels using a microwave digestion system (CEM, MARS
Express). The method conforms to the temperature and time requirements for PM10
filter extraction for trace metals prescribed by EMEP, although differing equipment is
used. The concentration of trace metals in PM10 filter digests is measured using
ICPMS operating under standard conditions and employing matrix matched
calibration standards and internal standardisation to compensate for instrument drift.
Metal concentrations in air (ng m-3) are calculated using EMEP methods.
The microwave digestion method used for determining metal contents of PM10 filters
was validated using two standard reference materials (SRMs) A2 and B2, consisting
of spiked air filters, from the National Institute of Occupational Health, Norway.
Furthermore, although an appropriate and matched SRM was not available for
routine ongoing quality control the contract managers decided to certify SRM 1633b
(a coal fly ash from the US National Institute of Standards and Technology, NIST)
using a microwave digestion method for PM10 filters. The aim was to provide a
material that would be used for monitoring the precision of the PM10 digestion
procedure over time. Note that SRM 1633b has been certified for total metal
contents employing hydrofluoric acid and these values are expected to be
considerably higher than those obtained using an extraction employing nitric acid
only.
The certified filters, A2 and B2, NIST 1633b and a set of unexposed PM10 filters (to
assess background contamination) are extracted using the standard microwave
digestion described above. The results for SRM A2 and B2 show that the microwave
digestion provides recoveries within ±10% of certified values for the majority of
elements for which certified values are available.
3.4.3.2 Mercury in Rainfall:
On return to the laboratory mercury collector bottles are weighed to estimate rainfall
amounts and stored at 4°C prior to analysis. All analysis for mercury is completed
within two weeks of the arrival within the laboratory of the first collector from the
current deployment cycle. Mercury in precipitation is determined by AFS using a PS

25
Analytical Galahad detector employing pre-concentration of mercury on a gold trap
to increase instrument sensitivity.
3.4.4 Rural Metals Network Operation and Management
Operation of the network is currently managed by the Centre for Ecology and
Hydrology (CEH), using LSOs who are responsible for changing samples using CEH
protocols derived from the Chemical Co-ordinating Centre of EMEP. Samples are
sent to the CEH laboratories at Lancaster for analysis. The exposed mercury in air
cartridges are sent to the CEH laboratory at Edinburgh for analysis. A service and
maintenance contract is in operation, with 6 monthly service rounds and calibrations
undertaken by Air Monitors Ltd. All data concentrations are analysed by CEH using
strict QA/QC protocols and uploaded to the UK-AIR online data repository.
3.4.5 Quality Management in Rural Metals Network
The project is managed according to the requirements of the Joint Code of Practice
for Research, to which both Defra and the current contractor are signatories. In
addition, the chemical analysis performed at the contractor’s Lancaster laboratory
(all analyses with the exception of mercury in air and continuous mercury) are
accredited by UKAS to ISO 17025:2005. Methods for the analysis of trace metals in
precipitation and air, as well as cation and anion components of precipitation are
included within the analyst’s accreditation scheme (UKAS Testing Laboratory 2506;
specific details can be found at http://www.ukas.com/ ). UKAS accreditation includes
an outline of the performance characteristics for the instrumental methods used for
the determination of trace metals in precipitation and PM10 filters as well as mercury
in precipitation. The performance characteristics comprise: validation data obtained
during the process of laboratory accreditation by UKAS, ongoing quality control and
participation in proficiency testing schemes where applicable (eg. LGC Standards
Aquacheck: http://www.lgcpt.com/Default_eng.aspx ).
3.5 Overview of the PAH Network
The PAH Network monitors compliance with the Fourth Daughter Directive, which
includes a target value of 1 ng m-3 for the annual mean concentration of
benzo[a]pyrene as a representative PAH, not to be exceeded after 31st December
2012. The objective of the PAH Network is therefore to determine the ambient
concentrations of PAHs in ambient air in the UK through monitoring and chemical
analysis, and deliver the following outputs:

26
• A UK-wide assessment of current concentrations of PAHs for assessment
against the Fourth Daughter Directive and the UK Air Quality Strategy
objectives, and provide information for future reviews of the Fourth Daughter
Directive and UK Air Quality Strategy.
• Measurements and trends of airborne concentrations of PAHs in
representative UK industrial, urban and other areas, and to compare and
contrast them with those in rural locations.
• Data and metadata to demonstrate the UK’s compliance with the Fourth
Daughter Directive, the OSPAR convention and the UNECE Convention on
Long Range Transboundary Air Pollutants.
• Data for submission to the UK-AIR Information Resource (http://uk-
air.defra.gov.uk).
• An improvement in the understanding of PAH source and emission estimates,
and to examine their agreement with the National Atmospheric Emissions
Inventory (www.naei.org.uk). To also input into estimates of atmospheric PAH
concentrations, future projections, and the identification of the key areas of
uncertainty.
As of January 2013, the Network comprises 31 stations. Twenty of these 31 stations
are in England, four in Scotland, four in Wales and three in Northern Ireland.
3.5.1 Pollutants measured in PAH Network
The PAH compounds measured are shown in Table 3-4.

27
Table 3-4 Range of PAHs analysed
PAH number
Compound PAH number
Compound
1 Naphthalene 21 Benz[a]anthracene
2 2-Methyl naphthalene 22 Cyclopenta[c,d]pyrene
3 1-Methyl naphthalene 23 Chrysene
4 Biphenyl 24 5-Methyl chrysene
5 Acenaphthylene 25 Benzo[b]fluoranthene
6 Acenaphthene 26 Benzo[k]fluoranthene
7 Fluorene 27 Benzo[j]fluoranthene
8 Phenanthrene
28 Benzo[e]pyrene
9 Anthracene 29 Benzo[a]pyrene
10 2-Methyl phenanthrene 30 Perylene
11 2-Methyl anthracene 31 Indeno[1,2,3-cd]pyrene
12 1-Methyl anthracene 32 Dibenz[a,c]anthracene
13 1-Methyl phenanthrene 33 Dibenz[a,h]anthracene
14 4,5-Methylene phenanthrene 34 Benzo[g,h,i]perylene
15 9-Methyl anthracene 35 Anthanthrene
16 Fluoranthene 36 Dibenzo[a,l]pyrene
17 Retene 37 Dibenzo[a,e]pyrene
18 Pyrene 38 Coronene
19 Benzo[b]naph[2,1-d] thiophene 39 Dibenzo[a,i]pyrene
20 Benzo[c]phenanthrene 40 Dibenzo[a,h]pyrene
28
3.5.2 Measurement Techniques used in the PAH Network
All stations utilise the Digitel DHA-80 high volume aerosol sampler. Ambient air is
sampled through glass fibre filters and polyurethane foam (PUF) pads, which capture
the PAH compounds for later analysis in a laboratory. The Network requires the
sampling and analysis of the following types of samples:
‘A’ (particulate) samples - samples taken from ‘A’ (Digitel filter only) stations.
Samples of the PM10 fraction of ambient air on a filter. ‘A’ samples are taken daily at
all 31 Network stations using Digitel samplers with automatic filter changers. The
duration of the sampling period is 24 hours, with the sample changeover occurring at
midnight. The samples are bulked into groups representing calendar months for
analysis. Sampling is in accordance with EN 12341:1999.
‘B’ (particulate + vapour) samples – samples taken from ‘B’ (Digitel filter +
PUF) stations. Samples of the PM10 fraction of ambient air on a filter, plus the
vapour phase of ambient air on a PUF cartridge. ‘B’ samples are taken for three
(non-consecutive) days per week at two Network stations (Auchencorth Moss B &
Harwell B) using Digitel samplers with automatic filter and PUF changers. Each
sample is collected over 24 hours, and a sample is taken every 72 hours. The
samples are bulked into groups representing calendar months for analysis. Sampling
is in accordance with EN 12341:1999.
‘C’ (deposition) samples - samples taken from ‘C’ (deposition) stations.
Deposition samples taken fortnightly at two Network stations (Auchencorth Moss C &
Harwell C). Each sample is collected over 14 days, and a sample is taken every 14
days. The samples are bulked into groups representing a four-week time period for
analysis. Sampling is in accordance with EN 15980:201134.
Following sampling, all filters, PUFs and deposition gauges are returned to the
contractor’s laboratory. Analysis takes place according to EN 15549:200835 for
particulate and vapour phase samples and at an external laboratory for deposition
samples according to EN 15980:2011. All analysis is accredited by UKAS to ISO
17025:2005. Analysis takes place for the PAHs listed in Table 3-4.
Analyses of ‘A’ (particulate) and ‘B’ (particulate + vapour) samples are carried out in
accordance with EN 15549:2008. Samples are bulked into monthly batches (where
applicable) and Soxhlet extracted using dichloromethane as the extraction solvent.
The extracts are reduced in volume to 10 ml and a 1 ml aliquot of this undergoes a
clean-up procedure using silica column chromatography. After clean-up, the sample
is again reduced in volume to approximately 1 ml and analysed using gas
chromatography – mass spectrometry (GC-MS). The GC-MS is calibrated using a
series of calibration standards containing all the PAHs shown in Table 3-4 at a range

29
of concentrations covering the concentrations expected in the samples. The relative
expanded uncertainty in a typical analytical result from a Network sample has been
estimated at 20% - well within the DQO of an expanded uncertainty of 50%.
The limits of detection of the GC-MS method are determined by running a series of
filter blanks every six months, and a solvent blank with every analytical run.
Analysis of ‘C’ (deposition) samples is carried out in accordance with EN
15980:2011. In summary, the deposition samples are bulked into four-weekly
batches and extracted using liquid-liquid extraction. The resulting extract is dried,
reduced to a volume of approximately 1 ml, and analysed using GC-MS as described
above.
Final quantification is performed using the contractor’s software which provides a
generalised least squares best fit for calibration and inverse evaluation data with fully
traceable measurement values and uncertainties.
3.5.3 PAH Network Operation and Management
Operation of the network is currently managed by NPL, using LSOs who are
responsible for changing samples following NPL protocols. A service and
maintenance contract is in operation, with routine servicing undertaken by an ESU
under subcontract. The ESU is called out as required to deal with any equipment
problems.
The contractor carries out annual site audit visits to all the Network sites. At these
visits the site infrastructure, performance and integrity are assessed. The LSOs are
also audited and receive extra training where required.
3.5.4 Quality Management in the PAH Network
QA/QC procedures are in place to cover all aspects of the Network management,
from sampler operation to chemical analysis and data processing. Details of these
can be found in section 6.
An annual report is produced for the PAH Network. This includes details of data
capture achieved by the Network over the year. The reports can be found at
http://uk-air.defra.gov.uk/library/reports?section_id=13 . At the time of writing ( 2013)
the most recent report covers calendar year 201136.

30
3.6 Other Measurements
3.6.1 Cations and Anions in Rural PM2.5
Measurements of particulate-phase cations and anions in PM2.5: sulphate (SO42-),
nitrate (NO3-), sodium ion (Na+), potassium ion (K+), ammonium ion (NH4
+), chloride
ion (Cl-), calcium ion (Ca2+), and magnesium ion (Mg2+) are measured at two rural
background sites. The two monitoring sites used are Harwell in Oxfordshire, and
Auchencorth Moss in Lothian. These are both Level II EMEP ‘supersites’ and provide
representative measurements of the atmospheric composition in the north and south
of the UK. The monitoring is carried out under the UK Eutrophying and Acidifying
atmospheric Pollutants (UKEAP) network contract: the current contractors are the
Centre for Ecology and Hydrology (CEH) and Ricardo-AEA, who operate the
Auchencorth Moss and Harwell sites respectively.
A Marga 2S is used to sample cations and anions in rural PM2.5 at both sites. The
Marga utilises an automated continuous-flow Wet Rotating Denuder (WRD) coupled
to a Steam-Jet Aerosol Collector (SJAC) sampler. It provides hourly measurements
of the water-soluble species (listed in the paragraph above) in aerosol PM2.5 (and
PM10). It also provides a measure of the concentration of water-soluble trace gases
(HCl, HONO, HNO3, NH3, and SO2) in the sampled air. The Marga 2S samples the
ambient air through a PM10 size-selective inlet head at a nominal flow rate of 1 m3
hr-1. The PM2.5 fraction is separated from the sampled PM10 by means of a cyclone
separator fitted at the inlet to the PM2.5 WRD. The WRD removes water-soluble
gases from the sampled air stream. The sampled particles pass through the denuder
unsampled and are activated by steam (generated at 120°C) into droplets in the
SJAC and are removed via inertial separation in a cyclone.
The solutions of dissolved gases and aerosol species are analysed on-line, and in
near real-time, by ion chromatography (IC). Parallel IC systems are used for the
detection of the cationic and anionic species. An internal standard of lithium bromide
(LiBr) is used for on-going calibration purposes. Before anion and cation IC analysis,
the WRD sample and the internal standard are degassed and mixed. The liquid
streams from the WRD and SJAC are collected separately into the syringe pump
module which is located in the detector box. The syringe pump module consists of
two pairs of syringes (four syringes in total). Two sets of syringes are required to
enable tandem analysis and sampling: whilst the solutions in one set of syringes are
transported in-turn to the anion and cation columns for analysis the next set are
filled with solution from the WRD and SJAC from the PM2.5 (and PM10) sampling box.
The Marga 2S used to measure anions and cation in rural PM2.5 is a research-grade
instrument. Currently there is no proposed or accepted ISO, CEN or equivalent BS

31
standard method for the determination of the concentration of anionic or cationic
species in PM2.5. Data handling procedures are given in section 5.6.1 and QA/QC
procedures are summarised in section 6.7.1.
3.6.2 Elemental Carbon (EC) and Organic Carbon (OC)
Annex IV of the Air Quality Directive requires Member States to measure EC and OC
in the PM2.5 size fraction of particulate matter at rural background locations. This
requirement is met by these measurements at Harwell and Auchencorth Moss, made
within the research-based Particles Network, which started measurements in late
2011. The parameters EC and OC are effectively defined by the thermo-optical
analytical technique used.
Simplistically, the analysis can be considered as having two aspects. Firstly, the
measurement of total carbonaceous material (TC) on the filter, by thermal desorption
and oxidation followed by carbon detection (usually as methane after the conversion
of carbon dioxide and other compounds in a catalytic converter). This aspect can be
simply calibrated and quality controlled using calibration solutions on clean filters.
Secondly, the division of TC into EC and OC. This is based on the carbonaceous
material that is released during heating in an inert atmosphere being designated as
OC, while material that is released after the addition of oxygen to the atmosphere is
designated as EC. A correction needs to be made to account for pyrolysis (charring)
of organic material during the inert atmosphere phase, based on an optical
measurement of the darkening of the filter throughout the process.
The analytical method is currently being standardised by CEN TC 264 WG 35. The
document Ambient air quality – Guide for the measurement of elemental carbon (EC)
and organic carbon (OC) deposited on filters (PD CEN/TR 16243:201137) sets out a
range of possible analysis protocols, including the two used in the network (termed
“NIOSH-like” and “EUSAAR_ 2”).
Sampling is carried out using reference (Leckel SEQ47/50) PM2.5 samplers collecting
for 7 days onto high purity quartz filters (Pallflex Tissuquartz 2500QAT-UP).
The current contractor at the time of writing (2013) is NPL. This contractor manages
the Particles Network, carries out the laboratory analysis, audits the sites and acts as
LSO for the Harwell monitoring site. CEH acts as LSO for the Auchencorth Moss
monitoring site. Equipment support is currently subcontracted to Enviro Technology
Services.
QA/QC consists of checks on the sampling system, such as corrections to the
sampled volume after flow calibration, and checks on the laboratory analysis, which

32
are primarily blank analyses, TC calibrations, and checks with internal reference
material. The TC analysis is accredited by UKAS to ISO 17025:2005 – the split into
EC and OC will be included in the accreditation when the standard method is
decided.
33
4 Type Testing and Equivalence of
Analysers
4.1 EU Requirements
Annex VI of the Air Quality Directive, 2008/50/EC, defines the reference methods to
be used for compliance monitoring. This Annex also sets out the procedure for
demonstration of equivalence with the reference methods, which must be followed if
any alternative methods are to be utilised. Annex VI part D requires that all new
equipment introduced into the network complies with the reference method or has
been demonstrated to be equivalent.
For the gaseous analysers, the relevant Standard Methods include a requirement for
type testing and approval. The approach used in the UK to conform to this
requirement is described in Section 4.2.
For particle monitoring (PM10 and PM2.5) compliance is achieved by ensuring that all
analysers used in the network have been demonstrated to be equivalent to the
reference methods. The mechanism for demonstrating equivalence for particle
monitors in the UK is provided in Section 4.3. Subsequent sections describe the
requirements for benzene, metals and PAH compounds.
4.2 Type-Approval of Analysers for NOx, SO2, O3 and
CO
Type-approval tests are used to evaluate a set of performance characteristics for at
least two identical analysers in a laboratory and two analysers in the field. The
standard specifies a comprehensive and rigorous set of tests and type approval of
an analyser is based on conformance of the analyser with all the individual
performance criteria. The standards also require the calculation of the overall
expanded uncertainty of the measurement result based on the numerical values of
all the relevant tested performance characteristics - this is compared with the
relevant prescribed maximum uncertainty in the Directive’s DQOs (e.g. +-15% at
95% confidence level for NO2 at the relevant hourly limit value). The tests and
calculations carried out are:
Laboratory tests:
• Short-term drift tests at zero and span concentrations (12 hours).
34
• Response times rising and falling.
• Repeatability at zero concentrations and at the relevant limit or target value
(where appropriate).
• Lack of fit (residuals from the linear regression function including the zero
value).
• Sensitivity to sample gas pressure and sample temperature.
• Sensitivity to electrical voltage.
• Sensitivity to the temperature surrounding the analyser.
• Effects of interferences from other substances present in the atmospheric
samples.
• Effect of fluctuating concentrations (averaging test).
• Converter efficiency where applicable (NOx).
• Differences between sample and span inputs, where applicable.
Field tests (3 months):
• Long-term reproducibility between two analysers during the field
measurements.
• Long-term drifts at zero and span levels.
• Period of unattended operation, and fraction of total time the analyser is
available for measurements.
Overall uncertainty of measurement results:
• Determined by combining the type approval results obtained from the relevant
tests above, expressed at a 95% confidence level. This process of combining
uncertainties is covered by the CEN Standard Methods.
4.2.1 Analyser Type Testing in the UK
For gaseous analysers, the Type Approval testing process is managed in the UK by
the Environment Agency under its MCERTS scheme (http://www.environment-
agency.gov.uk/business/regulation/31829.aspx).
Certification is provided by SIRA, (http://www.siracertification.com/default.aspx), the
appointed certification body. SIRA is accredited by UKAS to ISO/IEC standard
17065:2012 “Conformity assessment - Requirements for bodies certifying products,
processes and services”'38.
The MCERTS Performance Standards mirror the requirements of the CEN Standard
Methods referenced in the Directive, and decisions are made by a certification
committee. The relevant performance standard for gases is: Continuous Ambient Air
Monitoring Systems (CAMS). UK testing against the standards began in 2005, and a
35
number of instrument suppliers have successfully had their gaseous analysers type-
approved under these schemes. Further details can be found at:
http://www.siraenvironmental.com/UserDocs/mcerts/MCERTSCertifiedProductsCAM
S.pdf
For measurements in the UK national network, the specific conditions and facilities
at each site have been used to calculate measurement uncertainties for individual
analysers. These results are published every six months in QA/QC Data Ratification
Reports for the Automatic Urban and Rural Network and are available at: http://uk-
air.defra.gov.uk/library/reports?section_id=13.
4.2.2 Checks Required on Deployment of Automatic Analysers
The CEN Standard Methods set a number of operational condition checks that need
to be performed for each site and analyser deployed. These are summarised as
follows:
• Estimate of the sample gas pressure and temperature variations.
• Estimate of the air temperature and mains voltage variations.
• Estimate of concentrations of a range of potential interferent species (H2O,
CO2, O3, NH3 and benzene) in the local atmosphere.
• Functional check of the analyser and sampling system.
• Functional check of the data telemetry system.
• Lack of fit (linearity) test.
• Converter efficiency check for NOx analysers.
• Determination of the required frequency of filter changes and analyser
consumables changes.
These parameters need to be reviewed in order to ensure that all the analysers at all
the sites are operating within the operating conditions for which they have been “type
approved”, and also to determine the required frequency of certain maintenance
actions which may depend on the pollutant concentrations at the particular site, or
other factors.
These checks are undertaken during type testing of the instrument, and also as part
of the commissioning audit of new monitoring sites.
36
4.3 Equivalence Testing for PM10 and PM2.5
4.3.1 Requirements of the Air Quality Directive
The CEN Standard Method for particulate matter (PM) analysers describes both the
design of the analyser (the reference method), and the operating methodology. The
reference method is a gravimetric technique: however, due to the time required to
weigh exposed filters and process the results, data from gravimetric samplers cannot
be used for rapid public information purposes. The Directive therefore allows
Member States to use alternative techniques where "equivalence" with the reference
method can be proven in accordance with specific requirements. A procedure for
demonstration of equivalence has been defined by the EC, primarily to ensure
measurements with near real-time analysers fulfil the requirements of the DQOs
defined in the Air Quality Directive. This procedure is defined in the 2010 GDE,
which is available online at
http://ec.europa.eu/environment/air/quality/legislation/pdf/equivalence.pdf . This is
expected to be updated and issued as EN TS16450 in the future.
4.3.2 UK Work Programme on Equivalence
The UK has spearheaded an extensive study into the relationships between
measurements of a range of automatic analysers and gravimetric samplers with the
Reference Method. The results of this initial pioneering test programme can be found
in the following reports:
• UK Equivalence Programme for Monitoring of Particulate Matter (available
online at http://uk-
air.defra.gov.uk/reports/cat05/0606130952_UKPMEquivalence.pdf )
• Assessment of UK AURN Particulate Matter Monitoring Equipment against
the January 2010 GDE (available online at http://uk-
air.defra.gov.uk/reports/cat14/1101140842_Assessment_of_UK_AURN_PM_
Equipment_against_2010_GDE.pdf )
Following this initial study, instrument manufacturers have continued to submit
methods for equivalence tests and declaration of suitability. The current status of
measurement methods is set out in table form, at the “Certification: MCERTS for UK
Particulate Matter” UK-AIR web page at http://uk-
air.defra.gov.uk/networks/monitoring-methods?view=mcerts-scheme .

37
4.3.3 UK Approval of Equivalence
The responsibility for declaring measurement methods equivalent for use in the UK
lies with Defra as the Competent Authority. Many manufacturers have also, but
separately, opted to get UK type approval with the “Continuous Ambient
Measurement Systems (CAMS)” performance standard (see http://uk-
air.defra.gov.uk/networks/monitoring-methods?view=eu-standards) through the
MCERTS scheme which mirrors the requirements of the 2010 GDE. Defra has
developed in partnership with the Environment Agency a new and additional level of
certification through the MCERTS scheme which requires the instruments to
demonstrate equivalence in a representative particulate matter pollution climate for
the UK. This certification is called "MCERTS for Particulate Matter UK" and details
are available at http://uk-air.defra.gov.uk/networks/monitoring-
methods?view=mcerts-scheme.
Other methods have been MCERTS certified for the Performance Standard for
Indicative Ambient Particulate Matter. This is entirely different to the CAMS standard.
Measurements from indicative MCERTS analysers carry a higher measure of
uncertainty than reference equivalent analysers. Indicative analysers may not fulfil
the requirements of the EU DQOs.
4.4 Equivalence and Type Testing of Benzene
Measurement Techniques
Automatic hourly measurements for benzene are made using the Ozone Pre-cursor
Analyser (OPA) manufactured by Perkin Elmer. This is the best method available for
measuring a large suite of VOCs simultaneously. There is no type approved OPA
capable of measuring a suite of VOCs. However, many of the key parameters will be
available either from literature or from existing test data. There will still be a number
of parameters that require additional testing such as non-linearity (“ufit”),
reproducibility of the field conditions (“urf”) and uncertainty due to interference with
ozone (“uO3”). Tests are performed to evaluate these. While these tests would not
formally constitute type approval, they will provide a strong indication of fitness for
purpose. Once these evaluations are complete, the calculations are updated and
provide an assessment of CEN compliant results for every analyser used in the
network.
The non-automatic system used for non-automatic monitoring of benzene was
developed by NPL. This dual sample tube controlled flow pump unit uses a method
described in EN 14662:2005, ‘Ambient air quality – Standard method for
38
measurement of benzene concentrations’. This method has been validated by NPL
and is the reference method for measuring benzene.
4.5 Equivalence and Type Testing of Metals
Measurement Techniques
4.5.1 Ambient Metals Measurement
In the Industrial and Urban Metals Network, Gravimetric samplers (Partisol 2000
instruments) are used to sample PM10 over weekly periods according to EN
12341:1999. The analysis procedure, which is compliant with EN 14902:2005, is
accredited to ISO 17025:2005.
Mercury vapour is sampled using a manual sampling set-up compatible with the
requirements of EN 15852:2010 and analysed in accordance with EN 15852:2010.
The analysis procedure is accredited to ISO 17025:2005.
In 2012, the current contractor assessed the overall equivalence of the reference
method EN 15852:2010 to the manual method used on the Network. This is reported
in Brown et al. 201239.
In the Rural Metals Network, Partisol 2025 particulate samplers are used. The
operational performance of the Partisol 2025 particulate samplers have been verified
by the detailed Defra and DAs study test for equivalence in 2004-2006, see http://uk-
air.defra.gov.uk/reports/cat05/0606130952_UKPMEquivalence.pdf.
The tests carried out were based on the Guidance for the Demonstration of
Equivalence of Ambient Air Monitoring Methods issued by an EC Working Group.
This Guidance defines an approach to test whether an instrument complies with the
DQO for overall uncertainty as defined within the relevant Air Quality Directive which,
for PM10, is 25%.
The mercury in air and mercury in rain samplers (designed by CEH) have not been
through a comparable verification process but were tested against the NPL sampling
equipment. The design principles follow the EMEP guidelines for mercury sampling
devices and incorporate improvements for data capture.
4.5.2 Rural Measurements of Metals Deposition
As explained in section 3.4, the rainfall samples are collected via passive bulk
deposition samplers, using separate bottles for the samples to be analysed for
mercury, compared to the samples analysed for other metals. The sample

39
concentrations are determined by Atomic Fluorescence Spectrometry (AFS; Hg only)
and Inductively-Coupled Plasma Mass Spectrometry (ICP-MS; all other metals).
Validation and quality control data for the determination of metals by ICPMS
concluded that that the instrumental method is suitable for the determination of a
wide range trace metals in precipitation. The accuracy and precision for a synthetic
rain obtained from Environment Canada are acceptable when compared with
certified values. Total uncertainty and limits of detection are also reported. As part of
UKAS accreditation, the laboratory is required to carry out an annual audit of method
performance by assessing analytical quality control data. An assessment for the
period of operation of the rural metal deposition network operation so far (years 2004
to 2012) shows that the determination of trace metals by ICPMS was, and continues
to be, fit for purpose. Accuracy is better than ±5% and precision is, for the majority
elements measured, better than ±5% of the nominal QC value.
The performance of the contractor’s laboratory (CEH Lancaster) in the Aquacheck
inter-laboratory proficiency testing scheme (group 5b; low level metals) was
undertaken using Cu, Cr, Pb, Ni, Zn, Cd and Hg as examples of typical laboratory
performance. The performance of the contractor’s laboratory in this scheme is
acceptable, with the majority of analyses receiving a z score of better than ±2,
indicating excellent agreement between the contractor’s laboratory and a wide range
of UK and worldwide testing laboratories. The performance of all metals determined
for the network is tested within Aquacheck or similar schemes.
The contractor also participated in the EMEP “Analytical intercomparison of heavy metals in precipitation” between 2006 and 2011. For all metals reported in 2010 (i.e. As, Cd, Cr, Cu, Pb, Ni and Zn) their laboratory met the required data quality objective (DQO) set within the scheme. These are as follows:
• 25% accuracy or better for Pb, Ni, Cr & As concentrations <1µg/l, Cd concentrations<0.5 µg/l, Zn concentrations <10µg/l and Cu concentrations <2 µg/l
• 15% accuracy or better for Pb, Ni, Cr & As concentrations >1µg/l, Cd concentrations >0.5 µg/l, Zn concentrations >10µg/l and Cu concentrations >2 µg/l.
Further information about the scheme, including detailed reports relating to laboratory performance, can be found on the EMEP website at http://www.nilu.no/projects/ccc/intercomparison.html

40
4.6 Equivalence and Type Testing of PAH
Measurement Techniques
The Digitel DHA-80 samplers now used throughout the Network are considered to be
equivalent to the requirements of the European Standard for sampling PM10 matter
(EN 12341:1999). Evidence for this is available in a new version of the standard
which is currently being drafted to replace EN 12341:1999. These samplers are
therefore considered valid for use with the European Standard method for the
measurement of benzo[a]pyrene in ambient air (EN 15549:2008). Samples are taken
onto quartz fibre filters for a period of 24 h at a flow rate of 30 m3 h-1.
Deposition sampling is performed as specified in EN 15980:2011, which includes
analytical QA/QC. The requirements of EN 12341:1999 do not apply to deposition
sampling, only to sampling of PM10 suspended particulate matter. No reference
methods exist for the sampling of PAH vapours.
41
5 Data Telemetry, Validation and
Dissemination
In order to provide rapid data on the current air quality situation in the UK, data from
the UK’s automatic monitoring sites are collected via telemetry from each monitoring
site, every hour, and made available on the UK-AIR website. These data are
validated, but not fully ratified, and hence are described as provisional data. The
process for collecting, validating and disseminating the provisional data is described
below. Data handling and validation are also described for pollutants measured by
non-automatic techniques, which are not made available on such a short timescale.
The full ratification procedures which the data undergo are set out later, in section 6.
5.1 Data Handling in the AURN
Data from the UK’s automatic monitoring sites are collected via telemetry from each
monitoring site, every hour, and made available on UK-AIR. The data are at this
stage still provisional, having not yet undergone the ratification process. This section
describes the process of collecting, validating and disseminating the provisional data
from the AURN.
5.1.1 Collecting the data from AURN sites
The CMCU dials-up via telemetry links (e.g. land-lines, GSM modems and GPRS) to
poll data acquired within the hour. Each station is automatically dialled every hour
during daytime and alternate hours during the night (1800- 0700). Onboard and
external logging systems provide a mechanism of capturing data (either in
concentration or raw electronic mV format).
A number of the AURN sites within Greater London are also part of the London Air
Quality Network. These sites are also polled hourly, on the same basis as the other
AURN sites. Data are collected to two decimal places for CO and to at least one
decimal place for other gases and for particles.
5.1.2 Validation of AURN Data
Upon completion of the station poll the fifteen-minute averages (or hourly data in the
case of FDMS and BAM particulate monitors) collected from the site operating
system are stored in the data management system database. The collected values
are referred to as “raw” since they are not scaled and remain in the data

42
management system “raw” database as a complete record of all values collected
from the station. Instrument calibration values derived from site by either LSOs or
ESUs are stored in the data management system calibration files and the raw values
are automatically scaled by application of the calibration factors present in the
system. Automatic screening algorithms (specifically designed macros and a range
of tailored scripts for manual data interrogation) are employed to validate the scaled
data.
The scaled data are automatically compiled into a prescribed format and emailed to
Defra’s Data Dissemination Unit (DDU) by 25 minutes past the hour for upload to the
UK-AIR website. Upon completion of any required editing the revised values are
automatically re-sent in the next hourly cycle in order to over-write those previously
supplied.
5.1.3 Dissemination of Provisional AURN Data
Data from the AURN are marked as ‘provisional’ or ‘ratified’ depending on what
stage they are at in the process of ratification. When data are first collected from the
analyser on site, they are scaled with calibration data from the last calibration. In
many cases, this will produce satisfactory data, with problems only arising if the
instrument is unstable or drifting rapidly. The data are then automatically screened
using computer algorithms to highlight suspect data, but no data are deleted at this
stage.
The data sent to UK-AIR are also available – on an hourly basis - on air quality
websites operated by the UK Devolved Administrations, Freephone service and
Twitter. In addition, daily e-mail bulletins of AURN monitoring data are provided to
over 150 media organisations and other network stakeholders - including the BBC
and BSkyB, national and regional radio and newspapers and other scientists and
journalists.
All of the provisional data, together with all the identified suspect data, undergo full
ratification, (as described in section 6.1.8) in 3-month blocks. As part of the
ratification process, any suspect data may be reinstated if deemed to be genuine.
Following the ratification process, the fully ratified datasets are re-sent to UK-AIR (in
3-monthly blocks, 3 months in arrears) and the provisional data are overwritten with
the ratified data.
However, as the data are improved via the ratification process, they are
automatically fed through to UK-AIR. This ensures that the provisional data available
on UK-AIR always reflect the most up to date, highest quality data available. Initial
polled data are maintained by the CMCU through its initial polling software and are
maintained as an historical record of the data collection process.

43
All fully ratified hourly data from the AURN are reported to the Commission annually.
Currently provisional measurements for ozone, NO2, SO2 and PM10 data are
supplied on an hourly basis to the EEA air quality website -
http://www.eea.europa.eu/themes/air/air-quality/map.
From 2014, all provisional AURN data will be made available to the Commission on
an “up to date” basis using electronic reporting tools.
5.1.4 Data Handling for Partisol PM Samplers in the AURN
The AURN includes 17 Partisol 2025 gravimetric samplers, each of which samples
either PM10 or PM2.5. The size fraction sampled is determined by a size-selective
inlet fitted to the sampler. Sampling is on a daily basis, with automatic filter
changeover at midnight. The Partisol sampler holds up to 15 filters. Each batch of
filters includes a field blank. The CMCU is responsible for conditioning and weighing
the filters before and after exposure. Ambient PM concentrations are calculated from
the mass of material collected on the filter (determined by weighing before and after
exposure) and the volume of air sampled over the 24 hour period.
Ambient concentrations are calculated by the CMCU and supplied to the QA/QC Unit
in spreadsheet format. The QA/QC Unit carries out the ratification process, which
checks that:
• The correct day’s filter weighing is matched to the correct day’s sampling
data.
• There were at least 18 hours' valid sampling for each daily sample.
• The sample volume is at least 18m3.
• There are no gaps in the dataset.
• There are no values which appear obviously spurious, e.g. unusually low or
high, and cannot be accounted for.
• There are no negative values (less than minus the measurement uncertainty).
If both PM10 and PM2.5 are monitored using Partisols at the same site, PM10 should
not usually be greater than PM2.5 (allowance is made for the measurement
uncertainty, particularly at rural sites where both PM10 and PM2.5 are often low).
Data are ratified three-monthly in arrears. The ratified dataset is sent to the Data
Dissemination Unit.

44
5.2 Data Handling for Automatic Hydrocarbon
Monitoring
The data management system undertakes preliminary validation of the data using
proprietary pattern recognition software, “MatchFinder”, which has been specifically
modified to compare the chromatograms with ‘templates’ identifying specific
hydrocarbon peaks. This system automatically assigns component labels to peaks
within the chromatogram.
The incidence of mis-identification of peaks, and therefore mis-reporting of data, is
reduced significantly when compared with use of the peak identification methodology
of the instrument system.
This system provides preliminary screening of hydrocarbon monitoring data to
identify suspect data. When the fit of data to the MatchFinder templates becomes
poor, it can be due to one of a number of reasons; malfunction of the instrument or
an early warning of an unusual event such as a pollution episode, are two examples.
By means of further manual checking, a decision to delete or retain such data is
madeby one of the hydrocarbon network data management team. This includes
application of approximate site-specific response factors and daily checks of the
templates.
All data are manually checked every working day by a trained member of the
network management team. During these manual checks a number of parameters
are evaluated. System performance is judged on a daily basis and the accuracy of
peak integration and identification is monitored, with any necessary actions being
taken. The results of the daily checks and any resulting actions are recorded as this
will be important information in the data ratification process. The manual checking of
the data, rather than basing reliance on the automatic systems, ensures any
developing problems are identified quickly and resolved in good time.
Validated data are provided daily to the Data Dissemination Unit for dissemination
via UK-AIR.
Before the formal ratification process is started some general ‘housekeeping’ of the
stored data is required. At the sites where speciated measurements are made using
the PerkinElmer Ozone Precursor Analyser (PE-OPA) any files not retrieved during
the automatic polling of the station data are collected and added to the database.
Data ratification involves a progressive evaluation of chromatograms at three levels;
the first level looks particularly in the region of the peaks for benzene and 1,3-
butadiene. Further investigations of peaks corresponding to unknown C8 compounds
45
are made to ensure the impact of these is minimised in terms of data for known C8
compounds. Finally, ‘merged peaks’ are inspected to provide confidence that these
have been suitably identified and the correct baselines applied by the integration of
the peaks.
The second level of ratification is a ratio analysis of the more volatile compounds, in
the C2/C3 region. If a loss of sensitivity is detected, data will be rejected unless it is
clear that corrections can be applied.
The final level of the ratification procedure is the application of response factors. This
converts the raw peak areas collected from the chromatograms to concentration
units. The results of the analyser calibration checks, together with data from the
network intercalibrations, are used to produce the response factors. Response
factors for the instruments (PE-OPA) generally tend to be very stable.
During the third level of ratification the results of the network intercalibration and
instrument audits are evaluated to determine whether any further action is required
with respect to data scaling.
This multi-input approach to data ratification is used to provide the necessary level of
information to provide the level of confidence needed for the data to be described as
“ratified”.
On completion of this three-level ratification process the data are sent to UK-AIR,
and also stored within the contractor’s own QA/QC database.
Formal reporting of data to the EU is undertaken annually by 30th September the
following year.
5.3 Data Handling for Non-Automatic Benzene
Monitoring
The procedures used for non-automatic benzene monitoring are completely different
from the automatic monitoring techniques and the data handling procedures reflect
these differences.
The project structure requires data to be held and processed by the contractor and
by a subcontractor (analytical laboratory).
The primary data handling system (produced by the contractor) is the Sample
Registration System (SRS), which has been designed to efficiently and transparently
track the progress of a sample (represented by two pumped tubes) throughout the
46
system. The necessary calculation and quality control routines are also built into the
system. The SRS is built using Microsoft Excel.
In principle, each sample exposure has a unique identification made up of two parts;
the etched identification mark on the thermal desorption tube (tube ID) and the batch
number (each fortnight’s set forms a complete batch). As there is a limited number of
tubes used (~400 stock tubes which are cleaned, re-filled and re-used), the tube ID
will occur more than once during the lifetime of the project. Hence, each sample’s
identification is a composite of the batch number and tube ID.
This also makes it possible to track the use and performance of individual tubes as
they are repeatedly cleaned, re-filled and re-used.
5.4 Data Handling for Metals Monitoring
5.4.1 Urban Metals
Analysis of the Network samples is described in section 3.3.3. This produces
individual concentration values for four-weekly or weekly periods. These individual
measurement results each have a stated measurement uncertainty, quoted at the
95% confidence level. Annual means at each site are produced by calculating the
means of these values, weighted according to the data capture during each period.
Network-wide annual means are then produced by averaging annual means from the
individual sites, again using appropriate weighting if a site has been monitoring for
less than the full year.
A QA/QC circle meeting (the ‘quality circle’) ratifies ambient concentration data
produced by the Network. Personnel performing the ratification procedure are
independent of the Network analysis and management process. It is the aim of the
ratification procedure to distinguish between changing ambient concentrations
(including long terms trends, seasonal variation and single pollution events), and
analytical discrepancies within the large amount of Network data. Ratification takes
place in accordance with several guidelines, outlined below:
1. Only data where the valid sampling hours are greater or equal to 75% of the
total sampling period will be eligible to produce valid concentration data, and
count towards the total data capture percentage.

47
2. Data not meeting the DQOs for uncertainty or time coverage for the relevant
air quality Directive are not eligible to produce concentration data and are
counted as lost data capture.
3. Data excluded following the ratification procedure will also not be eligible to
produce valid concentration data, or count towards the total data capture
percentage.
4. Upon production, weekly data for each element at each site are plotted in a
time series, or displayed as a continuous list of values which may be easily
compared.
5. In the first instance these data are assessed visually for any obvious
discrepancies with due regard to long terms trends, short term variability and
seasonal variation. Then outlier tests are performed to detect any potentially
discrepant data, including the use of powerful chemometric techniques.
6. If valid reasons for obviously discrepant values are found (e.g. incorrect
calculation, low exposure time, non-valid exposure volume, analytical error)
these values may be either excluded or corrected (depending on the nature of
the error).
7. As part of the internal quality and technical auditing procedures, a selection of
ambient air concentrations calculated each month are thoroughly audited by a
party independent of the analysis procedure. For these samples, the sample
number, target analyte, auditor, audit date and status of the data are recorded
in a designated spreadsheet after auditing. These audits concentrate most
heavily on nickel, arsenic, cadmium, lead and mercury vapour analyses, as
these are directly relevant to EC Air Quality Directives.
The data are then transferred to the contractor’s secure database and processed
ready for submission to UK-AIR. Provisional data are provided quarterly, and
updated with the fully ratified annual dataset when this becomes available. The only
exception to this is for lead, which the contractor aims to ratify quarterly, as per the
requirements of the Directive.
The time resolution of the data provided is weekly at six stations for metals in
particulate, weekly at three stations for vapour phase mercury, and four-weekly at all
other stations for both particulate-phase metals and vapour phase mercury.
5.4.2 Rural Metals
The concentrations of metals in the PM10 digests and precipitation samples
generated by the laboratory analysis are uploaded to a database as part of the
48
reporting requirements of the contractor’s UKAS-accredited labs. This database is
stored in a central server within CEH, and receives daily back-ups. This database
also records all of the relevant metadata on each sample, including the start and end
date and time of each exposure period, site operator observations and all of the
intermediate data produced during the analytical process.
The data are then filtered via database queries, to produce output tables which
normally cover, for example, a single calendar year’s worth of data. These output
tables are copied into Excel for ease of data. There are separate spreadsheets for
the metals. The spreadsheets have been designed to include a separate worksheet
for the raw data from each monitoring site. These sheets are linked to pre-
programmed sheets which are used to convert the sample acid digest concentrations
to concentrations in air data. The spreadsheets have built-in quality assurance
checks where appropriate, such as checking there is no overlap in sampling between
individual samples etc. The spreadsheets also have in-built formulae to calculate
statistics such as the annual mean, data collection rate, etc. The spreadsheet also
identifies samples which are below the limit of detection, and greater than the annual
mean plus 2x the standard deviation. It also generates the appropriate EMEP flags
to accompany the data.
The spreadsheets are all manually checked (on the basis of expert judgement)
before the data are prepared for uploading to the UK-AIR portal. This involves
copying the data from each site-based worksheet into a single worksheet, where the
data are formatted to match the UK-AIR reporting requirements. This final sheet is
then saved in Excel format before being saved as a tab delimited text file and
uploaded to the UK-AIR portal.
The ratified dataset is uploaded annually to UK-AIR. Provisional data are not
supplied.
The time resolution of the concentrations of metals in the particulate phase is weekly
(two-weekly for mercury). The time resolution of the measurements of metals in
precipitation is also two-weekly.
5.5 Data Handling for PAH Monitoring
Analytical procedures are given in section 3.5.2. A ‘quality circle’ approach is used to
ratify ambient concentration data produced by the UK PAH Network. Personnel
performing the ratification procedure are independent of the Network analysis and
management process. It is the aim of the ratification procedure to distinguish
between changing ambient concentrations (including long terms trends, seasonal

49
variation and single pollution events), and analytical discrepancies within the large
amount of Network data. Ratification takes place in accordance with several
guidelines, outlined below:
1. Only data where the valid sampling hours are greater or equal to 75% of
the total sampling hours will be eligible to produce valid concentration
data, and count towards the total data capture percentage.
2. Data not meeting the DQOs for uncertainty or time coverage for the
relevant air quality Directive are not eligible to produce concentration data
and are counted as lost data capture.
3. Data excluded following the ratification procedure will also not be eligible
to produce valid concentration data, or count towards the total data
capture percentage.
4. Upon production, data for each PAH at each site is plotted in a time series,
or displayed as a continuous list of values which may be easily compared.
5. In the first instance these data are assessed visually for any obvious
discrepancies with due regard to long term trends, short term variability and
seasonal variation. Then outlier tests are performed to detect any potentially
discrepant data, including the use of powerful chemometric techniques.
6. If valid reasons for obviously discrepant values are found (e.g. incorrect
calculation, low exposure time, non-valid exposure volume, analytical
error) these values may be either excluded or corrected (depending on the
nature of the error).
7. As part of the internal quality and technical auditing procedures, a
selection of ambient air concentrations calculated each month are
thoroughly audited by a party independent of the analysis procedure. For
these samples, the sample number, target analyte, auditor, audit date and
status of the data are recorded in a designated spreadsheet after auditing.
These audits concentrate most heavily on benzo[a]pyrene (B[a]P) as this
is directly relevant to the Fourth Daughter Directive.
The data are then transferred to the contractor’s secure database and processed
ready for submission to UK-AIR at the appropriate juncture. Data are sent to the
Data Dissemination contractor for upload to UK-AIR.
5.6 Data Handling for Other Measurements
5.6.1 Cations and Anions in Rural PM2.5
The Marga 2S provides on-line analysis of cations and anions in near real-time by
means of IC. The presence and concentration of the cation and anion species in the

50
sampled in PM2.5: (and PM10) sulphate (SO42-), nitrate (NO3
-), sodium ion (Na+),
potassium ion (K+), ammonium ion (NH4+), chloride ion (Cl-), calcium ion (Ca2+), and
magnesium ion (Mg2+) are determined from the resultant chromatograms. Detection
of the individual species is based primarily on:
• Peak retention time, and
• Integrated peak area.
From these parameters the concentrations of the species of interest in the sample
solution (termed the “liquid concentration”) can be determined. The mass
concentrations of the species of interest (termed the “air concentration”) are
subsequently determined from the liquid concentration by accounting for the:
• Volume of injected solution (nominally 25 cm3 of solution and 2.5 cm3 of
internal standard), and
• Sample flow rate (nominally 1 m3 hr-1).
The liquid and air concentrations are written to file to provide an hourly measure of
the composition of PM10 and PM2.5.
When commissioned, default retention times of the cations and anions species of
interest are entered into the instrument by the instrument manufacturer (Metrohm-
Applikon BV, Schiedam, The Netherlands). Over time peak retention times may
change due to instrumental factors, e.g. column ageing, as well as environmental
factors, such as atmospheric temperature and pressure. In order to account for this,
the peak retention times are checked regularly and adjusted accordingly by the LSO.
Peaks are identified if they fall within a window of ±5% of the operator defined peak
retention time. The Marga 2S system parameters are logged by the instrument and
are optimised by the Marga 2S operating software to ensure good resolution of the
peaks in the ion chromatographs.
Samples from the WRD or SJAC are injected into the parallel IC columns at 15
minute intervals. The resultant anion and cation chromatograms are written to file for
later re-analysis, if required. For a volume of ambient air sampled during hour “H” of
the day, the liquid samples from the WRD and SJAC are analysed in the order
described in Table 5-1:
Table 5-1 Marga 2S sampling times, particle size fractions and source
Time Size fraction Source
17 minutes past hour “H+1” PM2.5 WRD (gas-phase)
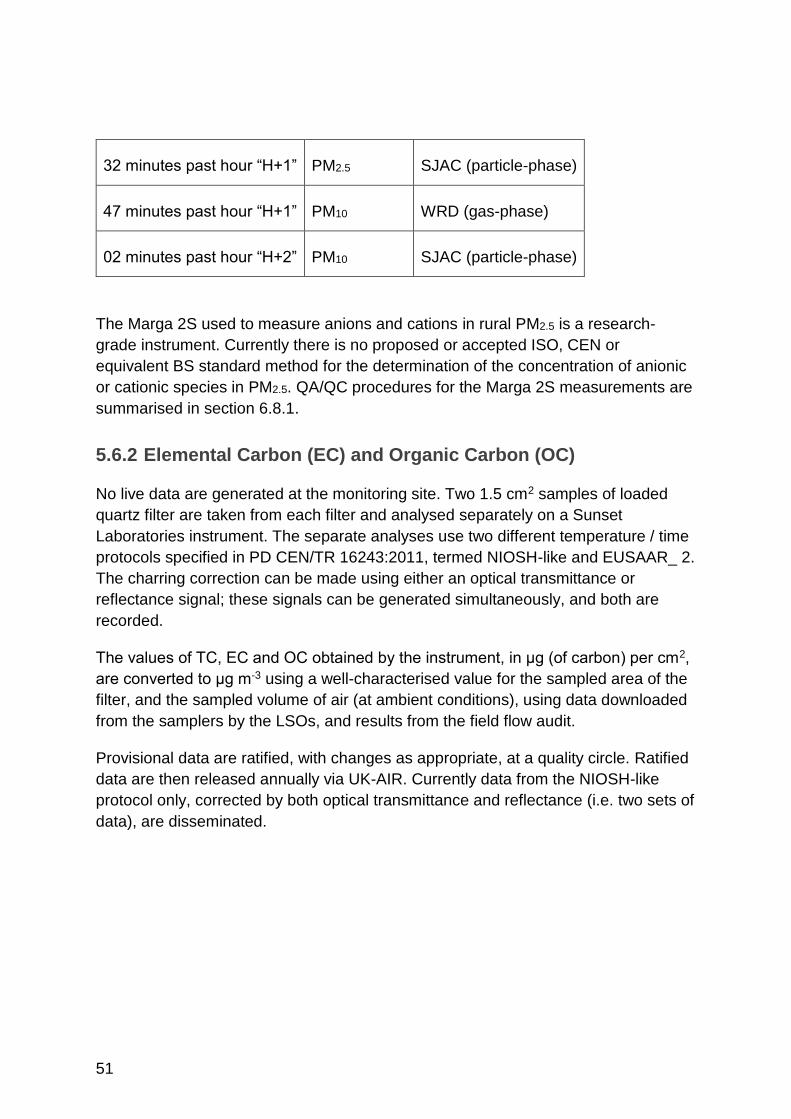
51
32 minutes past hour “H+1” PM2.5 SJAC (particle-phase)
47 minutes past hour “H+1” PM10 WRD (gas-phase)
02 minutes past hour “H+2” PM10 SJAC (particle-phase)
The Marga 2S used to measure anions and cations in rural PM2.5 is a research-
grade instrument. Currently there is no proposed or accepted ISO, CEN or
equivalent BS standard method for the determination of the concentration of anionic
or cationic species in PM2.5. QA/QC procedures for the Marga 2S measurements are
summarised in section 6.8.1.
5.6.2 Elemental Carbon (EC) and Organic Carbon (OC)
No live data are generated at the monitoring site. Two 1.5 cm2 samples of loaded
quartz filter are taken from each filter and analysed separately on a Sunset
Laboratories instrument. The separate analyses use two different temperature / time
protocols specified in PD CEN/TR 16243:2011, termed NIOSH-like and EUSAAR_ 2.
The charring correction can be made using either an optical transmittance or
reflectance signal; these signals can be generated simultaneously, and both are
recorded.
The values of TC, EC and OC obtained by the instrument, in μg (of carbon) per cm2,
are converted to μg m-3 using a well-characterised value for the sampled area of the
filter, and the sampled volume of air (at ambient conditions), using data downloaded
from the samplers by the LSOs, and results from the field flow audit.
Provisional data are ratified, with changes as appropriate, at a quality circle. Ratified
data are then released annually via UK-AIR. Currently data from the NIOSH-like
protocol only, corrected by both optical transmittance and reflectance (i.e. two sets of
data), are disseminated.
52
6 Quality Assurance and Quality Control
In order to produce data that are correct, meaningful and useful, the measurement
techniques utilised and data handling must have a sound scientific basis. The data
must be both accurate and precise.
Accuracy refers to the agreement between a measurement and the true value. It
allows us to have confidence that the concentration measured is correct. In turn, this
allows us to compare data over time, at different UK locations, or internationally.
Precision refers to the repeatability of measurement. A precise instrument will
always give the same result if the same measurement is repeated. An imprecise
instrument will show some variability in the same situation.
This section describes the QA/QC procedures employed by each network to ensure
that the DQOs of the relevant Directives are achieved.
6.1 UK National Reference Laboratories
The AQUILA group recognises two UK organisations as National Reference
Laboratories (NRLs): Ricardo-AEA and NPL.
The Air Quality Directive outlines the key responsibilities of National Reference
Laboratories (NRL) in Annex I (C), summarised below:
• All measurements undertaken in relation to the assessment of ambient air
quality are traceable in accordance with the requirements set out in Section
5.6.2.2 of the ISO 17025:2005.
• That institutions operating networks and individual stations have established
QA/QC systems.
• That a QA/QC process is established for the process of data collection and
reporting.
• That the national laboratories that are taking part in Community-wide
intercomparisons are accredited according to ISO 17025:2005, shall be
involved in the Community wide QA programmes and shall also coordinate,
on the national level, the appropriate realisation of reference methods and the
demonstration of equivalence of non-reference methods.
These requirements ensure that there is a clear chain of measurement traceability.
The Competent Authorities and their appointed NRLs have a clear responsibility for
the quality of data and ongoing commitment to harmonisation and traceability of data
throughout Europe.

53
As further enhancement to these requirements, the NRLs from all Member States
participate in biannual meetings of the AQUILA group. This group has a very specific
set of roles and responsibilities associated with air pollution measurements40.
6.2 QA/QC in the AURN
The AURN’s QA/QC Unit uses a variety of quality procedures, described in more
detail in this section.
The purpose of the QA/QC Unit is to ensure that the AURN data are:
• Genuinely representative of ambient pollutant concentrations in the areas
under investigation.
• Comparable and reproducible. Results must be internally consistent and
comparable with international or other accepted standards, where these exist.
• Consistent over time. This is particularly important if long-term trend analysis
of the data is to be undertaken.
• Representative over the period of measurement; for most purposes, a yearly
data capture rate of at least 90% is required for determining compliance with
EU limit values.
• Consistent with the DQOs and methodology guidance defined in the EU
Directive for relevant pollutants and measurement techniques.
6.2.1 Local Site Operator (LSO) calibrations
LSOs are employed in the UK to undertake routine tasks at AURN monitoring
stations to ensure that the data output is uninterrupted and of the highest possible
quality. The actions of the LSOs therefore affect both data quality and data capture.
For this reason LSOs are carefully selected by an evaluation board through a round
of competitive tendering undertaken by the CMCU based on their expertise,
experience and understanding of the AURN and the importance of data quality.
Training, and regular assessment, of the LSOs is carried out at scheduled site audits
(by the QA/QC Unit).
The key responsibilities of the LSOs are to:
• Carry out routine operation and calibration procedures for the equipment at
the site, in conformance with the LSO manual.
• Identify and report potential problems and changes to the site and
surrounding area.
• Identify and report potential safety issues at the site.

54
• Undertake simple tests and repairs to the site and/or equipment as directed
by the CMCU.
• Attend training (both formal and informal) as requested by the CMCU and/or
QA/QA Unit
• Attend QA/QC site audits as requested.
• Liaise with other AURN stakeholders as requested by the CMCU.
• Carry out all activities with regard to relevant health and safety standards.
• Complete the electronic calibration sheets, checklists and site servicing
records in full and email these to the CMCU and QA/QC Unit within 24 hours
of each site visit.
• For sites with gravimetric particulate monitors, return exposed filter magazines
to the CMCU within 48 hours of each site visit where appropriate.
• Undertake other reasonable requests as directed by the CMCU during a
pollution episode or other emergency.
• Attend Annual Review meetings as required.
• Use their experience of air pollution monitoring to identify and report any faults
or potential faults as soon as possible.
• Provide information on local activities that may affect the pollution climate or
site suitability at the monitoring station.
Change calibration gas cylinders
These responsibilities are carried out during routine visits (every 2 weeks at traffic
urban sites, monthly at background urban sites and quarterly at all rural sites) and
additional emergency call outs.
6.2.2 LSO Manual
A comprehensive operations manual for the AURN has been produced and
disseminated to all site operators. This is a key QA/QC tool, serving to harmonise
field procedures and improve the quality of the data produced by the monitoring
equipment through accurate calibration and optimised operation. The LSO manual is
available electronically via the “AURN Hub” - a website which provides useful
information and contact details for LSOs. The most recent update was in July 2012.
Training is also provided to any new LSOs and training updates are available to all
LSOs during at the twice-yearly site visits by the QA/QC Unit.
6.2.3 LSO Support
Both the CMCU and QA/QC Unit have a dedicated telephone line and email address
which is used by LSOs to access specialist knowledge and advice regarding the
AURN sites and equipment.

55
6.2.4 Equipment Support Units (ESU) for Service and Repair
ESUs are responsible for the routine and emergency maintenance and repair of the
monitoring and ancillary equipment at each AURN site. They are directly appointed
by the CMCU by competitive tender. The ESUs role is key to achieving the 90% data
capture target for all sites and pollutants.
Routine servicing is carried out on a 6-monthly basis and is coordinated with the
audit visits of the QA/QC Unit (see Section 6.1.5) to ensure that the necessary
instrument parameters and calibrations are recorded to allow full data ratification.
Minimum requirements for routine instrument maintenance, testing and calibration
are provided to ESUs. All routine service visits are fully documented and completed
in accordance with procedures provided by the QA/QC Unit.
In the event of an instrument malfunction, the ESU attends the site to carry out
emergency repairs or fit a replacement analyser within 48 hours of notification of the
problem as highlighted by the CMCU. Telemetry facilities and automated data
checking now also allow for rapid recognition of possible instrument malfunctions
and the CMCU typically uses this information to inform the relevant ESU of the likely
cause of malfunction.
6.2.5 AURN inter-calibration and site audits
Within the UK, there has been a system of routine site audit and network inter-
calibration, involving all network sites, for many years. The primary aims and
objectives of the site audit and network inter-comparison exercise can be
summarised as follows:
• Check and evaluate a wide range of analyser key functions via a
comprehensive set of tests and calibrations - well beyond those that can be
checked by routine LSO calibrations.
• Check all on-site calibration standards against common transfer standards
that are directly traceable to the gas standards calibration contractor’s
laboratory (currently Ricardo-AEA) and national metrology standards.
This network inter-calibration is undertaken by the QA/QC Unit at six-monthly
intervals and includes every site and every analyser in the network. The inter-
calibration therefore provides detailed and quantified information on overall network
performance.
Many of the site audit and network inter-calibration procedures used in the UK have
now been incorporated into the ongoing QA/QC procedures detailed in the CEN
Standard Methods. However, in some cases the CEN methods differ in detail or are

56
even more exacting than previous requirements. Procedures used in the UK are
routinely adapted to be fully compliant with the CEN requirements.
Ozone analysers are audited on a three-monthly basis: because of a requirement to
calibrate with a traceable standard every three months, a separate ozone inter-
calibration is carried out for this purpose between six-monthly inter-calibrations.
6.2.6 AURN inter-calibration procedures
These exercises provide the following information:
• Evaluation of the concentrations of site calibration cylinders, using a set of
certified cylinders (transfer standards) that are taken to all the sites. The
concentrations of the site cylinders are used to scale pollution datasets, so it
is important to check that the concentration of gases in the cylinders remain
stable over time.
• Analyser accuracy and precision, using a series of calibrated gas standards,
to ensure reliable datasets from the analysers.
• Calibration of ozone analysers with an ISO17025 certified ozone photometer.
• Instrument linearity, to check that doubling a concentration of gas to the
analyser results in a doubling of the analyser signal response. If an analyser
is not linear, data cannot be reliably scaled into concentrations.
• Instrument signal noise, to check for a stable analyser response to calibration
gases.
• Analyser response time, to check that the analyser responds quickly to a
change in gas concentrations.
• Leak and flow checks, to ensure that ambient air reaches the analysers,
without being compromised in any way.
• NOx analyser converter efficiency, to ensure reliable operation. This is the
device that allows the measurement of NO2 to be undertaken, so it must work
correctly.
• Tapered Element Oscillating Microbalance (TEOM) spring constant (ko)
evaluation. The analyser uses this factor to calculate mass concentrations, so
the value is calculated to determine its accuracy.
• Particulate analyser flow rate checks, to ensure that the flow rates through
critical parts of the analyser are within specified limits.
• Zero baseline checks on automatic particulate analysers. Using in-line HEPA
filters or equivalent to ensure that the instrument measures zero for particle-
free air.
• Site infrastructure and environment checks to ensure that metadata on the
station remain accurate and up to date and that any site safety issues are
noted for action.

57
As noted above, these tests performed on site are now undertaken to the exacting
requirements of CEN Standard Methods and hence are fully compliant with the Air
Quality Directive. The gas calibration contractor is accredited (Calibration Laboratory
Number 0401) under ISO 17025:2005 to perform these tests.
Accreditation to ISO 17025:2005 requires:
1. Documented procedures to calibrate analysers
2. Demonstration of competence of operators in performing calibrations
3. Demonstration of traceability of measurements to metrology standards
4. Calculation of uncertainty budgets for measurements reported on Calibration
Certificates.
6.2.7 Use of Information from the Site Audit and Network Inter-
calibration
The site audit and inter-calibration results provide vital information for the data
ratification process. For example if calibration cylinder concentrations or ozone
monitor calibration concentrations are identified to have changed at any site then the
information from the audit and inter-calibration is used to ensure that the data are
correctly rescaled during the ratification process. Also, if faults such as poor
converter efficiencies for NOx analysers are identified then the data are corrected or
deleted in line with the CEN requirements.
6.2.8 AURN Data Ratification (Gas Analysers)
Data validation is followed by more thorough checking at three-month intervals to
ensure that the data are reliable and consistent. This latter process is called data
“ratification”.
The first step is to go back to the “raw” unvalidated data from the analyser - this
allows traceability of all operations on the data within the ratification process to be
maintained. The data have already been scaled in near real-time by the CMCU in
order to provide the validated provisional data. However, for validation only the latest
calibration results are available for data scaling. Re-scaling the data at the start of
the ratification process allows any new information gathered over the full 3-month
period to be incorporated right at the start of the process.
The “raw” data are scaled into ambient concentrations by removing any baseline
zero and multiplying by the scaling factor (sensitivity). This is can be expressed
mathematically as follows.
c = F x (V – Z)
58
where:
c = the ambient concentration (ppb)
F = the instrument sensitivity (ppb / mV)
V = the instrument measurement (mV)
Z = the instrument zero baseline (mV)
The instrument sensitivity (F) is calculated during calibrations as follows:
F = C / (S – Z)
where:
F = the instrument sensitivity (ppb / mV)
C = the concentration of the calibration standard (ppb)
S = the instrument response to the calibration standard (mV)
Z = the instrument response to the calibration zero standard (mV)
Identical formulae are used where the ambient measurements are expressed in ppm
units and where the instrument records data in units other than mV: e.g. V or
nominal ppb.
These scaling values (Z and F) are derived from a range of instrument calibrations:
• Routine manual LSO calibrations
• Automatic analyser calibrations
• ESU calibrations at services or repair visits
• QA/QC Unit inter-calibrations.
6.2.8.1 Analyser Zero Baseline
For gas analysers the instrument zero baseline is generally measured every night
during the auto-calibration cycle. However, as this auto calibration only checks
analyser performance, it is not an absolute calibration. Often, the scrubbing material
within the auto-calibration system is spent and hence this estimate becomes

59
unreliable or, the relevant equipment may not be present on-site. However, this auto-
calibration zero is just one estimate of the baseline.
LSOs and ESUs also perform zero baseline measurements and these may also be
used to estimate the measurement zero point. However, these can occasionally be
unreliable for various reasons. The QA/QC Unit also provides a zero baseline
measurement during the inter-calibration.
If necessary a zero baseline can also be estimated from the lowest ambient
measurement, since concentration levels are often very low for some pollutants at
certain times during a month.
Deciding on the most appropriate zero baseline must account for all these sources of
information and is a difficult yet vital task since the choice will affect the reported
concentrations. The baseline finally applied to the data is based on the real
measurements (auto-calibration, LSO, ESU and QA/QC) and the judgement of the
data ratifier using software algorithms developed over many years of experience.
Isolated or occasional negative values are permitted to remain in the dataset so long
as they are not less than minus the limit of detection of the method. However, any
values less than the negative LoD are rejected.
6.2.8.2 Instrument Sensitivity
A similar decision is required for the instrument sensitivity. This is estimated from
calibrations by certified calibration gas sources such as the SO2 cylinders used by
the LSOs and ESUs. The overnight auto-calibration equipment may produce a
sensitivity based on SO2 permeation tubes or uncertified SO2 cylinders. There will
also be span calibrations made by the QA/QC Unit during the network inter-
calibration. Some of these estimates may be unreliable due to equipment failure or
the use of non-certified gases. The judgement of the Data Ratifier, aided by the
software algorithms, is therefore required to decide what sensitivity should be
applied.
6.2.8.3 Instrument Drift
Besides deciding the best zero baseline and instrument sensitivity, the data
ratification must also take account of any analyser drift in either zero or sensitivity.
Zero and sensitivity may vary day-by-day but a rapid drift may be the sign of an
instrument malfunction. Data ratification must evaluate where data can be accepted,
accepted with modification or has to be deleted.

60
6.2.8.4 Instrument failure
Instruments may fail for numerous reasons. The equipment is serviced at the regular
six-monthly ESU visits but malfunctions can arise between services. Some faults are
minor, such as sample flows just below optimum but flow blockages can prevent the
instrument from sampling ambient air. Ratification uses all available information: raw
measurements, calibrations, alarms, engineer reports etc., to decide if the data can
be corrected or needs to be rejected. The commencement of any fault must be
determined. This is often a matter of judgement based on experience.
6.2.8.5 NOx data processing
The approach to ratifying NOx data is slightly different to that for the other gaseous
AURN pollutants.
NOx instruments use the chemiluminescent technique to measure NO gas by
reaction with an internally generated ozone source. In order to report NOx, NO and
NO2 concentrations the instrument has to split the ambient sample into two. NO is
measured directly in the first stream. The second stream passes through a catalyst
that converts any NO2 into NO. This stream, known as NOx, is then measured. NO2
is calculated by the difference between the NOx from the second stream and the NO
from the first.
The efficiency of the converter is crucial to correct determination of NO2. The
converted efficiency is determined at each inter-calibration visit and where this is
less than the required 95%, data are rejected as they are likely to fall below the
required DQO. CEN standard 14211:2005 permits scaling at lower efficiencies
provided the DQO is still fulfilled.
When the CEN procedures are fully implemented, there will be a requirement to
correct data for converters with efficiency between 95% and 98%.
To achieve reliable NO2 concentrations, the NO and NOx channels are ratified
separately and then NO2 calculated by subtraction. This is a more reliable and
flexible system than relying on the internal calculation of NO2 within the analyser.
Calculations must be undertaken in mole fraction units (ppb) and the conversion to
mass concentration units (to four decimal places) undertaken separately. This allows
NOx concentrations to be reported correctly in the units required by the EU Directive
(gm-3 as NO2).
Review of the NOx/NO2 ratio over an extended period is a useful tool to assist in data
ratification. Seasonal patterns should be reasonably consistent at each monitoring
station. Any sudden change in the ratio requires investigation, and unless linked to a

61
change in the local pollutant emissions around the site it will probably result in
rejection of data.
6.2.9 AURN Data Ratification (Particle Analysers)
Ratification of data from particle analysers is generally simpler than for gaseous
analysers since there are fewer calibrations and checks which can be carried out in
the field.
In most cases day-to-day scaling factors do not need to be adjusted and ratification
consists primarily of deciding on the validity (or otherwise) of the measurements.
This decision in will be based on instrument diagnostics, comparison with co-located
measurements and other nearby stations, assessment of prevailing pollution
sources, and results of instrument and infrastructure checks carried out at QA/QC
audits.
For all types of instruments flow rate and leak checks are carried out during 6-
monthly audit visits and services. A ramped correction may be applied to sampled
volumes, where flow rates are found to be more than ±3% out from the flow rate
recorded by the instrument. However, if the flow rate differs by more than ±10% the
data are rejected.
For high-resolution 15-minute or hourly measurements it is sometimes apparent that
there is a high degree of random instrument instability or “noise” not linked to
changes in ambient pollutant concentrations. If this is the case then these data will
be rejected.
Further ratification checks for all analysers include:
• That there are no negative values (less than minus the limit of detection).
• That PM10 is greater than PM2.5, in cases where both parameters are
monitored using the same method at the same site (allowing for the
measurement uncertainty, particularly at rural sites where both PM10 and
PM2.5 are often low).
Additional data ratification considerations for two specific types of AURN particle
analysers are discussed in the following sections:
6.2.9.1 TEOM FDMS PM10 or PM2.5
The TEOM FDMS instruments introduce two new parameters to ratify: “Base” and
“Reference” measurements for particulate matter. The “Base” measurement is
essentially a measurement of the non-volatile component of the sampled particulate
matter. The “Reference” measurement cycle measures the volatile particulates by

62
evaporation from the filter and the instrument. Both these parameters are used to
calculate the total PM10 or PM2.5 (depending on the type of instrument): for example,
gravimetric equivalent PM10 is the sum of the volatile PM10 and non-volatile PM10.
Because the Reference cycle measures the volatile component by evaporation, the
Reference measurement is recorded as a negative concentration. This is simply a
function of the instrument technique; it is necessary to multiply the negative
Reference concentration by – 1 to obtain a positive volatile concentration.
Since gravimetric equivalent PM10 is the sum of the volatile PM10 and non-volatile
PM10 concentrations, the data processing and reporting of these three parameters
are linked. A PM10 concentration can only be reported if valid Reference and Base
measurements were made. Similarly, if the PM10 is judged to be unreliable (e.g.
excessive noise), then both the reference and base concentrations are deleted.
The terms Base and Reference are not used on UK-AIR: the terms “non-volatile” and
“volatile” are used instead for better understanding by the public.
For correct operation, the FDMS instruments must operate within certain
temperature and humidity tolerances. Hence, the ratification process also closely
inspects these data. For example, there must always be at least 4°C separation
between the sample and external dew points to prevent condensation on the filter.
Regional volatile PM measurements from the FDMS instruments should be
consistent over a large radius (200 km for example). These can therefore be used to
assess the validity of measurements from a particular instrument. If there is more
than 2 gm-3 deviation from the regional mean volatile then further investigation is
recommended.
On some instruments a gradual drift in the zero baseline is apparent either in the
volatile, non-volatile or both FDMS measurements. The reason for this behaviour is
unclear but if the zero baseline offset is measured to be > 2 gm-3 at a QA/QC audit
visit then further investigation and possible data rejection is required. Replacement
of the dryer on the FDMS unit is often found to cure the problem. Zero checks are
carried out twice per year: as of 1st January 2015, where the zero baseline offset is
found to be > 3 µg m-3 the QAQC contractor may use the result of the zero check to
correct for this baseline offset.
6.2.9.2 Non-Automatic Particle Monitors
Non-automatic PM10 and PM2.5 daily mean measurements are collected manually by
the CMCU and emailed monthly to QA/QC in spreadsheets.

63
Instrument alarms and warnings (due to instrument flow outliers for example) are
examined by the data ratifier to decide if the daily mean is valid or not. In addition,
the QA/QC Unit uses spreadsheets to check that:
• Minimum sampling time (18 hours) and minimum sample volume (18m3) are
achieved for each daily sample.
• There are no gaps in the dataset which cannot be explained by power or filter
exchange failures.
• Any unusually low, high, or otherwise anomalous values are explained, or
else rejected as spurious.
A field blank correction, based on an unexposed filter which remains in the filter
canister while the other filters in the batch are exposed, is applied to the results. This
takes account of any zero baseline artefacts which may occur during the exposure
and measurement process. Choice of filter substrate will depend on requirements for
any subsequent analysis of the particles collected. However for mass measurements
PTFE coated “Emfab” filters are generally preferred to Quartz in order to avoid
problems associated with moisture absorption. The issue of field blank correction,
and how this process can improve quality control and reduce measurement
uncertainty, are set out in a report by Bureau Veritas41.
As with other pollutants, account is taken of any measurements at nearby sites or
from other instruments at the site in question in order to determine if there are any
anomalies with the dataset. Each non-automatic PM sampler is compared with the
nearest comparable FDMS (or in some cases, a co-located FDMS).
6.2.10 Factors to Consider in Data Ratification
Data ratification procedures involve a critical review of all available information
relating to a particular data set, in order to verify, amend or reject the data. A wide
range of inputs need to be considered in the ratification process, as shown in Table
6-1.
The overall aim of the ratification process is to ensure that
• the final ratified dataset contains only valid data
• in the period between site audits, these data remain with the uncertainty level
determined at the audit.
The close examination of analyser calibration service history, along with the
overview procedures described above ensure that only valid data are retained.

64
Table 6-1 Factors to Consider in Data Ratification
Factor Relevant Questions
Instrument history and characteristics.
Has the equipment malfunctioned in this way before?
Calibration factors and drift. Rapid or excessive response drift can make data questionable.
Negative or out of-range data. Are the data correctly scaled?
Rapid excursions or “spikes”. Are such sudden changes in pollution concentrations likely?
Characteristics of the monitoring site. Is the station near a local pollution sink or source which could give rise to these results?
Effects of meteorology. Are such measurements likely under these weather conditions?
Time of day and year. Are such readings likely at this time of day/week/year?
The relationship between different pollutants.
Some pollutant concentrations may be expected to rise and fall together.
Results from other sites in the network.
These may indicate whether observations made at a particular site are exceptional or questionable. Data from other sites in the area can be compared for a given period to determine if measurements from a particular station are consistent with general pollution concentrations.
QA Audit and Service reports These will highlight any instrumental problems and determine if any correction of the data is necessary for long-term drift etc.
65
The actual data uncertainty can only be determined at the 6-monthly site audits
when all of the required parameters are measured and can be combined with
analyser type testing and calibration cylinder uncertainties. The careful application of
zero and span calibration data, and careful application of any corrections required as
a result of the sites audit (e.g. to account for changing calibration cylinder
concentrations) are designed to ensure that the data remain within the uncertainty
level determined at the audit.
6.2.11 Quality Circle
The QA/QC Unit uses a Quality Circle approach for final review of the data. The
Quality Circle is a meeting involving representation from all disciplines of the QA/QC
Unit: quality standards, inter-calibration team and data ratification. The meeting
reviews any significant problems and decides on the appropriate actions by
consensus. Data issues that are not clear to the ratification team may, for instance,
be resolved by the inter-calibration manager’s better understanding of the instrument
detection principle. The meeting also discusses the results of the QA/QC inter-
calibration. The meeting then needs to decide if, and how, any problems observed at
the inter-calibration affect the measured data.
The Quality Circle always needs to review data in the light of new information,
whether this comes from the inter-calibration exercise or from other sources. Ratified
data only rarely need to be revised and re-issued, though this does happen very
occasionally. Where a possible fault is suspected but the results of the inter-
calibration or other detailed investigations are still awaited then the data may remain
as provisional on the Archive until these investigations are completed. Again this
only happens infrequently.
A key role of the Quality Circle is to identify where improvements in the overall
quality system can be devised. This may be through improved equipment, improved
procedures, improved software or software algorithms etc. When such points are
identified they are actioned by the QA/QC Unit to ensure continuous improvement in
the quality system.
6.2.12 UKAS Accreditation (ISO 17025:2005)
In any monitoring network where traceability of measurements and compliance with
DQOs are critical, it is essential that the QA/QC procedures are accredited to
recognised, traceable standards. By accrediting key processes in the QA/QC
programme, it is possible to demonstrate compliance of the monitoring network to
the requirements of the Air Quality Directive. For network inter-calibration
procedures, the QA/QC Unit is required to hold UKAS accreditation to ISO
66
17025:2005 for the on-site calibration of gaseous analysers, determination of TEOM
spring constant (k0) and flow measurement of particulate analysers.
Accreditation to ISO 17025:2005 requires an organisation to:
• Document the procedures used to calibrate analysers
• Demonstrate competence of operators in performing calibrations
• Demonstrate traceability of measurements to metrology standards
• Calculate uncertainty budgets for measurements reported on Calibration
Certificates.
UKAS is the recognised accreditation body in the UK and performs surveillance visits
to the QA/QC Unit annually to assess competence and compliance with all the
requirements of ISO 17025:2005.
The Air Quality Directive requires that the measurements are traceable in
accordance with ISO 17025:2005. Section 8 of this report describes the traceability
of the UK measurements within the AURN, in compliance with this requirement.
In addition, the Directive requires that any laboratory taking part in Community-wide
inter-comparisons covering pollutants regulated in the Directive is accredited
according to ISO 17025:2005 (by 2010) for the reference methods referred to in
Annex VI of the Directive. The accreditation held by the QA/QC unit ensures
compliance with this requirement.
The Gas Standards Calibration Laboratory (currently Ricardo-AEA) is also
accredited to ISO 17025:2005 (the current contractor is UKAS Calibration Laboratory
No 401), and UKAS accreditation conforms to the requirements of ISO 17025:2005
for the certification of gas calibration standards for a range of pollutants within a
specified concentration range. This includes the gases and concentrations
appropriate to the AURN.
The schedule of UKAS accreditation for the current contractor is available at
http://www.ukas.org/calibration/lab_detail.asp?Lab_id=896&vMenuOption=3
6.3 QA/QC of Automatic Hydrocarbon Measurements
The Air Quality Directive requires benzene data to be reported with an uncertainty of
±25%. The Directive does not specify a DQO (uncertainty of measurement) for the
measurement of the remainder of the hydrocarbon species referred to as ozone
precursors.

67
Type approval, operational methodologies, mechanisms for QA/QC and calculation
of measurement uncertainty budgets are clearly prescribed in EN 14662-3:2005. All
of these areas need to be completely satisfied before an absolute calculation of
measurement uncertainty can be undertaken.
The UK automatic hydrocarbon network is already operated to a high standard and
will only need minor adjustment to be fully compliant with section 9 of EN 14662-
3:2005. These adjustments centre on annual linearity evaluations, better
quantification of calibration measurements and evaluation of site specific variables.
Robust, traceable, documented methodologies are implemented for calibration, data
transmission and ratification, providing rigorous QA/QC for the automatic VOC
analysers together with regularly undertaken European international
intercomparisons at the EC Joint Research Centre (JRC), Ispra and participation in
European round-robin exercises.
Routine network operation is carried out as follows:
• Daily checks performed daily by network manager or team member
• LSO visits fortnightly
• Data ratification is carried out quarterly. The ratification process is:
o Data is reviewed and checked for erroneous data and scaled or
removed if necessary
o Re-assignment of mis-identified peaks
o The final data is reviewed at a quarterly quality circle meeting with all
members of the project team
o Any outstanding corrections following the quality circle meeting are
made by the network manager before dissemination
6.4 QA/QC of Non-Automatic Benzene
Measurements
Bi-annual service and maintenance visits are carried out at all measurement sites.
Portable appliance Testing (PAT) is performed every other visit (annually). Sampling
tubes are sent out to LSOs fortnightly in advance for exposure the following week.
Each site receives a travel blank tube at least once per quarter. Samples are
analysed at a sub-contractor’s laboratory, conditioned and returned to the contractor
for re-use.
Data ratification is carried out quarterly. The ratification process is as follows:
• Check blank is <2ng.
68
• Check audit dates, time and flow rates have been entered correctly.
• Check sampling time is the same for both date/time and counter, investigate
erroneous data .
• Check difference between the 2 tubes comprising each sample, investigate
suspected erroneous data or mark as not for dissemination.
• Review site operator comments.
• Plot time series for the year to date to identify anomalous data points.
• Compare concentrations with same period in previous year.
• Apply data flags (manually).
• Upload ratified (or provisional if applicable) data to UK-AIR.
• Spot check data on UK-AIR for any inconsistencies.
6.5 QA/QC of Urban Metals Measurements
The QA/QC measures employed by the Network to ensure robust sampling are as
follows:
• The contractor visits all the Network sites to perform annual site audits.
• At these visits the site infrastructure, performance and integrity are assessed.
• The LSOs are also audited and receive extra training where required.
6.5.1 Metals Network Site Audits
During each Network site audit visit the contractor:
• Audits the procedures of the LSO on-site, giving introductory training where
necessary, and encouraged LSOs to feed-back into the running of the Network
• Assesses the current condition of all on-site equipment, including the condition
of the PM10 sampling head and impactor plate
• Calibrates the flows of both the particulate (for volumetric and standard flow),
and gaseous phase (volumetric flow), monitoring equipment
• Leak tests both the particulate and gaseous phase monitoring equipment
• Calibrates the site rotameter (used by the LSOs for determining the flow rate
through the total gaseous mercury sampling line).
6.5.2 Metals Network Servicing
The ESU performs preventative maintenance on the samplers twice a year.
The flow rate of the samplers is calibrated at each ESU visit, at the site audit, and
once more during the year by the contractor, yielding overall, quarterly flow
calibrations.
69
6.5.3 Additional Sampling and Analysis QA/QC Procedures
A sub-set of the QA/QC procedures employed during Network operation to ensure
the quality of the data produced is listed below:
6.5.3.1 Sampling
• Despatch and analysis of one field-blank filter and one field-blank adsorption
tube per site per quarter.
• Thorough checks of the returned filters and adsorption tubes to check for
damage during transport. Rejection of damaged filters or tubes.
• Logging of all samples on the contractor’s Network database. Rejection of any
unidentifiable samples and full investigation of any discrepancies.
• Continued training of, and regular communication with, the LSOs. This
includes assessment of performance during site audits.
6.5.3.2 Particulate phase metals (ICP-MS analysis)
• Optimisation of the ICP-MS prior to each set of analysis. Comparison of the
optimised parameters with pre-defined criteria.
• Regular extraction of an appropriate certified reference material (e.g. NIST
SRM 1648a or NIES No.8) to check the recovery of the digestion method.
Recoveries must be within the limits specified by EN 14902:2005.
• Regular measurement of filter blanks to ensure appropriate blank subtractions
are made from measured values.
• Maximum levels for the standard deviation of the five internal standard-
corrected measured intensities of each analysis of each sample.
• The maximum absolute weighted residual for all calibration curves (as
calculated using the contractor’s data processing software) must be less than
one.
• Ratification of all data by a Quality Circle of senior scientific experts within the
contractor’s organisation but independent of the analytical team.
6.5.3.3 Total gaseous mercury (atomic fluorescence analysis)
• Regular recovery tests carried out by analysing tubes spiked with a known
quantity of mercury. Recoveries of between 95% and 105% must be
achieved.
• Control limits on changes in instrument sensitivity between analyses.
• Analysis of clean tubes to ensure that blank levels are sufficiently low.
• Novel bracketing calibration procedure for each tube analysed in order to
minimise the effect of instrumental drift.

70
• Ratification of all data by a Quality Circle of recognised senior scientific
experts from within the contractor’s organisation but independent of the
analytical team.
6.6 QA/QC of Rural Metals Measurements
Each particulate monitoring site is serviced and audited every 6 months to maintain
the site infrastructure, performance and integrity. The operational conditions of the
particle samplers are checked daily, and any faults are usually rectified within a few
days to maximise the data capture performance.
The analytical processes are subject to the QA/QC requirements of UKAS
accreditation for ISO 17025:2005, which includes regular inter-laboratory
comparisons of data. The accreditation is held by the contractor’s laboratories (CEH
Lancaster) for the required analyses. Furthermore, CEH Lancaster participates in
the yearly EMEP intercomparison of analytical methods for heavy metals in
precipitation run by the Norwegian Institute of Air Analysis (NILU).
The databases are subject to rigorous checks and, in addition, the concentrations in
each sample are reviewed by the project manager at least quarterly before being
uploaded to UK-AIR. Individual samples which are deemed too high (usually more
than 2 x Standard Deviations from that year’s annual mean) are flagged as potential
outliers that may not be representative of background concentrations.
6.7 QA/QC of PAH Measurements
In order to assure robust sampling procedures the following QA/QC measures are
undertaken:
• Routine servicing/calibration of the Digitel samplers is carried out at all
Network stations once a year by the respective ESU.
• Yearly audits are carried out at all Network stations by the contractor. As part
of these visits, the flow is measured using a calibrated and traceable
flowmeter (according to EN 12341:1999 and EN 15549:2008), and the LSOs
are audited (and, where necessary, retrained). In addition, an updated LSO
site operation procedure manual is re-issued when necessary.
• Quarterly measurements of the flow rate of the samplers is performed at all
stations (as specified in EN 15549:2008), using calibration kits designed by
the contractor.
• Portable appliance testing, periodic (five-year) electrical testing and the
updating of risk assessments is also performed at the stations as necessary.

71
• Analysis of sample blanks and filter blanks is performed.
• Despatch and analysis of field blanks is performed.
• Inspection of all sampling media prior to despatch to stations in accordance
with the specifications in EN 15549:2008 and EN 15980:2011. For example,
filters are inspected for pinholes, loose material and non-uniformity.
• Inspection of all filters when returned from stations. Samples that are damaged
(e.g. torn or wet filters) or returned un-sampled are rejected and the details of
these samples are noted in the contractor’s Network database.
• Rejection of any unidentifiable samples returned from stations.
• Full investigation of any discrepant or unexpected sampling data (e.g.
unexpectedly high or low sample volumes).
In order to ensure the quality of the analytical data, the following QA and QC
measures are undertaken:
• Regular assessment of the limit of detection of the GC-MS method.
• Regular extraction and analysis of an appropriate certified reference material
(NIST SRM 1649b) in order to check the recovery of the extraction methods.
Recoveries must be within the limits specified by EN 15549:2008.
• Use of a range of deuterated PAH analogue species in order to assess (and
correct for) the recovery of each sample. Following the criterion in EN
15549:2008, if the analytical recovery of d-B[a]P for any sample is determined
to be less than 50 %, the result is highlighted as not being valid for inclusion in
the calculation of the annual mean concentration.
• The contractor regularly participates in proficiency testing and comparison
schemes to benchmark the quality of the analysis provided.
• All analyses are covered by accreditation to ISO 17025:2005.
Deposition sampling is performed as specified in EN 15980:2011. In this case,
analytical QA/QC is covered by EN 15980:2011 rather than EN 15549:2008. All
other aspects are the same.
6.8 QA/QC for Other Measurements
6.8.1 Cations and Anions in Rural PM2.5
The Marga 2S used to measure anions and cation in rural PM2.5 is a research-grade
instrument. Currently there is no proposed or accepted ISO, CEN or equivalent BS
standard method for the determination of the concentration of anionic or cationic
species in PM2.5.
72
The Marga 2S uses an internal standard of lithium bromide (LiBr) for on-going
calibration purposes. The LiBr solution is manufactured by the LSO. Measurements
are rejected if the measured Li+ and Br- ion concentrations deviate by more than
±20% of the known concentration. Currently the concentrations of Li+ and Br- ion in
the internal standard are 320 and 3680 µg L-1, respectively, in the Marga 2S based
at Harwell.
As noted in section 5.6.1, peak retention times may change over time due to
instrumental factors, e.g. column ageing, as well as environmental factors, e.g.
atmospheric temperature and pressure. In order to account for this, the peak
retention times are checked on a regular basis and adjusted accordingly by the LSO.
Peaks are identified by the system software if they fall within a window of ±5% of the
operator defined peak retention time. Occasionally, measurements may be made
where the peak retention time has shifted considerably within a short period of time,
e.g. over a period of a couple of hours. This may mean that a peak is missed or
misidentified by the system software. In such instances, the resultant anion and
cation chromatograms, which are written to file, can be re-analysed and use to verify
the presence of species of interest. Once a peak associated with species of interest
has been identified the mass concentration of the species can be determined. The
retrospective re-analysis of chromatograms is undertaken using proprietary software
supplied by the instrument manufacturer (Metrohm-Applikon BV, Schiedam, The
Netherlands).
The manufacturer’s quoted detection limits for the Marga 2S are given in Table 6-2.
Table 6-2 Manufacturer’s quoted detection limits for the Marga 2S
Particle-phase species Detection limit
(DL, µg m-3)
Gas-phase species Detection limit
(DL, µg m-3)
NH4+ ion 0.008 NH3 0.008
Na+ ion 0.008 HCl 0.005
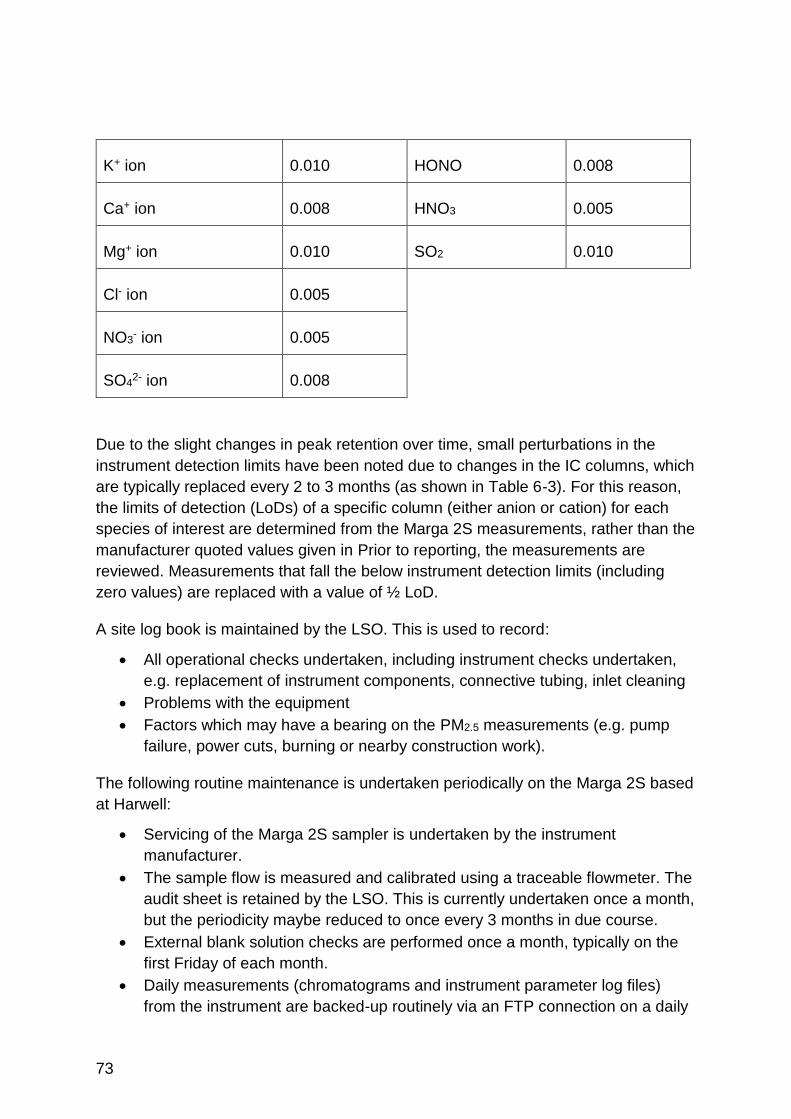
73
K+ ion 0.010 HONO 0.008
Ca+ ion 0.008 HNO3 0.005
Mg+ ion 0.010 SO2 0.010
Cl- ion 0.005
NO3- ion 0.005
SO42- ion 0.008
Due to the slight changes in peak retention over time, small perturbations in the
instrument detection limits have been noted due to changes in the IC columns, which
are typically replaced every 2 to 3 months (as shown in Table 6-3). For this reason,
the limits of detection (LoDs) of a specific column (either anion or cation) for each
species of interest are determined from the Marga 2S measurements, rather than the
manufacturer quoted values given in Prior to reporting, the measurements are
reviewed. Measurements that fall the below instrument detection limits (including
zero values) are replaced with a value of ½ LoD.
A site log book is maintained by the LSO. This is used to record:
• All operational checks undertaken, including instrument checks undertaken,
e.g. replacement of instrument components, connective tubing, inlet cleaning
• Problems with the equipment
• Factors which may have a bearing on the PM2.5 measurements (e.g. pump
failure, power cuts, burning or nearby construction work).
The following routine maintenance is undertaken periodically on the Marga 2S based
at Harwell:
• Servicing of the Marga 2S sampler is undertaken by the instrument
manufacturer.
• The sample flow is measured and calibrated using a traceable flowmeter. The
audit sheet is retained by the LSO. This is currently undertaken once a month,
but the periodicity maybe reduced to once every 3 months in due course.
• External blank solution checks are performed once a month, typically on the
first Friday of each month.
• Daily measurements (chromatograms and instrument parameter log files)
from the instrument are backed-up routinely via an FTP connection on a daily
74
basis (at 02:00) to the contractor’s internal server. This is to ensure good data
integrity and to limit data loss in the event of the irrevocable failure of the
instrument PC.
• System parameters and peak retention times are monitored on a daily basis
and adjusted accordingly.
• Instrument working solutions are manufactured according to the
manufacturer's guidelines. Working solutions are typically made from stock
solutions and replenished on a weekly basis.
• Variations in system parameters and instrument failures are investigated in a
timely manner.
The manufacturer’s suggested maintenance schedule for the Marga 2S is detailed in
Table 6-3.
Measurements form the Marga 2S are compared to other available particulate
(PM2.5) and gaseous-phase (e.g., SO2) measurements made at the site to determine
the quality and consistency of the measurements. Provisional measurements that do
not agree with measurements from the other instruments are flagged and may be
subject to removal from the final, ratified dataset. The ratified measurements are
then reported and disseminated via UK-AIR.
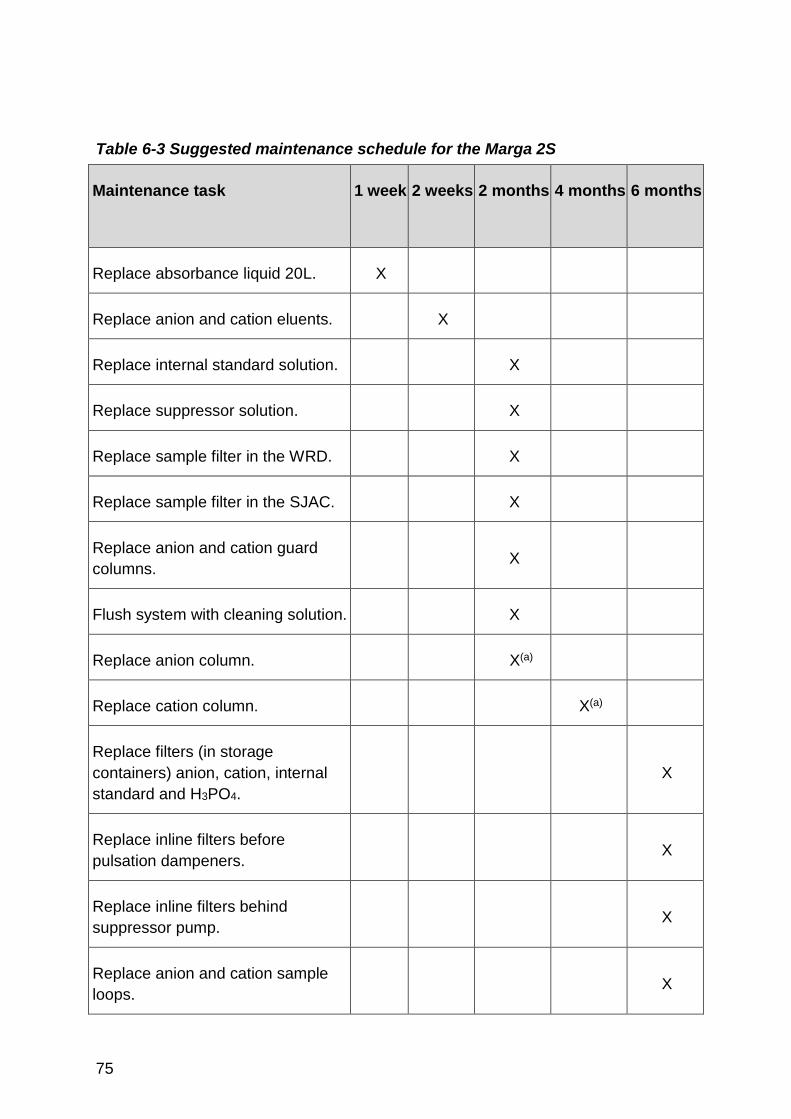
75
Table 6-3 Suggested maintenance schedule for the Marga 2S
Maintenance task
1 week 2 weeks 2 months 4 months 6 months
Replace absorbance liquid 20L. X
Replace anion and cation eluents. X
Replace internal standard solution. X
Replace suppressor solution. X
Replace sample filter in the WRD. X
Replace sample filter in the SJAC. X
Replace anion and cation guard
columns. X
Flush system with cleaning solution. X
Replace anion column. X(a)
Replace cation column. X(a)
Replace filters (in storage
containers) anion, cation, internal
standard and H3PO4.
X
Replace inline filters before
pulsation dampeners. X
Replace inline filters behind
suppressor pump. X
Replace anion and cation sample
loops. X
76
(a) Replacement frequency depends on the anion eluent and absorbance solution quality. Columns are replaced if exhausted
(indicated by the instrument software).
6.8.2 Elemental Carbon (EC) and Organic Carbon (OC)
In order to assure robust sampling procedures for EC and OC the following QA/QC
measures are undertaken:
• Routine servicing/calibration of the Leckel samplers is carried out at both
Network stations once a year by the ESU.
• Yearly audits are carried out at both Network stations by the contractor. As
part of these visits, the flow is measured using a calibrated and traceable
flowmeter (according to EN 14907:2005), and the LSOs are audited (and,
where necessary, retrained). In addition, an updated LSO site operation
procedure manual is re-issued when necessary.
• Portable appliance testing, periodic (five-year) electrical testing and the
updating of risk assessments is also performed at the stations as necessary.
• Analysis of sample blanks and filter blanks is performed.
• Despatch and analysis of field blanks is performed.
• Inspection of all sampling media prior to despatch to stations. For example,
filters are inspected for pinholes, loose material and non-uniformity.
• Inspection of all filters when returned from stations. Samples that are damaged
(e.g. torn or wet filters) or returned un-sampled are rejected and the details of
these samples are noted in the contractor’s Network database.
• Rejection of any unidentifiable samples returned from stations.
• Full investigation of any discrepant or unexpected sampling data (e.g.
unexpectedly high or low sample volumes).
In order to ensure the quality of the analytical data, the following QA and QC
measures are undertaken:
• Daily machine zero checks and sucrose solution checks. These must be within
specified limits.
• Regular analysis of the contractor’s internal reference material.
• Regular calibration of the sample temperatures using the recently-available
manufacturer’s calibration rig.
• TC analysis is covered by accreditation to ISO17025:2005 – the split into EC
and OC will be included in the accreditation when the standard method is
published.

77
7 Traceability of Measurements
Traceability requires an unbroken chain of measurements all with stated
uncertainties - from a primary international or national standard, through the
calibration standards used in the network, to the final measurement result.
Calibration standards are a key link in the traceability chain. The methods by which
calibration standards are developed and maintained at a national level fall into a
number of different categories. These cover calibration standards that are:
1. Prepared in a manner that is traceable directly to SI units though mass, volume
(length), flow (mass and time) etc. These apply to calibration standards for the
pollutant gases measured within the AURN (NOx, SO2, CO, O3), although there
are different means of realising and disseminating these, in particular between
ozone and the other gases.
2. Not able to be produced in a manner that is directly traceable to SI units but
traceability can be achieved by means of the realization of a potentially
‘absolute’ method such as optical photometry, when implemented under
controlled conditions. This method applies for the measurement of metals and
PAHs, for example.
3. Not able to be realised in a traceable manner or as a ‘primary’ or ‘absolute’
method, but realised instead by convention or by definition as the reference
method, preferably having the smallest measurement uncertainties achievable
using that method. This method applies for PM10 and PM2.5 measurements.
This section explains how traceability is achieved for gaseous pollutants, PM10,
PM2.5, benzene, metals and PAH. It does not cover measurement of deposited
metals, deposited PAH, rural cations and anions, EC and OC, because the relevant
Directives do not contain any DQOs for these parameters.
7.1 Traceability for NOx, SO2, CO and Zero Air
7.1.1 Overview
The traceability chain for the gaseous pollutants in the AURN is indicated in Figure
7-1. The “chain” is shown in red – from International standards to individual
measurement sites. The check procedures adopted in the UK are also highlighted –
and shown in green.
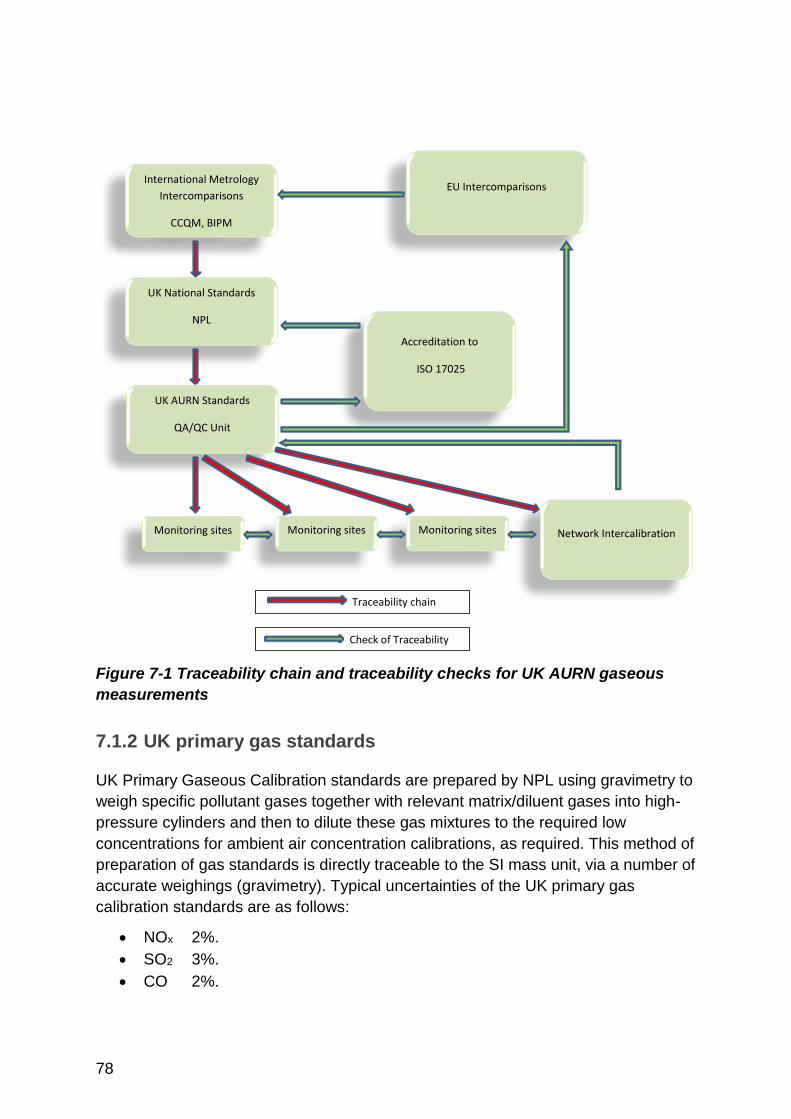
78
Figure 7-1 Traceability chain and traceability checks for UK AURN gaseous
measurements
7.1.2 UK primary gas standards
UK Primary Gaseous Calibration standards are prepared by NPL using gravimetry to
weigh specific pollutant gases together with relevant matrix/diluent gases into high-
pressure cylinders and then to dilute these gas mixtures to the required low
concentrations for ambient air concentration calibrations, as required. This method of
preparation of gas standards is directly traceable to the SI mass unit, via a number of
accurate weighings (gravimetry). Typical uncertainties of the UK primary gas
calibration standards are as follows:
• NOx 2%.
• SO2 3%.
• CO 2%.
International Metrology
Intercomparisons
CCQM, BIPM
EU Intercomparisons
UK National Standards
NPL
UK AURN Standards
QA/QC Unit
Accreditation to
ISO 17025
Monitoring sites Network Intercalibration Monitoring sites Monitoring sites
Traceability chain
Check of Traceability

79
These UK standards are cross-referenced with standards prepared by other national
institutes through international inter-calibration exercises coordinated by
organisations such as EUROMET.
7.1.3 Provision of traceable gas calibration standards to AURN
monitoring sites
All AURN sites have calibration gas cylinders for NO, NO2, CO, and SO2, as
appropriate, which remain at the site. These cylinders are prepared and supplied by
the Gas Supplier but prior to delivery to site they are calibrated at the Gas Standards
Calibration Laboratory and provided with a UKAS accredited certificate of calibration.
The current contractor, Ricardo-AEA, is UKAS Calibration Laboratory No 401; UKAS
accreditation conforms to the requirements of ISO 17025:2005.
The Gas Standards Calibration Laboratory has a suite of UK primary gas calibration
standards purchased from NPL. The calibration cylinders used at every AURN site
are certified against these, and given an ISO 17025:2005 accredited certificate of
calibration. Traceability of the calibration gas used at every AURN site is thus linked
in an unbroken chain to national and international gas standards. The uncertainty of
calibration gas standards provided to the monitoring sites is typically:
• NO 3-3.5%
• SO2 3.5%
• CO 2%.
All cylinders used for the AURN network inter-calibration are certified by the Gas
Standards Calibration Laboratory. The Gas Standards Calibration Laboratory also
undertakes international inter-comparisons at the EU Joint Research Centre to
ensure the integrity of the gas standards used in the AURN. As noted in section 6,
this is a requirement of both ISO 17025:2005 and the Air Quality Directive in order to
demonstrate comparability and traceability.
7.1.4 Zero air calibration standards
As ambient concentrations decrease, the importance of the accuracy of the zero
calibration increases. Zero air cylinders are used at most AURN sites. These are
traceable to a certified NPL zero air standard with the following specifications:
• NO 0.5 ppb
• SO2 0.7 ppb
• CO 20 ppb

80
These zero gas cylinders are replacing chemical air scrubbers used previously in
order to provide a more reliable, consistent and traceable basis for zero calibrations.
At a few sites, chemical scrubbers remain in use because reasons such as lack of
space prevent the installation of a zero air cylinder.
7.1.5 Site calibration and inter-calibration
The final link in the traceability chain from international gas standards to
measurements of air quality at individual measurement sites is provided through the
periodic calibration of the analysers with the certified cylinders at each site. At some
sites automatic systems provide for daily or 3-daily calibrations. At other sites 2-
weekly or monthly manual calibrations are performed.
In order to check the stability of the gas cylinders on site over a period of time, the
concentrations of the gases they contain are checked against recently certified
cylinders as part of the 6-monthly site inter-calibration exercise. The procedure is
analogous to that used in the Gas Standards Calibration Laboratory, but the
procedures in this case are not accredited. This is because the conditions for the
calibration cannot be reliably controlled at a remote measurement site in the way that
they are in the calibration laboratory.
The procedure is therefore to check the site cylinder concentration and if this is
shown to have deviated significantly from the certified value the cylinder is removed
from the monitoring site for further investigation. If the result shows the cylinder
contents have remained stable, the cylinder may be returned to the site for further
use. However, if the cylinder concentration has changed significantly, the new
concentration value is utilised as part of the process of data ratification for that site
whilst immediate replacement of the cylinder is recommended.
7.2 Traceability for Ozone
Unlike stable gases such as CO, NO etc., ozone is too reactive to be prepared in gas
cylinders. However, the UV absorption ozone photometer is an absolute method of
monitoring, governed by the Beer-Lambert law. Calibration of ozone analysers in the
UK are performed using reference ozone photometers, which are themselves
calibrated against an ozone standard reference photometer (SRP).
The Bureau International des Poids et Mesures (BIPM) maintains three NIST SRPs
in the UK (there are others elsewhere in Europe). These are used as ozone
reference standards to underpin its international comparison programme. The BIPM

81
and NIST are cooperating to transfer the international responsibility for the
comparison of national ozone standards to the BIPM.
Provision of traceable O3 calibration standards to all AURN ozone
monitoring sites
Transfer reference photometers are used for calibration of ozone analysers. These
are calibrated every 6 months by NPL against their SRP, providing UKAS accredited
calibrations in the range 0 to 1 ppm with a ±3.0% relative uncertainty (at the 95%
confidence level).
The QA/QC Unit’s transfer reference photometers are commercial photometers
certified to UK standard. These photometers are used to calibrate the ozone
analysers at all AURN sites every three months. The uncertainty of the calibration of
on-site analysers is typically 3-4%. Hence, there is an unbroken chain of traceability
to national and international ozone standards.
As an independent check, the QA/QC Unit also participates in EU network inter-
calibrations for ozone, organised by the JRC. In addition, the QA/QC Unit also
provides UKAS accredited calibrations of photometers used by the network’s service
engineers, enabling them to provide a traceable ozone analyser calibration as part of
their routine service and maintenance.
7.3 Traceability for PM10 and PM2.5
Manual gravimetric methods for particulate monitoring of PM10 and PM2.5, as
specified in the European standards EN 12341:1999 and EN 14907:2005
respectively are defined as the European Reference methods for particle monitoring
in Air Quality Directive. These two standards specify methods that cannot be
considered as traceable to the SI system of units in a rigorous manner. The sampling
is by a method defined by convention, and the mass measurement can clearly be
defined as traceable to SI units. However, the main problem is that the measurement
itself is not well defined, as the particles comprising the material sampled will have
different shapes, sizes and compositions.
As noted earlier (section 5.1), UK measurements of PM10 and PM2.5 are largely
undertaken with automatic measurement techniques, in order to fulfil the rapid
dissemination requirements of 2008/50/EC. The manual sampling methods are
therefore to be used as references against which other measurement techniques
used for monitoring PM10 and PM2.5 for EU regulatory purposes, may be compared.
As a result of such comparisons, other methods of measurement may be
demonstrated to be “equivalent” and accepted for the purposes of reporting results to

82
the EU. This concept of the demonstration of “equivalence” is specified in a
document prepared by the EU and involves comparisons in the field of any other
method for monitoring PM10 or PM2.5 with the relevant reference method.
The above standards therefore represent reference methods that are specified by
definition and with no real traceability to the SI system of units (with the exception of
a requirement to determine the mass flow of air through the monitor). This inability to
achieve traceability is partially as a result of the complex variable and ill-defined size,
shape and composition, of the particulate matter being monitored.
The UK has conducted a detailed and comprehensive equivalence testing
programme for PM10 and PM2.5. Latest results can be found on UK-AIR and the SIRA
MCERTS websites.
7.3.1 On-site checks
During the network 6-monthly inter-calibration exercise the flow rates of all network
analysers are calibrated by UKAS accredited procedures. For TEOM and TEOM
FDMS analysers the spring constant “k0” is also checked. This checks the most basic
parameters of the measurement – flow and mass – and ensures correct operation of
the analysers.
In addition ongoing QA/QC equivalence checks are incorporated into the network via
long-term co-located sampling of PM10 and PM2.5 with both TEOM FDMS and
gravimetric (Partisol) samplers at four sites in the network.
7.4 Traceability of Automatic Hydrocarbon
Measurements
The uncertainty of NPL VOC gas standards is stated on the certificate as an
expanded uncertainty with a coverage factor of approximately 95% in the units of the
gravimetric amount fraction. This uncertainty is a combination of the gravimetric
uncertainty in the preparation of the mixtures and an allowance for drift over the two-
year period the certificate is valid. NPL carries out continuous stability checks on the
VOC standards.

83
7.5 Traceability of Non-Automatic Benzene
Measurements
UKAS accredited flow checks are carried out on a six monthly basis at audit/service
visits by the contractor. Certificates are provided each audit period. UKAS accredited
measurements by GC-MS for benzene from Carbopak X sorbent material is carried
out by the subcontractor.
7.6 Traceability of Metals Measurements
7.6.1 Urban and Industrial
As explained above, metrological traceability ensures that any result can be related
to a reference through a documented unbroken chain of calibrations, each
contributing to the measurement uncertainty. Here, a ‘reference’ can be a definition
of a measurement unit through its practical realisation, or a measurement procedure
including the measurement unit for a non-ordinal quantity, or a measurement
standard. The measurement results obtained by this network are therefore
calibrations and fully traceable to national standards and to primary realisations of
the relevant SI units.
Each site is flow checked on a quarterly basis with flow calibrators traceable to
national standards. Both the ESU and the contractor use the same ISO 17025:2005
accredited calibration service to calibrate their flow meters. Analysis in the laboratory
is traceable to the NIST series of mono-elemental standards which realise the mole,
and to the definition of the kilogram through the gravimetric preparation of standard
solutions.
Where traceability to SI base units is not possible because the measurement is
defined by the procedure – here, PM10 sampling – the relevant documentary
standard is followed (EN 12341:1999).
Whilst not ensuring traceability per se, analytical results for metals are validated by
the regular measurement of relevant certified reference materials: NIST SRM 1648a,
ERM-CZ120 or NIES No.8.
84
7.6.2 Rural
Partisol flow calibrations are determined with a Streamline Pro MultiCal System,
traceable to NIST Reference Standards sn10961, sn10961, sn10963, and
sn913930-M1.
The analytical laboratory used is accredited to ISO 17025: 2005 by UKAS. In
compliance with section 5.6 (clauses 5.6.2.1.1 and 5.6.2.2.1 ) of ISO 17025:2005,
the laboratory maintains a system whereby all analyses are traceable to SI units by
means of an unbroken chain of calibrations and comparisons linking them to relevant
primary standards of the SI units of measurement. This applies to both measurement
equipment used (e.g. balances) and analytical reference materials.
The Tekran instrument (used for TGM and speciated mercury measurement) is a
mercury mass measurement method. It is auto calibrated using an internal
permeation source. This source is externally verified / calibrated with a with a
primary reference standard of saturated mercury at a known temperature with a
volumetric syringe to introduce a known mass of mercury. This is carried out using
the Tekran 2505 mercury vapour calibration unit, which meets the requirements of
BS EN 15852 . Field trials and inter-comparison between methods for measuring
atmospheric mercury found good agreement between sampling methods including
the Tekran analyser42,43.
7.7 Traceability of PAH Measurements
The measurement results obtained by this network are calibrations and fully
traceable to national standards and to primary realisations of the relevant SI units.
The sampler flow rate is checked by the LSO on a quarterly basis and during the
annual audit by the contractor. The flow meter for the PAH Network is calibrated
traceable to national standards using an ISO 17025:2005 accredited service.
Analysis in the laboratory is traceable to the NIST series of mono-elemental
standards which realise the mole, and to the definition of the kilogram through the
gravimetric preparation of standard solutions.
Where traceability to SI base units is not possible because the measurement is
defined by the procedure – here, PM10 sampling – the relevant documentary
standard is followed (EN 12341:1999 and EN 15549:2008).
Whilst not ensuring traceability per se analytical results are validated by the regular
measurement of relevant certified reference materials: NIST SRM 1649b, ERM-
CZ100.

85
The above applies to measurements of both suspended PAH concentration and
deposited PAH.

86
8 Uncertainty of the Measurements
This section sets out the uncertainty calculation philosophy and the typical
uncertainty values for measurements of ambient concentrations of gaseous
pollutants, PM10, PM2.5, benzene, metals and PAH. It does not cover measurement
uncertainty of rural cations and anions, EC and OC, because the relevant Directives
do not contain any DQOs for these parameters.
In general, all measurement uncertainties are calculated using very similar
methodologies. The first stage of the process is set by the EC which, based on
health impact information, specifies a Limit or Target Value for a pollutant, together
with a DQO for that Value. By way of an example, the annual mean Limit Value for
NO2 is 40μgm-3, with a DQO of ±15% for fixed measurements. Therefore an annual
mean measurement reported at 40 μgm-3 must have an associated uncertainty of no
more than ±6μg/m3.
The next stage in the process is determined by critical assessment of the
performance of the analyser making the measurement. Using principles from the
Guide to the Uncertainty of Measurement (GUM)44, all of the possible components
associated with making a measurement are identified, their effects on the
measurement quantified and then combined to provide a total uncertainty for the
measurement.
For example, the uncertainty associated with making a fixed measurement of carbon
monoxide will be influenced by the uncertainty of a number of factors, for example:
• The concentration of calibration gases (zero and span).
• The noise associated with the analyser signal (to zero and span gases).
• The response of the analyser to any interfering gases.
• The response of the analyser to other interferences (temperature, electricity
supply, etc.).
• Any lack of linear response of the analyser.
Once all of the possible contributions are identified and evaluated, the results are
combined in a “root-sum-square” calculation to arrive at the total measurement
uncertainty at the Limit or Target Value.
For all pollutants regulated by EC Directives, standard methods have been published
that describe exactly how to perform the evaluations and calculations, together with
minimum requirements for ongoing Quality Control procedures.
Member States are required to use instrumentation that have been tested against
these standard methods and fulfil the requirements of the DQO. Ongoing QC

87
obligations must be fulfilled to ensure that the instruments and associated
infrastructure continue to produce data that are compliant with the DQO.
8.1 Uncertainty in the AURN
As a result of all of the QA/QC operations undertaken within the AURN and
described in this report, the uncertainty of the measurements can be reliably
determined using the methodology defined in the CEN Standard Methods. This
determination of uncertainty is required to demonstrate compliance of the
measurements made within the AURN with the DQOs of Air Quality Directive.
The Directive requires full implementation of the CEN Standard Methods of
Measurement throughout the network by June 2013. The UK has complied by the
due date.
Analysers used in the AURN have been fully tested against the performance
requirements of the CEN standard methods. The results obtained vary not only by
pollutant type but also by manufacturer. Following verification of the performance
test results, minor variations to the uncertainty calculations are made to account for
analyser and specific field operation functions e.g. NOx converter efficiency tests and
cylinder uncertainties. The results of these calculations are summarised in Table 8-1.
Table 8-1 Calculated Best Measurement Uncertainty of AURN Data using CEN
methodology
Instrument NOx CO SO2 O3
API A + E series Analysers (at Limit Value) 14% 10% 13% 12%
Horiba 370 series Analysers (at Limit Value) 12% 11% 12% 9%
Thermo I series Analysers (at Limit Value) 10% 10% 13% 11%
ME 9800(UK) series Analysers (at Limit Value) 11% 14% 11% 12%
EU Directive DQO (at Limit or Target Value) 15% 15% 15% 15%
Table 8-1 shows that the data obtained from the analysers tested to date fulfil the
requirements of the EU Directive DQOs. The calculations at this stage necessarily
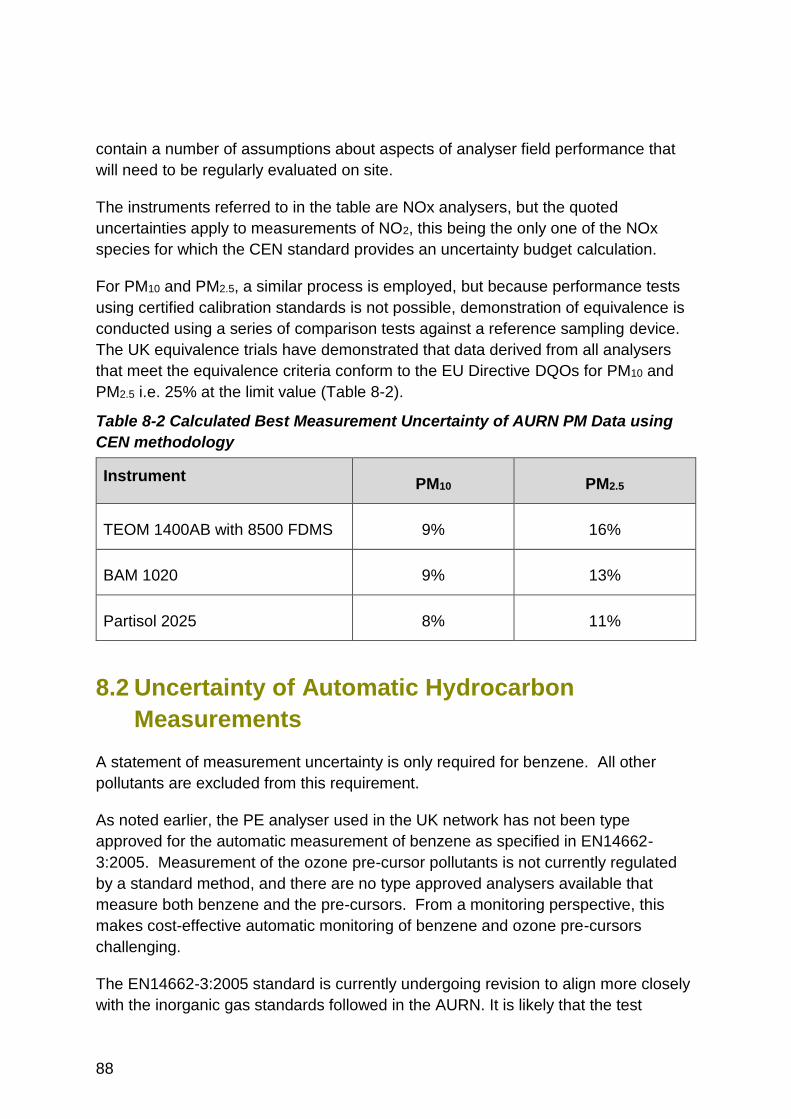
88
contain a number of assumptions about aspects of analyser field performance that
will need to be regularly evaluated on site.
The instruments referred to in the table are NOx analysers, but the quoted
uncertainties apply to measurements of NO2, this being the only one of the NOx
species for which the CEN standard provides an uncertainty budget calculation.
For PM10 and PM2.5, a similar process is employed, but because performance tests
using certified calibration standards is not possible, demonstration of equivalence is
conducted using a series of comparison tests against a reference sampling device.
The UK equivalence trials have demonstrated that data derived from all analysers
that meet the equivalence criteria conform to the EU Directive DQOs for PM10 and
PM2.5 i.e. 25% at the limit value (Table 8-2).
Table 8-2 Calculated Best Measurement Uncertainty of AURN PM Data using
CEN methodology
Instrument PM10 PM2.5
TEOM 1400AB with 8500 FDMS 9% 16%
BAM 1020 9% 13%
Partisol 2025 8% 11%
8.2 Uncertainty of Automatic Hydrocarbon
Measurements
A statement of measurement uncertainty is only required for benzene. All other
pollutants are excluded from this requirement.
As noted earlier, the PE analyser used in the UK network has not been type
approved for the automatic measurement of benzene as specified in EN14662-
3:2005. Measurement of the ozone pre-cursor pollutants is not currently regulated
by a standard method, and there are no type approved analysers available that
measure both benzene and the pre-cursors. From a monitoring perspective, this
makes cost-effective automatic monitoring of benzene and ozone pre-cursors
challenging.
The EN14662-3:2005 standard is currently undergoing revision to align more closely
with the inorganic gas standards followed in the AURN. It is likely that the test

89
programme will be sufficiently different from the old type approval that the
performance of all analysers will need to be re-evaluated.
This likely change in the standard method makes evaluation of measurement
uncertainty complex. The UK has a staged approach to fulfilling this requirement:
• The four automatic analysers in the network are calibrated with certified gas
mixtures.
• The four automatic analysers have been regularly intercompared against co-
located samples collected using the pumped sampler methodology. Results of
these comparisons show that the difference between the techniques is less
than 10%.
• The UK regularly participates in round robin calibration exercises, where the
concentrations of known gas mixtures are evaluated with a calibrated
analyser. In the most recent exercise, the maximum deviation of reported
benzene concentrations from the reference value was 7.6%.
• The UK also participates in international intercomparison exercises, where
test gases are generated and sampled simultaneously by a number of
different analysers owned by Member States.
In addition, calculation of the uncertainty of the calibration factor of an analyser is
routinely undertaken, using the principles of the GUM to define the inputs into the
calculations. These tests demonstrate that the uncertainty of the calibration factors
is routinely better than 25%
These approaches provide confidence that the calibration and monitoring
methodologies used by the UK are sufficiently robust to fulfil the requirements of the
benzene DQO (25%).
8.3 Uncertainty of Non-Automatic Benzene
Measurements
Flow checks are carried out on a six monthly basis at audit/service visits. The
calculated uncertainty for the Non-Automatic Hydrocarbon sites is typically 15%,
expressed at a 95% level of confidence. This includes contributions from the
contractor’s UKAS accredited low flow measurements, desorption efficiency and
analysis uncertainty.

90
8.4 Uncertainty of Metals Measurements
8.4.1 Urban
The range of uncertainties covering the majority of analyses of single filters and
tubes are shown in Table 8-3 below. All figures are a combination of the analytical
and sampling uncertainties and have been derived using full ISO GUM compliant
uncertainty budgets developed from measurement equations which describe the
entire measurement process. All values are stated to a coverage factor of k = 2,
providing a level of confidence of approximately 95%.
The measurement uncertainties displayed in Table 8-3 are representative of the
range of uncertainties covering the majority of individual measurements over a
typical sampling period (here, one week), as required by the Air Quality Directives.
The vast majority of the measurements used to compile the data above were of
ambient concentrations well below the relevant target values. It is calculated that in
the region of the appropriate target value – where the Air Quality Directive’s
uncertainty DQOs apply (except for Hg(v) where there is no target value) – these
relative uncertainties will be significantly lower.
8.4.1.1 Measurement of uncertainty of the annual average
ISO 11222:200245 “Air quality - Determination of the uncertainty of the time average
of air quality measurements” is used to determine the uncertainty in the annual mean
for each element at each sampling location. This is easily done since the contractor
produces a statement of uncertainty with each measurement result.
Data capture across the Network remains high (and any gaps in coverage have
generally occurred evenly throughout the year). The uncertainty in the annual mean
values are dominated by analytical and sampling uncertainty, with only small
uncertainty contributions arising from time coverage below 100%. The effect of these
contributions is calculated using the method described in ISO 11222:2002 “Air
quality - Determination of the uncertainty of the time average of air quality
measurements”. In all cases annual mean uncertainties are compliant with the DQOs
for uncertainty in the Air Quality Directives.

91
Table 8-3 Expanded Relative Uncertainties over a typical sampling period of 1
week
Analyte
Expanded Relative Uncertainties
Single measurement range(a)
EC Directive maximum(b)
As 16 - 26 %
40 %
Cd 13 - 20 %
40 %
Co 18 - 38 % -
Cr 14 - 32 % -
Cu 11 - 15 % -
Fe 12 - 17 % -
Mn 11 - 15 % -
Ni 10 - 14 % 40 %
Pb 8 - 13 % 25 %
Pt 40 - 50 %(c) -
Se 20 - 35 % -
V 11 - 16 % -
Zn 10 - 14 % -
Hg(p)(d) 20 - 40 %
-
Hg(v)(d) 13 - 20 % 50 % (a) ‘Single measurement range’ shows the range of uncertainties covering the majority of analyses of single filters
and tubes by the current contractor during 2011.
(b) ‘EC Directive maximum’ shows the maximum permissible uncertainty at the target value allowed by the relevant
EU Air Quality Directive.
(c) Many Pt measurements are below the limit of detection, the uncertainty quoted refers to those measurements
that are above the detection limit.
(d) Hg(p) and Hg(v) are particulate phase mercury, and total gaseous mercury, respectively.
Expanded uncertainties, quoted at the 95% confidence interval, for the annual mean
concentration values of the relevant Air Quality Directives metals are given in Table
8-4 below. These apply at the relevant limit value or target value.

92
Table 8-4 Annual Mean Uncertainties
Analyte
Relative Expanded Uncertainties(a)
Annual Mean EC Directive maximum
As 25 %
40 %
Cd 14 %
40 %
Ni 16 % 40 %
Pb 14 % 25 %
Hg(v)(b) 20 % 50 % (a) Relative expanded uncertainties, quoted at the 95% confidence interval, for the annual mean concentration
values of the relevant Daughter Directive metals, averaged across the Network.
(b) Hg(v) refers to total gaseous mercury. For Hg(v) there is no limit or target value stated in the Fourth Daughter
Directive at which this maximum allowable uncertainty applies.
8.4.2 Rural
For the measurement of trace metals by ICPMS the total expanded uncertainties
measured at 5 µg l-1 shows a coefficient of variation better than 5% for all elements
except Li, Be, Zn and Sn. The coefficients of variation for Li, Be, Zn and Sn are
10.5%, 9.3%, 23.4% and 10.3% respectively. The total expanded uncertainty for the
determination of mercury by the AFS method is 25% at 10 ng l-1.
For the Directive metals, samples are checked for an expanded uncertainty of 10 %
(equivalent to 2 times the standard deviation of that year’s annual mean). The
concentrations are checked against the limit value / target value concentrations, but
are always well below these values.
In the case of metals deposition measurements made by the Rural Metals Network,
Concentrations in rainwater are also checked for an expanded uncertainty of 10 %
(equivalent to 2 times the standard deviation of that year’s annual mean).
8.5 Uncertainty of PAH Measurements
The range of uncertainties covering the analyses of ambient PAHs by the present
contractor is shown in
93
Table 8-5 below. All figures are a combination of the analytical and sampling
uncertainties and have been derived using full ISO GUM compliant uncertainty
budgets developed from measurement equations which describe the entire
measurement process. All values are stated to a coverage factor of k = 2, providing a
level of confidence of approximately 95%.
These uncertainties only apply to ambient PAH measurement. The expanded
uncertainties for all species measured in deposition are 60%.
As the measurement method is optimised for the measurement of B[a]P (PAH number
29), the uncertainty requirement is lowest for the PAHs with the retention closest to
B[a]P.
Other factors affecting the specified uncertainty requirement include: volatility, typical
peak shape, and retention time proximity to the internal standard and the nearest
surrogate standard.
8.5.1 Measurement uncertainty of the annual average
ISO 11222:2002 “Air quality - Determination of the uncertainty of the time average of
air quality measurements” is used to determine the uncertainty in the annual mean
for each element at each sampling location. This is easily done since the contractor
produces a statement of uncertainty with each measurement result.
Data capture across the Network remains high (and any gaps in coverage have
generally occurred evenly throughout the year). The uncertainty in the annual mean
values are dominated by analytical and sampling uncertainty, with only small
uncertainty contributions arising from time coverage below 100%. The effect of these
contributions is calculated using the method described in ISO 11222:2002.
In all cases annual mean uncertainties are compliant with the DQOs for uncertainty
in the Air Quality Directives.
The relative expanded uncertainty in a typical analytical result for B[a]P from a
Network sample was estimated to be 20% to 30% - well within the DQO of an
expanded uncertainty of 50%. For B[a]P this applies at the target value.

94
Table 8-5 Range of PAHs analysed, with the respective uncertainties of
measurement.
PAH
number Compound
Expanded
Uncertainty
PAH
number Compound
Expanded
Uncertainty
1 Naphthalene 50 % 21 Benz[a]anthracene 35 %
2 2-Methyl naphthalene 50 % 22 Cyclopenta[c,d]pyrene 35 %
3 1-Methyl naphthalene 50 % 23 Chrysene 35 %
4 Biphenyl 50 % 24 5-Methyl chrysene 35 %
5 Acenaphthylene 50 % 25 Benzo[b]fluoranthene 25 %
6 Acenaphthene 50 % 26 Benzo[k]fluoranthene 25 %
7 Fluorene 50 % 27 Benzo[j]fluoranthene 25 %
8 Phenanthrene 50 % 28 Benzo[e]pyrene 25 %
9 Anthracene 50 % 29 Benzo[a]pyrene 25 %
10 2-Methyl phenanthrene 45 % 30 Perylene 25 %
11 2-Methyl anthracene 45 % 31 Indeno[1,2,3-cd]pyrene 25 %
12 1-Methyl anthracene 45 % 32 Dibenz[a,c]anthracene 25 %
13 1-Methyl phenanthrene 45 % 33 Dibenz[a,h]anthracene 25 %
14 4,5-Methylene
phenanthrene 45 % 34 Benzo[g,h,i]perylene
25 %
15 9-Methyl anthracene 45 % 35 Anthanthrene 25 %
16 Fluoranthene 45 % 36 Dibenzo[a,l]pyrene 35 %
17 Retene 45 % 37 Dibenzo[a,e]pyrene 35 %
18 Pyrene 45 % 38 Coronene 35 %
19 Benzo[b]naph[2,1-d]
thiophene 35 % 39 Dibenzo[a,i]pyrene
35 %
20 Benzo[c]phenanthrene 35 % 40 Dibenzo[a,h]pyrene 35 %

95
9 Gibraltar
The air quality monitoring procedures used in Gibraltar are in most cases the same
as in the UK. They are briefly summarised as follows:
1. NOx, SO2, CO and O3: as for the AURN
2. PM10 and PM2.5: as for the AURN using Partisol samplers and an FDMS
monitor.
3. Metals: as for the Urban and Industrial Metals Network except that daily rather
than weekly samples are bulked for analysis.
4. PAH: as for the PAH Network
5. VOCs (benzene and ozone precursors) - as for the Automatic Hydrocarbon
Network.
For more information on air quality monitoring in Gibraltar please refer to the website
“Air Quality in Gibraltar” at http://www.gibraltarairquality.gi/ .

96
10 References
1 European Parliament and Council of the European Union (2008) “Council Directive on ambient air quality and cleaner air for Europe (2008/50/EC)”. [online]. Available at http://eur-lex.europa.eu/LexUriServ/LexUriServ.do?uri=CELEX:32008L0050:EN:NOT (Accessed 20 Sep 2013). 2 Council of the European Union (1996) “Directive 96/62/EC on Ambient Air Quality Assessment and Management”. [online]. Available at http://eur-lex.europa.eu/LexUriServ/LexUriServ.do?uri=CELEX:31996L0062:EN:NOT (Accessed 20 Sep 2013). 3 Council of the European Union (1999) “Council Directive 1999/30/EC of 22 April 1999 relating to limit values for sulphur dioxide, nitrogen dioxide and oxides of nitrogen, particulate matter and lead in ambient air”. [online]. Available at http://eur-lex.europa.eu/LexUriServ/LexUriServ.do?uri=CELEX:31999L0030:EN:NOT (Accessed 20 Sep 2013). 4 European Parliament and Council of the European Union (2000) “Directive 2000/69/EC of the European Parliament and of the Council of 16 November 2000 relating to limit values for benzene and carbon monoxide in ambient air”. [online]. Available at http://eur-lex.europa.eu/LexUriServ/LexUriServ.do?uri=CELEX:32000L0069:EN:NOT (Accessed 20 Sep 2013). 5 European Parliament and Council of the European Union (2002) “Directive 2002/3/EC of the European Parliament and of the Council of 12 February 2002 relating to ozone in ambient air”. [online]. Available at http://eur-lex.europa.eu/LexUriServ/LexUriServ.do?uri=CELEX:32002L0003:EN:NOT (Accessed 20 Sep 2013).
6 “Council Decision 97/101/EC”. [online]. Available at http://eur-
lex.europa.eu/LexUriServ/LexUriServ.do?uri=CELEX:31997D0101:EN:NOT (Accessed 20 Sep
2013).
7 European Parliament and Council of the European Union (2004) “Directive 2004/107/EC of the European Parliament and of the Council of 15 December 2004 relating to arsenic, cadmium, mercury, nickel and polycyclic aromatic hydrocarbons in ambient air”. [online]. Available at http://eur-lex.europa.eu/LexUriServ/LexUriServ.do?uri=CELEX:32004L0107:EN:NOT (Accessed 20 Sep 2013). 8 UK Government “UK Air Quality Standards Regulations 2010”. [online]. Available at http://www.legislation.gov.uk/uksi/2010/1001/contents/made (Accessed 20 Sep 2013). 9 Scottish Government “The Air Quality Standards (Scotland) Regulations (2010)”. [online]. Available at http://www.legislation.gov.uk/ssi/2010/204/made (Accessed 20 Sep 2013). 10 Welsh Government “The Air Quality Standards (Wales) Regulations 2010” [online]. Available at http://www.legislation.gov.uk/wsi/2010/1433/contents/made (Accessed 20 Sep 2013).
97
11 Department of Environment, Northern Ireland “The Air Quality Standards Regulations (Northern Ireland) 2010”. [online]. Available at http://www.legislation.gov.uk/nisr/2010/188/contents/made.
12 “Council Decision 2011/850/EU”. [online]. Available at http://eur-
lex.europa.eu/LexUriServ/LexUriServ.do?uri=OJ:L:2011:335:0086:0106:EN:PDF
(Accessed 20 Sep 2013).
13 CEN “EN 14211:2005 Ambient air quality - Standard method for the measurement of the
concentration of nitrogen dioxide and nitrogen monoxide by Chemiluminescence”. 2005
14 CEN “EN 14212:2005 Ambient air quality – Standard method for the measurement of the
concentration of sulphur dioxide by UV fluorescence”. 2005
15 CEN “EN 14625:2005 Ambient air quality – standard method for the measurement of the
concentration of ozone by ultraviolet photometry”. 2005
16 CEN “EN 14626:2005 Ambient air quality - Standard method for the measurement of the
concentration of carbon monoxide by non dispersive infra red spectroscopy”. 2005
17 CEN “EN 12341:1999 Air quality. Determination of the PM10 fraction of suspended particulate
matter. Reference method and field test procedure to demonstrate reference equivalence of
measurement methods”. 1999
18 CEN “EN 14907:2005 Ambient air quality - Standard gravimetric measurement method for the
determination of the PM2.5 mass fraction of suspended particulate matter”. 2005
19 CEN “EN 14662-3:2005 Ambient air quality - Standard method for measurement of
benzene concentrations – Part 3. Automated pumped sampling with in situ gas
chromatography”. 2005.
20 CEN “EN 14902:2005 Ambient air quality - Standard method for the measurement of Pb, Cd, As,
and Ni in the PM 10 fraction of suspended particulate matter”. 2005.
21 CEN “EN 15853:2010 Ambient air quality - Standard method for the determination of mercury
deposition”. 2010.
22 CEN “EN 15841:2009 Ambient air quality - Standard method for determination of arsenic,
cadmium, lead and nickel in atmospheric deposition”. 2009.
23 D Harrison (2006) “UK Equivalence Programme for Monitoring of Particulate Matter”. Bureau Veritas Report Number: BV/AQ/AD202209/DH/2396 [online]. Available at http://www.airquality.co.uk/reports/cat05/0606130952_UKPMEquivalence.pdf. (Accessed 20 Sep 2013). 24 EC Working Group on Guidance for the Demonstration of Equivalence (2010) “Guide to the Demonstration of Equivalence of Ambient Air Monitoring Methods” [online]. Available at

98
http://ec.europa.eu/environment/air/quality/legislation/pdf/equivalence.pdf. (Accessed 20 Sep 2013). 25 Bureau Veritas (2010) “Assessment of UK AURN Particulate Matter Monitoring Equipment Against the January 2010 Guide to Demonstration of Equivalence”. Report reference number AGG04003328/BV/AQ/DH/2658/V3 produced on behalf of Defra. Available at http://uk-air.defra.gov.uk/reports/cat14/1101140842_Assessment_of_UK_AURN_PM_Equipment_against_2010_GDE.pdf . (Accessed 20 Sep 2013).
26 AEA Technology plc 2011. QA/QC Data Ratification Report for the Automatic Urban and Rural
Network, October-December 2011, and Annual Report 2011. Report produced for the Department
for Environment, Food and Rural Affairs, Scottish Government, Welsh Government and the DoE in
Northern Ireland. [online]. Available at http://uk-
air.defra.gov.uk/reports/cat05/1207040912_AURN_2011_Q4_Issue_1.pdf. (Accessed 20 Sep
2013).
27 CEN “EN 14662-1:2005 Ambient air quality - Standard method for measurement of benzene
concentrations - Part 1: Pumped sampling followed by thermal desorption and gas
chromatography”. 2005
28 AEA Technology plc 2012. UK Hydrocarbon Network: Annual Report for 2011. Report to Defra
and the Devolved Administrations. [online]. Available at http://uk-
air.defra.gov.uk/reports/cat13/1212101137_Hydrocarbon_Network_2011_FINAL.pdf . (Accessed
20 Sep 2013).
29 CEN “EN 15852:2010 Ambient air quality - Standard method for the determination of total
gaseous mercury”. 2010.
30 ISO “ISO/IEC 17025:2005 General requirements for the competence of testing and calibration
laboratories”. 2005.
31 National Physical Laboratory 2011. Annual Report for 2011 on the UK Heavy Metals Monitoring
Network. Report to Defra, the Welsh Government, the Department of the Environment in Northern
Ireland and the Scottish Government. [online]. Available at http://uk-
air.defra.gov.uk/reports/cat13/1206131002_Defra_UK_Heavy_Metals_Network_Annual_R
eport_2011_FINAL.pdf (Accessed 20 Sep 2013).
32 CEN “BS EN ISO 14644-1:1999 Cleanrooms and associated controlled environments.
Classification of air cleanliness”. 1999.
33 EMEP/CCC (1995) Manual for sampling and chemical analysis. Kjeller, Norwegian Institute for Air Research (EMEP/CCC Report 1/95) (Last rev. 2002)
34 CEN “EN 15980:2011 Air quality. Determination of the deposition of benz[a]anthracene,
benzo[b]fluoranthene, benzo[j]fluoranthene, benzo[k]fluoranthene, benzo[a]pyrene,
dibenz[a,h]anthracene and indeno[1,2,3-cd]pyrene”. 2011.

99
35 CEN “EN 15549:2008 Air quality. Standard method for the measurement of the concentration of
benzo(a)pyrene in ambient air”. 2008.
36 National Physical Laboratory 2011. Annual Report for 2011 on the UK PAH Monitoring and
Analysis Network. Report to Defra; the Department of Environment Northern Ireland; the Welsh
Government and the Scottish Government. [online]. Available at http://uk-
air.defra.gov.uk/reports/cat05/1301021058_NPL_Report_AS_71-
Defra_PAH_Network_2011_annual_report.pdf . (Accessed 20 Sep 2013).
37 CEN “CEN/TR 16243:2011 Ambient air quality - Guide for the measurement of elemental carbon
(EC) and organic carbon (OC) deposited on filters”. 2011.
38 ISO/IEC 17065:2012 “Conformity Assessment – Requirements for bodies certifying products,
processes and services”. 2012.
39 Brown, R.J.C., Kumar, Y., Brown, A.S., Dexter, M.A. and Corns, W.T. 2012. “Field comparison of
manual and semi-automatic methods for the measurement of total gaseous mercury in ambient air
and assessment of equivalence”. J. Environ. Monit., 14, 657-665.
40 National Air Quality Reference Laboratories and the European Network - AQUILA 2009. Roles
and Requirements for Measurement Traceability, Accreditation, Quality Assurance/Quality Control,
and Measurement Comparisons, at National and European Levels. Version 2. [online]. Available
at: http://ies.jrc.ec.europa.eu/uploads/aquila/aquila%20roles%20and%20requirements.pdf
(Accessed 20 Sep 2013).
41 R. Maggs, D. Harrison, D Carslaw and K Stevenson (2009) “Analysis of Trends in Gravimetric Particulate Mass Measurements in the United Kingdom". Available at: http://uk-air.defra.gov.uk/reports/cat09/0901221659_Trends_in_Gravimetric_PM_Measurements_in_the_UK_v210109.pdf (Accessed 13 Sep 2013).
42 R. Ebinghaus, S. G. Jennings, W. H. Schroeder, T. Berg, T. Donaghy, J. Guentzel, C. Kenny, H.
H. Kock, K. Kvietkus, W. Landing, T. Muhleck, J. Munthe, E. M. Prestbo, D. Schneeberger, F.
Slemr, J. Sommar, A. Urba, D. Wallschlager and Z. Xiao, Atmospheric Environment, 1999, 33,
3063-3073.
43 W. H. Schroeder, G. Keeler, H. Kock, P. Roussel, D. Schneeberger and F. Schaedlich, Water Air
and Soil Pollution, 1995, 80, 611-620.
44 Working Group 1 of the Joint Committee for Guides in Metrology (JCGM/WG 1) 2008. Evaluation
of measurement data — Guide to the expression of uncertainty in measurement. JCGM 100:2008.
[online]. Available at
http://www.bipm.org/utils/common/documents/jcgm/JCGM_100_2008_E.pdf (Accessed 13
Sep 2013).
45 CEN “ISO 11222:2002 Air quality -- Determination of the uncertainty of the time average of air
quality measurements”. 2002.

100


![Painting Contractor QA/QC Plan Sample - First Time Quality · 2017-10-07 · Pat [Pick the date] Painting Contractor QA/QC Plan Sample Specific Quality Plan Quality Manual Painting](https://static.fdocuments.in/doc/165x107/5b3303dc7f8b9aa0238cb7ba/painting-contractor-qaqc-plan-sample-first-time-2017-10-07-pat-pick.jpg)


![Painting Contractor QA/QC Plan Sample - … · Pat [Pick the date] Painting Contractor QA/QC Plan Sample Specific Quality Plan Quality Manual Painting Standards & Inspection Forms](https://static.fdocuments.in/doc/165x107/5b66f72f7f8b9a2a5c8d9661/painting-contractor-qaqc-plan-sample-pat-pick-the-date-painting-contractor.jpg)