Quality assessment of IDS contribution to ITRF2014 ... · Bloßfeld M., Seitz M., Angermann D.,...
16
Originally published as: Bloßfeld M., Seitz M., Angermann D., Moreaux G. (2016) Quality assessment of IDS contribution to ITRF2014 performed by DGFI-TUM. Advances in Space Research, published online DOI: 10.1016.j.asr.2015.12.016 Accepted by Advances in Space Research after review process.
Transcript of Quality assessment of IDS contribution to ITRF2014 ... · Bloßfeld M., Seitz M., Angermann D.,...
Originally published as:
Bloßfeld M., Seitz M., Angermann D., Moreaux G. (2016) Quality assessment of IDS
contribution to ITRF2014 performed by DGFI-TUM. Advances in Space Research,
published online
DOI: 10.1016.j.asr.2015.12.016
Accepted by Advances in Space Research after review process.

Quality assessment of IDS contribution to ITRF2014 performed by DGFI-TUM
Mathis Bloßfelda,∗, Manuela Seitza, Detlef Angermanna, Guilhem Moreauxb
aDeutsches Geodatisches Forschungsinstitut der Technischen Universitat Munchen (DGFI-TUM)Arcisstraße 21, 80333 Munich, Germany
bCollecte Localisation Satellites, 8-10 rue Hermes, Parc technologique du Canal, 31520 Ramonville Saint-Agne, France
Abstract
The International DORIS Service (IDS) submitted input data for the most recent realization of the International Ter-restrial Reference System (ITRS), the International Terrestrial Reference Frame 2014 (ITRF2014). As one of the ITRSCombination Centers, DGFI-TUM is in charge to analyze and assess the quality of the submitted data and to computea combined global TRF solution (called DTRF2014) using observations of the four geodetic space techniques GNSS,VLBI, SLR and DORIS. The combination methodology used at DGFI-TUM is based on the combination of datum-freenormal equations. Together with station coordinates and velocities, terrestrial pole coordinates are estimated in onecommon adjustment. The paper presents the analysis results of the most recent DORIS submission IDS-d09 and eval-uates its quality w.r.t. the DTRF2008 (IDS-only) solution. In the most recent version of the analysis, we introduce intotal 56 station discontinuities and reduce 15 stations due to a too short time span or too few observations. Time seriesof weekly IDS solutions are computed and validated w.r.t. DTRF2008. The transformation parameter time series andthe station residuals are discussed in detail. Especially the scale parameter time series shows a significant improvementcompared to the DTRF2008 input data. The scatter of the x- and y-translation is significantly reduced to 5.7 mm and7.1 mm compared to 6.6 mm and 8.1 mm for the DTRF2008 (IDS-only) solution. The z-translation time series stillshows a high correlation with solar activity. 10 % of all station residuals are significantly affected by spectral peaksat draconitic period harmonics of the altimetry satellites Jason and TOPEX/Poseidon and up to 48 % of all stationresidual time series contain significantly determined frequencies with a 14 day period. The multi-year IDS solution isvalidated w.r.t. DTRF2008 and the consistently estimated terrestrial pole coordinates are analyzed and compared toIERS 08 C04. The x-pole spectra comprises prominent peaks at various draconitic frequencies.
Keywords: IDS, DORIS, ITRF2014, DTRF2014, Terrestrial Reference Frame, Polar Motion
1. Introduction
The official realization of the International Terrestrial Ref-erence System (ITRS) is computed every three to fiveyears. The computation of the International TerrestrialReference Frame 2014 (ITRF2014) is based on the combi-nation of observations of the four geodetic space techniquesGlobal Navigation Satellite Systems (GNSS), Very LongBaseline Interferometry (VLBI), Satellite Laser Ranging(SLR) and Doppler Orbitography and RadiopositioningIntegrated by Satellite (DORIS). As one of three ITRSCombination Centers of the International Earth Rota-tion and Reference Systems Service (IERS), DGFI-TUMis computing an ITRS realization through combination ofthe four techniques at the normal equation level of theGauß-Markov model (Seitz et al., 2012; Bloßfeld, 2015).This realization is called DGFI-TUM Terrestrial ReferenceFrame 2014 (DTRF2014).The analysis results presented in this paper are achievedin the framework of the DTRF2014 computation and are
∗Corresponding authorEmail address: [email protected] (Mathis Bloßfeld)
validated w.r.t the previous realization of the DTRF, theDTRF2008 (Seitz et al., 2012). All DTRF realizationsare based on the same input data provided for the officialITRF solutions.Compared to the input data of the International DORISService (IDS; Willis et al., 2010) for the DTRF2008 so-lution (Altamimi and Collilieux, 2010; Angermann et al.,2010; Valette et al., 2010; Seitz et al., 2012), several im-provements of the IDS data concerning the space andground infrastructure and the a priori modeling have beenachieved. For a detailed discussion of the improvements,please see Willis et al. (2015); Moreaux et al. (2016). Here-after, only the most important improvements concerningthe infrastructure and the modeling of measurements andsatellite perturbations are briefly discussed.The space segment improved significantly due to thelaunch of four new DORIS-tracked satellites, namelyJason-2, CryoSat-2, HY-2A and SARAL (Satellite withARgos and ALtika). In the same period, the DORIS track-ing of three old satellites called SPOT-2 (Satellite PourlObservation de la Terre), SPOT-4 and Envisat (Environ-mental satellite) was stopped. The new satellites carry
Preprint submitted to Advances in Space Research January 11, 2016

new generation receivers, so called DGXX receivers, on-board which allow to track up to seven beacon signalsin parallel. The ground station network also improved.Compared to DTRF2008, four new beacons have beeninstalled at Cold Bay (USA), Grasse (France), Betio Is-land (Kiribati) and Rikitea (French Polynesia) and theglobal station distribution was further homogenized (interms of global distribution, beacon models and antennabase types; Moreaux et al., 2016). Besides the improve-ment of the infrastructure, also the modeling of the DORISmeasurements and force model effects was improved. TheDORIS measurements now take into account (a) beaconfrequency variations, (b) phase law and (c) South AtlanticAnomaly (SAA) effects on Jason-1 and SPOT-5 (Stepaneket al., 2014). In addition to the improved measurementmodeling, time variable gravity fields (e.g., EIGEN-6S2,Rudenko et al., 2014) are now used in the analysis. Theimprovement of the non-conservative force models for so-lar radiation pressure and air drag have to be handledwith care since various DORIS Analysis Centers (ACs) as-sert that they have improved the satellite non-conservativeforce modeling in different ways (e.g., Soudarin et al., 2016;Lemoine et al., 2016). This fact might lead to incon-sistencies in the DORIS-only combination. Furthermore,tracking data of SPOT-4 and Envisat have been corrected(Moreaux et al., 2016).The first part of this paper deals with the analysis ofthe submitted IDS SINEX (Solution INdependent EX-change format) files and quantities such as the recon-structed squared sum of the residuals and the individualweighting of the AC solutions are validated. SINEX filescontain values of estimated parameters (usually stationpositions and velocities or Earth Orientation Parameters)as well as the full covariance matrix associated with theseparameters. In addition, changes of the satellite constella-tion and ground station distribution are described. Sect. 3presents a brief description of the TRF computation ap-proach at normal equation level used at DGFI-TUM. Theexplained algorithm is then used to compute weekly andmulti-year IDS-only Terrestrial Reference Frames (TRFs).Furthermore, it is used to compile a list of the introduceddiscontinuities and reduced stations. Sect. 4 provides somemajor results of the DORIS data analysis and includes alsoa quality assessment of the computed weekly IDS solutionsand the multi-year IDS solution. Finally, Sect. 5 summa-rizes the presented results and gives an outlook.
2. DORIS data / IDS submissions
IDS SINEX files
The Combination Center (CC) of the International DORISService (IDS) made available in total 1141 weekly SINEXfiles which cover a conventional time span between03.01.1993 and 28.12.2014 to the IERS Data Center (DC).The submitted data were obtained by combining solutionsof up to six different IDS-ACs, namely ESA (Germany),
GOP (Czech Republic), GSC (USA), IGN (France), INA(Russia) and LCA/GRG (France). The IDS-ACs use fivedifferent software packages and therefore lower the possi-bility of systematic software-dependent errors in the com-bined IDS solution. Only 6 weekly SINEX files were miss-ing due to (a) only a few ACs available during the weeks,(b) due to bad data quality and (c) due to poor positionquality (Moreaux et al., 2016). All SINEX files containweekly 3-dimensional station coordinate solutions at mid-week epochs with consistently estimated daily terrestrialpole coordinates at noon epochs which are slightly stabi-lized by minimum constraints. Due to the fact that solu-tions are stored in the SINEX files and no a priori coordi-nates are given, the estimated coordinates are assumed tobe equal to the respective a priori coordinates. The timeinterval beginning at 1993.0 was chosen by the IDS sinceduring this time period, at least two satellites are trackedsimultaneously and the DORIS station network was com-pleted in August 1992 (Moreaux et al., 2016).The statistical information stored in the IDS SINEX filescontain the number of observations n, the number of un-knowns u, the redundancy (degree of freedom) r and thea posteriori matrix scaling factor σ2
0 . Since the stochasticmodel for the combination at normal equation level needsthe squared sum of the observed minus computed valueslTPl and residuals vT
P v for each individual matrix, theyare reconstructed using the following equation:
lTPl = v
TP v = r · σ
20 (1)
with the vector of observed minus computed with a priorivalues l, the vector of residuals v and the weight matrixof the observations P . A prerequisite for this construc-tion of the stochastic model is the fact that the estimatedparameters are equal to the a priori values. Fig. 1 showsthe weekly v
TP v values reconstructed using Eq. 1 for the
most recent IDS submission (d09). Systematic changesin the v
TP v time series are mainly caused by changes
in the satellite constellation. Especially, since GPS week1798 (June 22nd, 2014), the small vT
P v values might becaused by the inclusion of the SARAL satellite. This facthas to be further investigated.
Figure 1: Reconstructed weekly squared sums of residuals vTP v for
the IDS submission d09 between GPS week 678 (1993.0) and 1824(2015.0).
2
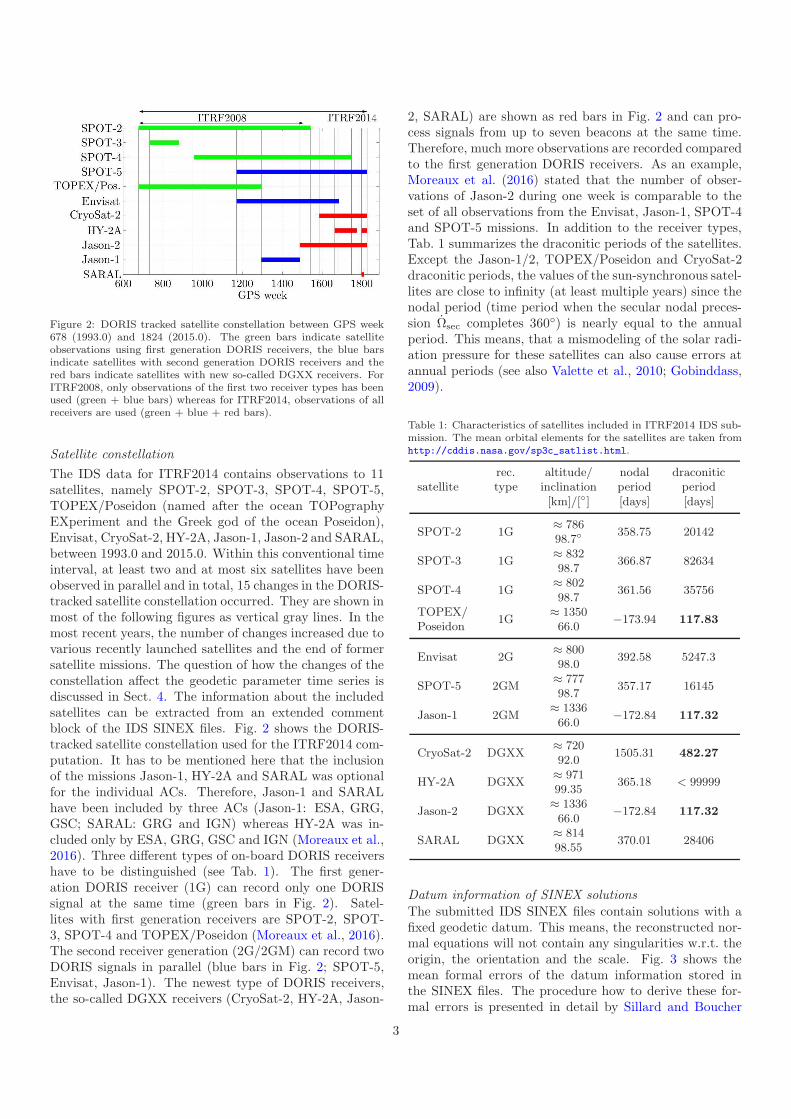
Figure 2: DORIS tracked satellite constellation between GPS week678 (1993.0) and 1824 (2015.0). The green bars indicate satelliteobservations using first generation DORIS receivers, the blue barsindicate satellites with second generation DORIS receivers and thered bars indicate satellites with new so-called DGXX receivers. ForITRF2008, only observations of the first two receiver types has beenused (green + blue bars) whereas for ITRF2014, observations of allreceivers are used (green + blue + red bars).
Satellite constellation
The IDS data for ITRF2014 contains observations to 11satellites, namely SPOT-2, SPOT-3, SPOT-4, SPOT-5,TOPEX/Poseidon (named after the ocean TOPographyEXperiment and the Greek god of the ocean Poseidon),Envisat, CryoSat-2, HY-2A, Jason-1, Jason-2 and SARAL,between 1993.0 and 2015.0. Within this conventional timeinterval, at least two and at most six satellites have beenobserved in parallel and in total, 15 changes in the DORIS-tracked satellite constellation occurred. They are shown inmost of the following figures as vertical gray lines. In themost recent years, the number of changes increased due tovarious recently launched satellites and the end of formersatellite missions. The question of how the changes of theconstellation affect the geodetic parameter time series isdiscussed in Sect. 4. The information about the includedsatellites can be extracted from an extended commentblock of the IDS SINEX files. Fig. 2 shows the DORIS-tracked satellite constellation used for the ITRF2014 com-putation. It has to be mentioned here that the inclusionof the missions Jason-1, HY-2A and SARAL was optionalfor the individual ACs. Therefore, Jason-1 and SARALhave been included by three ACs (Jason-1: ESA, GRG,GSC; SARAL: GRG and IGN) whereas HY-2A was in-cluded only by ESA, GRG, GSC and IGN (Moreaux et al.,2016). Three different types of on-board DORIS receivershave to be distinguished (see Tab. 1). The first gener-ation DORIS receiver (1G) can record only one DORISsignal at the same time (green bars in Fig. 2). Satel-lites with first generation receivers are SPOT-2, SPOT-3, SPOT-4 and TOPEX/Poseidon (Moreaux et al., 2016).The second receiver generation (2G/2GM) can record twoDORIS signals in parallel (blue bars in Fig. 2; SPOT-5,Envisat, Jason-1). The newest type of DORIS receivers,the so-called DGXX receivers (CryoSat-2, HY-2A, Jason-
2, SARAL) are shown as red bars in Fig. 2 and can pro-cess signals from up to seven beacons at the same time.Therefore, much more observations are recorded comparedto the first generation DORIS receivers. As an example,Moreaux et al. (2016) stated that the number of obser-vations of Jason-2 during one week is comparable to theset of all observations from the Envisat, Jason-1, SPOT-4and SPOT-5 missions. In addition to the receiver types,Tab. 1 summarizes the draconitic periods of the satellites.Except the Jason-1/2, TOPEX/Poseidon and CryoSat-2draconitic periods, the values of the sun-synchronous satel-lites are close to infinity (at least multiple years) since thenodal period (time period when the secular nodal preces-sion Ωsec completes 360) is nearly equal to the annualperiod. This means, that a mismodeling of the solar radi-ation pressure for these satellites can also cause errors atannual periods (see also Valette et al., 2010; Gobinddass,2009).
Table 1: Characteristics of satellites included in ITRF2014 IDS sub-mission. The mean orbital elements for the satellites are taken fromhttp://cddis.nasa.gov/sp3c_satlist.html.
satelliterec. altitude/ nodal draconitictype inclination period period
[km]/[] [days] [days]
SPOT-2 1G≈ 786
358.75 2014298.7
SPOT-3 1G≈ 832
366.87 8263498.7
SPOT-4 1G≈ 802
361.56 3575698.7
TOPEX/1G
≈ 1350−173.94 117.83
Poseidon 66.0
Envisat 2G≈ 800
392.58 5247.398.0
SPOT-5 2GM≈ 777
357.17 1614598.7
Jason-1 2GM≈ 1336
−172.84 117.3266.0
CryoSat-2 DGXX≈ 720
1505.31 482.2792.0
HY-2A DGXX≈ 971
365.18 < 9999999.35
Jason-2 DGXX≈ 1336
−172.84 117.3266.0
SARAL DGXX≈ 814
370.01 2840698.55
Datum information of SINEX solutions
The submitted IDS SINEX files contain solutions with afixed geodetic datum. This means, the reconstructed nor-mal equations will not contain any singularities w.r.t. theorigin, the orientation and the scale. Fig. 3 shows themean formal errors of the datum information stored inthe SINEX files. The procedure how to derive these for-mal errors is presented in detail by Sillard and Boucher
3
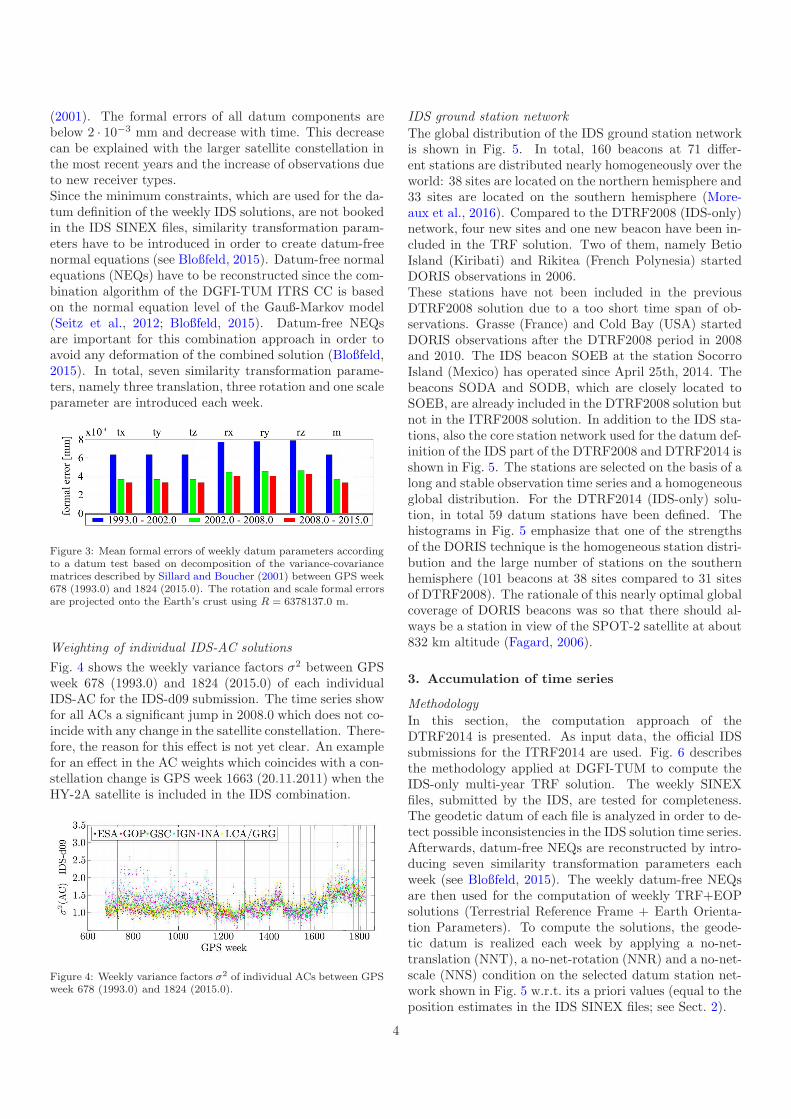
(2001). The formal errors of all datum components arebelow 2 · 10−3 mm and decrease with time. This decreasecan be explained with the larger satellite constellation inthe most recent years and the increase of observations dueto new receiver types.Since the minimum constraints, which are used for the da-tum definition of the weekly IDS solutions, are not bookedin the IDS SINEX files, similarity transformation param-eters have to be introduced in order to create datum-freenormal equations (see Bloßfeld, 2015). Datum-free normalequations (NEQs) have to be reconstructed since the com-bination algorithm of the DGFI-TUM ITRS CC is basedon the normal equation level of the Gauß-Markov model(Seitz et al., 2012; Bloßfeld, 2015). Datum-free NEQsare important for this combination approach in order toavoid any deformation of the combined solution (Bloßfeld,2015). In total, seven similarity transformation parame-ters, namely three translation, three rotation and one scaleparameter are introduced each week.
Figure 3: Mean formal errors of weekly datum parameters accordingto a datum test based on decomposition of the variance-covariancematrices described by Sillard and Boucher (2001) between GPS week678 (1993.0) and 1824 (2015.0). The rotation and scale formal errorsare projected onto the Earth’s crust using R = 6378137.0 m.
Weighting of individual IDS-AC solutions
Fig. 4 shows the weekly variance factors σ2 between GPSweek 678 (1993.0) and 1824 (2015.0) of each individualIDS-AC for the IDS-d09 submission. The time series showfor all ACs a significant jump in 2008.0 which does not co-incide with any change in the satellite constellation. There-fore, the reason for this effect is not yet clear. An examplefor an effect in the AC weights which coincides with a con-stellation change is GPS week 1663 (20.11.2011) when theHY-2A satellite is included in the IDS combination.
Figure 4: Weekly variance factors σ2 of individual ACs between GPSweek 678 (1993.0) and 1824 (2015.0).
IDS ground station network
The global distribution of the IDS ground station networkis shown in Fig. 5. In total, 160 beacons at 71 differ-ent stations are distributed nearly homogeneously over theworld: 38 sites are located on the northern hemisphere and33 sites are located on the southern hemisphere (More-aux et al., 2016). Compared to the DTRF2008 (IDS-only)network, four new sites and one new beacon have been in-cluded in the TRF solution. Two of them, namely BetioIsland (Kiribati) and Rikitea (French Polynesia) startedDORIS observations in 2006.These stations have not been included in the previousDTRF2008 solution due to a too short time span of ob-servations. Grasse (France) and Cold Bay (USA) startedDORIS observations after the DTRF2008 period in 2008and 2010. The IDS beacon SOEB at the station SocorroIsland (Mexico) has operated since April 25th, 2014. Thebeacons SODA and SODB, which are closely located toSOEB, are already included in the DTRF2008 solution butnot in the ITRF2008 solution. In addition to the IDS sta-tions, also the core station network used for the datum def-inition of the IDS part of the DTRF2008 and DTRF2014 isshown in Fig. 5. The stations are selected on the basis of along and stable observation time series and a homogeneousglobal distribution. For the DTRF2014 (IDS-only) solu-tion, in total 59 datum stations have been defined. Thehistograms in Fig. 5 emphasize that one of the strengthsof the DORIS technique is the homogeneous station distri-bution and the large number of stations on the southernhemisphere (101 beacons at 38 sites compared to 31 sitesof DTRF2008). The rationale of this nearly optimal globalcoverage of DORIS beacons was so that there should al-ways be a station in view of the SPOT-2 satellite at about832 km altitude (Fagard, 2006).
3. Accumulation of time series
Methodology
In this section, the computation approach of theDTRF2014 is presented. As input data, the official IDSsubmissions for the ITRF2014 are used. Fig. 6 describesthe methodology applied at DGFI-TUM to compute theIDS-only multi-year TRF solution. The weekly SINEXfiles, submitted by the IDS, are tested for completeness.The geodetic datum of each file is analyzed in order to de-tect possible inconsistencies in the IDS solution time series.Afterwards, datum-free NEQs are reconstructed by intro-ducing seven similarity transformation parameters eachweek (see Bloßfeld, 2015). The weekly datum-free NEQsare then used for the computation of weekly TRF+EOPsolutions (Terrestrial Reference Frame + Earth Orienta-tion Parameters). To compute the solutions, the geode-tic datum is realized each week by applying a no-net-translation (NNT), a no-net-rotation (NNR) and a no-net-scale (NNS) condition on the selected datum station net-work shown in Fig. 5 w.r.t. its a priori values (equal to theposition estimates in the IDS SINEX files; see Sect. 2).
4

Figure 5: DORIS beacon ground network of IDS contribution of DTRF2008 (red triangles) and DTRF2014 (blue + red triangles). The datumstations of the IDS-only multi-year solution of the DTRF2008 and DTRF2014 are shown as red and blue circles, respectively. In addition, thehistograms of the DTRF2014 beacons (blue bars) and of the DTRF2014 (IDS-only) datum beacons (yellow bars) located at DORIS stations(blue + red triangles) w.r.t. latitude and longitude are shown.
Figure 6: Schematic view of accumulation methodology applied atDGFI-TUM.
The selection of datum station is based on the stability andlength of station time series and, in addition, on the globaldistribution. The time series of TRF+EOP solutions areused to detect coordinate outliers (3 − σ criteria for sta-tion residuals) and discontinuities in the station coordinatetime series. Therefore, each station position time series isanalyzed for significant offsets or drift changes in any com-ponent. In some cases, no reason for the offset/drift changecan be found (see top-right column in Tab. 2). Afterwards,the outliers are reduced and the discontinuities are appliedto the weekly datum-free NEQs. The application of thediscontinuities is realized in such a way that a new set ofcoordinates (and velocities) is estimated and the solutionnumber of the corresponding station is increased (see col-umn 4 in Tab. 2). The station motion is parametrizedthrough linear velocities. Non-linear post-seismic relax-ation motions for stations such as Arequipa, Santiago andFairbanks (stations which might be most affected by recentbig earthquakes) are approximated by a piece-wise linearstation motion model. The modified NEQs are accumu-lated and common parameters like station coordinates andvelocities are stacked. The result is a datum-free long-termNEQ. After the geodetic datum is realized (by applyingNNT, NNR and NNS conditions on the datum station co-ordinates and velocities w.r.t. DTRF2008), the IDS-onlymulti-year reference frame is computed by inverting theaccumulated and constrained NEQ. This solution containsstation coordinates and velocities as well as daily offsets
5

Table 2: 56 introduced station coordinate discontinuities of the DTRF2014 IDS-only solution.
IDS nameDOMES discontinuity new solution
descriptionnumber epoch [yy:ddd] number
ADEA 91501S001 98:084 0A02 Earthquake Mw 8.1ADGB 61501S004 14:161 0A02 Beacon changeASDB 30602S004 05:014 0A02 Unknown reasonASDB 30602S004 07:171 0A03 Unknown reasonCADB 41609S002 08:183 0A02 Beacon changeCADB 41609S002 11:355 0A03 Unknown reasonCHAB 50207S001 06:340 0A02 Antenna phase biasCICB 23101S002 06:049 0A02 Drift change in HCOLA 23501S001 94:320 0A02 EarthquakeEASB 41703S009 08:196 0A02 Discontinuity in NEASB 41703S009 11:186 0A03 Beacon changeEASB 41703S009 12:340 0A04 sign. jump in NEVEB 21501S001 02:075 0A02 Unknown reasonEVEB 21501S001 11:261 0A03 EarthquakeFAIB 40408S005 02:307 0A02 EarthquakeFAIB 40408S005 03:033 0A03 Post seismicFAIB 40408S005 03:215 0A04 Post seismicFAIB 40408S005 06:001 0A05 Post seismicGOMB 40405S037 04:143 0A02 Unknown reasonGREB 40451S176 06:025 0A02 Unknown reasonHELB 30606S003 00:035 0A02 Antenna tiltHEMB 30606S004 08:209 0A02 EarthquakeKESB 91201S004 04:036 0A02 Unknown reasonKRUB 97301S004 97:001 0A02 DiscontinuityKRUB 97301S004 05:117 0A03 DiscontinuityLICB 32809S004 08:215 0A02 Unknown reasonMAHB 39801S005 09:089 0A02 Beacon changeMANB 22006S002 12:168 0A02 EarthquakeMARB 30313S002 02:167 0A02 EarthquakeMATB 30313S003 06:311 0A02 Antenna offsetPDMB 31906S002 08:160 0A02 USO changeREUB 97401S002 08:210 0A02 Unknown reasonREYB 10202S002 00:169 0A02 EarthquakeREZB 10202S003 05:073 0A02 Discontinuity E/NREZB 10202S003 08:157 0A03 Unknown reasonREZB 10202S003 12:136 0A04 Beacon changeRIPB 41507S005 05:154 0A02 Unknown reasonROTA 66007S001 02:013 0A02 Unknown reasonSAKA 12329S001 94:282 0A02 EarthquakeSAKA 12329S001 98:360 0A03 Unknown reasonSALB 39601S002 08:117 0A02 Jump in NSANB 41705S009 05:327 0A02 EarthquakeSANB 41705S009 08:197 0A03 Unknown reasonSANB 41705S009 10:058 0A04 Chile EarthquakeSANB 41705S009 11:045 0A05 EarthquakeSODA 40503S003 -95:360 0A02 Volcanic activitySODA 40503S003 97:149 0A03 Volcanic activitySODB 40503S004 02:276 0A02 Unknown reasonSPJB 10317S005 04:347 0A02 after data gapSTJB 40101S002 02:230 0A02 Unknown reasonSYPB 66006S003 08:194 0A02 Unknown reasonSYPB 66006S003 12:193 0A03 Unknown reasonTHUB 43001S005 06:127 0A02 Unknown reasonTLSB 10003S005 12:301 0A02 Unknown reasonTRIA 30604S001 99:198 0A02 Unknown reasonTRIB 30604S002 04:228 0A02 Unknown reason
6
of terrestrial pole coordinates. The estimation of weeklyTRF solutions, the detection of discontinuities and out-liers and the computation of the IDS multi-year solutionare iteratively done (see red arrows in Fig. 6) in order tokeep the number of outliers and discontinuities as small aspossible.
Station discontinuities
All introduced station discontinuities are summarized inTab. 2. In total, 56 discontinuities have been defined (com-pared to 48 in DTRF2008; Seitz et al., 2012) which wereiteratively determined together with the IDS CC. Thismeans, that the weekly IDS-only solutions contain coor-dinates of 160+56 = 216 coordinate and velocitiy sets for160 beacons. For most of the discontinuities, explicit rea-sons for an abrupt motion or change of the long-term driftcould be found. Nevertheless, some discontinuities can stillnot be explained by geophysical or technical reasons. Theselection and introduction of the discontinuities is, to a cer-tain extent, analyst-dependent. Therefore, a special effortmust be made to ensure that all ITRS CCs develop anduse the same unique list of discontinuities. This harmo-nization is currently still missing which means that Tab. 2might change after the publication of this manuscript.
Reduced stations
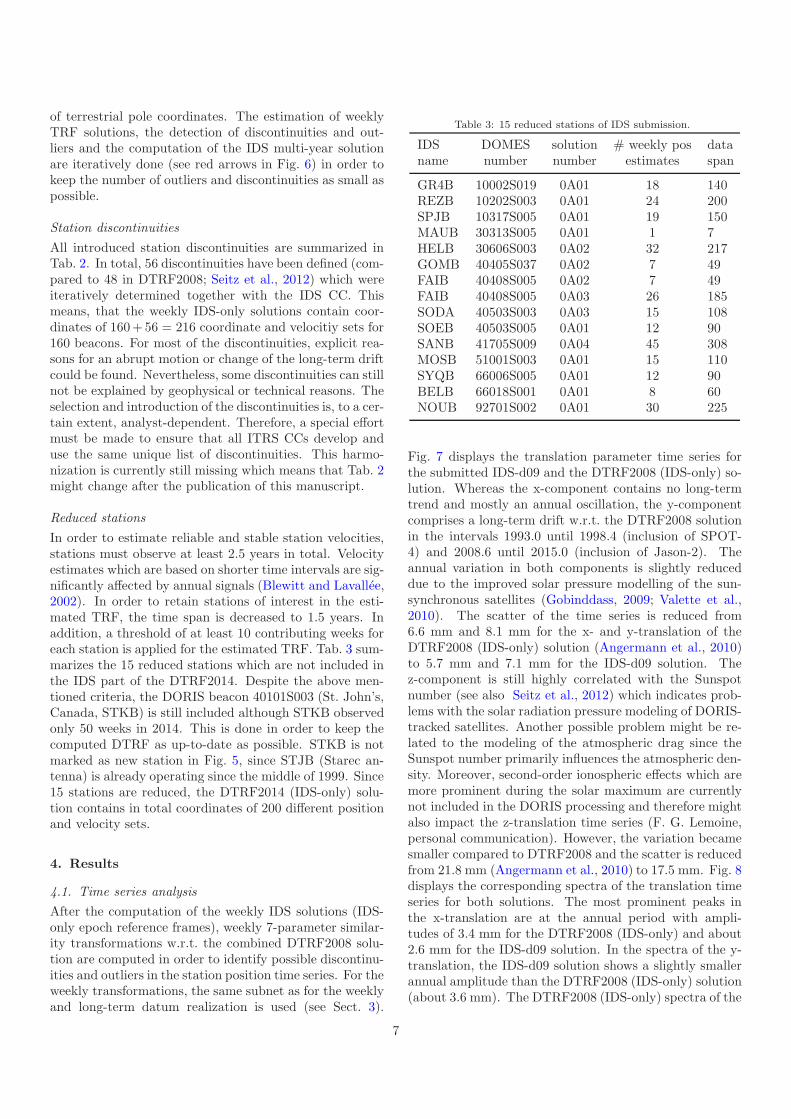
In order to estimate reliable and stable station velocities,stations must observe at least 2.5 years in total. Velocityestimates which are based on shorter time intervals are sig-nificantly affected by annual signals (Blewitt and Lavallee,2002). In order to retain stations of interest in the esti-mated TRF, the time span is decreased to 1.5 years. Inaddition, a threshold of at least 10 contributing weeks foreach station is applied for the estimated TRF. Tab. 3 sum-marizes the 15 reduced stations which are not included inthe IDS part of the DTRF2014. Despite the above men-tioned criteria, the DORIS beacon 40101S003 (St. John’s,Canada, STKB) is still included although STKB observedonly 50 weeks in 2014. This is done in order to keep thecomputed DTRF as up-to-date as possible. STKB is notmarked as new station in Fig. 5, since STJB (Starec an-tenna) is already operating since the middle of 1999. Since15 stations are reduced, the DTRF2014 (IDS-only) solu-tion contains in total coordinates of 200 different positionand velocity sets.
4. Results
4.1. Time series analysis
After the computation of the weekly IDS solutions (IDS-only epoch reference frames), weekly 7-parameter similar-ity transformations w.r.t. the combined DTRF2008 solu-tion are computed in order to identify possible discontinu-ities and outliers in the station position time series. For theweekly transformations, the same subnet as for the weeklyand long-term datum realization is used (see Sect. 3).
Table 3: 15 reduced stations of IDS submission.
IDS DOMES solution # weekly pos dataname number number estimates span
GR4B 10002S019 0A01 18 140REZB 10202S003 0A01 24 200SPJB 10317S005 0A01 19 150MAUB 30313S005 0A01 1 7HELB 30606S003 0A02 32 217GOMB 40405S037 0A02 7 49FAIB 40408S005 0A02 7 49FAIB 40408S005 0A03 26 185SODA 40503S003 0A03 15 108SOEB 40503S005 0A01 12 90SANB 41705S009 0A04 45 308MOSB 51001S003 0A01 15 110SYQB 66006S005 0A01 12 90BELB 66018S001 0A01 8 60NOUB 92701S002 0A01 30 225
Fig. 7 displays the translation parameter time series forthe submitted IDS-d09 and the DTRF2008 (IDS-only) so-lution. Whereas the x-component contains no long-termtrend and mostly an annual oscillation, the y-componentcomprises a long-term drift w.r.t. the DTRF2008 solutionin the intervals 1993.0 until 1998.4 (inclusion of SPOT-4) and 2008.6 until 2015.0 (inclusion of Jason-2). Theannual variation in both components is slightly reduceddue to the improved solar pressure modelling of the sun-synchronous satellites (Gobinddass, 2009; Valette et al.,2010). The scatter of the time series is reduced from6.6 mm and 8.1 mm for the x- and y-translation of theDTRF2008 (IDS-only) solution (Angermann et al., 2010)to 5.7 mm and 7.1 mm for the IDS-d09 solution. Thez-component is still highly correlated with the Sunspotnumber (see also Seitz et al., 2012) which indicates prob-lems with the solar radiation pressure modeling of DORIS-tracked satellites. Another possible problem might be re-lated to the modeling of the atmospheric drag since theSunspot number primarily influences the atmospheric den-sity. Moreover, second-order ionospheric effects which aremore prominent during the solar maximum are currentlynot included in the DORIS processing and therefore mightalso impact the z-translation time series (F. G. Lemoine,personal communication). However, the variation becamesmaller compared to DTRF2008 and the scatter is reducedfrom 21.8 mm (Angermann et al., 2010) to 17.5 mm. Fig. 8displays the corresponding spectra of the translation timeseries for both solutions. The most prominent peaks inthe x-translation are at the annual period with ampli-tudes of 3.4 mm for the DTRF2008 (IDS-only) and about2.6 mm for the IDS-d09 solution. In the spectra of the y-translation, the IDS-d09 solution shows a slightly smallerannual amplitude than the DTRF2008 (IDS-only) solution(about 3.6 mm). The DTRF2008 (IDS-only) spectra of the
7

Figure 7: Translation parameter time series in x-, y- and z-direction of weekly IDS-d09 and DTRF2008 (IDS-only) solutions w.r.t. DTRF2008(combined). In addition to the z-translation, also the Sunspot number (WDC-SILSO, 2015) is plotted.
z-translation shows a lobe and some side lobes near theannual period whereas the IDS-d09 solution contains noprominent peak or side lobes at the annual period. In caseof the translations, it can be clearly seen that the qualityof the IDS data is improved compared to the DTRF2008submission since also the scattering of the IDS-d09 timeseries is significantly reduced.
Figure 8: Spectra of the translation parameter time series shown inFig. 7.
The scale parameter time series and the correspondingspectra are displayed in Fig. 9 and 10. Due to the men-tioned improvements in the data analysis applied by theIDS (see Sect. 2 and Moreaux et al., 2016), the scalechanges significantly compared to the DTRF2008 (IDS-only) solution. The drift of the DTRF2008 (IDS-only)solution after 2000.0 (about −1.8 mm/yr) is nearly totallyremoved. Nevertheless, a drift and an offset after 2011.0still remain in the scale parameter time series. One pos-sible reason might be the inclusion of the HY-2A satellitesince November 2011. Moreaux et al. (2016) also expectthe inclusion of Jason-2, CryoSat-2 or HY-2A as a pos-sible reason for the scale increase. Between 1994.0 and1994.2, the scale parameter time series has a significantoffset which might be correlated with the exclusion of thethe ESA, IGN and INA solutions from the scale combina-tion. INA is excluded throughout the whole time series be-cause they did not apply phase center corrections whereasESA and IGN are excluded for about 8 weeks when thescale of SPOT-2 was anomalous in early 1994 (Moreauxet al., 2016). This issue needs further investigation. It isalso stated by Moreaux et al. (2016), that the ability ofall IDS-ACs to estimate beacon frequency offsets alreadystabilized the IDS scale. The spectra of the scale param-eter time series (Fig. 10) comprises significant peaks at14.7 days (only in the IDS-d09 submission) and 22.36 days(only in the DTRF2008 (IDS-only) solution). The signifi-
8
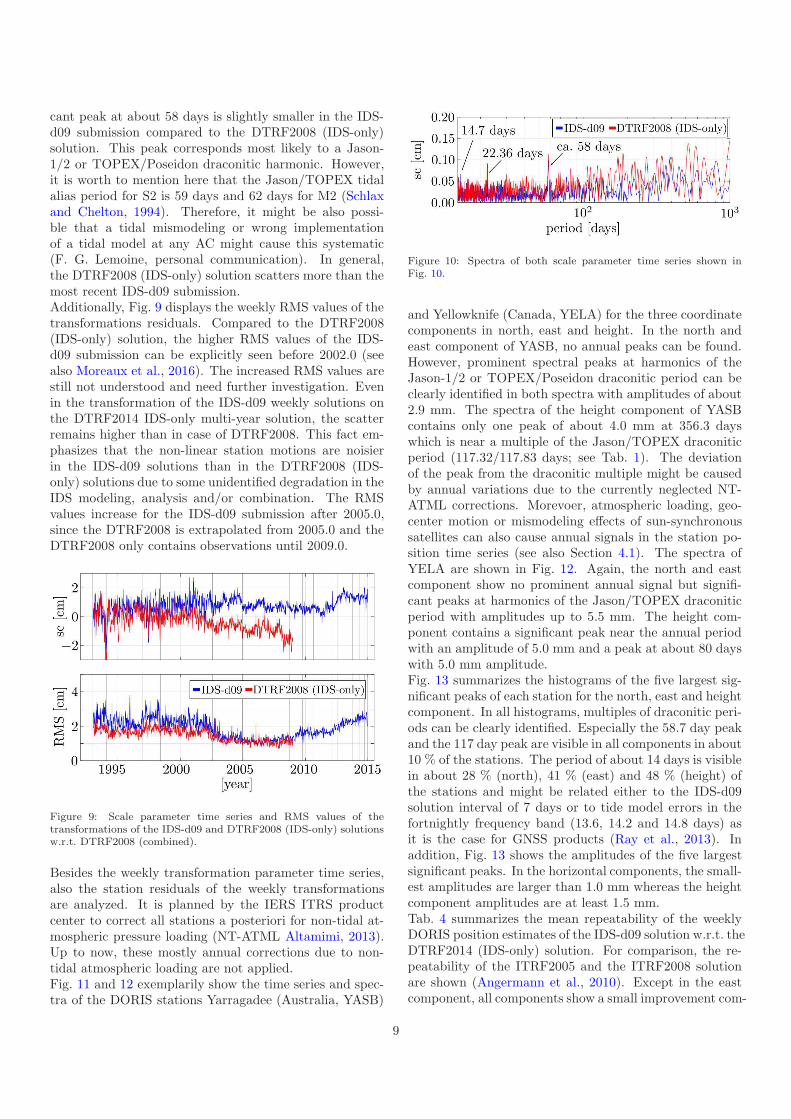
cant peak at about 58 days is slightly smaller in the IDS-d09 submission compared to the DTRF2008 (IDS-only)solution. This peak corresponds most likely to a Jason-1/2 or TOPEX/Poseidon draconitic harmonic. However,it is worth to mention here that the Jason/TOPEX tidalalias period for S2 is 59 days and 62 days for M2 (Schlaxand Chelton, 1994). Therefore, it might be also possi-ble that a tidal mismodeling or wrong implementationof a tidal model at any AC might cause this systematic(F. G. Lemoine, personal communication). In general,the DTRF2008 (IDS-only) solution scatters more than themost recent IDS-d09 submission.Additionally, Fig. 9 displays the weekly RMS values of thetransformations residuals. Compared to the DTRF2008(IDS-only) solution, the higher RMS values of the IDS-d09 submission can be explicitly seen before 2002.0 (seealso Moreaux et al., 2016). The increased RMS values arestill not understood and need further investigation. Evenin the transformation of the IDS-d09 weekly solutions onthe DTRF2014 IDS-only multi-year solution, the scatterremains higher than in case of DTRF2008. This fact em-phasizes that the non-linear station motions are noisierin the IDS-d09 solutions than in the DTRF2008 (IDS-only) solutions due to some unidentified degradation in theIDS modeling, analysis and/or combination. The RMSvalues increase for the IDS-d09 submission after 2005.0,since the DTRF2008 is extrapolated from 2005.0 and theDTRF2008 only contains observations until 2009.0.
Figure 9: Scale parameter time series and RMS values of thetransformations of the IDS-d09 and DTRF2008 (IDS-only) solutionsw.r.t. DTRF2008 (combined).
Besides the weekly transformation parameter time series,also the station residuals of the weekly transformationsare analyzed. It is planned by the IERS ITRS productcenter to correct all stations a posteriori for non-tidal at-mospheric pressure loading (NT-ATML Altamimi, 2013).Up to now, these mostly annual corrections due to non-tidal atmospheric loading are not applied.Fig. 11 and 12 exemplarily show the time series and spec-tra of the DORIS stations Yarragadee (Australia, YASB)
Figure 10: Spectra of both scale parameter time series shown inFig. 10.
and Yellowknife (Canada, YELA) for the three coordinatecomponents in north, east and height. In the north andeast component of YASB, no annual peaks can be found.However, prominent spectral peaks at harmonics of theJason-1/2 or TOPEX/Poseidon draconitic period can beclearly identified in both spectra with amplitudes of about2.9 mm. The spectra of the height component of YASBcontains only one peak of about 4.0 mm at 356.3 dayswhich is near a multiple of the Jason/TOPEX draconiticperiod (117.32/117.83 days; see Tab. 1). The deviationof the peak from the draconitic multiple might be causedby annual variations due to the currently neglected NT-ATML corrections. Morevoer, atmospheric loading, geo-center motion or mismodeling effects of sun-synchronoussatellites can also cause annual signals in the station po-sition time series (see also Section 4.1). The spectra ofYELA are shown in Fig. 12. Again, the north and eastcomponent show no prominent annual signal but signifi-cant peaks at harmonics of the Jason/TOPEX draconiticperiod with amplitudes up to 5.5 mm. The height com-ponent contains a significant peak near the annual periodwith an amplitude of 5.0 mm and a peak at about 80 dayswith 5.0 mm amplitude.Fig. 13 summarizes the histograms of the five largest sig-nificant peaks of each station for the north, east and heightcomponent. In all histograms, multiples of draconitic peri-ods can be clearly identified. Especially the 58.7 day peakand the 117 day peak are visible in all components in about10 % of the stations. The period of about 14 days is visiblein about 28 % (north), 41 % (east) and 48 % (height) ofthe stations and might be related either to the IDS-d09solution interval of 7 days or to tide model errors in thefortnightly frequency band (13.6, 14.2 and 14.8 days) asit is the case for GNSS products (Ray et al., 2013). Inaddition, Fig. 13 shows the amplitudes of the five largestsignificant peaks. In the horizontal components, the small-est amplitudes are larger than 1.0 mm whereas the heightcomponent amplitudes are at least 1.5 mm.Tab. 4 summarizes the mean repeatability of the weeklyDORIS position estimates of the IDS-d09 solution w.r.t. theDTRF2014 (IDS-only) solution. For comparison, the re-peatability of the ITRF2005 and the ITRF2008 solutionare shown (Angermann et al., 2010). Except in the eastcomponent, all components show a small improvement com-
9

Figure 11: Time series (left plots) and spectra (right plots) of weekly station residuals of Yarragadee (Australia) in north, east and height. Tocompute a spectra of the time series, the non-equidistant station residuals (blue dots) are interpolated to an equally spaced (weekly) interval.
Figure 12: Time series (left plots) and spectra (right plots) of weekly station residuals of Yellowknife (Canada) in north, east and height. Tocompute a spectra of the time series, the non-equidistant station residuals (blue dots) are interpolated to an equally spaced (weekly) interval.
10
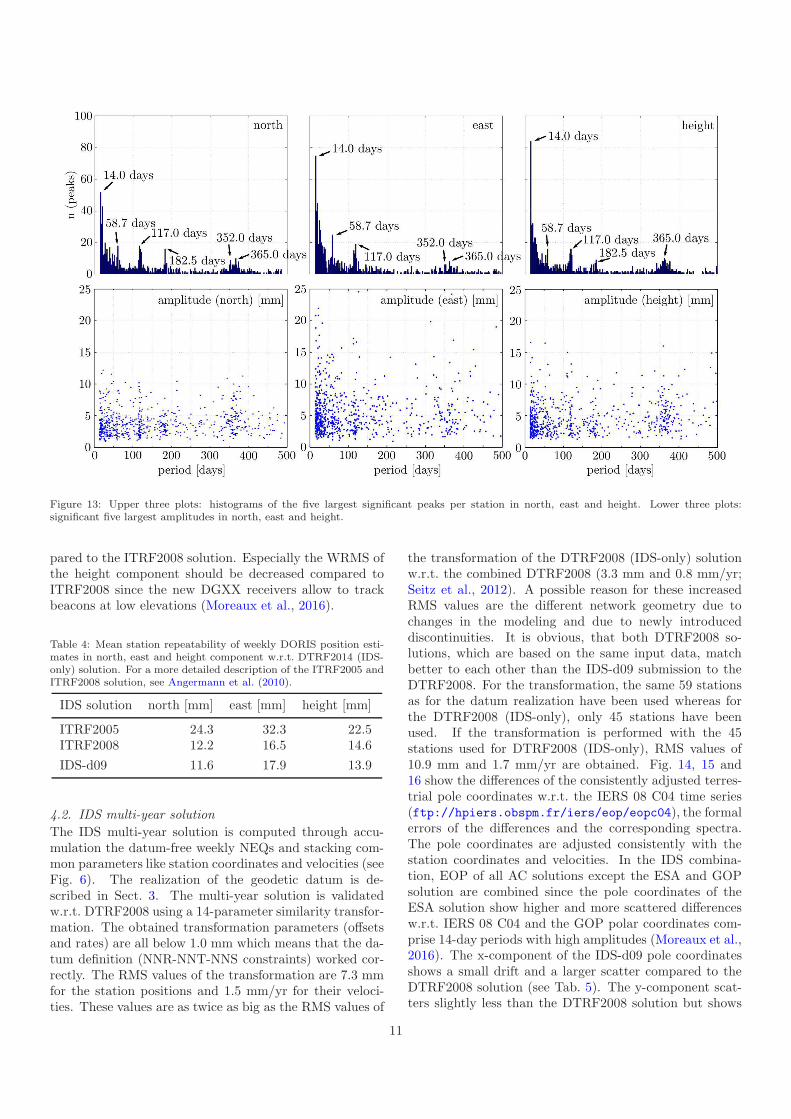
Figure 13: Upper three plots: histograms of the five largest significant peaks per station in north, east and height. Lower three plots:significant five largest amplitudes in north, east and height.
pared to the ITRF2008 solution. Especially the WRMS ofthe height component should be decreased compared toITRF2008 since the new DGXX receivers allow to trackbeacons at low elevations (Moreaux et al., 2016).
Table 4: Mean station repeatability of weekly DORIS position esti-mates in north, east and height component w.r.t. DTRF2014 (IDS-only) solution. For a more detailed description of the ITRF2005 andITRF2008 solution, see Angermann et al. (2010).
IDS solution north [mm] east [mm] height [mm]
ITRF2005 24.3 32.3 22.5ITRF2008 12.2 16.5 14.6
IDS-d09 11.6 17.9 13.9
4.2. IDS multi-year solution
The IDS multi-year solution is computed through accu-mulation the datum-free weekly NEQs and stacking com-mon parameters like station coordinates and velocities (seeFig. 6). The realization of the geodetic datum is de-scribed in Sect. 3. The multi-year solution is validatedw.r.t. DTRF2008 using a 14-parameter similarity transfor-mation. The obtained transformation parameters (offsetsand rates) are all below 1.0 mm which means that the da-tum definition (NNR-NNT-NNS constraints) worked cor-rectly. The RMS values of the transformation are 7.3 mmfor the station positions and 1.5 mm/yr for their veloci-ties. These values are as twice as big as the RMS values of
the transformation of the DTRF2008 (IDS-only) solutionw.r.t. the combined DTRF2008 (3.3 mm and 0.8 mm/yr;Seitz et al., 2012). A possible reason for these increasedRMS values are the different network geometry due tochanges in the modeling and due to newly introduceddiscontinuities. It is obvious, that both DTRF2008 so-lutions, which are based on the same input data, matchbetter to each other than the IDS-d09 submission to theDTRF2008. For the transformation, the same 59 stationsas for the datum realization have been used whereas forthe DTRF2008 (IDS-only), only 45 stations have beenused. If the transformation is performed with the 45stations used for DTRF2008 (IDS-only), RMS values of10.9 mm and 1.7 mm/yr are obtained. Fig. 14, 15 and16 show the differences of the consistently adjusted terres-trial pole coordinates w.r.t. the IERS 08 C04 time series(ftp://hpiers.obspm.fr/iers/eop/eopc04), the formalerrors of the differences and the corresponding spectra.The pole coordinates are adjusted consistently with thestation coordinates and velocities. In the IDS combina-tion, EOP of all AC solutions except the ESA and GOPsolution are combined since the pole coordinates of theESA solution show higher and more scattered differencesw.r.t. IERS 08 C04 and the GOP polar coordinates com-prise 14-day periods with high amplitudes (Moreaux et al.,2016). The x-component of the IDS-d09 pole coordinatesshows a small drift and a larger scatter compared to theDTRF2008 solution (see Tab. 5). The y-component scat-ters slightly less than the DTRF2008 solution but shows
11
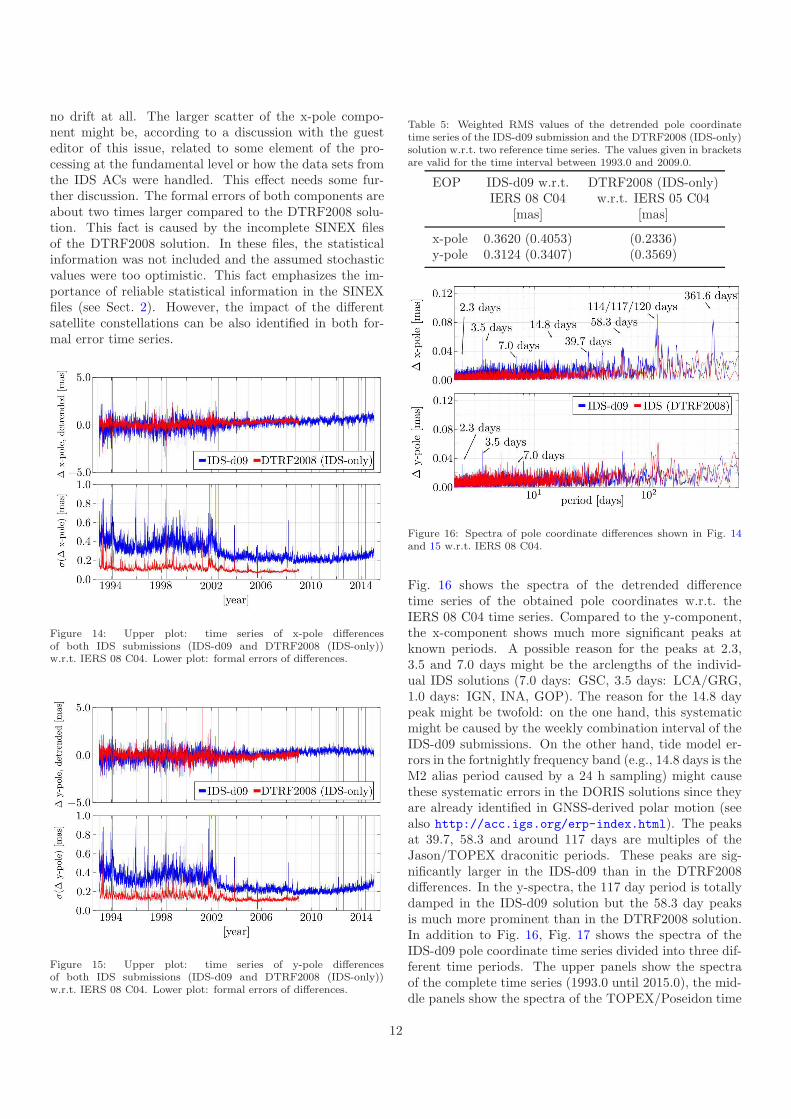
no drift at all. The larger scatter of the x-pole compo-nent might be, according to a discussion with the guesteditor of this issue, related to some element of the pro-cessing at the fundamental level or how the data sets fromthe IDS ACs were handled. This effect needs some fur-ther discussion. The formal errors of both components areabout two times larger compared to the DTRF2008 solu-tion. This fact is caused by the incomplete SINEX filesof the DTRF2008 solution. In these files, the statisticalinformation was not included and the assumed stochasticvalues were too optimistic. This fact emphasizes the im-portance of reliable statistical information in the SINEXfiles (see Sect. 2). However, the impact of the differentsatellite constellations can be also identified in both for-mal error time series.
Figure 14: Upper plot: time series of x-pole differencesof both IDS submissions (IDS-d09 and DTRF2008 (IDS-only))w.r.t. IERS 08 C04. Lower plot: formal errors of differences.
Figure 15: Upper plot: time series of y-pole differencesof both IDS submissions (IDS-d09 and DTRF2008 (IDS-only))w.r.t. IERS 08 C04. Lower plot: formal errors of differences.
Table 5: Weighted RMS values of the detrended pole coordinatetime series of the IDS-d09 submission and the DTRF2008 (IDS-only)solution w.r.t. two reference time series. The values given in bracketsare valid for the time interval between 1993.0 and 2009.0.
EOP IDS-d09 w.r.t. DTRF2008 (IDS-only)IERS 08 C04 w.r.t. IERS 05 C04
[mas] [mas]
x-pole 0.3620 (0.4053) (0.2336)y-pole 0.3124 (0.3407) (0.3569)
Figure 16: Spectra of pole coordinate differences shown in Fig. 14and 15 w.r.t. IERS 08 C04.
Fig. 16 shows the spectra of the detrended differencetime series of the obtained pole coordinates w.r.t. theIERS 08 C04 time series. Compared to the y-component,the x-component shows much more significant peaks atknown periods. A possible reason for the peaks at 2.3,3.5 and 7.0 days might be the arclengths of the individ-ual IDS solutions (7.0 days: GSC, 3.5 days: LCA/GRG,1.0 days: IGN, INA, GOP). The reason for the 14.8 daypeak might be twofold: on the one hand, this systematicmight be caused by the weekly combination interval of theIDS-d09 submissions. On the other hand, tide model er-rors in the fortnightly frequency band (e.g., 14.8 days is theM2 alias period caused by a 24 h sampling) might causethese systematic errors in the DORIS solutions since theyare already identified in GNSS-derived polar motion (seealso http://acc.igs.org/erp-index.html). The peaksat 39.7, 58.3 and around 117 days are multiples of theJason/TOPEX draconitic periods. These peaks are sig-nificantly larger in the IDS-d09 than in the DTRF2008differences. In the y-spectra, the 117 day period is totallydamped in the IDS-d09 solution but the 58.3 day peaksis much more prominent than in the DTRF2008 solution.In addition to Fig. 16, Fig. 17 shows the spectra of theIDS-d09 pole coordinate time series divided into three dif-ferent time periods. The upper panels show the spectraof the complete time series (1993.0 until 2015.0), the mid-dle panels show the spectra of the TOPEX/Poseidon time
12

Figure 17: Spectra of pole coordinate differences shown in Fig. 14 and 15 w.r.t. IERS 08 C04, seperated into complete time series (1993.0 until2015.0; upper panels), TOPEX/Poseidon time period (1993.0 until 2004.8; middle panels) and Jason-1/2 time period (2004.8 until 2015.0,lower panels).
period (1993.0 until 2004.8) and the lower panels showthe spectra of the Jason-1/2 time period (2004.8 until2015.0). It can be clearly seen that the pole coordinatesin the early years scatter much more than in the most re-cent years. The peaks at 58.3 and around 117 days in theTOPEX/Poseidon time period have nearly twice the am-plitude as during the Jason-1/2 time period. In contrastto this, the 14.7 day peak solely occurs during the Jason-1/2 time period.In summary, we can state that, in comparison with theDTRF2008 solution, the IDS-d09 solution shows moresystematic errors at spurious draconitic harmonics and alarger scatter. This fact might be attributable to someIDS modeling and/or analysis and/or combination degra-dation.
5. Summary/Outlook
This paper evaluates the IDS-d09 submission to ITRF2014and compares it with the IDS submission to ITRF2008.The submitted SINEX files are analyzed and differentsatellites used in the solutions and the weighting of theindividual AC solutions are discussed. The squared sumof the residuals vT
P v is reconstructed from statistical in-formation provided in the IDS SINEX files. The datuminformation of each SINEX file is evaluated and weeklydatum-free normal equations are reconstructed.The methodology of the combination of datum-free nor-mal equations, which is used at DGFI-TUM in order tocompute the DTRF2014, is briefly explained. Besidesthe multi-year solution, also weekly IDS-only solutions are
computed in order to identify discontinuities and system-atics in the transformation parameters w.r.t. DTRF2008.For the DTRF2014, in total 56 discontinuities are intro-duced. A list of the discontinuities together with the re-duction criteria and a list of the 15 reduced stations arealso given in this paper.The analysis of the weekly computed IDS-only solutionsallows to assess the quality of the IDS submissions. There-fore, the most recent submission IDS-d09 is transformedto DTRF2008. The translation and scale parameter timeseries are compared to the parameter time series of theweekly DTRF2008 (IDS-only) solution. Systematics inthe parameter time series can be allocated to changesin the DORIS satellite constellation. The spectra of thetranslation parameter time series confirm the high qual-ity of the new IDS data since the scatter in the x- and y-translation is reduced compared to DTRF2008 (IDS-only).Also the annual amplitudes in the x- and y-componentare reduced. Whereas the z-component of the DTRF2008(IDS-only) translations contain signals near the annual fre-quency band, the IDS-d09 solution shows no peaks nearthat period. However, the z-component still shows a sig-nificant correlation with the Sunspot number. The scatterof all three IDS-d09 time series is reduced compared toDTRF2008 (IDS-only). The prominent drift which can beseen in the scale parameter time series of the DTRF2008(IDS-only) data is totally removed in the new time se-ries. Nevertheless, an offset in the scale time series after2011.0 is visible. The spectra of the scale time series con-tains significant peaks at 14.7 days in case of IDS-d09 and22.36 days in case of DTRF2008 (IDS-only). A prominent
13

peak at about 58 days (Jason-1/2 or TOPEX/Poseidondraconitic harmonic period) is slightly damped in the IDS-d09 time series.In addition to the translation and scale parameter timeseries, also a time series of RMS values of the transfor-mations is discussed. The IDS-d09 data shows in generalhigher RMS values which might be caused by some uniden-tified degradation in the IDS modeling, analysis and/orcombination.Besides the weekly transformation parameter time series,also the weekly transformation residuals per station areanalyzed. As an example, the time series of Yarragadee(YASB) and Yellowknife (YELA) are shown. For YASB,only harmonics of draconitic periods of TOPEX/Poseidonand Jason-1/2 are visible in the spectra. The amplitudesare up to 2.9 mm in the horizontal components and 4.0 mmin the height component. For YELA, the height compo-nent contains a clear annual signal with 5.0 mm amplitudeand a significant signal with a period of 80 days and anamplitude of 5.0 mm. This kind of analysis is done forall stations and the five most significant periods are sum-marized in histograms for the north, east and height com-ponent. Especially the 58.7 day and the 117 day periodare visible in all components of about 10 % of all stations.A 14 day period is visible in about 28 % (north), 41 %(east) and 48 % (height) of all stations. Besides the spec-tral analysis of the station residuals, the analysis of therepeatability of the weekly position estimates allows to as-sess the internal accuracy of the IDS-d09 solutions. Themean repeatability is nearly the same for all station coor-dinate components (12.2 mm for north, 17.9 mm for eastand 13.9 mm for height) and almost equal to the repeata-bility of the ITRF2008 IDS data.The quality of the IDS multi-year solution is evalu-ated through a 14-parameter similarity transformationw.r.t. DTRF2008. All transformation parameters (offsetsand rates) are smaller than 0.1 mm and 0.01 mm/yr whichproofs that the datum definition worked well. The RMSvalues of the transformation are twice as big as for theDTRF2008 (IDS-only) multi-year solution which might becaused by the same reason as for the weekly transforma-tions (unidentified degradation in the IDS modeling).Another focus is drawn on the consistently estimatedEOP of the IDS multi-year solution. In order to assesstheir quality, differences w.r.t. IERS 08 C04 are com-puted. Several significant peaks at draconitic multiplesof TOPEX/Poseidon and Jason-1/2, especially visible inIDS-d09, indicate problems with the solar radiation pres-sure or air drag modeling of these satellites. In theDTRF2008 (IDS-only) multi-year solution, these peaks arenot clearly visible in the spectra. The formal errors of thepole parameters of the DTRF2008 (IDS-only) solution aremuch smaller than those of the IDS-d09 submission. Thiseffect is caused by the too optimistic stochastic model ofthe DTRF2008 (IDS-only) solution due to not-booked sta-tistical information in the submitted SINEX files. Thisfact underlines the importance of statistical information
provided by the technique-specific CCs. The impact ofthe different satellite constellations can be also identifiedin both formal error time series.In summary, several improvements in the IDS analysis,new stations and new satellites result in a high quality IDScontribution to ITRF2014. This could be only achievedby the very high effort of the IDS in the last years (Williset al., 2010, 2015; Moreaux et al., 2016). The quality ofthe IDS-d09 origin and scale is higher compared to theITRF2008 data although this is not the case for the qual-ity of station positions (higher transformation RMS) andpolar motion (prominent draconitic harmonics in the spec-tra).
Acknowledgments
The authors want to thank the IDS community for thesubmitted high quality data for the ITRF2014 computa-tion. Furthermore, special thanks are given to P. Williswho helped to improve the discontinuity list. The authorsalso thank the guest editor F. G. Lemoine of this issueand the three anonymous reviewers for their constructivecomments on the manuscript.
References
Altamimi Z., Collilieux X. Quality Assessment of the IDS Contri-bution to ITRF2008. Adv Space Res 45(12), pp 1500–1509, DOI:10.1016/j.asr.2010.03.010, 2010
Altamimi Z., Collilieux X., Metivier L. ITRF2008: an improved so-lution of the international terrestrial reference frame. J Geod, vol85(8), pp 457–473, DOI: 10.1007/s00190-011-0444-4, 2011
Altamimi Z. (2013) ITRF2013 call for participation, IERS messageNo. 225
Angermann D., Seitz M., Drewes H. Analysis of the DORIS contri-butions to ITRF2008. Adv Space Res 46(12), pp 1633–1647, DOI:10.1016/j.asr.2010.07.018, 2010
Blewitt G., Lavallee D. Effect of annual signals on geodetic velocity.J Geophys Res 107(7), DOI:10.1029/2001JB000570, 2002
Bloßfeld M. The key role of Satellite Laser Ranging towardsthe integrated estimation of geometry, rotation and grav-itational field of the Earth. Dissertation, Technische Uni-versitat Munchen, ISBN: 978-3-7696-5157-7, DGK Reihe C,Verlag der Bayerischen Akademie der Wissenschaften, URL:http://dgk.badw.de/fileadmin/docs/c-745.pdf, 2015
Fagard H. Twenty years of evolution for the DORIS permanent net-work: from its initial deployment to its renovation. J Geodesy,vol. 80(8-11), pp 429–456, DOI: 10.1007/s00190-006-0084-2, 2006
Gobinddass M. L., Willis P., de Viron O., Sibthorpe A., Zelensky N.P., Ries J. C., Ferland R., Bay-Sever Y., Diament M., LemoineF. G. Improving DORIS geocenter time series using an empiricalrescaling of solar radiation pressure models, Adv Space Res 44(11),pp 1279–1287, DOI: 10.1016/j.asr.2009.08.004, 2009
Lemoine F. G., Chinn D. S., Zelensky N. P., Beall J. W., Le Bail K.The development of the GSFC DORIS contribution to ITRF2014,Adv Space Res, this issue, 2016.
Moreaux G., Lemoine F. G., Capdeville H., Kuzin S., Otten M.,Stepanek P., Willis P., Ferrage P. IDS contribution to ITRF2014,Adv Space Res, this issue, 2016
Ray J., Griffiths J., Collilieux X., Rebischung P. Subseasonal GNSSpositioning errors. Geophys Res Lett 40(22), pp 5854–5860, DOI:10.1002/2013GL058160, 2013
Rudenko S., Dettmering D., Esselborn S., Schoene T., Foerste C.,Lemoine J.-M., Ablain M., Alexandre D., Neumayer K.-H. In-fluence of time variable geopotential models on precise orbits of
14
altimetry satellites, global and regional mean sea level trends. AdvSpace Res 54(1), pp 92–118, DOI: 10.1016/j.asr.2014.03.010, 2014
Schlax M. G., Chelton D. B. Aliased tidal errors in TOPEX/Poseidonsea surface heigth data, J Geophys Res - Oceans 99(C12), pp24761–24774, DOI: 10.1029/94LC01925, 1994
Seitz M., Angermann D., Bloßfeld M., Drewes H., Gerstl M. TheDGFI Realization of ITRS: DTRF2008. J Geodesy, vol 86(12), pp1097–1123, DOI: 10.1007/s00190-012-0567-2, 2012
World Data Center SILSO. Sunspot Number and Long-term So-lar Observations, Royal Observatory of Belgium, on-line SunspotNumber catalogue: http://www.sidc.be/SILSO, 1993–2015
Sillard P., Boucher C. A review of algebraic constraints in terrestrialreference frame datum definition. J Geodesy, vol 75(2-3), pp 63–73, DOI: 10.1007/s001900100166, 2001
Soudarin L., Capdeville H., Lemoine J.-M. Activity of theCNES/CLS Analysis Center for the IDS contribution toITRF2014, Adv Space Res, this issue, 2016
Stepanek P., Dousa J., Filler V. SPOT-5 DORIS oscillator instabilitydue to South Atlantic Anomaly: mapping the effect and applica-tion of data corrective model. Adv Space Res 52(7), pp 1355–1365,DOI: 10.1016/j.asr.2013.07.010, 2014
Valette J. J., Lemoine F. G., Ferrage P., Yaya P., Altamimi Z., WillisP., Soudarin L. IDS Contribution to ITRF2008. Adv Space Res46(12), pp 1614–1632, DOI: 10.1016/j.asr.2010.05.029, 2010
Willis P., Fagard H., Ferrage P., Lemoine F. G., Noll C. E., NoomenR., Otten M., Ries J. C., Rothacher M., Soudarin L., Tav-ernier G., Valette J.-J. The International DORIS Service (IDS):Toward maturity. Adv Space Res 45(12), pp 1408–1420, DOI:10.1016/j.asr.2009.11.018, 2010
Willis P., Lemoine F. G., Soudarin L., Moreaux G., Soudarin L.,Ferrage P., Ries J., Otten M., Saunier J., Noll C., Biancale R.,Luzum B. The International DORIS Service (IDS): Recent devel-opments in preparation for ITRF2013. IAG Symposia Series, vol143, pp 1–9,DOI: 10.1007/1345 2015 164, 2015
15