Integration of High Reliability Distribution System in Microgrid Operation
QUALITY AND RELIABILITY ENGINEERING INTERNATIONAL
Qual. Reliab. Engng. Int. 2001; 17: 355–372 (DOI: 10.1002/qre.416)
QUALITY AND RELIABILITY INFORMATION INTEGRATIONFOR DESIGN EVALUATION OF FIXTURE SYSTEM RELIABILITY
JIONGHUA (JUDY) JIN1∗AND YONG CHEN2
1Department of Systems & Industrial Engineering, The University of Arizona, Tucson, AZ 85721-0020, USA2Department of Industrial and Operations Engineering, The University of Michigan, Ann Arbor, MI 48109-2117, USA
SUMMARYQuality and reliability are two important factors in manufacturing-system design. However, the analysis andoptimization of manufacturing-system reliability and product quality are normally conducted separately inpractice. There is no general framework to integrate these two important factors, quantitatively analyze theinteractions between them, and further study their integrated effects on the manufacturing-system performance.In this paper, the QR-Co-Effect of product/part quality and manufacturing-system component reliability isinvestigated in an assembly fixture system. The concept, model and analysis of QR-Co-Effect are addressed inthis paper. Copyright 2001 John Wiley & Sons, Ltd.
KEY WORDS: quality and reliability (QR) co-effect; manufacturing system reliability; product quality
1. INTRODUCTION
Manufacturing system reliability is a vital factorin ensuring product quality and productivity ina production process. Various efforts have beenmade to analyze and optimize manufacturing-systemreliability in the component and system-designstage. In general, system-reliability analysis is basedon component failures and the interdependencyamong those components. Various methodologies ortechniques, such as fault-tree models, failure modesand effect analysis (FMEA), block reliability diagram,Petri nets, and the Markov model have been developedfor this purpose [1].
However, the downtime of a manufacturing systemis not only caused by manufacturing-system compo-nent failures, but also by nonconforming productsproduced by a degraded system. In the literature,system reliability is generally defined as the probabil-ity that a system will perform its intended functionunder operating conditions for a specified period oftime [2]. Therefore, system-reliability analysis for amanufacturing system should consider not only itstooling and machine uptime, but also the produced-product quality.
In general, product quality has a complex rela-tionship with the conditions, layout and interaction
∗Correspondence to: Judy Jin, Department of Systems andIndustrial Engineering, The University of Arizona, Tucson, AZ85721-0020, USA. Email: [email protected]
of manufacturing system components. Under givenquality specifications, the determination of a thresholdof a degraded component is very difficult due to thelack of a system model to integrate the product qualitywith the system-component reliability. Most of pastresearch has focused on system degradation as a re-sult of degraded system components. Various decisionrules have been provided to determine the systemfailure by specifying a threshold as the maximumacceptable degradation for each component [3,4]. Inthose analyses, thresholds are mainly determined ac-cording to engineering experience or rule of thumb.There is no systematic analysis methodology to de-scribe the interdependency between product qualityand system-component degradation. As a result, eithera conservative design of system reliability is used withexcessively reliable components, or an over-optimisticreliable system is obtained leading to lots of unex-pected downtime during production. There is there-fore a pressing need to develop an integrated-systemmodel by integrating product quality, manufacturing-system component degradation, and process-designinformation to enable manufacturing-system designevaluation and optimization. In order to develop suchan integrated model, some terminology is defined.
• Manufacturing system—a system consisting ofseveral tools or items of equipment performingthe designed operations in a manufacturingprocess to produce products. As an example of
Received 1 October 2000Copyright 2001 John Wiley & Sons, Ltd. Revised 19 April 2001
356 J. JIN AND Y. CHEN
an assembly process discussed in this paper, afixture system consisting of locating pins andlocating blocks, used to hold subassembly partsfor welding operations to obtain an assembledproduct is considered as a manufacturing system.Detailed explanation of the functionality oflocating pins and locating blocks in a fixturesystem will be given in Section 2.1.
• Manufacturing system component—a physicalpart of a manufacturing system, such as tools,equipment or machines. In this paper, locatingpins and locating blocks are considered asmanufacturing system components in a fixturesystem.
• Product—the final output or the end item of amanufacturing system. For example, a vehicledoor frame is an output of a fixture system in anautobody assembly process.
• Incoming part (or simply called part)—a physicalpart of a product with its unique function in theproduct, such as the stamped parts of inner/outerapertures of a vehicle door frame, taken as theinput of a manufacturing system. Other commonexamples are resistors inside TV products, etc.
• Quality—product assessment by using the statis-tics of the deviation of the quality characteristicmeasurements on the incoming parts or finalproducts. In the paper, the ‘product quality’ ofa fixture system is evaluated by the dimensionalvariance of the key product characteristic (KPC)measurements on the assembled products. ‘In-coming part quality’ is evaluated by the diametervariance of part-holes of incoming parts.
• Manufacturing-system reliability—the probabil-ity for a manufacturing system to work func-tionally for a specified period of time, that is,there are no catastrophic system failures, and theproduced product quality is satisfied during thespecified period of time. So, ‘fixture system relia-bility’ used in this paper is evaluated by the prob-ability of producing satisfactory quality of prod-ucts with no catastrophic failures of locating pinsand locating blocks for a specified period of time.
• Manufacturing-system component reliability—generally described by two aspects: catastrophicfailure and performance degradation. In thepaper, catastrophic failure refers to a broken orloosened pin in a fixture system, and performancedegradation means pin-diameter wear resultingin an increasing locating error.
The reliability analysis of a manufacturing systemshould consider both tool/machine component relia-
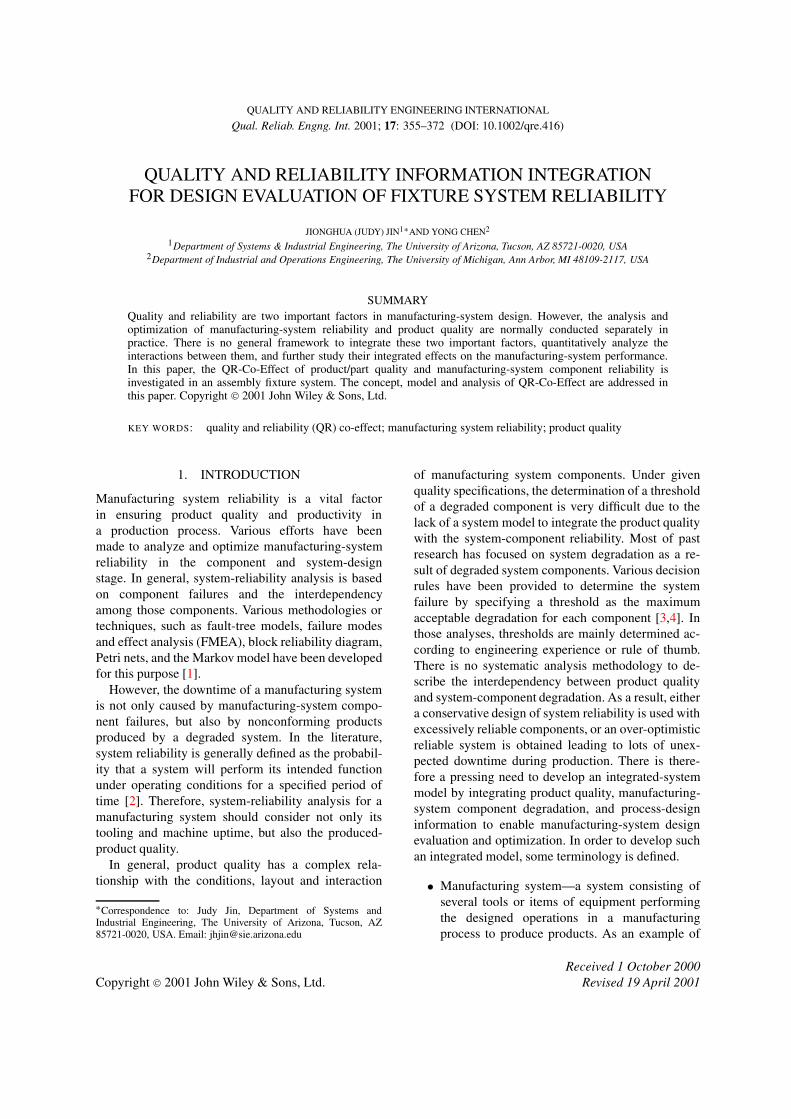
bility and its output and input product/part quality.It can be seen that there is an interaction betweenmanufacturing-system component reliability and theproduct/part quality, which is represented by thenewly-defined concept ‘QR-Co-Effect’, illustrated inFigure 1. The functions of QR-Co-Effect have twoaspects. One aspect is the degradation (δx) of amanufacturing-system component, with an impact onproduct quality (variance σ 2 and mean deviation µ). Aproduct with unsatisfactory quality may be produceddue to manufacturing-system component degradationbefore a catastrophic component failure is observed.This leads to manufacturing-system downtime dueto defective products in production. The other as-pect is the incoming-part quality that also has animpact on manufacturing system-component degra-dation δx and its probability of catastrophic failure.A larger variation of incoming parts may introducemore interference between subassembly parts andmanufacturing-system components during operation.As a result, an accelerated degradation and/or morecatastrophic failures may be observed when incomingparts have a larger variation or mean deviation, caus-ing manufacturing-system components to fail soonerthan those under consistently high quality of incom-ing parts. Without considering the QR-Co-Effect, theresults of a manufacturing-system reliability analysiscould be biased. However, there has been no system-atic methodology available that incorporates the QR-Co-Effect into manufacturing-system reliability evalu-ations. The introduction of the QR-Co-Effect conceptwill address this issue.
Unlike conventional reliability analysis methods,the QR-Co-Effect modeling closely depends on boththe given system functions and the user-definedproduct quality. In order to model such a QR-Co-Effect functionality, we need to address the followingissues.
(1) Modeling the impact of manufacturing-systemcomponent degradation on product quality.
(2) Modeling manufacturing-system componentdegradation.
(3) Studying the impact of incoming-part quality onmanufacturing-system component reliability.
Depending on product and manufacturing-system design, the quantitative relationship betweenincoming-part quality and manufacturing-systemcomponent reliability varies; the quantitativelymodeling of the QR-Co-Effect in manufacturing-system reliability analysis is a very challengingproblem. In this paper, the concept and the analysisframework of QR-Co-Effect are illustrated by using
Copyright 2001 John Wiley & Sons, Ltd. Qual. Reliab. Engng. Int. 2001; 17: 355–372
QUALITY RELIABILITY INFORMATION INTEGRATION 357
Figure 1. QR-Co-Effect function between quality and reliability
an assembly fixture system. A comparative studyis conducted under different tooling layouts toexplore the importance of integration of part qualityand manufacturing-system component reliabilityinformation for system-reliability analysis. Thepotential use of the methodology for selection ofmanufacturing-system components, design of fixturelayouts and improvement of manufacturing-systemreliability is also discussed.
The paper is organized as follows: after a briefintroduction, the effect of the fixture functionality onproduct quality is discussed in Section 2. In Section 3,the mechanism of manufacturing-system componentwear is explained. Both qualitative and quantitativemodels are provided in this section. Then, qualityand reliability information integration is addressedin Section 4. Section 5 provides an evaluation forthe proposed methodology using the Monte Carlosimulation method. A comparison study is also givenin this section to elaborate the importance of theproposed integrated reliability-analysis methodology.Afterward, more simulation analyses are provided inSection 6 to illustrate the potential usage and theeffectiveness of the proposed methodology. Finally,the paper concludes in Section 7.
2. THE EFFECT OF FIXTUREFUNCTIONALITY ON PRODUCT QUALITY
The automotive body without doors, hood, fendersand trunk lid is called ‘body in white’ (BIW). Ina BIW assembly line, depending on the complexityof products, there are typically 80 to 130 assembly
stations which assemble 150 to 250 sheet-metal parts.Based on their functions, the components of a BIWare usually divided into structural and non-structuralparts. Structural parts, such as rails, plenum anddoor-hinge reinforcements are much more rigid thannon-structural parts, such as the door outer panel,cowl-side, roof, etc. Past research indicates that astructural part usually has a much greater impacton the automotive body dimensional accuracy [5,6].Therefore, only structural parts will be considered inthe modeling procedure. In this paper, the assumptionof a rigid part and the sufficiency of using a 3-2-1fixture (which will be discussed in Section 2.1) tolocate a rigid panel are made in the analysis. Theseassumptions cover 68% of the total parts in a typicalautobody [7].
In the BIW assembly, assembly fixtures play acritical role in ensuring both product quality andprocess throughput. If fixture components malfunction(e.g. if locating pins or locating blocks are looseor broken), parts will not be located in thecorrect position, leading to manufacturing-systemdowntime. Alternatively, fixture system componentsalso gradually become worn during production; thewear of these components will lead to deteriorationof accuracy of location, affecting product quality.Previous research indicates that 72% of the root causesof dimensional errors in BIW are due to fixture-systemcomponents [8].
Generally, system reliability due to system-component failure and degradation can be analyzedin the design stage using conventional methodologies,if the reliability information about system compo-
Copyright 2001 John Wiley & Sons, Ltd. Qual. Reliab. Engng. Int. 2001; 17: 355–372
358 J. JIN AND Y. CHEN
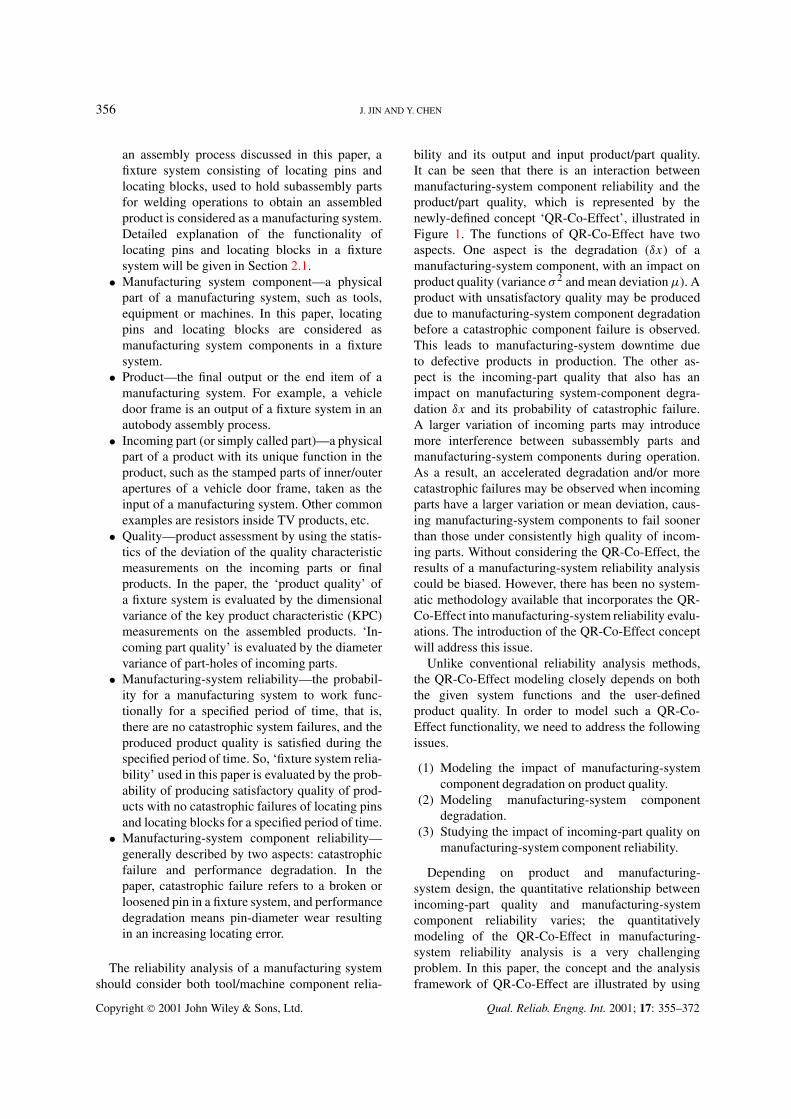
Figure 2. Automotive body and its assembly fixture: (a) body coordinate system; (b) 3-2-1 fixturing principle for rigid part
nents and their interactions is known [9–12]. However,these analysis methods cannot be applied directlyto manufacturing-system reliability analysis becauseproduct-quality information and the interdependencybetween part quality and manufacturing-system com-ponent reliability are not considered. Consequently,a new methodology should be developed to integratequality and reliability information for fixture designevaluation and optimization.
2.1. Fixture layout and major components
In this paper, a body coordinate system shown inFigure 2(a) is used. The origin of the body-coordinatesystem is defined in the front center of a vehicle andbelow its underbody. The X-Y -Z axes are shown in thefigure. This definition of the body-coordinate systemhas been widely used in automotive industry in theproduct and process design.
In sheet-metal assembly, the position and orienta-tion of the subassembly parts must be accurately lo-cated and remain fixed in the body-coordinate systemduring assembly operations. Generally, a 3-2-1 fixtur-ing principle is widely used in assembly processes forlocating a rigid part, using the minimum geometricfeatures without creating interferences among loca-tors. As an example, a typical 3-2-1 fixture system,as shown in Figure 2(b), is widely used in autobodyassembly processes. In this fixture system, (1) a four-way locating pin (P1) is used to locate the part datumfeature, which is a hole in the part, to determineprecisely the part-hole location in the X and Z di-rections; (2) a two-way locating pin (P2) is used tolocate another part datum feature, which is a slot inthe part, to precisely determine the part-slot positionin the Z direction. Therefore, these two locating pins(P1 and P2) constrain the part rotation and translationin the X–Z plane; and (3) three locating blocks (B1,B2, B3) are used as locators working with clamps toconstrain the part movement in the Y direction. There-fore, the combined functions of the fixture components
(locating pins and locating blocks) constrain all sixdegrees of freedom of a rigid sheet-metal part in three-dimensional space.
In order to simplify the illustration of this newQR-Co-Effect concept, the fixture-system reliabilityanalysis presented in this paper will focus on locatingpins only. The analysis of the effect of locating blockscan be conducted following the similar procedure.Thus, all later analysis in this paper will be onlydiscussed in the X–Z plane because locating pinscontrol part position in the X–Z plane.
2.2. The effect of fixture system component wear onproduct quality
2.2.1. Product quality assessment. Productquality is generally defined by the dimensionalaccuracy of KPC points on a part, such as M1, M2and M3 shown in Figure 2(b). In the X–Z plane, theX–Z coordinates of these three measurement pointsare denoted as Mi = (Mi(x),Mi(z)) (i = 1, 2, 3).Let y ≡ [M1(x)M1(z)M2(x)M2(z)M3(x)M3(z)]T
be the 6-dimensional measurement vector for theKPC points. If the deviation (from nominal) of y isdenoted as δy, product quality can be assessed byboth mean and variance of δy, that is, if the meanor variance of any displacement δyi (i = 1, . . . , 6)is larger than the quality specification of maximummean shift γi or maximum variance ηi respectively,product quality is determined as nonconforming.In this case, the current fixture system is taken asfailure. Thus, the decision rule used for determiningmanufacturing system status can be stated as: if⋂6
i=1{(Var(δyi | δX) < ηi) ∩ (E(δyi | δX) < γi)}is not satisfied, then the current status of themanufacturing process is determined as failed, whereδX denotes the current tool wear stage, and Var(·)and E(·) represent the operator for calculating thevariance and mean of a random variable. In order touse this decision rule, the effect of tool conditionson the product dimensional deviation δy should be
Copyright 2001 John Wiley & Sons, Ltd. Qual. Reliab. Engng. Int. 2001; 17: 355–372
QUALITY RELIABILITY INFORMATION INTEGRATION 359
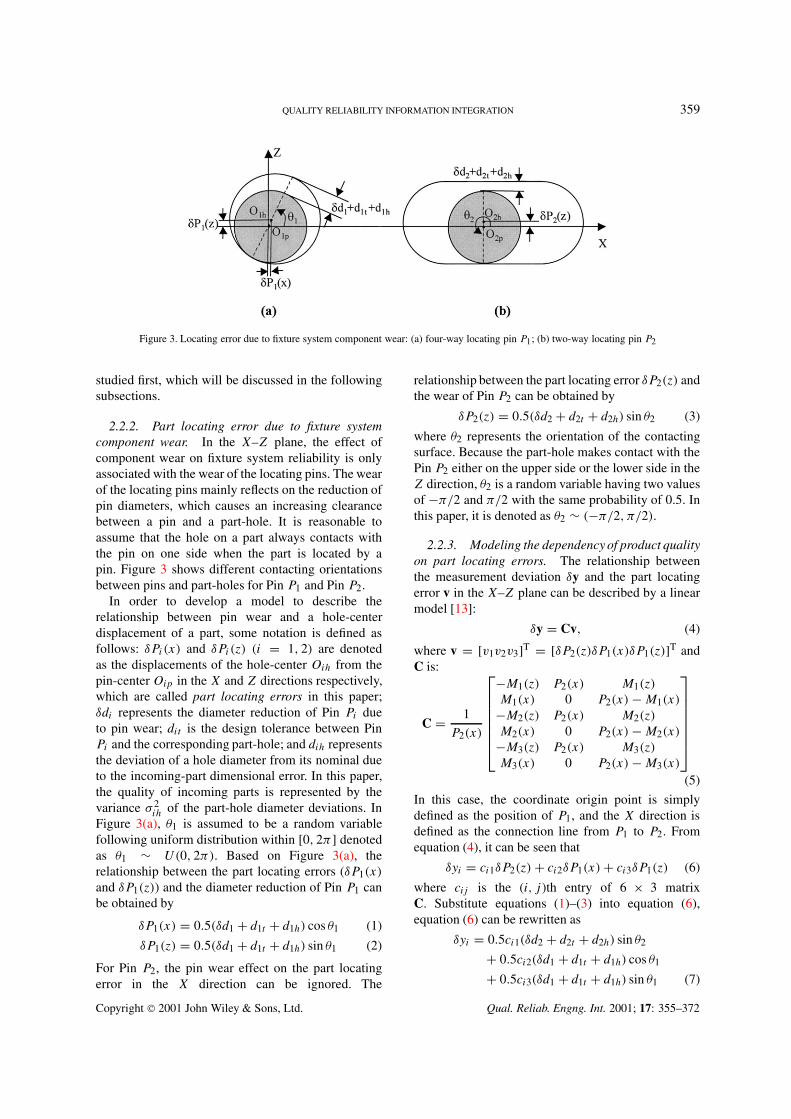
Figure 3. Locating error due to fixture system component wear: (a) four-way locating pin P1; (b) two-way locating pin P2
studied first, which will be discussed in the followingsubsections.
2.2.2. Part locating error due to fixture systemcomponent wear. In the X–Z plane, the effect ofcomponent wear on fixture system reliability is onlyassociated with the wear of the locating pins. The wearof the locating pins mainly reflects on the reduction ofpin diameters, which causes an increasing clearancebetween a pin and a part-hole. It is reasonable toassume that the hole on a part always contacts withthe pin on one side when the part is located by apin. Figure 3 shows different contacting orientationsbetween pins and part-holes for Pin P1 and Pin P2.
In order to develop a model to describe therelationship between pin wear and a hole-centerdisplacement of a part, some notation is defined asfollows: δPi(x) and δPi(z) (i = 1, 2) are denotedas the displacements of the hole-center Oih from thepin-center Oip in the X and Z directions respectively,which are called part locating errors in this paper;δdi represents the diameter reduction of Pin Pi dueto pin wear; dit is the design tolerance between PinPi and the corresponding part-hole; and dih representsthe deviation of a hole diameter from its nominal dueto the incoming-part dimensional error. In this paper,the quality of incoming parts is represented by thevariance σ 2
ih of the part-hole diameter deviations. InFigure 3(a), θ1 is assumed to be a random variablefollowing uniform distribution within [0, 2π] denotedas θ1 ∼ U(0, 2π). Based on Figure 3(a), therelationship between the part locating errors (δP1(x)
and δP1(z)) and the diameter reduction of Pin P1 canbe obtained by
δP1(x) = 0.5(δd1 + d1t + d1h) cos θ1 (1)
δP1(z) = 0.5(δd1 + d1t + d1h) sin θ1 (2)
For Pin P2, the pin wear effect on the part locatingerror in the X direction can be ignored. The
relationship between the part locating error δP2(z) andthe wear of Pin P2 can be obtained by
δP2(z) = 0.5(δd2 + d2t + d2h) sin θ2 (3)
where θ2 represents the orientation of the contactingsurface. Because the part-hole makes contact with thePin P2 either on the upper side or the lower side in theZ direction, θ2 is a random variable having two valuesof −π/2 and π/2 with the same probability of 0.5. Inthis paper, it is denoted as θ2 ∼ (−π/2, π/2).
2.2.3. Modeling the dependency of product qualityon part locating errors. The relationship betweenthe measurement deviation δy and the part locatingerror v in the X–Z plane can be described by a linearmodel [13]:
δy = Cv, (4)
where v = [v1v2v3]T = [δP2(z)δP1(x)δP1(z)]T andC is:
C = 1
P2(x)
−M1(z) P2(x) M1(z)
M1(x) 0 P2(x) − M1(x)
−M2(z) P2(x) M2(z)
M2(x) 0 P2(x) − M2(x)
−M3(z) P2(x) M3(z)
M3(x) 0 P2(x) − M3(x)
(5)
In this case, the coordinate origin point is simplydefined as the position of P1, and the X direction isdefined as the connection line from P1 to P2. Fromequation (4), it can be seen that
δyi = ci1δP2(z) + ci2δP1(x) + ci3δP1(z) (6)
where cij is the (i, j )th entry of 6 × 3 matrixC. Substitute equations (1)–(3) into equation (6),equation (6) can be rewritten as
δyi = 0.5ci1(δd2 + d2t + d2h) sin θ2
+ 0.5ci2(δd1 + d1t + d1h) cos θ1
+ 0.5ci3(δd1 + d1t + d1h) sin θ1 (7)
Copyright 2001 John Wiley & Sons, Ltd. Qual. Reliab. Engng. Int. 2001; 17: 355–372
360 J. JIN AND Y. CHEN
For the given degradations of δd1 and δd2, the pin-wear effect on fixture-system reliability is assessed bythe mean and variance of dimensional deviation δyi onthe product due to the randomness of θ1, θ2, d1h andd2h. The mean and variance of dimensional deviationδyi can be calculated based on equation (7). SinceE(sin θ1) = E(cos θ1) = E(sin θ2) = 0, there canbe obtained
E(δyi(k) | δdj , j = 1, 2) = 0 (8)
It is reasonable to assume that θ1 and θ2 are indepen-dent. Thus, Cov[sin θ2, sin θ1] and Cov[sin θ2, cos θ1]are equal to zero. It can also be obtained thatVar(sin θ2) = 1, Var(sin θ1) = Var(cos θ1) = 0.5 andCov[sin θ1, cos θ1] = 0. Thus, the part dimensionalvariance at the KPC points can be calculated by
Var(δyi | δdj , j = 1, 2)
= 0.25c2i1(δd2 + d2t )
2 + 0.25c2i1σ
22h
+ 0.125(c2i2 + c2
i3)(δd1 + d1t )2
+ 0.125(c2i2 + c2
i3)σ21h (9)
From equation (8) it can be seen that the mean shiftof the product dimensional deviation due to pin wearis equal to zero. Therefore, the assessment of productquality can be simply evaluated by the variance of theKPC points. Based on this, the decision rule used tojudge a fixture system failure due to pin wear can besimplified to: if the condition
⋂6i=1(Var(δyi | δX) <
ηi) is not satisfied, then the current fixture systemstatus is concluded as failed.
Remark. The assumption of uniform distribution forθ1 and θ2 is used to simplify the complexity of thecontact position between the part-hole and the pin. It isa good approximation if the assembly process is undera stressless condition. However, the assumption ofthe uniform distribution is not a constraint for fixturesystem reliability analysis. The necessary conditionhere is to have an available way of finding the meanand variance of sin θi and cos θi .
3. MODELING OF MANUFACTURINGSYSTEM COMPONENT WEAR
3.1. Mechanism of fixture wear
In a fixture system, pin wear is the result of frictionfrom the sliding movement between the pin and thehole of a part. Therefore, the pin wear is aggregated byall wear occurred during each operation. Archard [14]proposed a wear model based on the physical principle
of the contacting and rubbing wear,
V = KFL
3p(10)
where V represents the worn volume; F correspondsto the load force; L is the sliding distance; p isthe penetration hardness of the softer material; andK is a random wear factor. Based on the slidingwear theory, the wear factor K closely depends onthe contacting surface conditions [15,16]. This isbecause that the wear takes place at the contact pointsbetween aspirates on the sliding surface. Wallbridgeand Dawson [15] proved that K generally follows alognormal distribution, that is, K ∼ lognor(µK, σ 2
K),or equivalently, log(K) ∼ N(µK, σ 2
K). The densityfunction f (K) is
f (K) = 1
σK√
2πe−[ln(K)−µK ]2/2σ 2
K (11)
where µK corresponds to the geometric mean ofthe distribution, and K > 0, to consider only thepositive wear. Because of the random behavior ofthe wear factor K , the component wear V given inequation (10) is also considered as an independentlylognormal distributed random variable with V ∼lognor(µV , σ 2
V ). The next subsection will discuss howto use a stochastic process model to describe theincreasingly aggregated component wear δX.
3.2. Stochastic process modeling of fixture systemcomponent wear
The fixture-system component aggregated wear isincreased with the number of operations, which canbe described by a stochastic process model with anindependently lognormal distributed increment:
δX(k) = δX(k − 1) + *(k) (12)
where δX(k) is the aggregated component wear afterconducting k operations, and *(k) is the wear rate,i.e. a wear increment due to operation k. In the caseof pin wear, δX(k) is the pin diameter reduction (δd1or δd2). Based on the result in Section 3.1, *(k),k = 1, 2, . . . , are independently lognormal distributedrandom variables with *(k) ∼ lognor(µ*(k), σ 2
*(k)).The mean and variance of the wear-rate equal toE[*(k)] = exp(µ*(k)+ 0.5σ 2
*(k)) and Var[*(k)] =exp[2µ*(k)+σ 2
*(k)][exp(σ 2*(k))−1]. The aggregated
wear after conducting k operations is
δX(k) =k∑
j=1
*(j) (13)
Copyright 2001 John Wiley & Sons, Ltd. Qual. Reliab. Engng. Int. 2001; 17: 355–372
QUALITY RELIABILITY INFORMATION INTEGRATION 361
When k is very large, based on the central limittheorem, δX(k) approximately follows a normaldistribution as
δX(k) ∼ N
[ k∑j=1
E[*(j)],k∑
j=1
Var[*(j)]]
(14)
3.3. Two stages of pin wear rate
For a mechanical component, it is known that theinitial wear rate is generally much higher than thatafterwards [4]. Similarly, a higher wear rate *(k)
can be observed on pins during the initial assemblyoperations because the clearance between a pin and apart-hole is very small at that time, which results inmore surface contacting or interference forces. Withan increasing number of operations, the clearancebetween the pin and the part-hole is increased as aneffect of the aggregated pin wear due to the reductionof pin diameter. Thus, the initial higher wear ratewill quickly reduce and tend to become stable undernormal production conditions. In order to representthis early fast wear, and the random nature of pin wearrate, it is assumed that the mean of wear rate E[*(k)]is changed with operation k by the function
E[*(k)] = µ0 + µ1 e−βk (15)
where β describes how fast the mean of wear ratedecreases at the early stage, µ0 +µ1 is the initial meanof the wear rate, and µ0 is the stabilized mean of thewear rate.
4. QUALITY AND RELIABILITYINFORMATION INTEGRATION
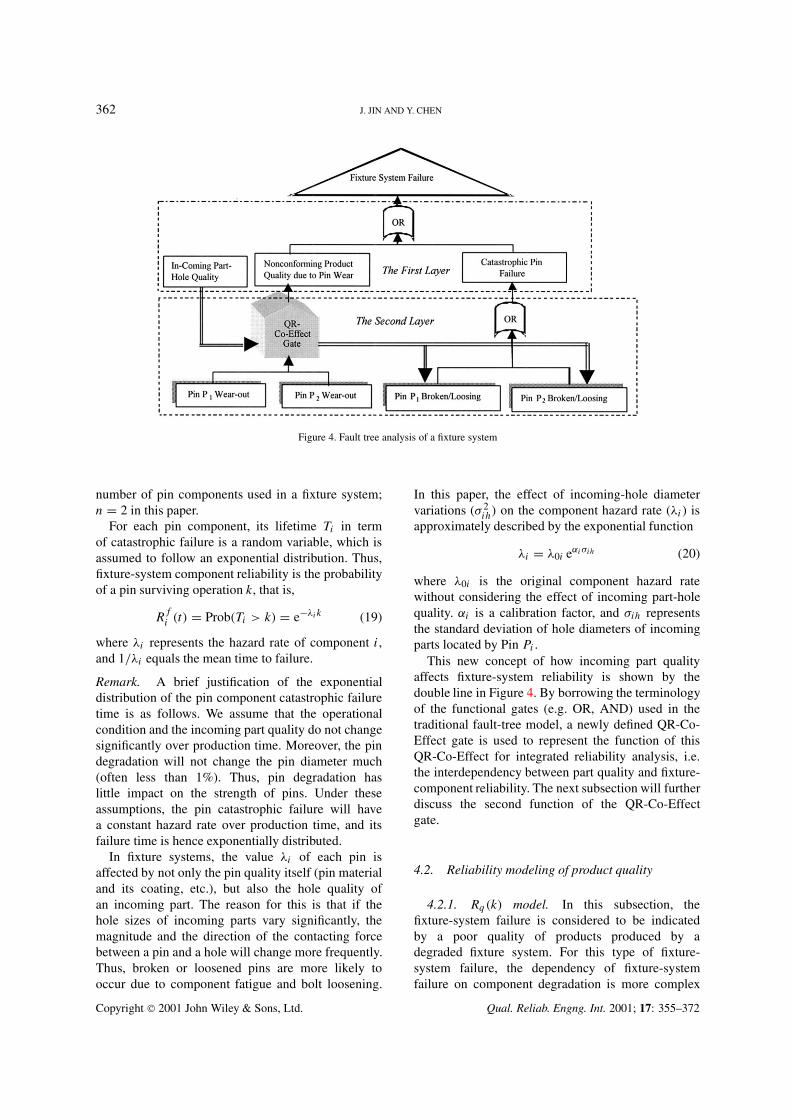
The reliability of a fixture system closely depends onthe condition of its components. In the fixture-designstage, a fixture-system failure is usually consideredas its catastrophic component malfunctions, such asa broken or loosening pin due to a connection-boltloosening etc. In this paper, in addition to consideringthis type of catastrophic component failure, a new typeof fixture-system failure is first defined where productquality is used as a criterion to determine whether afixture system is failing or not. Thus, excessive pinwear may also be regarded as a fixture-system failureif it affects product quality severely. Based on the logicrelationship shown in Figure 1, a fault-tree model, asshown in Figure 4, is developed to describe the effectof these two types of component failures on fixture-system reliability.
In the first layer, an OR gate is used to describe theoccurrence of a fixture-system failure due to either the
catastrophic fixture-system component failure or thenonconforming product quality caused by the locatingerror of worn pins. Thus, the fixture system reliabilityR at time k can be calculated by
R(k) = Prob (T > k)
= Prob (conforming product quality AND
no catastrophic component failure
during [0, k])= Prob (conforming product quality during
[0, k])× Prob (no catastrophic component failure
during [0, k] | conforming product
quality) (16)
where T as a random variable represents the fixture-system lifetime, and k is the fixture-system runningtime or the number of operations. It is reasonable toassume that pin catastrophic failure is independentof pin wear because the reduction of pin diameterhas little impact on pin-failure rate. Moreover, theconformity of product quality is affected by the toolwear. Based on this assumption, equation (16) can besimplified as:
R = Prob (conforming product quality during [0, k])× Prob(no catastrophic fixture failure during
[0, k])= Rq(k) × Rf (k) (17)
where Rq(k) and Rf (k) are the reliability in termsof product quality and catastrophic pin failurerespectively. The detailed discussion for these tworeliability calculations will be given in the followingtwo subsections.
4.1. Reliability modeling of component catastrophicfailures
In the second layer of the fault tree in Figure 4, thedependency of system catastrophic failure on each pinmalfunction is described by an OR gate. Based on theOR gate function, the reliability Rf can be describedby
Rf (k) =n∏
i=1
Rfi (k) (18)
where Rfi represents the reliability of Pin Pi in terms
of whether it experiences a catastrophic failure. It isassumed that the probabilities of a pin broken or apin loosened are independent of each other. n is the
Copyright 2001 John Wiley & Sons, Ltd. Qual. Reliab. Engng. Int. 2001; 17: 355–372
362 J. JIN AND Y. CHEN
Figure 4. Fault tree analysis of a fixture system
number of pin components used in a fixture system;n = 2 in this paper.
For each pin component, its lifetime Ti in termof catastrophic failure is a random variable, which isassumed to follow an exponential distribution. Thus,fixture-system component reliability is the probabilityof a pin surviving operation k, that is,
Rfi (t) = Prob(Ti > k) = e−λik (19)
where λi represents the hazard rate of component i,and 1/λi equals the mean time to failure.
Remark. A brief justification of the exponentialdistribution of the pin component catastrophic failuretime is as follows. We assume that the operationalcondition and the incoming part quality do not changesignificantly over production time. Moreover, the pindegradation will not change the pin diameter much(often less than 1%). Thus, pin degradation haslittle impact on the strength of pins. Under theseassumptions, the pin catastrophic failure will havea constant hazard rate over production time, and itsfailure time is hence exponentially distributed.
In fixture systems, the value λi of each pin isaffected by not only the pin quality itself (pin materialand its coating, etc.), but also the hole quality ofan incoming part. The reason for this is that if thehole sizes of incoming parts vary significantly, themagnitude and the direction of the contacting forcebetween a pin and a hole will change more frequently.Thus, broken or loosened pins are more likely tooccur due to component fatigue and bolt loosening.
In this paper, the effect of incoming-hole diametervariations (σ 2
ih) on the component hazard rate (λi ) isapproximately described by the exponential function
λi = λ0i eαiσih (20)
where λ0i is the original component hazard ratewithout considering the effect of incoming part-holequality. αi is a calibration factor, and σih representsthe standard deviation of hole diameters of incomingparts located by Pin Pi .
This new concept of how incoming part qualityaffects fixture-system reliability is shown by thedouble line in Figure 4. By borrowing the terminologyof the functional gates (e.g. OR, AND) used in thetraditional fault-tree model, a newly defined QR-Co-Effect gate is used to represent the function of thisQR-Co-Effect for integrated reliability analysis, i.e.the interdependency between part quality and fixture-component reliability. The next subsection will furtherdiscuss the second function of the QR-Co-Effectgate.
4.2. Reliability modeling of product quality
4.2.1. Rq(k) model. In this subsection, thefixture-system failure is considered to be indicatedby a poor quality of products produced by adegraded fixture system. For this type of fixture-system failure, the dependency of fixture-systemfailure on component degradation is more complex
Copyright 2001 John Wiley & Sons, Ltd. Qual. Reliab. Engng. Int. 2001; 17: 355–372
QUALITY RELIABILITY INFORMATION INTEGRATION 363
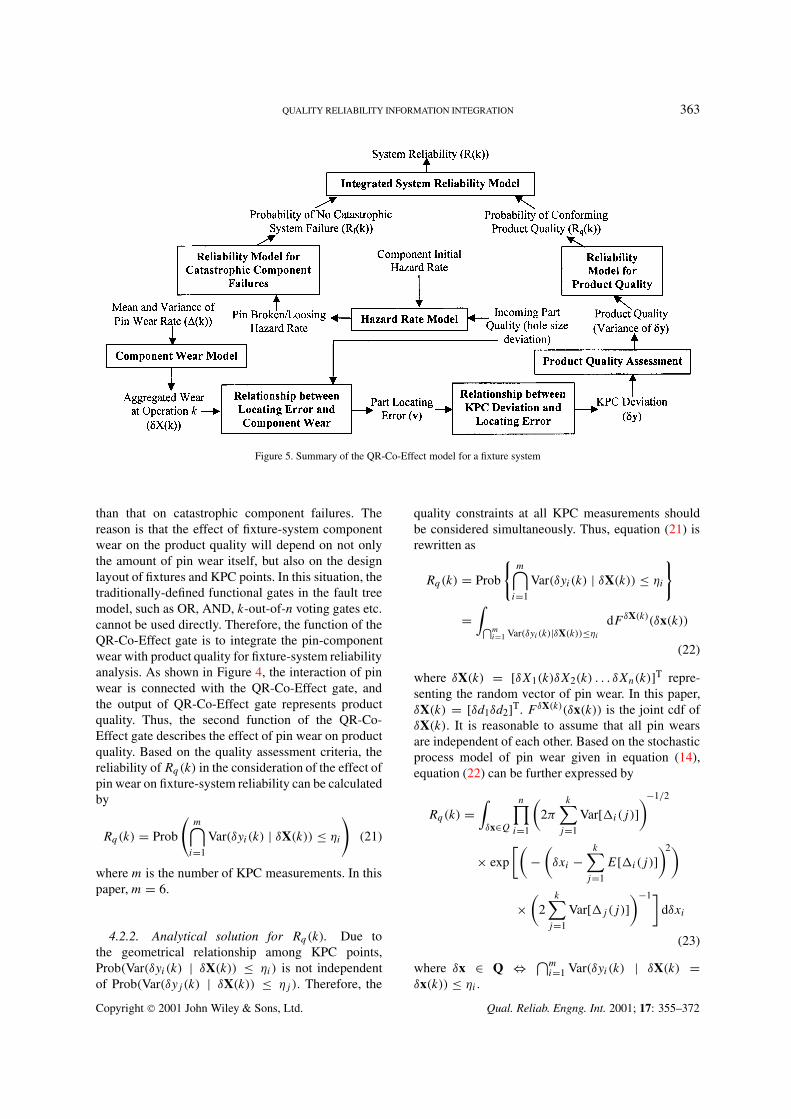
Figure 5. Summary of the QR-Co-Effect model for a fixture system
than that on catastrophic component failures. Thereason is that the effect of fixture-system componentwear on the product quality will depend on not onlythe amount of pin wear itself, but also on the designlayout of fixtures and KPC points. In this situation, thetraditionally-defined functional gates in the fault treemodel, such as OR, AND, k-out-of-n voting gates etc.cannot be used directly. Therefore, the function of theQR-Co-Effect gate is to integrate the pin-componentwear with product quality for fixture-system reliabilityanalysis. As shown in Figure 4, the interaction of pinwear is connected with the QR-Co-Effect gate, andthe output of QR-Co-Effect gate represents productquality. Thus, the second function of the QR-Co-Effect gate describes the effect of pin wear on productquality. Based on the quality assessment criteria, thereliability of Rq(k) in the consideration of the effect ofpin wear on fixture-system reliability can be calculatedby
Rq(k) = Prob
(m⋂i=1
Var(δyi(k) | δX(k)) ≤ ηi
)(21)
where m is the number of KPC measurements. In thispaper, m = 6.
4.2.2. Analytical solution for Rq(k). Due tothe geometrical relationship among KPC points,Prob(Var(δyi(k) | δX(k)) ≤ ηi) is not independentof Prob(Var(δyj (k) | δX(k)) ≤ ηj ). Therefore, the
quality constraints at all KPC measurements shouldbe considered simultaneously. Thus, equation (21) isrewritten as
Rq(k) = Prob
{m⋂i=1
Var(δyi(k) | δX(k)) ≤ ηi
}
=∫⋂m
i=1 Var(δyi(k)|δX(k))≤ηi
dFδX(k)(δx(k))
(22)
where δX(k) = [δX1(k)δX2(k) . . . δXn(k)]T repre-senting the random vector of pin wear. In this paper,δX(k) = [δd1δd2]T. FδX(k)(δx(k)) is the joint cdf ofδX(k). It is reasonable to assume that all pin wearsare independent of each other. Based on the stochasticprocess model of pin wear given in equation (14),equation (22) can be further expressed by
Rq(k) =∫δx∈Q
n∏i=1
(2π
k∑j=1
Var[*i(j)])−1/2
× exp
[(−(δxi −
k∑j=1
E[*i(j)])2)
×(
2k∑
j=1
Var[*j(j)])−1]
dδxi
(23)
where δx ∈ Q ⇔ ⋂mi=1 Var(δyi(k) | δX(k) =
δx(k)) ≤ ηi .
Copyright 2001 John Wiley & Sons, Ltd. Qual. Reliab. Engng. Int. 2001; 17: 355–372
364 J. JIN AND Y. CHEN
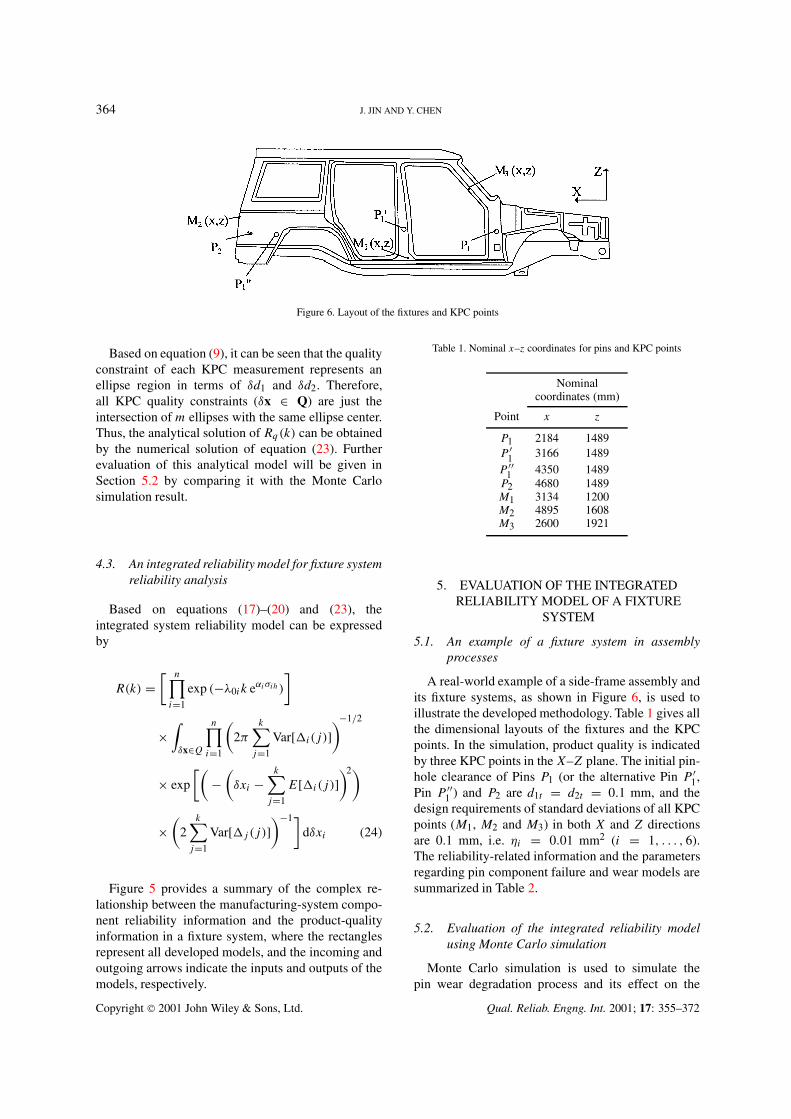
Figure 6. Layout of the fixtures and KPC points
Based on equation (9), it can be seen that the qualityconstraint of each KPC measurement represents anellipse region in terms of δd1 and δd2. Therefore,all KPC quality constraints (δx ∈ Q) are just theintersection of m ellipses with the same ellipse center.Thus, the analytical solution of Rq(k) can be obtainedby the numerical solution of equation (23). Furtherevaluation of this analytical model will be given inSection 5.2 by comparing it with the Monte Carlosimulation result.
4.3. An integrated reliability model for fixture systemreliability analysis
Based on equations (17)–(20) and (23), theintegrated system reliability model can be expressedby
R(k) =[ n∏
i=1
exp (−λ0ik eαiσih)
]
×∫δx∈Q
n∏i=1
(2π
k∑j=1
Var[*i(j)])−1/2
× exp
[(−(δxi −
k∑j=1
E[*i(j)])2)
×(
2k∑
j=1
Var[*j(j)])−1]
dδxi (24)
Figure 5 provides a summary of the complex re-lationship between the manufacturing-system compo-nent reliability information and the product-qualityinformation in a fixture system, where the rectanglesrepresent all developed models, and the incoming andoutgoing arrows indicate the inputs and outputs of themodels, respectively.
Table 1. Nominal x–z coordinates for pins and KPC points
Nominalcoordinates (mm)
Point x z
P1 2184 1489P ′
1 3166 1489P ′′
1 4350 1489P2 4680 1489M1 3134 1200M2 4895 1608M3 2600 1921
5. EVALUATION OF THE INTEGRATEDRELIABILITY MODEL OF A FIXTURE
SYSTEM
5.1. An example of a fixture system in assemblyprocesses
A real-world example of a side-frame assembly andits fixture systems, as shown in Figure 6, is used toillustrate the developed methodology. Table 1 gives allthe dimensional layouts of the fixtures and the KPCpoints. In the simulation, product quality is indicatedby three KPC points in the X–Z plane. The initial pin-hole clearance of Pins P1 (or the alternative Pin P ′
1,Pin P ′′
1 ) and P2 are d1t = d2t = 0.1 mm, and thedesign requirements of standard deviations of all KPCpoints (M1, M2 and M3) in both X and Z directionsare 0.1 mm, i.e. ηi = 0.01 mm2 (i = 1, . . . , 6).The reliability-related information and the parametersregarding pin component failure and wear models aresummarized in Table 2.
5.2. Evaluation of the integrated reliability modelusing Monte Carlo simulation
Monte Carlo simulation is used to simulate thepin wear degradation process and its effect on the
Copyright 2001 John Wiley & Sons, Ltd. Qual. Reliab. Engng. Int. 2001; 17: 355–372
QUALITY RELIABILITY INFORMATION INTEGRATION 365
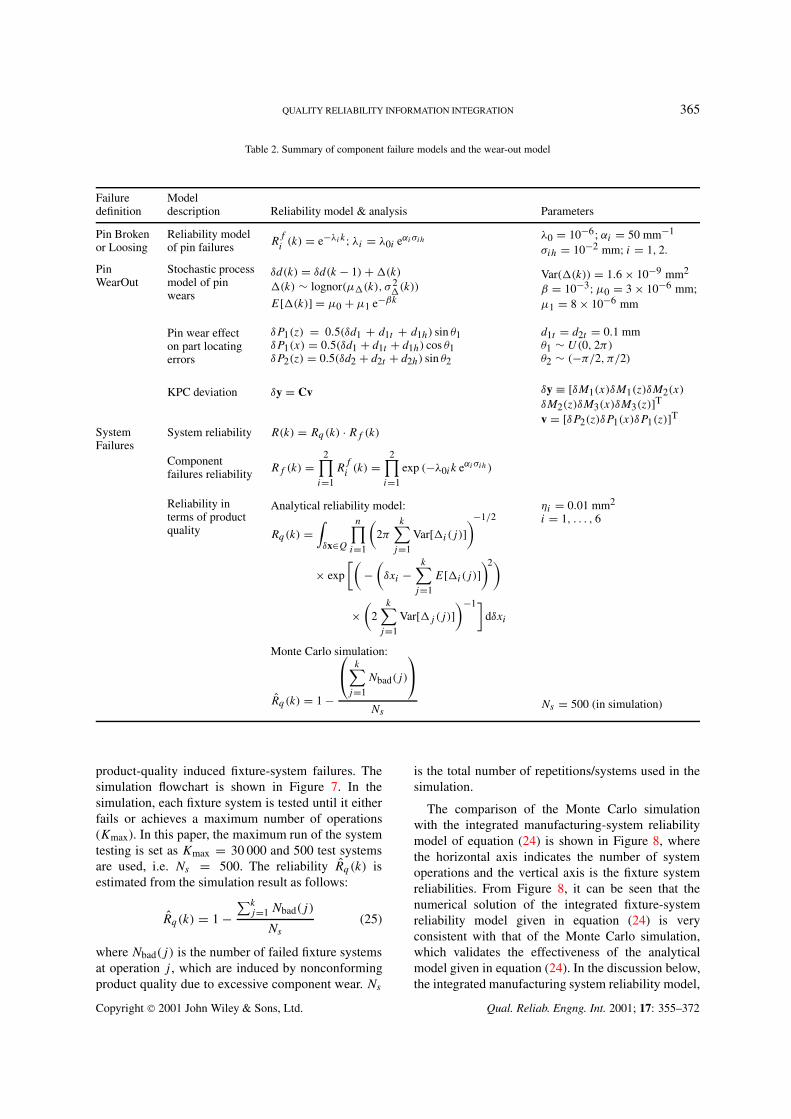
Table 2. Summary of component failure models and the wear-out model
Failure Modeldefinition description Reliability model & analysis Parameters
Pin Brokenor Loosing
Reliability modelof pin failures R
fi(k) = e−λik; λi = λ0i eαiσih λ0 = 10−6; αi = 50 mm−1
σih = 10−2 mm; i = 1, 2.
PinWearOut
Stochastic processmodel of pinwears
δd(k) = δd(k − 1) + *(k)
*(k) ∼ lognor(µ*(k), σ 2*(k))
E[*(k)] = µ0 + µ1 e−βk
Var(*(k)) = 1.6 × 10⁻⁹ mm2
β = 10−3;µ0 = 3 × 10⁻⁶ mm;µ1 = 8 × 10⁻⁶ mm
Pin wear effecton part locatingerrors
δP1(z) = 0.5(δd1 + d1t + d1h) sin θ1δP1(x) = 0.5(δd1 + d1t + d1h) cos θ1δP2(z) = 0.5(δd2 + d2t + d2h) sin θ2
d1t = d2t = 0.1 mmθ1 ∼ U(0, 2π)θ2 ∼ (−π/2, π/2)
KPC deviation δy = Cv δy ≡ [δM1(x)δM1(z)δM2(x)
δM2(z)δM3(x)δM3(z)]Tv = [δP2(z)δP1(x)δP1(z)]T
SystemFailures
System reliability R(k) = Rq(k) · Rf (k)
Componentfailures reliability Rf (k) =
2∏i=1
Rfi(k) =
2∏i=1
exp (−λ0ik eαiσih )
Reliability interms of productquality
Analytical reliability model:
Rq(k) =∫δx∈Q
n∏i=1
(2π
k∑j=1
Var[*i(j)])−1/2
× exp
[(−(δxi −
k∑j=1
E[*i(j)])2)
×(
2k∑
j=1
Var[*j (j)])−1]
dδxi
Monte Carlo simulation:
R̂q(k) = 1 −
k∑
j=1
Nbad(j)
Ns
ηi = 0.01 mm2
i = 1, . . . , 6
Ns = 500 (in simulation)
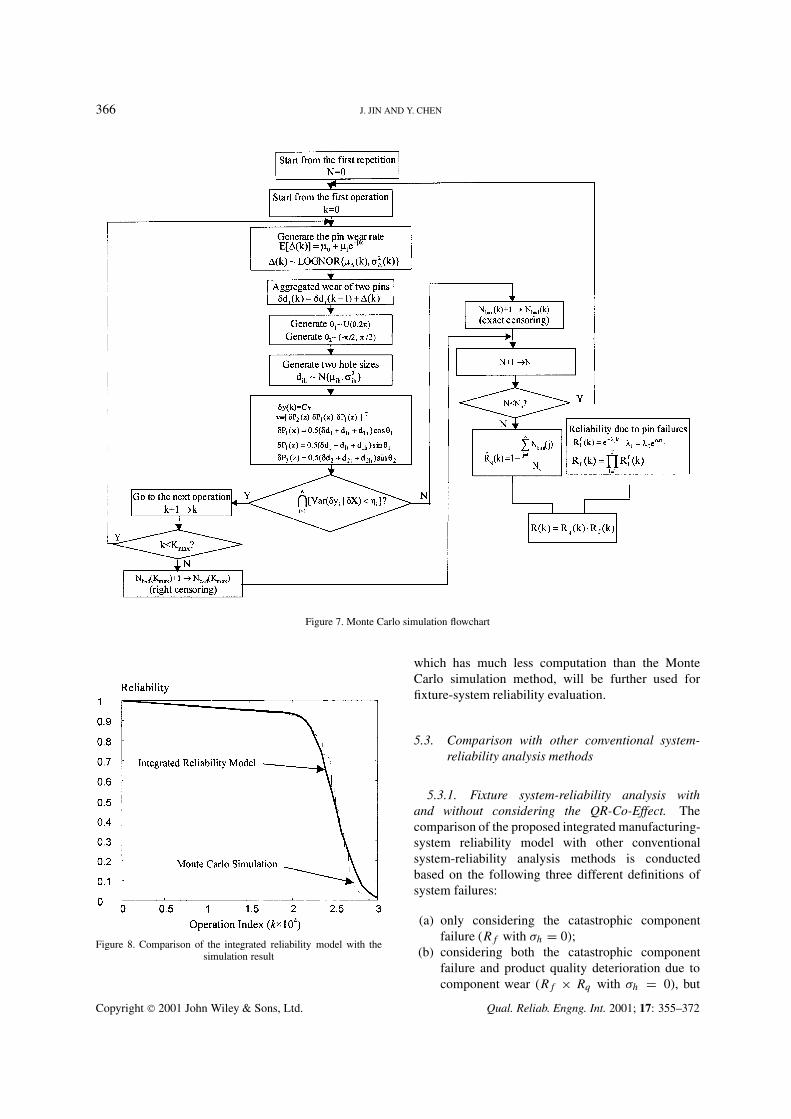
product-quality induced fixture-system failures. Thesimulation flowchart is shown in Figure 7. In thesimulation, each fixture system is tested until it eitherfails or achieves a maximum number of operations(Kmax). In this paper, the maximum run of the systemtesting is set as Kmax = 30 000 and 500 test systemsare used, i.e. Ns = 500. The reliability R̂q (k) isestimated from the simulation result as follows:
R̂q(k) = 1 −∑k
j=1 Nbad(j)
Ns
(25)
where Nbad(j) is the number of failed fixture systemsat operation j , which are induced by nonconformingproduct quality due to excessive component wear. Ns
is the total number of repetitions/systems used in thesimulation.
The comparison of the Monte Carlo simulationwith the integrated manufacturing-system reliabilitymodel of equation (24) is shown in Figure 8, wherethe horizontal axis indicates the number of systemoperations and the vertical axis is the fixture systemreliabilities. From Figure 8, it can be seen that thenumerical solution of the integrated fixture-systemreliability model given in equation (24) is veryconsistent with that of the Monte Carlo simulation,which validates the effectiveness of the analyticalmodel given in equation (24). In the discussion below,the integrated manufacturing system reliability model,
Copyright 2001 John Wiley & Sons, Ltd. Qual. Reliab. Engng. Int. 2001; 17: 355–372
366 J. JIN AND Y. CHEN
Figure 7. Monte Carlo simulation flowchart
Figure 8. Comparison of the integrated reliability model with thesimulation result
which has much less computation than the MonteCarlo simulation method, will be further used forfixture-system reliability evaluation.
5.3. Comparison with other conventional system-reliability analysis methods
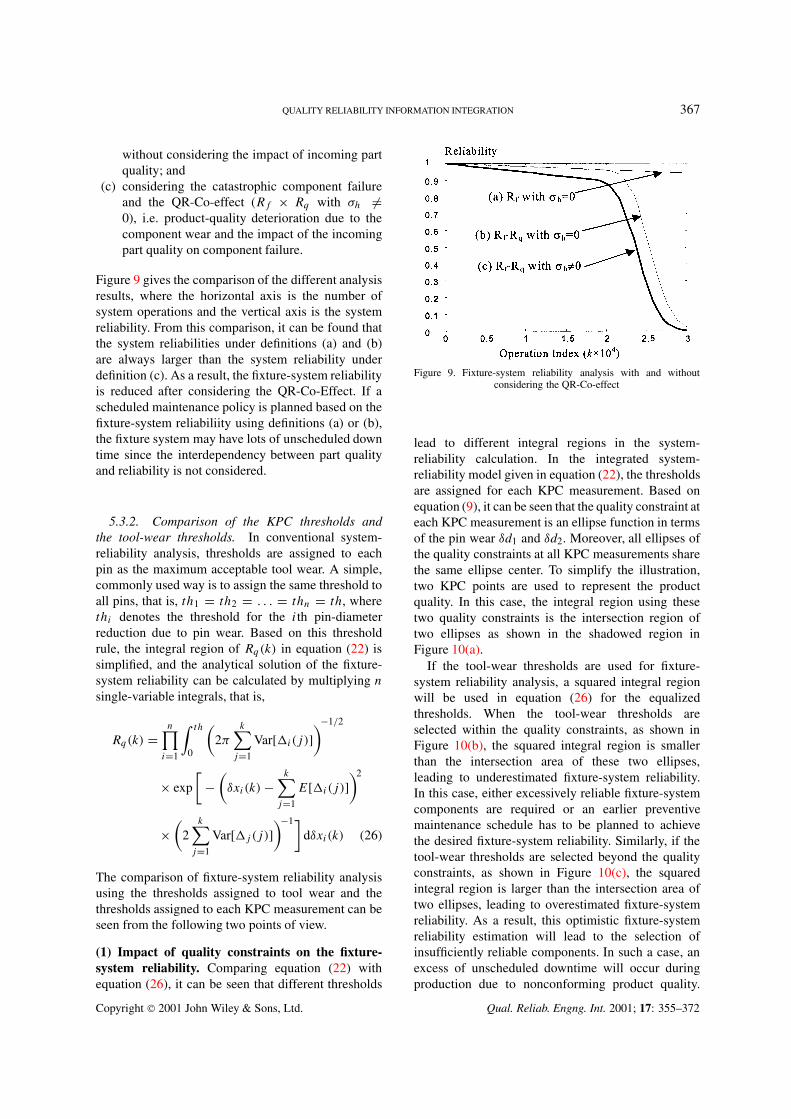
5.3.1. Fixture system-reliability analysis withand without considering the QR-Co-Effect. Thecomparison of the proposed integrated manufacturing-system reliability model with other conventionalsystem-reliability analysis methods is conductedbased on the following three different definitions ofsystem failures:
(a) only considering the catastrophic componentfailure (Rf with σh = 0);
(b) considering both the catastrophic componentfailure and product quality deterioration due tocomponent wear (Rf × Rq with σh = 0), but
Copyright 2001 John Wiley & Sons, Ltd. Qual. Reliab. Engng. Int. 2001; 17: 355–372
QUALITY RELIABILITY INFORMATION INTEGRATION 367
without considering the impact of incoming partquality; and
(c) considering the catastrophic component failureand the QR-Co-effect (Rf × Rq with σh �=0), i.e. product-quality deterioration due to thecomponent wear and the impact of the incomingpart quality on component failure.
Figure 9 gives the comparison of the different analysisresults, where the horizontal axis is the number ofsystem operations and the vertical axis is the systemreliability. From this comparison, it can be found thatthe system reliabilities under definitions (a) and (b)are always larger than the system reliability underdefinition (c). As a result, the fixture-system reliabilityis reduced after considering the QR-Co-Effect. If ascheduled maintenance policy is planned based on thefixture-system reliabiliity using definitions (a) or (b),the fixture system may have lots of unscheduled downtime since the interdependency between part qualityand reliability is not considered.
5.3.2. Comparison of the KPC thresholds andthe tool-wear thresholds. In conventional system-reliability analysis, thresholds are assigned to eachpin as the maximum acceptable tool wear. A simple,commonly used way is to assign the same threshold toall pins, that is, th1 = th2 = . . . = thn = th, wherethi denotes the threshold for the ith pin-diameterreduction due to pin wear. Based on this thresholdrule, the integral region of Rq(k) in equation (22) issimplified, and the analytical solution of the fixture-system reliability can be calculated by multiplying n
single-variable integrals, that is,
Rq(k) =n∏
i=1
∫ th
0
(2π
k∑j=1
Var[*i(j)])−1/2
× exp
[−(δxi(k) −
k∑j=1
E[*i(j)])2
×(
2k∑
j=1
Var[*j(j)])−1]
dδxi(k) (26)
The comparison of fixture-system reliability analysisusing the thresholds assigned to tool wear and thethresholds assigned to each KPC measurement can beseen from the following two points of view.
(1) Impact of quality constraints on the fixture-system reliability. Comparing equation (22) withequation (26), it can be seen that different thresholds
Figure 9. Fixture-system reliability analysis with and withoutconsidering the QR-Co-effect
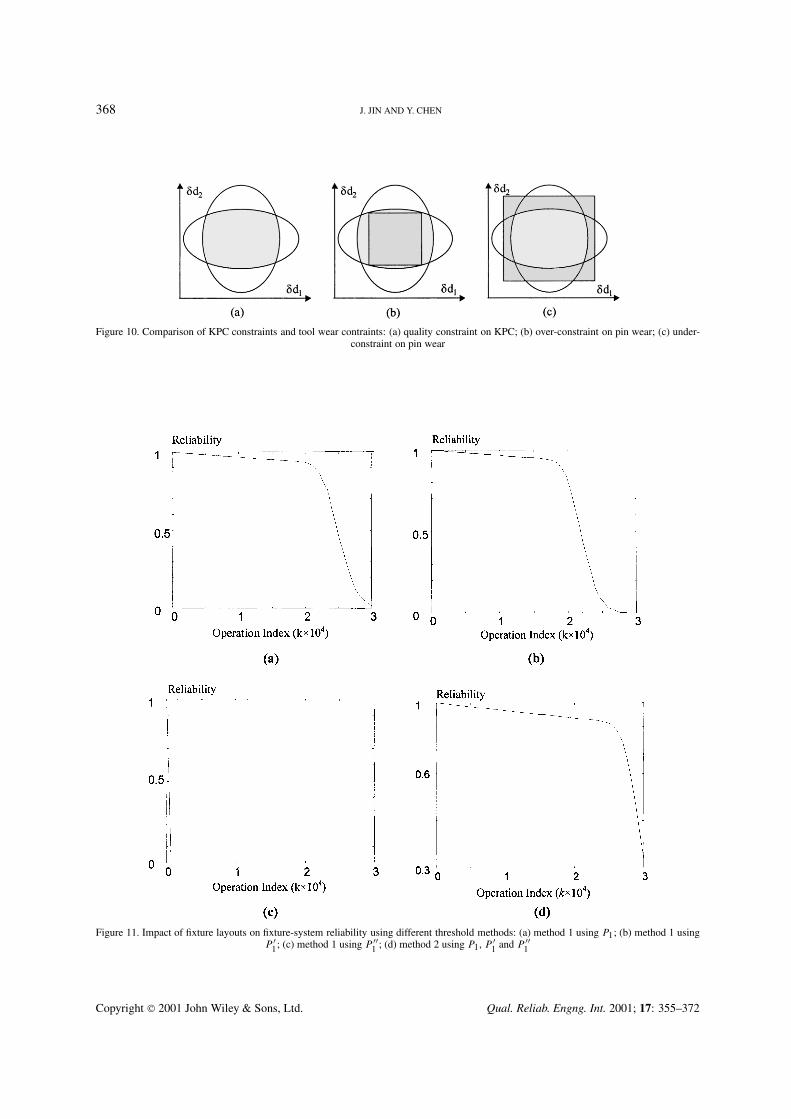
lead to different integral regions in the system-reliability calculation. In the integrated system-reliability model given in equation (22), the thresholdsare assigned for each KPC measurement. Based onequation (9), it can be seen that the quality constraint ateach KPC measurement is an ellipse function in termsof the pin wear δd1 and δd2. Moreover, all ellipses ofthe quality constraints at all KPC measurements sharethe same ellipse center. To simplify the illustration,two KPC points are used to represent the productquality. In this case, the integral region using thesetwo quality constraints is the intersection region oftwo ellipses as shown in the shadowed region inFigure 10(a).
If the tool-wear thresholds are used for fixture-system reliability analysis, a squared integral regionwill be used in equation (26) for the equalizedthresholds. When the tool-wear thresholds areselected within the quality constraints, as shown inFigure 10(b), the squared integral region is smallerthan the intersection area of these two ellipses,leading to underestimated fixture-system reliability.In this case, either excessively reliable fixture-systemcomponents are required or an earlier preventivemaintenance schedule has to be planned to achievethe desired fixture-system reliability. Similarly, if thetool-wear thresholds are selected beyond the qualityconstraints, as shown in Figure 10(c), the squaredintegral region is larger than the intersection area oftwo ellipses, leading to overestimated fixture-systemreliability. As a result, this optimistic fixture-systemreliability estimation will lead to the selection ofinsufficiently reliable components. In such a case, anexcess of unscheduled downtime will occur duringproduction due to nonconforming product quality.
Copyright 2001 John Wiley & Sons, Ltd. Qual. Reliab. Engng. Int. 2001; 17: 355–372
368 J. JIN AND Y. CHEN
Figure 10. Comparison of KPC constraints and tool wear contraints: (a) quality constraint on KPC; (b) over-constraint on pin wear; (c) under-constraint on pin wear
Figure 11. Impact of fixture layouts on fixture-system reliability using different threshold methods: (a) method 1 using P1; (b) method 1 usingP ′
1; (c) method 1 using P ′′1 ; (d) method 2 using P1, P ′
1 and P ′′1
Copyright 2001 John Wiley & Sons, Ltd. Qual. Reliab. Engng. Int. 2001; 17: 355–372
QUALITY RELIABILITY INFORMATION INTEGRATION 369
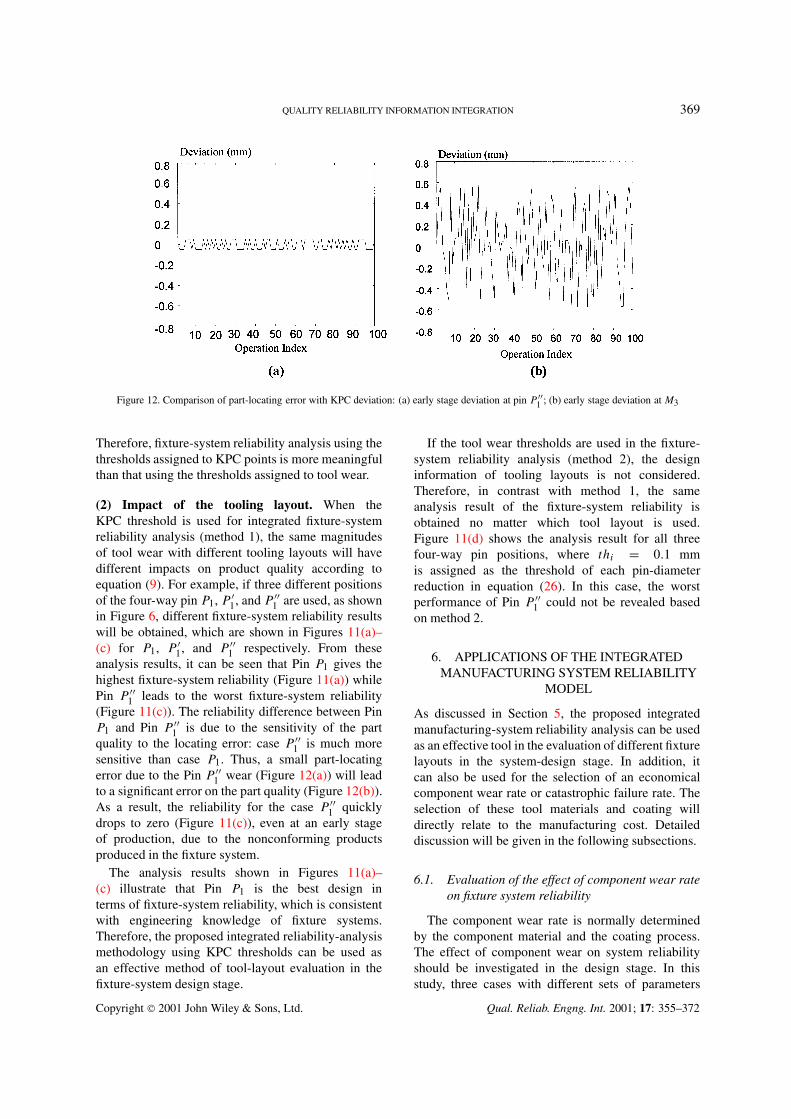
Figure 12. Comparison of part-locating error with KPC deviation: (a) early stage deviation at pin P ′′1 ; (b) early stage deviation at M3
Therefore, fixture-system reliability analysis using thethresholds assigned to KPC points is more meaningfulthan that using the thresholds assigned to tool wear.
(2) Impact of the tooling layout. When theKPC threshold is used for integrated fixture-systemreliability analysis (method 1), the same magnitudesof tool wear with different tooling layouts will havedifferent impacts on product quality according toequation (9). For example, if three different positionsof the four-way pin P1, P ′
1, and P ′′1 are used, as shown
in Figure 6, different fixture-system reliability resultswill be obtained, which are shown in Figures 11(a)–(c) for P1, P ′
1, and P ′′1 respectively. From these
analysis results, it can be seen that Pin P1 gives thehighest fixture-system reliability (Figure 11(a)) whilePin P ′′
1 leads to the worst fixture-system reliability(Figure 11(c)). The reliability difference between PinP1 and Pin P ′′
1 is due to the sensitivity of the partquality to the locating error: case P ′′
1 is much moresensitive than case P1. Thus, a small part-locatingerror due to the Pin P ′′
1 wear (Figure 12(a)) will leadto a significant error on the part quality (Figure 12(b)).As a result, the reliability for the case P ′′
1 quicklydrops to zero (Figure 11(c)), even at an early stageof production, due to the nonconforming productsproduced in the fixture system.
The analysis results shown in Figures 11(a)–(c) illustrate that Pin P1 is the best design interms of fixture-system reliability, which is consistentwith engineering knowledge of fixture systems.Therefore, the proposed integrated reliability-analysismethodology using KPC thresholds can be used asan effective method of tool-layout evaluation in thefixture-system design stage.
If the tool wear thresholds are used in the fixture-system reliability analysis (method 2), the designinformation of tooling layouts is not considered.Therefore, in contrast with method 1, the sameanalysis result of the fixture-system reliability isobtained no matter which tool layout is used.Figure 11(d) shows the analysis result for all threefour-way pin positions, where thi = 0.1 mmis assigned as the threshold of each pin-diameterreduction in equation (26). In this case, the worstperformance of Pin P ′′
1 could not be revealed basedon method 2.
6. APPLICATIONS OF THE INTEGRATEDMANUFACTURING SYSTEM RELIABILITY
MODEL
As discussed in Section 5, the proposed integratedmanufacturing-system reliability analysis can be usedas an effective tool in the evaluation of different fixturelayouts in the system-design stage. In addition, itcan also be used for the selection of an economicalcomponent wear rate or catastrophic failure rate. Theselection of these tool materials and coating willdirectly relate to the manufacturing cost. Detaileddiscussion will be given in the following subsections.
6.1. Evaluation of the effect of component wear rateon fixture system reliability
The component wear rate is normally determinedby the component material and the coating process.The effect of component wear on system reliabilityshould be investigated in the design stage. In thisstudy, three cases with different sets of parameters
Copyright 2001 John Wiley & Sons, Ltd. Qual. Reliab. Engng. Int. 2001; 17: 355–372
370 J. JIN AND Y. CHEN
Figure 13. Comparison of the aggregated wears under different wear parameters: (a) different pin-wear parameters; (b) aggregated pin wear
Figure 14. The effect of component wear rates on fixture-systemreliability
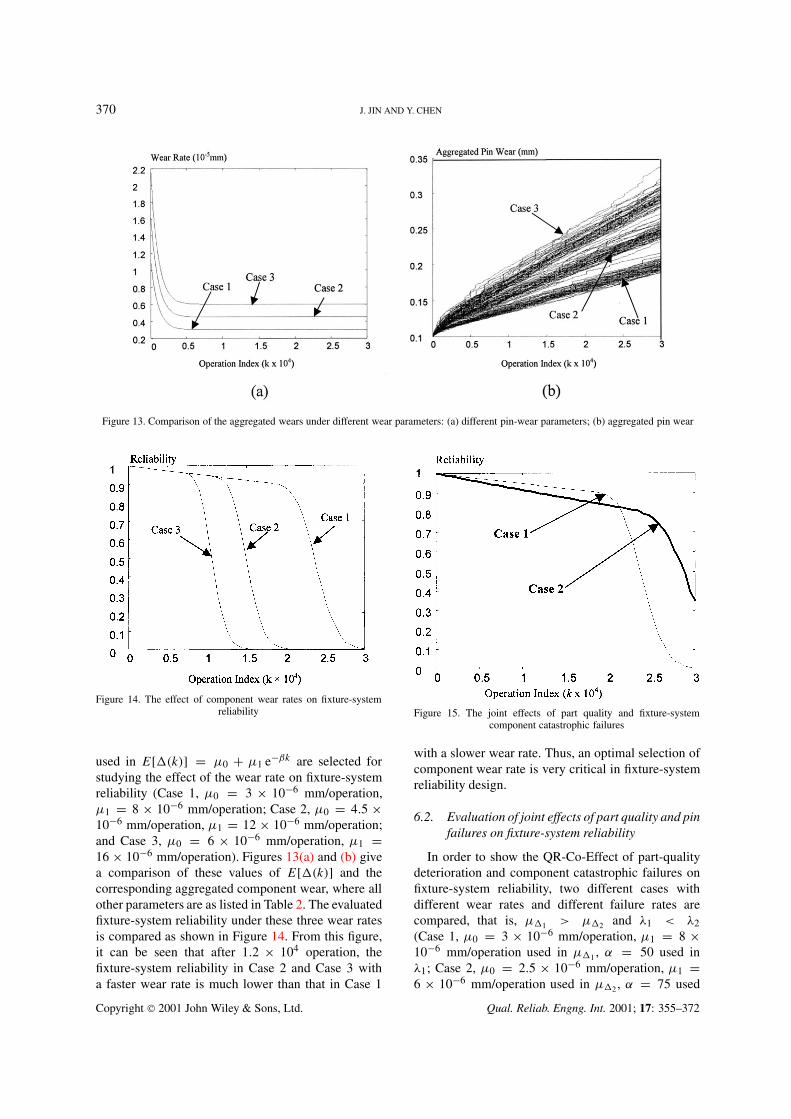
used in E[*(k)] = µ0 + µ1 e−βk are selected forstudying the effect of the wear rate on fixture-systemreliability (Case 1, µ0 = 3 × 10⁻⁶ mm/operation,µ1 = 8 × 10⁻⁶ mm/operation; Case 2, µ0 = 4.5 ×10⁻⁶ mm/operation, µ1 = 12 × 10−6 mm/operation;and Case 3, µ0 = 6 × 10⁻⁶ mm/operation, µ1 =16 × 10−6 mm/operation). Figures 13(a) and (b) givea comparison of these values of E[*(k)] and thecorresponding aggregated component wear, where allother parameters are as listed in Table 2. The evaluatedfixture-system reliability under these three wear ratesis compared as shown in Figure 14. From this figure,it can be seen that after 1.2 × 10⁴ operation, thefixture-system reliability in Case 2 and Case 3 witha faster wear rate is much lower than that in Case 1
Figure 15. The joint effects of part quality and fixture-systemcomponent catastrophic failures
with a slower wear rate. Thus, an optimal selection ofcomponent wear rate is very critical in fixture-systemreliability design.
6.2. Evaluation of joint effects of part quality and pinfailures on fixture-system reliability
In order to show the QR-Co-Effect of part-qualitydeterioration and component catastrophic failures onfixture-system reliability, two different cases withdifferent wear rates and different failure rates arecompared, that is, µ*1 > µ*2 and λ1 < λ2(Case 1, µ0 = 3 × 10⁻⁶ mm/operation, µ1 = 8 ×10⁻⁶ mm/operation used in µ*1 , α = 50 used inλ1; Case 2, µ0 = 2.5 × 10⁻⁶ mm/operation, µ1 =6 × 10⁻⁶ mm/operation used in µ*2 , α = 75 used
Copyright 2001 John Wiley & Sons, Ltd. Qual. Reliab. Engng. Int. 2001; 17: 355–372
QUALITY RELIABILITY INFORMATION INTEGRATION 371
in λ2). The fixture system reliabilities under these twodifferent sets of parameters are compared and shownin Figure 15. It can be seen that catastrophic failuresplay a major role in the fixture-system reliability atan early stage of production; thus Case 1 is morereliable than Case 2 before 21 000 operations becauseλ1 < λ2. However, as the fixture system degrades, tooldegradation becomes more dominant. As a result, thereliability of Case 1 is much smaller than that of Case 2after 22 000 operations because µ*1 > µ*2 .
7. CONCLUSIONS
In this paper, the interdependency between partquality and fixture-system reliability is investigated.As an example, fixture design and its reliabilityanalysis were studied by integrating information ofpin failure, pin wear and their interdependency withpart quality. The proposed integrated manufacturing-system reliability model is validated by usingMonte Carlo simulation results. The advantages andthe effectiveness of the proposed methodology areillustrated by comparing them with other conventionalreliability analysis methods. The comparison studyindicates that fixture-system reliability will bebiased if the QR-Co-Effect is not consideredin the analysis. In addition, the fixture-systemdesign change (e.g. tool-layout change), or itscomponent-reliability change (different catastrophic-failure probability or wear rate) will affect fixture-system reliability significantly. Therefore, based onthe proposed integrated fixture-system reliabilitymodel, a comprehensive analysis and system-leveloptimization could be conducted to achieve anoptimized manufacturing system—in terms of bothproduct quality and process productivity. The mainobjective of this paper is to provide an initial studyon how to effectively integrate and utilize the richinformation existing in manufacturing processes toimprove manufacturing-system reliability analysis.
It should be pointed out that as an example offixture-system reliability analysis used in the paper,the models used to represent the pin degradation andcatastrophic failures are of a provisional nature, andlack comprehensive experimental calibration. Effortswill be devoted in future to improving the accuracyof the developed models. However, the model usedto represent the relationship between pin wear andproduct quality has been validated and used in variousapplications in assembly process modeling [17] andassembly fixture diagnosis [13]. Furthermore, theconcepts and the framework of the proposed integratedreliability analysis model are generic and applicablefor many manufacturing processes.
ACKNOWLEDGEMENTS
In this research, Dr. J. Jin is partially supported bythe National Science Foundation (NSF) Grant: NSF-DMI 9713654; Mr. Y. Chen is supported by GeneralMotors Satellite Research Laboratory at the Universityof Michigan, Advanced Body Division.
REFERENCES
1. Elsayed AE. Reliability Engineering. Addison WesleyLongman: Reading, MA, 1996.
2. Meeker W, Escobar L. Statistical Methods for ReliabilityData. Wiley: New York, 1998.
3. Conard C, McClamroch NH. The drilling problem: astochastic modeling and control example in manufacturing.IEEE Transaction on Automatic Control 1987; AC32:947–958.
4. Galante G, Lombardo A, Passannanti A. Tool-life modeling asa stochastic process. International Journal of Machine Tools& Manufacture 1998; 38:1361–1369.
5. ABC. Variation reduction for automotive body assembly.Annual Report for Advanced Technology Program (NIST),Autobody Consortium (ABC) and University of Michigan,Ann Arbor, MI, 1993.
6. Takezawa N. An improved method for establishing theprocess-wise quality standard. Reports of Statistical Applica-tion Research JUSE 1980; 27(3):63–75.
7. Shiu B, Ceglarek D, Shi J. Multi-station sheet metal assemblymodeling and diagnostics. NAMRI/SME Transactions 1996;23:199–204.
8. Ceglarek D, Shi J. Dimensional variation reduction for auto-motive body assembly manufacturing. Journal of Manufactur-ing Review 1995; 8:139–154.
9. Lesanovsky A. Multistate Markov models for systems withdependent units. IEEE Transactions on Reliability 1988;37:505–511.
10. Hunt A, Kelly BE, Mullhi JS, Lees FP, Rushton AG. Thepropagation of faults in process palnts: 6, Overview of, andmodeling for, fault tree synthesis. Reliability Engineering andSystem Safety 1993; 39:173–194.
11. Perman M, Senegacnik A, Tuma M. Semi-Markov modelswith an application to power-plant reliability analysis. IEEETransactions on Reliability 1997; 46:526–532.
12. Sianipar PRM, Adams TM. Fault-tree model of bridge elementdeterioration due to interaction. Journal of InfrastructureSystem 1997; 3:103–110.
13. Apley D, Shi J. Diagnosis of multiple fixture faults for panelassembly. ASME Transactions, Journal of ManufacturingScience and Technology 1998; 120:793–801.
14. Archard JF. Contact and rubbing of flat surfaces. Journal ofApplied Physics 1953; 24:981–988.
15. Wallbridge NC, Dowson D. Distribution of wear rate dataand statistical approach to sliding wear theory. Wear 1987;119:295–312.
16. Tang LC, Goh CJ, Lim SC. On the reliability of componentssubject to sliding wear—a first report. Sliding Wear 1988;22(8):1177–1181.
17. Jin J, Shi J. State space modeling of sheet metal assemblyfor dimensional control. ASME Transactions, Journal ofManufacturing Science and Engineering 1999; 121(4):756–762.
Authors’ biographies:
Yong Chen received the BE degree in computer scienceand technology from Tsinghua University, Beijing, China,
Copyright 2001 John Wiley & Sons, Ltd. Qual. Reliab. Engng. Int. 2001; 17: 355–372
372 J. JIN AND Y. CHEN
in 1998. He is currently a PhD candidate in theDepartment of Industrial and Operations Engineering,University of Michigan, Ann Arbor. His research interestsinclude multistage manufacturing system modeling, systemreliability analysis and maintenance decision making. He isa member of ASQ, INFORMS-QSR and IEEE.
Jionghua (Judy) Jin received her BS and MS degrees inMechanical Engineering, both from Southeast University
in 1994 and 1997, and her PhD degree in IndustrialEngineering at the University of Michigan in 1999. Sheis currently an assistant professor in the Department ofSystems and Industrial Engineering at the University ofArizona. Her research interests focus on developing newmethodologies for quality and productivity improvementin manufacturing processes by using applied statistics,wavelets, system-reliability modeling and maintenancedecision. She is a member of ASME, INFORMS, IIE andSME.
Copyright 2001 John Wiley & Sons, Ltd. Qual. Reliab. Engng. Int. 2001; 17: 355–372